gome and sciamachy global aw ter vapour …€¦ · gome and sciamachy global aw ter vapour columns...
TRANSCRIPT

GOME AND SCIAMACHY GLOBAL WATER VAPOUR COLUMNS
Stefan Noel, Sebastian Mieruch, Michael Buchwitz, Heinrich Bovensmann, and John P. Burrows
Institute of Environmental Physics, University of Bremen,FB 1, P. O. Box 330440, D-28334 Bremen, Germany
ABSTRACT
Global water vapour total column amounts have been derived from measurements of the Global Ozone Monitoring Exper-iment (GOME) on ERS-2 and the SCanning Imaging Absorption spectroMeter for Atmospheric CHartographY (SCIA-MACHY) on-board the European environmental satellite ENVISAT. For this purpose, the Air Mass Corrected DifferentialOptical Absorption Spectroscopy (AMC-DOAS) approach has been applied to GOME and SCIAMACHY nadir measure-ments in the spectral region around 700 nm.
A possible combination of the GOME and SCIAMACHY data would be the first step to a new long-term water vapourclimatology as the combined GOME and SCIAMACHY time series covers already now more than 10 years. A further ex-tension by future SCIAMACHY data and additional measurements from the GOME-2 instruments on the Metop satellitescan be expected.
In this paper a first intercomparison between GOME and SCIAMACHY AMC-DOAS water vapour columns is presentedwhich supports that a combination of GOME and SCIAMACHY water vapour data is possible.
As an example for a first climatological application, the combined GOME/SCIAMACHY data set is then used to derivepreliminary water vapour trends over Europe within the lastdecade. Although the significance of the derived smallpositive trend is currently unclear, the results are supported by a good correlation between water vapour anomalies andcorresponding surface temperature data.
1. INTRODUCTION
Several previous investigations have shown that measurements of the Global Ozone Monitoring Experiment (GOME, seee.g. [1]) on ERS-2 and the SCanning Imaging Absorption spectroMeter for Atmospheric CHartographY (SCIAMACHY,see e.g. [2]) on ENVISAT in the visible spectral region can beused to derive global water vapour concentrations (see e.g.[3, 4, 5, 6, 7, 8, 9, 10]).
One of the retrieval methods used in this context is the so-called ‘Air Mass Corrected Differential Optical AbsorptionSpectroscopy’ (AMC-DOAS) method which has been applied to GOME and SCIAMACHY nadir measurements in thespectral region at about 700 nm (see [3, 4] for details). The AMC-DOAS method does not rely on additional externalinformation, like radio sonde data. The derived water vapour columns therefore provide a completely independent dataset.
GOME and SCIAMACHY water vapour total column data are available over both ocean and land, but only measurementson the day side and under (almost) cloud free conditions can be used. The GOME and SCIAMACHY results do not relyon any other measurement data, e.g. calibration factors derived from radio sonde data. The combination of GOME andSCIAMACHY data currently covers a time span of over 10 years which may extend even further, depending on the lifetime of SCIAMACHY. In addition, the GOME-2 instruments on the series of operational meteorological satellites Metop(the first one to be launched 2006) will extend this data set. Therefore, a combination of the results for these GOME-typeinstruments can lead to an additional, completely independent global water vapour data set suitable for climatologicalstudies.
This paper presents a first intercomparison between GOME andSCIAMACHY water vapour data retrieved using theAMC-DOAS method. Furthermore, as an example for an application of the combined GOME/SCIAMACHY data set,preliminary water vapour trends over Europe within the lastdecade are estimated.
2. THE GOME AND SCIAMACHY GLOBAL WATER VAPOUR DATA SET
Currently, water vapour data have been derived using the AMC-DOAS method based on the complete GOME Level 1data set from June 1995 until December 2004. Due to an on-board tape recorder failure GOME can not provide anylonger global measurements data after June 2003. Since thistime the GOME coverage is typically limited to the NorthernAtlantic region.
ENVISAT has been launched in March 2002, and SCIAMACHY provides regular measurement data since August 2002,although final flight settings have been achieved in December2003 for the first time. The AMC-DOAS water vapour
______________________________________________________ Proc. of the First ‘Atmospheric Science Conference’, ESRIN, Frascati, Italy 8 – 12 May 2006 (ESA SP-628, July 2006)
SCIAMACHY and GOME AMC-DOAS H2O Columns 27 Jan 2003
-30 -25 -20 -15 -10 -5 0 5 10 15 20 25 30Longitude, deg
30
36
42
48
53
59
65
Latit
ude,
deg
0 2 4 6 8 10
H2O Vertical Column Amount, g/cm2
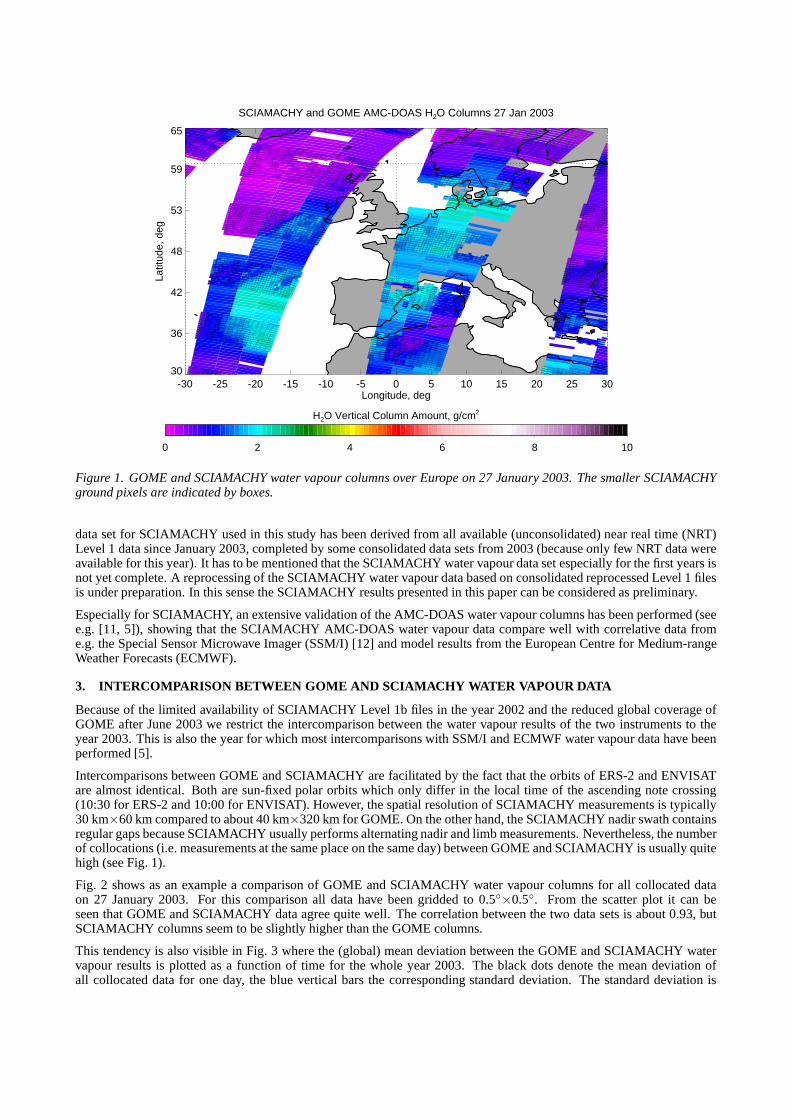
Figure 1. GOME and SCIAMACHY water vapour columns over Europe on 27 January 2003. The smaller SCIAMACHYground pixels are indicated by boxes.
data set for SCIAMACHY used in this study has been derived from all available (unconsolidated) near real time (NRT)Level 1 data since January 2003, completed by some consolidated data sets from 2003 (because only few NRT data wereavailable for this year). It has to be mentioned that the SCIAMACHY water vapour data set especially for the first years isnot yet complete. A reprocessing of the SCIAMACHY water vapour data based on consolidated reprocessed Level 1 filesis under preparation. In this sense the SCIAMACHY results presented in this paper can be considered as preliminary.
Especially for SCIAMACHY, an extensive validation of the AMC-DOAS water vapour columns has been performed (seee.g. [11, 5]), showing that the SCIAMACHY AMC-DOAS water vapour data compare well with correlative data frome.g. the Special Sensor Microwave Imager (SSM/I) [12] and model results from the European Centre for Medium-rangeWeather Forecasts (ECMWF).
3. INTERCOMPARISON BETWEEN GOME AND SCIAMACHY WATER VAPOUR DATA
Because of the limited availability of SCIAMACHY Level 1b files in the year 2002 and the reduced global coverage ofGOME after June 2003 we restrict the intercomparison between the water vapour results of the two instruments to theyear 2003. This is also the year for which most intercomparisons with SSM/I and ECMWF water vapour data have beenperformed [5].
Intercomparisons between GOME and SCIAMACHY are facilitated by the fact that the orbits of ERS-2 and ENVISATare almost identical. Both are sun-fixed polar orbits which only differ in the local time of the ascending note crossing(10:30 for ERS-2 and 10:00 for ENVISAT). However, the spatial resolution of SCIAMACHY measurements is typically30 km×60 km compared to about 40 km×320 km for GOME. On the other hand, the SCIAMACHY nadir swath containsregular gaps because SCIAMACHY usually performs alternating nadir and limb measurements. Nevertheless, the numberof collocations (i.e. measurements at the same place on the same day) between GOME and SCIAMACHY is usually quitehigh (see Fig. 1).
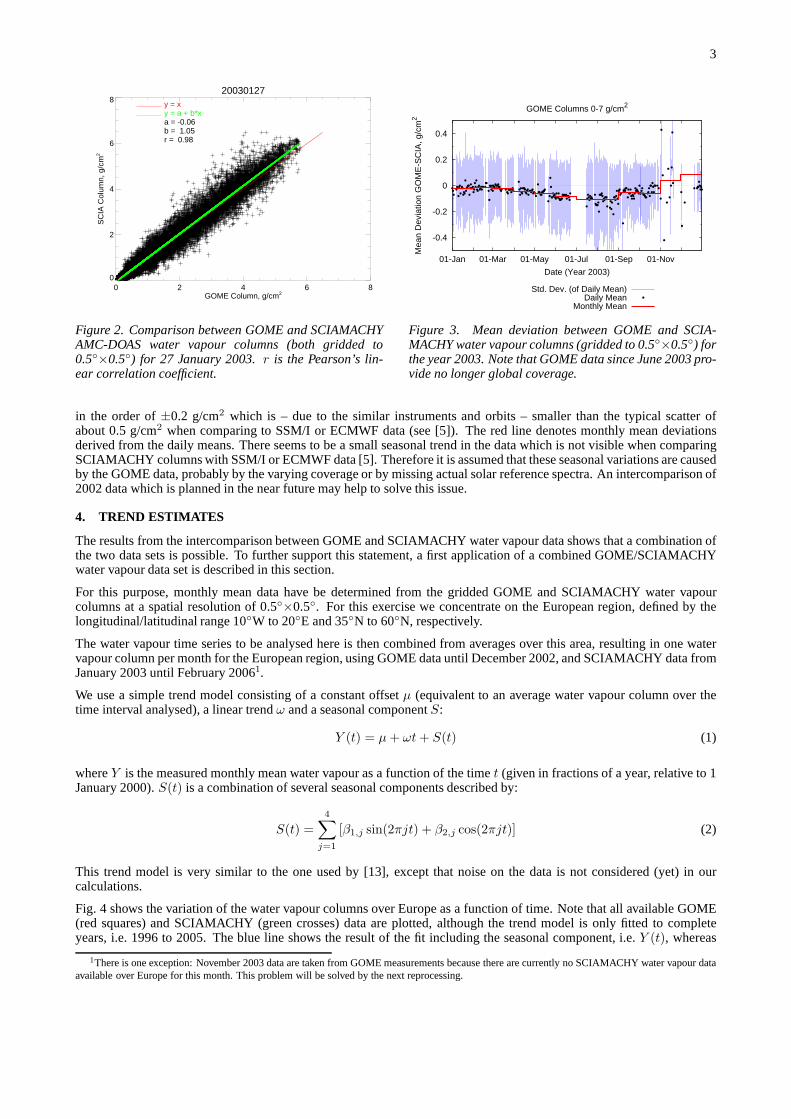
Fig. 2 shows as an example a comparison of GOME and SCIAMACHY water vapour columns for all collocated dataon 27 January 2003. For this comparison all data have been gridded to 0.5◦×0.5◦. From the scatter plot it can beseen that GOME and SCIAMACHY data agree quite well. The correlation between the two data sets is about 0.93, butSCIAMACHY columns seem to be slightly higher than the GOME columns.
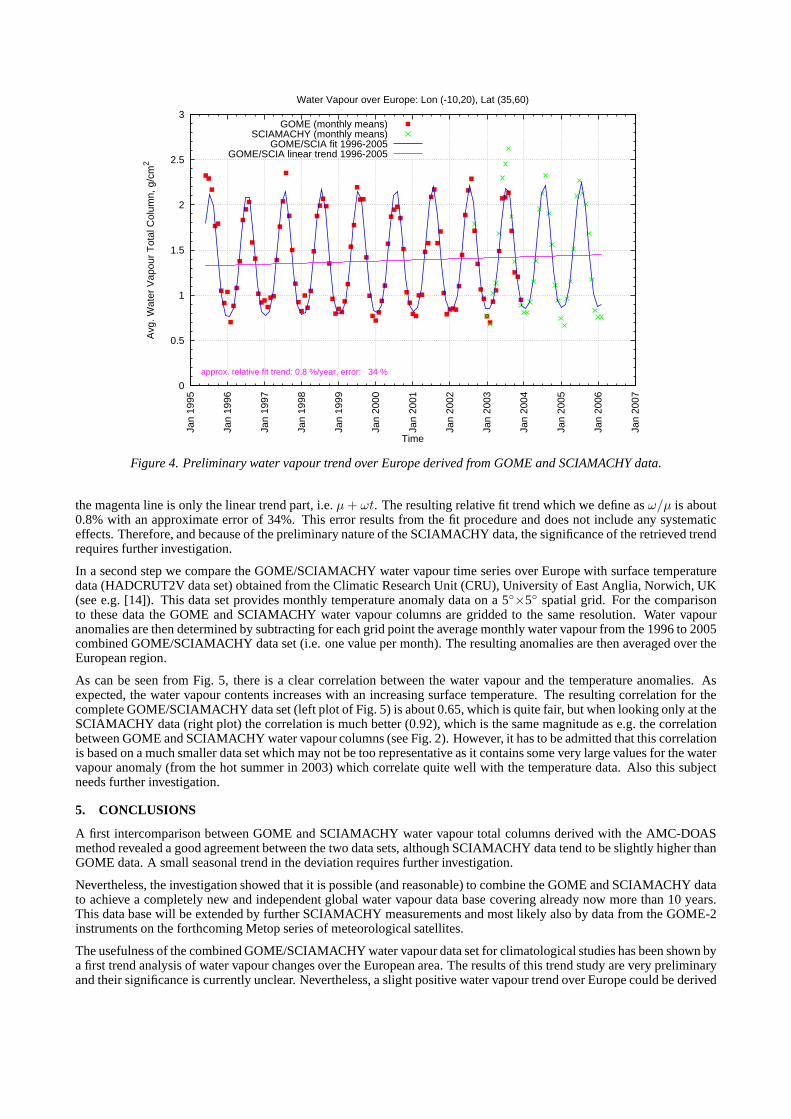
This tendency is also visible in Fig. 3 where the (global) mean deviation between the GOME and SCIAMACHY watervapour results is plotted as a function of time for the whole year 2003. The black dots denote the mean deviation ofall collocated data for one day, the blue vertical bars the corresponding standard deviation. The standard deviation is
3
20030127
0 2 4 6 8GOME Column, g/cm2
0
2
4
6
8S
CIA
Col
umn,
g/c
m2
y = xy = a + b*xa = -0.06b = 1.05r = 0.98
Figure 2. Comparison between GOME and SCIAMACHYAMC-DOAS water vapour columns (both gridded to0.5◦×0.5◦) for 27 January 2003.r is the Pearson’s lin-ear correlation coefficient.
-0.4
-0.2
0
0.2
0.4
01-Nov01-Sep01-Jul01-May01-Mar01-Jan
Mea
n D
evia
tion
GO
ME
-SC
IA, g
/cm
2
Date (Year 2003)
GOME Columns 0-7 g/cm2
Std. Dev. (of Daily Mean)Daily Mean
Monthly Mean
Figure 3. Mean deviation between GOME and SCIA-MACHY water vapour columns (gridded to 0.5◦
×0.5◦) forthe year 2003. Note that GOME data since June 2003 pro-vide no longer global coverage.
in the order of±0.2 g/cm2 which is – due to the similar instruments and orbits – smallerthan the typical scatter ofabout 0.5 g/cm2 when comparing to SSM/I or ECMWF data (see [5]). The red line denotes monthly mean deviationsderived from the daily means. There seems to be a small seasonal trend in the data which is not visible when comparingSCIAMACHY columns with SSM/I or ECMWF data [5]. Therefore itis assumed that these seasonal variations are causedby the GOME data, probably by the varying coverage or by missing actual solar reference spectra. An intercomparison of2002 data which is planned in the near future may help to solvethis issue.
4. TREND ESTIMATES
The results from the intercomparison between GOME and SCIAMACHY water vapour data shows that a combination ofthe two data sets is possible. To further support this statement, a first application of a combined GOME/SCIAMACHYwater vapour data set is described in this section.
For this purpose, monthly mean data have be determined from the gridded GOME and SCIAMACHY water vapourcolumns at a spatial resolution of 0.5◦
×0.5◦. For this exercise we concentrate on the European region, defined by thelongitudinal/latitudinal range 10◦W to 20◦E and 35◦N to 60◦N, respectively.
The water vapour time series to be analysed here is then combined from averages over this area, resulting in one watervapour column per month for the European region, using GOME data until December 2002, and SCIAMACHY data fromJanuary 2003 until February 20061.
We use a simple trend model consisting of a constant offsetµ (equivalent to an average water vapour column over thetime interval analysed), a linear trendω and a seasonal componentS:
Y (t) = µ + ωt + S(t) (1)
whereY is the measured monthly mean water vapour as a function of thetime t (given in fractions of a year, relative to 1January 2000).S(t) is a combination of several seasonal components described by:
S(t) =4∑
j=1
[β1,j sin(2πjt) + β2,j cos(2πjt)] (2)
This trend model is very similar to the one used by [13], except that noise on the data is not considered (yet) in ourcalculations.
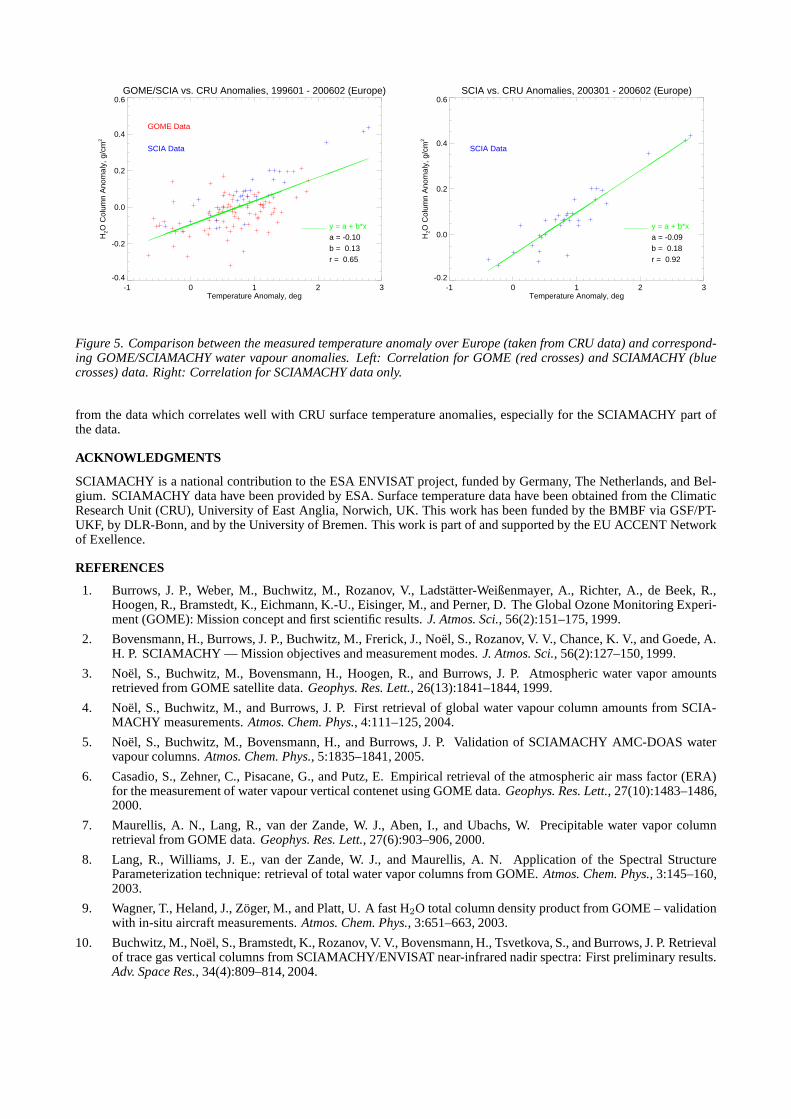
Fig. 4 shows the variation of the water vapour columns over Europe as a function of time. Note that all available GOME(red squares) and SCIAMACHY (green crosses) data are plotted, although the trend model is only fitted to completeyears, i.e. 1996 to 2005. The blue line shows the result of thefit including the seasonal component, i.e.Y (t), whereas
1There is one exception: November 2003 data are taken from GOME measurements because there are currently no SCIAMACHY water vapour dataavailable over Europe for this month. This problem will be solved by the next reprocessing.
0
0.5
1
1.5
2
2.5
3
Jan
1995
Jan
1996
Jan
1997
Jan
1998
Jan
1999
Jan
2000
Jan
2001
Jan
2002
Jan
2003
Jan
2004
Jan
2005
Jan
2006
Jan
2007
Avg
. Wat
er V
apou
r T
otal
Col
umn,
g/c
m2
Time
Water Vapour over Europe: Lon (-10,20), Lat (35,60)
approx. relative fit trend: 0.8 %/year, error: 34 %
GOME (monthly means)SCIAMACHY (monthly means)
GOME/SCIA fit 1996-2005GOME/SCIA linear trend 1996-2005
Figure 4. Preliminary water vapour trend over Europe derived from GOME and SCIAMACHY data.
the magenta line is only the linear trend part, i.e.µ + ωt. The resulting relative fit trend which we define asω/µ is about0.8% with an approximate error of 34%. This error results from the fit procedure and does not include any systematiceffects. Therefore, and because of the preliminary nature of the SCIAMACHY data, the significance of the retrieved trendrequires further investigation.
In a second step we compare the GOME/SCIAMACHY water vapour time series over Europe with surface temperaturedata (HADCRUT2V data set) obtained from the Climatic Research Unit (CRU), University of East Anglia, Norwich, UK(see e.g. [14]). This data set provides monthly temperatureanomaly data on a 5◦×5◦ spatial grid. For the comparisonto these data the GOME and SCIAMACHY water vapour columns aregridded to the same resolution. Water vapouranomalies are then determined by subtracting for each grid point the average monthly water vapour from the 1996 to 2005combined GOME/SCIAMACHY data set (i.e. one value per month). The resulting anomalies are then averaged over theEuropean region.
As can be seen from Fig. 5, there is a clear correlation between the water vapour and the temperature anomalies. Asexpected, the water vapour contents increases with an increasing surface temperature. The resulting correlation for thecomplete GOME/SCIAMACHY data set (left plot of Fig. 5) is about 0.65, which is quite fair, but when looking only at theSCIAMACHY data (right plot) the correlation is much better (0.92), which is the same magnitude as e.g. the correlationbetween GOME and SCIAMACHY water vapour columns (see Fig. 2). However, it has to be admitted that this correlationis based on a much smaller data set which may not be too representative as it contains some very large values for the watervapour anomaly (from the hot summer in 2003) which correlatequite well with the temperature data. Also this subjectneeds further investigation.
5. CONCLUSIONS
A first intercomparison between GOME and SCIAMACHY water vapour total columns derived with the AMC-DOASmethod revealed a good agreement between the two data sets, although SCIAMACHY data tend to be slightly higher thanGOME data. A small seasonal trend in the deviation requires further investigation.
Nevertheless, the investigation showed that it is possible(and reasonable) to combine the GOME and SCIAMACHY datato achieve a completely new and independent global water vapour data base covering already now more than 10 years.This data base will be extended by further SCIAMACHY measurements and most likely also by data from the GOME-2instruments on the forthcoming Metop series of meteorological satellites.
The usefulness of the combined GOME/SCIAMACHY water vapourdata set for climatological studies has been shown bya first trend analysis of water vapour changes over the European area. The results of this trend study are very preliminaryand their significance is currently unclear. Nevertheless,a slight positive water vapour trend over Europe could be derived
GOME/SCIA vs. CRU Anomalies, 199601 - 200602 (Europe)
-1 0 1 2 3Temperature Anomaly, deg
-0.4
-0.2
0.0
0.2
0.4
0.6H
2O C
olum
n A
nom
aly,
g/c
m2
GOME Data
SCIA Data
y = a + b*xa = -0.10b = 0.13r = 0.65
SCIA vs. CRU Anomalies, 200301 - 200602 (Europe)
-1 0 1 2 3Temperature Anomaly, deg
-0.2
0.0
0.2
0.4
0.6
H2O
Col
umn
Ano
mal
y, g
/cm
2
SCIA Data
y = a + b*xa = -0.09b = 0.18r = 0.92
Figure 5. Comparison between the measured temperature anomaly over Europe (taken from CRU data) and correspond-ing GOME/SCIAMACHY water vapour anomalies. Left: Correlation for GOME (red crosses) and SCIAMACHY (bluecrosses) data. Right: Correlation for SCIAMACHY data only.
from the data which correlates well with CRU surface temperature anomalies, especially for the SCIAMACHY part ofthe data.
ACKNOWLEDGMENTS
SCIAMACHY is a national contribution to the ESA ENVISAT project, funded by Germany, The Netherlands, and Bel-gium. SCIAMACHY data have been provided by ESA. Surface temperature data have been obtained from the ClimaticResearch Unit (CRU), University of East Anglia, Norwich, UK. This work has been funded by the BMBF via GSF/PT-UKF, by DLR-Bonn, and by the University of Bremen. This work is part of and supported by the EU ACCENT Networkof Exellence.
REFERENCES
1. Burrows, J. P., Weber, M., Buchwitz, M., Rozanov, V., Ladstatter-Weißenmayer, A., Richter, A., de Beek, R.,Hoogen, R., Bramstedt, K., Eichmann, K.-U., Eisinger, M., and Perner, D. The Global Ozone Monitoring Experi-ment (GOME): Mission concept and first scientific results.J. Atmos. Sci., 56(2):151–175, 1999.
2. Bovensmann, H., Burrows, J. P., Buchwitz, M., Frerick, J., Noel, S., Rozanov, V. V., Chance, K. V., and Goede, A.H. P. SCIAMACHY — Mission objectives and measurement modes.J. Atmos. Sci., 56(2):127–150, 1999.
3. Noel, S., Buchwitz, M., Bovensmann, H., Hoogen, R., and Burrows, J. P. Atmospheric water vapor amountsretrieved from GOME satellite data.Geophys. Res. Lett., 26(13):1841–1844, 1999.
4. Noel, S., Buchwitz, M., and Burrows, J. P. First retrieval of global water vapour column amounts from SCIA-MACHY measurements.Atmos. Chem. Phys., 4:111–125, 2004.
5. Noel, S., Buchwitz, M., Bovensmann, H., and Burrows, J. P. Validation of SCIAMACHY AMC-DOAS watervapour columns.Atmos. Chem. Phys., 5:1835–1841, 2005.
6. Casadio, S., Zehner, C., Pisacane, G., and Putz, E. Empirical retrieval of the atmospheric air mass factor (ERA)for the measurement of water vapour vertical contenet usingGOME data.Geophys. Res. Lett., 27(10):1483–1486,2000.
7. Maurellis, A. N., Lang, R., van der Zande, W. J., Aben, I., and Ubachs, W. Precipitable water vapor columnretrieval from GOME data.Geophys. Res. Lett., 27(6):903–906, 2000.
8. Lang, R., Williams, J. E., van der Zande, W. J., and Maurellis, A. N. Application of the Spectral StructureParameterization technique: retrieval of total water vapor columns from GOME.Atmos. Chem. Phys., 3:145–160,2003.
9. Wagner, T., Heland, J., Zoger, M., and Platt, U. A fast H2O total column density product from GOME – validationwith in-situ aircraft measurements.Atmos. Chem. Phys., 3:651–663, 2003.
10. Buchwitz, M., Noel, S., Bramstedt, K., Rozanov, V. V., Bovensmann, H., Tsvetkova, S., and Burrows, J. P. Retrievalof trace gas vertical columns from SCIAMACHY/ENVISAT near-infrared nadir spectra: First preliminary results.Adv. Space Res., 34(4):809–814, 2004.

11. Timmermans, R. M. A., Lang, R., Noel, S., Kois, B., and Kyro, E. SCIAMACHY H2O column validation by theAtmospheric Chemistry Validation Team. InProc. Second Workshop on the Atmospheric Chemistry Validation ofENVISAT (ACVE-2), Frascati, Italy, 3–7 May, 2004, ESA SP-562, 2004.
12. Bauer, P. and Schluessel, P. Rainfall, total water, ice water, and water vapor over sea from polarized microwavesimulations and Special Sensor Microwave/Imager data.J. Geophys. Res., 98(D11):20737–20759, 1993.
13. Weatherhead, E. C., Reinsel, G. C., Tiao, G. C., Meng, X.-L., Choi, D., Cheang, W.-K., Keller, T., DeLuisi, J.,Wuebbles, D. J., Kerr, J. B., Miller, A. J., Oltmans, S. J., and Frederick, J. E. Factors affecting the detectionof trends: Statistical considerations and applications toenvironmental data.J. Geophys. Res., 103(D14):17149–17161, 1998.
14. Jones, P. D. and Moberg, A. Hemispheric and large-scale surface air temperature variations: An extensive revisionand an update to 2001.J. Climate, 16:206–223, 2003.