gonzo/papers/smith-etal-2014.pdfaddress a critical constraint to including the drm in hrs and...
TRANSCRIPT

1 23
Journal of Population Ageing ISSN 1874-7884Volume 7Number 1 Population Ageing (2014) 7:55-79DOI 10.1007/s12062-014-9093-8
Snapshots of Mixtures of AffectiveExperiences in a Day: Findings from theHealth and Retirement Study
Jacqui Smith, Lindsay H. Ryan, TaraL. Queen, Sandra Becker & RichardGonzalez

1 23
Your article is protected by copyright and all
rights are held exclusively by Springer Science
+Business Media Dordrecht. This e-offprint
is for personal use only and shall not be self-
archived in electronic repositories. If you wish
to self-archive your article, please use the
accepted manuscript version for posting on
your own website. You may further deposit
the accepted manuscript version in any
repository, provided it is only made publicly
available 12 months after official publication
or later and provided acknowledgement is
given to the original source of publication
and a link is inserted to the published article
on Springer's website. The link must be
accompanied by the following text: "The final
publication is available at link.springer.com”.

Snapshots of Mixtures of Affective Experiencesin a Day: Findings from the Health and Retirement Study
Jacqui Smith & Lindsay H. Ryan & Tara L. Queen &
Sandra Becker & Richard Gonzalez
Received: 20 May 2013 /Accepted: 9 January 2014 /Published online: 31 January 2014# Springer Science+Business Media Dordrecht 2014
Abstract In 2009, a representative subsample of participants in the Health and RetirementStudy (HRS: N=5333; Age 50–101) responded to a short day reconstruction self-administered questionnaire that asked about their time and experiences on seven activitiesthe previous day.We evaluate the quality and reliability of responses to this 10-min measureof experienced well-being and compare the properties and correlates of three intensity-basedcomposites reflecting mixtures of activity-linked affective experiences (Activity-PositiveAffect, Activity-Negative Affect, and Net Affect), and a frequency-based index, ActivityAffective Complexity, that summarizes the proportion of activities that include a mixture ofpositive and negative affective experiences regardless of intensity. On average, older adultsreported that 36 % of the activities in their day provided some mixture of feelings (e.g.,interested and frustrated). Regression models revealed differential associations for the fourconstructs of affective well-being with socio-demographic factors, physical and mentalhealth, and proximal indicators of the day’s context. We conclude that the HRS short dayreconstruction measure is reliable and discuss the conceptual issues in assessing, summa-rizing, and interpreting the complexity of emotional experience in older adults.
Keywords Experienced well-being . Subjective well-being . DRM . Health andRetirement Study. Older adults
Introduction
Happiness is not achieved by the conscious pursuit of happiness; it is generallythe by-product of other activities. Aldous Huxley
The number of hours in a day to fill with activities is constant throughout life butfactors such as age, gender, social status, employment, health, and individual
Population Ageing (2014) 7:55–79DOI 10.1007/s12062-014-9093-8
J. Smith (*) : L. H. Ryan : T. L. Queen : S. Becker : R. GonzalezInstitute for Social Research, University of Michigan, 426 Thompson Street, Ann Arbor, MI 48104, USAe-mail: [email protected]
Author's personal copy

characteristics (e.g., personality and preferences) influence how time is used. It is well-known that people’s feelings about the activities that fill their time are importantimmediate and long-term predictors of behavior and health. Affective experienceslinked to activities guide decisions about future engagement and invested effort,although decisions may not always prove to be optimal or accurate (Kahneman 2011;Loewenstein et al. 2005; Wilson and Gilbert 2005). Much research focuses on thetangible benefits (e.g., income, wealth, productivity, health) derived from the timeinvested in particular activities, such as education, work, physical exercise, and theimpact of public policy on time investment budgets (e.g., Juster and Stafford 1985;Powell et al. 2011; Robinson and Godbey 1997; Ver Ploeg et al. 2000). There iscurrently a renewed cross-disciplinary interest in understanding the relation betweentime use and less tangible outcomes, in particular subjective well-being (Kahnemanet al. 2004; Krueger et al. 2009a; Stiglitz et al. 2009).
Subjective well-being is uniquely associated with valued outcomes such as healthylongevity, immune functioning, and productivity (Diener and Chan 2011; Chida andSteptoe 2008; Pressman and Cohen 2005). Following seminal early research byBradburn (1969), Campbell et al. (1976), and Andrews and Withey (1976), many largesurveys collect global evaluations of life satisfaction and domain satisfaction.Kahneman et al. (2004) and Krueger et al. (2009a) now advocate the importance ofcollecting multiple indicators of subjective well-being and propose that surveys includeboth the traditional evaluations of life satisfaction together with “on-line” measures ofaffective experiences linked to daily activities. Kahneman et al. (2004) developedand tested the Day Reconstruction Method (DRM), or time diary of yesterday’sactivities, in which each respondent recalls the chronology of his or her activitiesin the previous 24-h. This method adapts the assessments of time use in nationaland international population surveys (Belli et al. 2009; Juster et al. 2003;Robinson and Godbey 1997).
We introduce and evaluate a short day reconstruction measure piloted in theHealth and Retirement Study (HRS) in 2009. This measure was developed toaddress a critical constraint to including the DRM in HRS and similar largemultidisciplinary longitudinal studies of older adults, namely its length (reportedto take from 30 to 75 min). The 10-min HRS measure retains a limited set ofthe original DRM features but it is nevertheless designed to provide importantinformation about the patterns of activities in the daily lives of older adults andthe affective experiences associated those activities. The measure targets cate-gories of activities identified by previous experience sampling and time useresearch as being typical for midlife and older adults (e.g., work, volunteer,hobbies, exercise socializing with friends, helping others, going out for diningor entertainment, reading, watching television, taking pleasure trips; Krantz-Kent and Stewart 2007; Larson et al. 1985; Moss and Lawton 1982;Robinson and Godbey 1997). These activities are also known to be associatedwith well-being. Carstensen (1993), for example, suggested that older adultsstrategically and selectively invest their time in pleasurable activities with closecompanions to enhance a sense of well-being. Research focusing on late-lifehealth and cognitive outcomes has drawn particular attention to the benefits oftime and effort invested in physical and mental exercise together with work,volunteering, and social activities (e.g., Carlson et al. 2012; Fratiglioni et al.
56 J. Smith et al.
Author's personal copy

2004; Hertzog et al. 2009; Wilson and Bennett 2003). To date, little is knownabout the affective experiences associated with these health-related and cogni-tive activities in old age.
Affective Experiences Linked to Activities
Affective well-being is typically assessed on two primary dimensions, Positive Affect(PA) and Negative Affect (NA). Positive affect refers to feelings of pleasure experi-enced in interactions with others (e.g., love, joy, pride), in association with activitiesand events (e.g., interest, excitement, surprise), as well as general mood states (e.g.,happiness, contentment, feeling calm/relaxed). Negative affect denotes unpleasantmoods and experiences associated with interpersonal interactions, activities, andevents. Major components of negative affect include anger, sadness, worry, fear,boredom, frustration, disappointment, shame, and anxiety.
Although the terms positive and negative suggest opposite ends of a pleasant-unpleasant continuum, PA and NA items form distinct hierarchical dimensions andclusters associated, for example, with activation (versus quiescence), excitement (ver-sus disengagement), and distress, that are differentially related to health and otheroutcomes (Cacioppo and Berntson 1994; Cacioppo and Gardner 1999; Kuppenset al. 2012; Watson and Clark 1997; Watson et al. 1999). In short, the experience ofemotion is typically more complex and granular than reflected in a simple distinctionbetween PA and NA (e.g., Lindquist and Barrett 2008). Indeed, negative affect can bean important catalyst for action. Fluctuations in positive and negative affect within andacross days reflect reactions to changes in situations, activities, and daily hassles (e.g.,Carstensen et al. 2000; Röcke et al. 2009; Stone et al. 2010).
Survey researchers typically selectively sample feelings from the Affect Circumplex(Russell 1980) with the aim to include some positive and some negative emotions.Table 1 reviews the list of feelings applied in several surveys that have used either theoriginal DRM or a variation of this day reconstruction method. Apart from theinclusion of “happy” and “stressed” there is currently minimal overlap in the selectionprocedure across surveys of experienced well-being and authors rarely provide infor-mation about the theoretical basis for their selection and aggregation within the positiveand negative valence dimensions. For example, Kahneman et al. (2004; Stone et al.2006) assessed 12 adjectives on a 0–6 intensity scale. This list was reduced to six in thePrinceton Affect and Time Survey (PATS: Krueger et al. 2009a). The PATS selectionwas justified by the need to reduce interview time and to enhance the applicability ofthe feelings to most activities. Five of the six PATS feelings were subsequently appliedin a 2010 ATUS day reconstruction module. A study comparing women in Columbusand Rennes collected ten feelings but used only four in analyses (Kahneman et al.2010; Krueger et al. 2009b). Whereas psychological research on affective well-beingtypically uses multiple emotions to assess multiple subcomponents of positive andnegative affect (e.g., Carstensen et al. 2000; Lindquist and Barrett 2008; Watson et al.1999), Krueger et al. (2009a) concluded that it is sufficient to assess three to fourfeelings in order to answer questions about the social and individual value of activities.
Having selected feelings to target, the next question is how best to construct asummary score. The literature includes multiple examples of composites that
Snapshots of Mixtures of Affective Experiences in a Day 57
Author's personal copy

summarize mixtures of feelings within a day or across activities but to date there is noconsensus about the pros and cons of each (Diener and Tay 2013). Traditionally, surveyresearchers have used constructs such as Positive Affect (PA) and Negative Affect(NA) as unit-weighted means of intensity ratings on items that characterize a single
Table 1 Overview of feelings examined in the DRM and survey day reconstruction research
Kahnemanet al. (2004);Stone et al. (2006)
Kruegeret al. (2009a)
Kruegeret al.(2009b)
ATUS(2010)
Dockrayet al. (2010)
Miretet al. (2012)
Positive affect
Calm/relaxed + X
Enjoying myself X X
Happy X X Xa X X
Interested X
Interested/focused +
Warm/friendly X
Affectionate/friendly +
Competent X
Competent/confident +
Meaningful X
Negative affect
Angry/hostile X
Angry X
Criticized/put down X
Depressed/blue X X X
Frustrated/annoyed X
Frustrated X
Hassled/pushedaround
X
Hassled X
Irritated/angry X X
Impatient X +
Pain X X
Rushed X
Sad X X
Tense/stressed X X X
Stressed X X X
Tired X X + X X
Worried/anxious X
Worry X X
+ Collected but not used in analyses
X Collecteda French item was content/happy
58 J. Smith et al.
Author's personal copy

valence. In addition, Net Affect (formed by subtracting mean NA from mean PA) isoften used to summarize overall emotional well-being. Kahneman et al. (2010) intro-duced two varieties of Net Affect, one to reflect the pleasure dimension of the AffectCircumplex (DIFMAX) and a second reflecting the arousal/activation dimension(ACT). When detailed 24-h diary information is available, researchers also weightfeelings by time spent on activities. Krueger et al. (2009a, b), for example, derived a U-index, or so-called misery index, that reflects the proportion of time spent on unpleasanttasks. This is calculated as the proportion of time in which the maximum rating of anynegative affect is greater than the maximum level of positive affect.
These six composites (PA, NA, Net Affect, DIFMAX, ACT, U-Index) all assessmixtures of feelings based on intensity ratings. In the case of PA and NA, the mixturesare within a category (i.e., only positive or only negative feelings) whereas theremaining four indicate a mixture of positive and negative feelings. Specific mixturesof positive, negative, or positive and negative feelings may be functional in that theyevoke action or behavioral change. The behavioral consequences of feeling frustratedand bored (e.g., avoidance) may differ from feeling frustrated and angry (e.g., ap-proach). Similarly, the behavioral consequences of mixtures of positive feelings such asenjoyment and calm (e.g., passivity) may differ from feeling enthusiastic and happy(e.g., activation). Different mixtures of positive and negative feelings associated withan activity could be indicative of ambivalence or stress depending on personal charac-teristics, the activity, and distribution in time (Cacioppo and Gardner 1999). Chronicand cumulative episodes of negative emotions and moods interfere with effectivepsychological functioning, reduce overall subjective well-being, and are potentiallysymptomatic of poor mental health.
Organization of this Paper
This paper reports findings from the Health and Retirement Study about the mixtures ofaffective experiences associated with daily activities in the lives of older adults in theUS. The paper is organized in three sections.
To begin, we evaluate the pilot HRS short day reconstruction measure included in a2009 mail survey sent to a subsample of panel participants. Specifically, we report a)the response distributions for activity participation, time spent on activities, activity-specific affect intensity and the percent of participants who report each feeling; and b)the internal consistencies for the affective ratings. We also compare activity participa-tion rates and time estimates to findings from ATUS in the literature.
In the second section, we compare the properties of intensity-based measures ofpositive and negative affect, and Net Affect, with a new composite, Activity AffectiveComplexity (AAC), which is a frequency-based measure. AAC summarizes the pro-portion of an individual’s activities in a day that involved a mixture of positive andnegative feelings regardless of subjective intensity. Intensity scores can be influencedby individual differences in rating scale usage. Moreover, researchers point to thestatistical issues associated with taking the difference between the mean intensity ofpositive and negative feelings (e.g., Bradburn 1969; Tan et al. 2013). For example,individuals who report low intensities of positive and negative feelings receive thesame Net Affect score as those who report high intensity in both, effectively losing
Snapshots of Mixtures of Affective Experiences in a Day 59
Author's personal copy

information on intensity level. Because of these issues, several researchers suggest theadvantages of using measures that reflect the frequency of positive and negativeexperiences (e.g., Bradburn 1969; Diener et al. 2009). We examine the associationsamong these four composites of affective experiences, their association with global lifesatisfaction, and report relationships with socio-demographic factors. For this paper, wehave not adjusted these composites for time spent on the activities because unlike theDRM, PATS, and ATUS, the 2009 pilot HRS measure did not collect either 24-hinformation or wake/sleep times that enable calculations of the proportion of a wakingday spent on each activity.
Finally, we examine if these four different composites of activity-linkedexperienced-well-being show unique associations with socio-demographic (e.g., age,gender, education, income), health (e.g., functional limitations, self-reported health),and proximal context (day-of-the-week, number of activities, day’s health) indicators.Previous day reconstruction studies suggest that indicators of experienced well-beingmay show weaker, discrepant, or unique associations with these typical predictors oflife satisfaction (Bradburn 1969; Diener and Tay 2013; Kahneman et al. 2010).Bradburn (1969), for example, reported that although higher education and incomewere associated with higher positive affect and Net Affect, their associations withnegative affect were not significant.
Method
The HRS Short Measure of Activity-Linked Experienced Well-Being
In Fall of 2009, HRS included a self-administered day reconstruction questionnaire inan off-year mail survey of prescription medicine usage, renamed the Health andWellbeing Survey (HWB). The experienced well-being questionnaire (HRS HWB1-SAQ) is available online: http://hrsonline.isr.umich.edu/modules/meta/pds/hwb2009/qnaire/HWB2009_English_Questionnaire_Sep2012.pdf. This pilot measure wasmodeled after the original DRM and a modified day reconstruction method proposedby the ROBUST project (Smith et al. 2011). The original DRM self-administeredquestionnaire was too long to include in the multi-disciplinary HRS mail survey.
HRS researchers aimed to shorten and simplify but retain some of the DRMelements to enable comparative work. Kahneman et al. (2004, p. 1779), for example,suggested that generic DRM assessments should: 1) elicit a detailed description of theprevious day in the respondent’s life; 2) approximate the results of continuous real-timeexperience measurement; 3) include procedures to support accurate retrieval of specificepisodes; 4) collect information about the objective circumstances of episodes; and 5)obtain a multidimensional description of the affect experienced in each episode. TheHRS HWB1-SAQ partially meets several of these criteria (especially the latter threecriteria). For example, in order to ease cognitive burden for older adults, the HRSmeasure cues memory retrieval by activity participation. Tasks that explicitly cue foractivity retrieval are known to be less difficult for older adults than free recall (Craikand Rose 2012). Participants are asked if they spent time on a set of activities. This isfollowed by questions about their affective experiences during these activities. Theoriginal DRM and several fine-grained variants of it (e.g., PATS and ATUS) cue
60 J. Smith et al.
Author's personal copy
memory retrieval by time of day: Participants are instructed to reconstruct their daychronologically in episodes (DRM) or 15-min units (PATS, ATUS) and to recall theiractivities at these times. This recall is followed-up with questions about the contextsand activity-linked affective experiences. All methods collect information about activ-ities, time, and affective experiences but the order of retrieval cues prior to affectiveratings differ.
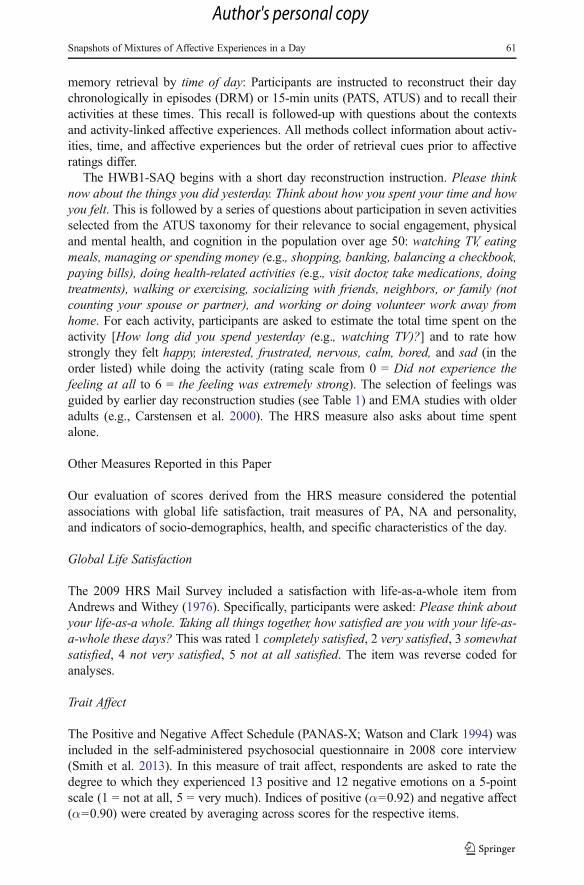
The HWB1-SAQ begins with a short day reconstruction instruction. Please thinknow about the things you did yesterday. Think about how you spent your time and howyou felt. This is followed by a series of questions about participation in seven activitiesselected from the ATUS taxonomy for their relevance to social engagement, physicaland mental health, and cognition in the population over age 50: watching TV, eatingmeals, managing or spending money (e.g., shopping, banking, balancing a checkbook,paying bills), doing health-related activities (e.g., visit doctor, take medications, doingtreatments), walking or exercising, socializing with friends, neighbors, or family (notcounting your spouse or partner), and working or doing volunteer work away fromhome. For each activity, participants are asked to estimate the total time spent on theactivity [How long did you spend yesterday (e.g., watching TV)?] and to rate howstrongly they felt happy, interested, frustrated, nervous, calm, bored, and sad (in theorder listed) while doing the activity (rating scale from 0 = Did not experience thefeeling at all to 6 = the feeling was extremely strong). The selection of feelings wasguided by earlier day reconstruction studies (see Table 1) and EMA studies with olderadults (e.g., Carstensen et al. 2000). The HRS measure also asks about time spentalone.
Other Measures Reported in this Paper
Our evaluation of scores derived from the HRS measure considered the potentialassociations with global life satisfaction, trait measures of PA, NA and personality,and indicators of socio-demographics, health, and specific characteristics of the day.
Global Life Satisfaction
The 2009 HRS Mail Survey included a satisfaction with life-as-a-whole item fromAndrews and Withey (1976). Specifically, participants were asked: Please think aboutyour life-as-a whole. Taking all things together, how satisfied are you with your life-as-a-whole these days? This was rated 1 completely satisfied, 2 very satisfied, 3 somewhatsatisfied, 4 not very satisfied, 5 not at all satisfied. The item was reverse coded foranalyses.
Trait Affect
The Positive and Negative Affect Schedule (PANAS-X; Watson and Clark 1994) wasincluded in the self-administered psychosocial questionnaire in 2008 core interview(Smith et al. 2013). In this measure of trait affect, respondents are asked to rate thedegree to which they experienced 13 positive and 12 negative emotions on a 5-pointscale (1 = not at all, 5 = very much). Indices of positive (α=0.92) and negative affect(α=0.90) were created by averaging across scores for the respective items.
Snapshots of Mixtures of Affective Experiences in a Day 61
Author's personal copy

Five Personality Traits
Scores for the so-called Big-Five traits of personality, Conscientiousness, Openness toexperience, Extraversion, Neuroticism, and Agreeableness, came from a measureincluded in the HRS 2008 core interview (see Smith et al. 2013: scale adapted fromthe Midlife Development Inventory by Lachman and Weaver 1997). Openness toexperience was scored as an average across seven items, conscientiousness, agreeable-ness, and extraversion were each an average of five items, and neuroticism wasassessed by four items. The questions asked participants to indicate how well a seriesof adjectives describes her/him on a 4 point scale where 1 = A lot and 4 = Not at all.Responses were reverse scored where appropriate and reliabilities were within accept-able ranges (Cronbach’s alpha for Conscientiousness=0.66; Openness α=0.79;Extraversion α=0.74; Agreeableness α=0.78; Neuroticism α=0.72).
Demographic, Health, and Day Covariates
Information about age, gender, race, marital status, work status, education, householdincome, depressive symptoms, self-reported health, and functional limitations weredrawn from the HRS 2008 core interview. For analyses, dummy variables were used tocategorize gender (1 = women; 0 = men), race (1 = white; 0 = other), marital status (1 =married; 0 = not married) and work status (1 = employed; 0 = retired). Age cohortswere coded: (1=50–59 years; 2=60–69years; 3=70–79 years; 4=80–89; and 5=90+).Education was coded in five categories (1 = Less than high school; 2 = Some highschool; 3 = High school graduate; 4 = Some college; 5 = College and beyond). Forregressions, the 70s age cohort group (3) and high school graduate (3) were the referentgroups. We created quintiles from the RAND imputed variable for total householdincome in 2008 (1 = lowest; 5 = highest) and used the third quintile as the referent inregression models. Depressive symptoms in HRS are assessed with eight items adaptedfrom the original Center for Epidemiologic Studies Depression (CESD) scale.Following Steffick (2000), we formed a dichotomous score to indicate the severity ofsymptoms (0 = less than 4; 1=4 or more symptoms). Self-reported health is assessedwith a single item: Would you say your health is excellent, very good, good, fair, orpoor? This is coded on a 5-point scale (5 = excellent to 1 = poor). To complement thisglobal measure, we included an indicator of the potential impact of physical function-ing on the ability to perform daily activities. In the HRS, physical functioning isassessed by items adapted from scales developed by Rosow and Breslau (1966),Nagi (1976), Katz et al. (1963), and Lawton and Brody (1969). Participants are askedif they have difficulty with a series of activities because of a health problem. The itemsrange from running or jogging a mile, walking one block, and climbing one flight ofstairs, to picking up a dime, shopping for groceries, dressing, and bathing (max=23).We created a dichotomous score to reflect level of physical functioning (0=3 or less;1=4 or more limitations).
Three characteristics of the day were examined that are relevant to affectiveexperiences. This information was collected in the 2009 HWB1-SAQ. Given thatprevious day reconstruction research (e.g., Krueger et al. 2009a) reports differencesbetween weekday and weekend experiences, an indicator for this was included (1 =weekday; 0 = weekend). This was coded from participant’s self reports of the day of the
62 J. Smith et al.
Author's personal copy

week reconstructed. Health and sleep patterns are known to be strong predictors ofglobal well-being in older adults but relatively little is known about their proximalimpact on day-to-day affective experience. The 2009 HRS-HWB1 included two singleitem indicators: Self-reported health for yesterday (How was your health yesterday?Was it excellent, very good, good, fair, or poor) and an item about sleep quality (Didyou feel well-rested yesterday morning, that is you slept well the night before - yes/no).To avoid potential collinearity with the other health indicators, only the sleep qualityitem was included in regression models. Health and sleep quality yesterday werecorrelated (r=0.39, p<0.001) and both day reports were correlated with self-reportedhealth in 2008 (rs=0.56 and 0.21, p<0.001 respectively).
Statistical Procedures
Data Preparation
As is often the case for self-administered mailed questionnaires, some participants didnot respond to all questions for each activity. We adopted the following criteria todetermine activity participation and to deal with missing responses to questions aboutthe time spent on an activity and affective experiences during the activity. If time spenton an activity was missing, we coded activity participation as “no—not done theprevious day”. If a response about time was entered, we coded activity participationas “yes—done the previous day” conditional on at least one feeling for that activitybeing rated 1 or higher. Although one end-point (0) of the rating scale for affectiveexperiences was labeled not experienced at all, not all participants used the option andinstead skipped ratings. If time was not missing for an activity and at least one emotionwas rated 1 or higher for that activity, we recoded all affect ratings for that activity thatwere missing as a “0” in order to calculate the aggregate Net Affect and AAC scores forthis paper. This replacement procedure was applied more often on ratings of negativeemotions and also differed by activity. For example, missing ratings of happy werecoded as 0 for 11.5 % of participants who watched TV but only 5.3 % of those whoworked or volunteered. In contrast, missing ratings of frustrated were coded as 0 for16.6 % of participants who watched TV and for 14.9 % of people who reportedworking or volunteering.
Construction of Composites of Affective Experiences Across Activities
Individual-level scores were computed for each activity and aggregated across allactivities to construct four composites of different mixtures of affective experiences:Activity-Positive Affect, Activity-Negative Affect, Net Affect, and Activity AffectiveComplexity. For the Activity-Positive Affect score (Activity-PA), we first calculated theindividual-level mean on the 0 to 6 rating scale across positive feelings (happy,interested, calm; max=6) for each activity the person reported then averaged acrossall the activities that he/she reported. A similar procedure was applied to form a score ofActivity-Negative Affect (Activity-NA: frustrated, nervous, bored, sad; Max=6). NetAffect for each activity was calculated by subtracting Activity-NA from Activity-PA.The grand mean of Net Affect for the activities in the day per person was averagedacross the activities he/she reported.
Snapshots of Mixtures of Affective Experiences in a Day 63
Author's personal copy

To create our new AAC score, we first counted for each activity the number ofpositive feelings rated ≥1 (range 0 to 3) and the number of negative feelings rated ≥1(range 0 to 4). Using these counts, we determined for each activity the subgroup ofindividuals who had nonzero scores for both positive and negative feelings (i.e.suggesting that they experienced a mixture of positive and negative feelings). For theActivity Affective Complexity (AAC) score for the day, we calculated for each personthe proportion of activities on which both positive and negative feelings were reported(i.e., # activities for which positive and negative feelings are reported divided by #activities reported).
Analytic Strategy
General linear models and logistic regressions were conducted to examine factorsrelated to the number and types of activities reported. Cronbach’s alphas were calcu-lated for positive and negative affect for each activity as an initial estimate of inter-itemconsistency (reliability). Intraclass correlations were computed for each affect acrossactivities and for composite positive and negative affect to determine the nested sourcesof variance associated with between-person and intra-individual differences acrossactivities. Score distributions were examined for evidence of skew and excess use ofscale endpoints (0 or 6).
Zero-order bivariate correlations were conducted to examine associations among thecomposites of affective experiences and between these composites and global lifesatisfaction. Mean comparisons of the composites at the zero-order level were com-puted for socio-demographic factors. We also computed partial bivariate correlationsbetween AAC and socio-demographic, health, and proximal day context factors con-trolling for Activity-PA, Activity-NA, and Net Affect. Multiple OLS regression modelswere subsequently conducted to examine patterns of unique predictors for the intensity-based affect composites. Because the AAC composite is based on a count score, weused a Poisson regression model. Throughout our analyses we follow the convention oftreating predictor variables as linear (e.g., the income quintile variable was treated as acentered predictor ranging from −2 to 2).
Participants
The base sample for HWB 2009 included a subsample of HRS participants who hadpreviously completed mail surveys about Prescription Drug Use in 2005 and 2007.This sample was supplemented with an additional 22 % random selection of respon-dents who completed the 2008 HRS Core interview but were not included in anotheroff-year survey in 2009. The final eligible sample size for HWB 2009 was 7,417respondents. It was determined that 337 persons died prior to the October 2009 start ofthe field period. Of the 7,080 remaining eligible cases, 5,333 returned questionnaires,for an overall study response rate of 75 % (September 2012 release). The potentialsample for the present analyses was reduced to 4,810 because we found 148 respon-dents to be age ineligible and 375 surveys were completed by proxy informants. Anadditional 205 respondents did not provide valid data for activities and experiences.The final study sample included 4,605 participants. Table 2 provides unweighteddescriptive information for the characteristics of these participants. At the time of
64 J. Smith et al.
Author's personal copy

writing, HRS had not released weights for this questionnaire but information about dataaccess and the codebook are published online: http://hrsonline.isr.umich.edu/index.php?p=shoavail&iyear=9B
Results
The results are reported in three sections. After evaluating the quality of data obtainedfrom the HRS measure in the first section, we compare the properties of the intensity-based and frequency-based composite scores of affective experiences in section two.The final section presents findings of multivariate models that examined the associa-tions between each of these composites with socio-demographic, health, and proximalfactors. Table 3 provides descriptive data for activity participation and time use togetherwith activity-specific intensity ratings for each affective experience. Table 4 gives theactivity-specific descriptive data for the frequency-based affective scores.
Evaluation of the HRS-HWB Measure
Activities
As can be seen in Table 3, participation in meals (91 %) and watching TV (86 %) werereported by most HRS respondents. Socializing (74 %) and walking/exercising (61 %)were also prevalent activities. Only 23 % reported having worked or volunteered. In
Table 2 Participant characteristicsin the 2009 HRS HWB (N=4605)
Participant characteristics
Mean age (range) 70 (51–98)
% age 50–59 15
% age 60–69 32
% age 70–79 35
% age 80–89 16
% age 90+ 2
% White 85
% high school or less 55
Mean household income $65,303
% women 60
% married 63
% working 34
% 4 or more limitations 38
% 4 or more depressive symptoms 16
% good-excellent health 76
% good-excellent health yesterday 80
% who spent time alone >8 h 34
Mean number of activities 4.3
% weekday 67
Snapshots of Mixtures of Affective Experiences in a Day 65
Author's personal copy

part this arose because the responses for 35 % of the older workers in the samplereferred to a weekend day. On average, participants reported participation in 4.47activities (SD=1.42; range 1–7).
Whereas 67 % of participants’ responses referred to a weekday, each day of theweek was not equally reflected in the sample (Monday 13.6 %, Tuesday 9.6 %,Wednesday 9.5, Thursday 15.5 %, Friday 18.5 %, Saturday 14.8 %, and Sunday18.6 %). To evaluate the effects of day of the week and workforce participation onthe number of activities reported, we computed a univariate general linear model withBonferroni adjustments. This model revealed that fewer activities were reported onSundays (M=4.02; p<0.001) compared to all other days and that older workersreported more activities than retirees (M=4.56 vs M=4.2; p<0.001). The interactionbetween day and workforce participation was not significant. A similar model wascomputed entering gender instead of workforce participation. Neither the effect forgender (p=0.09) or the gender × day of the week interaction (p=0.37) was significant.
Table 3 Activity participation, time use and mean affect intensity (N=4605)
Activity %report
Meanhours
NetAffect
Activity-linked mean affect intensity (scale 0 to 6)
Happy Interested Calm Frustrated Nervous Bored Sad
Watch TV/DVD 85.8 3.64 2.38 2.95 3.56 3.10 0.90 0.56 1.01 0.80
Meals 90.5 1.47 2.93 3.65 3.05 3.34 0.42 0.37 0.50 0.39
Socialize 73.8 3.17 3.67 4.54 4.12 3.49 0.46 0.39 0.33 0.36
Manage/spendmoney
45.5 1.43 2.21 2.82 3.11 2.93 1.10 0.72 0.54 0.59
Health-related 51.8 0.77 2.31 2.80 2.67 3.13 0.65 0.56 0.57 0.44
Work/volunteer 23.0 4.80 3.29 4.12 3.97 3.20 0.72 0.46 0.39 0.29
Walk/exercise 61.3 1.37 3.02 3.77 3.28 3.24 0.49 0.41 0.42 0.30
Affect was rated on a scale from 0 (did not feel at all) to 6 (feeling was extremely strong)
Time and affect means are calculated only for participants who reported time spent on the activity
Table 4 Percent of participants reporting each type of affective experience for each activity (N=4,605)
Activity Nreport
% mixedpositive andnegative
Percent who rate each feeling 1(a little) or higher
Happy Interested Calm Frustrated Nervous Bored Sad
Watch TV/DVD 3950 55.1 82 90 78 34 23 40 29
Meals 4169 29.8 89 79 80 19 16 21 15
Socialize 3398 28.8 95 87 77 21 16 15 15
Manage/spend money 2093 43.6 76 81 76 40 28 23 22
Health-related 2385 33.6 72 71 78 25 22 22 17
Work/volunteer 1057 39.2 93 88 78 32 21 18 13
Walk/exercise 2824 29.7 89 80 77 21 17 18 12
Percentages include only participants who reported time spent on the activity
66 J. Smith et al.
Author's personal copy

A logistic regression predicting participation in health-related activities revealed thatyounger age groups and people in better health were less likely to report participation(p<0.001). These groups, however, were more likely to report having spent timewalking or exercising (p<0.001).
Time Estimations
As expected, participants who worked or volunteered reported spending the most timeon that activity (M=4.8 h, SD=2.12 h) and those who watched TValso reported manyhours (M=3.6 h, SD=2.6 h). The least hours spent on an activity were reported bythose who did health-related (M=0.8 h, SD=1.58 h) or exercised-related (M=1.4 h,SD=1.6 h) activities. Considerable hours were also reported by those who socialized(M=3.2 h, SD=2.9 h). These time estimates seem plausible given the age range of thesample. Preliminary examination of weighted data (i.e. using the sample weights fromHRS in 2008 core) for watching TVand working suggest that the time estimates givenby HRS participants are similar to times calculated from detailed time diaries collectedby ATUS for the older population. For example, using ATUS data from 2003 to 2004Krantz-Kent and Stewart (2007) report that the time spent watching TV ranged from2.8 h in men aged 55–59 to 4.2 h in the age group 70–80. Time spent working by menranged from 5 h (age 55–59) to 0.6 h (age 70–80). To estimate the total time in a dayaccounted for by the measure at the sample level, for each activity we multiplied theaverage length of time by the percent of the sample that engaged in the activity. Wethen summed these “sample adjusted” times to get a score for the mean hours in a daycovered by the measure. At the sample level, 9.78 h in a day are accounted for by the2009 HWB1-SAQ.
Affect Measures
As reported in Table 3, overall the highest activity-linked mean intensity ratings (range0 to 6) for the positive feelings (happy, interested, and calm) were given by participantswho reported socializing, working/volunteering and watching TV. The rank ordering ofactivities varied. Overall, negative feelings were somewhat higher for TV and money-related activities. Figure 1a shows the distribution of intensity ratings (0 to 6) to thequestion about feeling happy on four activities, watching TV, managing/spendingmoney, work, and socializing. Figure 1b illustrates the distribution for feeling frustratedon the same activities. The skew varied by activity for ratings of happy, from normal toslightly skewed to the left. The distributions for frustrated were skewed to the right asexpected from previous studies (Krueger et al. 2009a). Mean ratings for the negativefeelings across activities [frustrated 0.65 (SD=16 %), nervous 0.49 (SD=16 %), bored0.58 (SD=16 %), and sad 0.49 (SD=16 %)] were significantly lower (all t-tests:p<0.001) than for positive emotions [happy 3.4 (SD=1.6), interested 3.2 (SD=1.7),and calm 3.1 (SD=1.8)].
In contrast to Table 3, which reports mean intensity, Table 4 summarizes the percentof participants who reported experiencing each feeling for each activity (i.e. who gave arating of 1 or higher). The pattern of reports of positive versus negative feelings foreach activity is similar to Table 3. On average, participants reported feeling happy on76 % (SD=27 %) of the activities they did, interested on 73 % (SD=30 %), and calm
Snapshots of Mixtures of Affective Experiences in a Day 67
Author's personal copy

on 68 % (SD=32 %). The mean percent of activities on which negative feelings werereported was lower: frustrated 23 % (SD=30 %), nervous 17 % (SD=28 %), bored21 % (SD=30 %), and sad 17 % (SD=28 %). Table 4 also provides activity-specificinformation for the percent of participants who reported experiencing some mixture of1–3 positive and 1–4 negative feelings. On all activities, more than 25 % of participantsreported some mixture of positive and negative experiences. The top four activities onwhich participants reported mixed affective experiences were watching TV (55.1 %),managing/spending money (43.6 %), working/volunteering (39.2 %), and health-related activities (33.6 %).
Cronbach alphas calculated for the positive (happy, interested, calm) and negative(frustrated, nervous, bored, sad) items for each activity revealed moderate to high inter-item consistencies (reliability). These ranged from α=0.71 (TV) to α=0.82 (Work) forpositive affect and α=0.70 (TV) to α=0.83 (Socializing) for negative affect. Todetermine the relative sources of variance (between-person versus within-person) inaffective experiences associated with patterns of activities across the day, werestructured the data to nest activities within individuals. Higher ICCs in these analysesindicate that the variance in affective experience is associated more with personalcharacteristics (e.g., between-person characteristics such as personality) than withparticular activities. The intraclass correlations (ICCs) obtained from multilevel modelsconducted for each affective experience across activities were as follows: Calm: ICC=0.55; Interested: ICC=0.50; Happy: ICC=0.48, Sad: ICC=0. 0.43, Nervous: ICC=0.36; Bored: ICC=0.35; Frustrated: ICC=0.32. Overall, roughly half of the variance inthe intensity of positive affect (calm, interested, and happy) is associated with between-
Fig. 1 Distributions of ratings of feeling happy (a) and frustrated (b) on a scale from zero (not at all) to six(very much). Percent of participants who reported each scale point for four activities they reported havingspent time on the previous day: watching TV, managing/spending money, working or volunteering, andsocializing
68 J. Smith et al.
Author's personal copy

person differences and half with within-person variability across activities. Thebetween-person variance in reported negative affect is lower (around 35 % across thedifferent adjectives) suggesting that the specific activities done throughout a daycontribute more to variance in intensity of negative affect.
The Composites of Mixtures of Affective Experiences
The four composites constructed from the 2009 HWB1-SAQ showed different distribu-tions. Activity-PA (M=3.35; SD=1.4; range 0 to 6) was normally distributed whereasActivity-NA (M=0.55; SD=0.8; range 0 to 6) was skewed to the right. The scaleendpoints included 16.7 % of participants for Activity-PA (6.4 % were between 0 and1; 10.3 % between 5 and 6) and 32.8 % for Activity-NA (32.7 % were between 0 and 1;0.1% between 5 and 6). Net Affect (M=2.7; SD=1.7; range −5.25 to 6) was skewed to theleft and AAC (M=0.36; SD=0.36; range 0 to 1) had an excess of scores at both endpoints(37.3 % at 0 and 15.7 % at 1) but was normally distributed between these points.
The composites Activity-PA and Activity-NAwere correlated, r=−0.09 (p<0.001) andas expected both were correlated with Net Affect (rs=0.89 and −0. 54, p<0.001 respec-tively). AAC was not correlated with Activity-PA, r=−0.03 (p=0.075), but it was withActivity-NA, r=−0.73 (p<0.001). Net Affect andAACwere correlated, r=−0.32, p<0.001.All composites were correlated with global life satisfaction (Life Satisfaction with Activity-PA r=0.28; p<0.001; Activity-NA r=−0.30; p<0.001; Net Affect r=−0.38; p<0.001; andAAC r=−0.24; p<0.001). We also examined correlations of the four composites with traitmeasures of positive and negative affect and the Big-5 personality factors (extraversion,conscientiousness, neuroticism, agreeableness and openness to new experiences). As ex-pected, all correlations were small to moderate (ranging from −0.13 to 0.41). Although thesize of correlations was similar across the affect composites, the directional pattern ofcorrelations differed. For example, Activity-PA and Net Affect were positively correlatedwith extraversion (rs=0.20 and 0.24, p<0.001 respectively) whereas the correlations withActivity-NA and AAC were negative (rs=−0.16 and −0.17, p<0.001 respectively). Thispattern was reversed for neuroticism: the correlations with Activity-PA and Net Affect werein a negative direction (rs=−0.22 and −0.32, p<0.001 respectively) and a positive directionfor Activity-NA and AAC (rs=0.28 and 0.23, p<0.001 respectively).
Table 5 reports the zero-order bivariate associations for the new frequency-basedAAC measure with socio-demographic, health, and proximal day factors known to beassociated with affective well-being and life satisfaction. All correlations were signif-icant with the exception of the relationship with marital status, employment status, andtype of day (weekend). Given that AAC shares variance with the other composites, wealso examined if these associations with known predictors remained significant aftercontrols for the intensity-based affect composites and for life satisfaction. Overall, thepattern of relationships with AAC remained unchanged, although some correlationswere reduced and others increased in size.
Sociodemographic Gradients in Mixtures of Affective Experiences
Table 6 provides the socio-demographic subgroup means and 95 % confidence intervalsfor each of the composite scores of affective experiences. The social gradients in affectivewell-being were more evident in Activity-PA and Net Affect than in AAC and Activity-
Snapshots of Mixtures of Affective Experiences in a Day 69
Author's personal copy
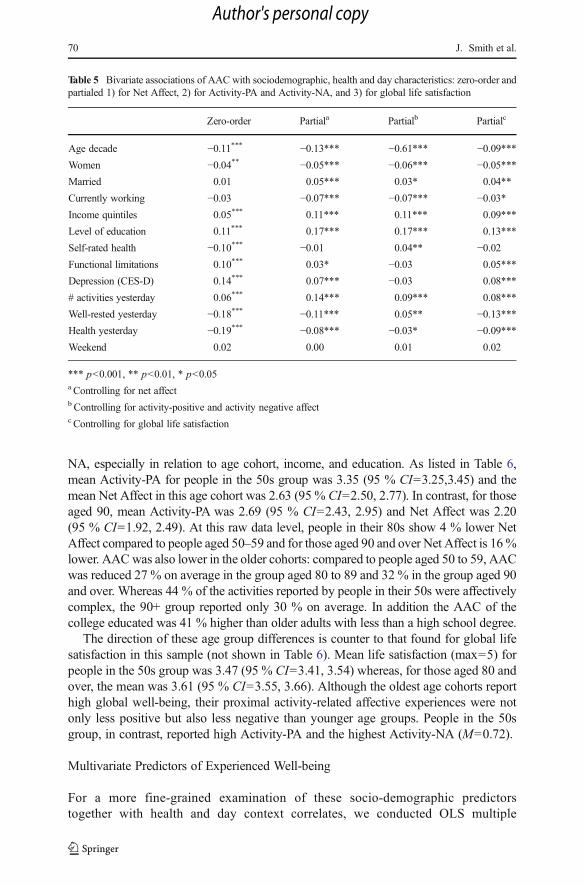
NA, especially in relation to age cohort, income, and education. As listed in Table 6,mean Activity-PA for people in the 50s group was 3.35 (95 % CI=3.25,3.45) and themean Net Affect in this age cohort was 2.63 (95 % CI=2.50, 2.77). In contrast, for thoseaged 90, mean Activity-PA was 2.69 (95 % CI=2.43, 2.95) and Net Affect was 2.20(95 % CI=1.92, 2.49). At this raw data level, people in their 80s show 4 % lower NetAffect compared to people aged 50–59 and for those aged 90 and over Net Affect is 16%lower. AACwas also lower in the older cohorts: compared to people aged 50 to 59, AACwas reduced 27 % on average in the group aged 80 to 89 and 32 % in the group aged 90and over. Whereas 44 % of the activities reported by people in their 50s were affectivelycomplex, the 90+ group reported only 30 % on average. In addition the AAC of thecollege educated was 41 % higher than older adults with less than a high school degree.
The direction of these age group differences is counter to that found for global lifesatisfaction in this sample (not shown in Table 6). Mean life satisfaction (max=5) forpeople in the 50s group was 3.47 (95 % CI=3.41, 3.54) whereas, for those aged 80 andover, the mean was 3.61 (95 % CI=3.55, 3.66). Although the oldest age cohorts reporthigh global well-being, their proximal activity-related affective experiences were notonly less positive but also less negative than younger age groups. People in the 50sgroup, in contrast, reported high Activity-PA and the highest Activity-NA (M=0.72).
Multivariate Predictors of Experienced Well-being
For a more fine-grained examination of these socio-demographic predictorstogether with health and day context correlates, we conducted OLS multiple
Table 5 Bivariate associations of AAC with sociodemographic, health and day characteristics: zero-order andpartialed 1) for Net Affect, 2) for Activity-PA and Activity-NA, and 3) for global life satisfaction
Zero-order Partiala Partialb Partialc
Age decade −0.11*** −0.13*** −0.61*** −0.09***Women −0.04** −0.05*** −0.06*** −0.05***Married 0.01 0.05*** 0.03* 0.04**
Currently working −0.03 −0.07*** −0.07*** −0.03*Income quintiles 0.05*** 0.11*** 0.11*** 0.09***
Level of education 0.11*** 0.17*** 0.17*** 0.13***
Self-rated health −0.10*** −0.01 0.04** −0.02Functional limitations 0.10*** 0.03* −0.03 0.05***
Depression (CES-D) 0.14*** 0.07*** −0.03 0.08***
# activities yesterday 0.06*** 0.14*** 0.09*** 0.08***
Well-rested yesterday −0.18*** −0.11*** 0.05** −0.13***Health yesterday −0.19*** −0.08*** −0.03* −0.09***Weekend 0.02 0.00 0.01 0.02
*** p<0.001, ** p<0.01, * p<0.05a Controlling for net affectb Controlling for activity-positive and activity negative affectc Controlling for global life satisfaction
70 J. Smith et al.
Author's personal copy

regressions for the three intensity-based composite scores of experienced well-being, Activity-PA, Activity-NA and Net Affect, and a Poisson regression forAAC. Table 7 summarizes the nonstandardized regression estimates for thesefour models.
The three health indicators (self-rated health, functional limitations, anddepression) together with education are uniquely associated with all of thecomposite scores. With the exception of employment status, which as notsignificant in any model, the composites showed different patterns of uniqueassociations with age, gender, marital status, and income. Because measures ofexperienced well-being are designed to focus individuals’ attention on feelingslinked to activities in a specific day, we expected to find significant indicatorsof the day’s context. Indeed, feeling well-rested in the morning uniquelycontributed to higher Activity-PA and Net Affect and less Activity-NA andAAC. Responding on a weekday contributed to lower Activity-PA and NetAffect but was not uniquely related to Activity-NA or AAC.
Table 6 Means (95 % CI) of Activity-PA, Activity-NA and overall Net Affect and Activity AffectiveComplexity for socio-demographic groups
N Acitivity-PA
95 % CI Acitivity-NA
95 % CI NetAffect
95 % CI AAC 95 % CI
Age decade
50s 709 3.35 3.25–3.45 0.72 0.65–0.79 2.63 2.50–2.77 0.44 0.42–0.47
60s 1492 3.36 3.29–3.43 0.54 0.51–0.58 2.82 2.73–2.90 0.38 0.36–0.39
70s 1593 3.24 3.17–3.32 0.52 0.48–0.56 2.72 2.64–2.81 0.34 0.32–0.35
80s 701 3.02 2.90–3.13 0.49 0.44–0.54 2.53 2.40–2.65 0.32 0.30–0.35
90s 110 2.69 2.43–2.95 0.48 0.34–0.63 2.20 1.92–2.49 0.30 0.23–0.37
Men 1862 3.30 3.24–3.37 0.55 0.52–0.59 2.74 2.67–2.82 0.38 0.37–0.40
Women 2743 3.22 3.16–3.27 0.55 0.52–0.58 2.66 2.60–2.73 0.35 0.34–0.36
Married 2899 3.37 3.31–3.42 0.54 0.51–0.57 2.83 2.76–2.89 0.37 0.35–0.38
Not married 1706 3.06 2.99–3.12 0.58 0.54–0.62 2.48 2.40–2.56 0.36 0.34–0.37
Older worker 1613 3.47 3.40–3.53 0.50 0.47–0.54 2.96 2.88–3.04 0.38 0.36–0.39
Retiree 2992 3.13 3.08–3.19 0.58 0.55–0.61 2.56 2.49–2.62 0.36 0.34–0.37
Household income
Lowest quintile 921 2.81 2.71–2.91 0.61 0.55–0.67 2.20 2.08–2.31 0.34 0.31–0.36
2 921 3.17 3.07–3.26 0.56 0.50–0.61 2.61 2.49–2.72 0.34 0.32–0.36
3 921 3.31 3.22–3.40 0.58 0.52–0.63 2.73 2.62–2.84 0.37 0.34–0.39
4 921 3.41 3.32–3.50 0.56 0.51–0.60 2.86 2.75–2.96 0.39 0.37–0.42
Highest quintile 921 3.56 3.48–3.64 0.46 0.42–0.51 3.09 3.00–3.19 0.38 0.35–0.40
Education
Less than HS 341 2.51 2.34–2.67 0.54 0.45–0.63 1.97 1.79–2.15 0.27 0.23–0.31
Some HS 551 2.94 2.81–3.07 0.59 0.51–0.67 2.35 2.21–2.50 0.31 0.28–0.34
HS 1637 3.27 3.20–3.34 0.58 0.54–0.62 2.68 2.60–2.77 0.36 0.34–0.38
Some college 1020 3.34 3.26–3.43 0.56 0.51–0.61 2.78 2.68–2.88 0.38 0.35–0.40
College degree + 1047 3.54 3.46–3.61 0.48 0.45–0.52 3.05 2.96–3.15 0.41 0.39–0.44
Snapshots of Mixtures of Affective Experiences in a Day 71
Author's personal copy

Discussion
The HRS Measure
Our analyses revealed that the response quality for the HRS pilot measure of experi-enced well-being is good and that composite scores derived from aggregations ofpositive and negative feelings are reliable and uniquely associated with socio-demographic, health, and proximal indicators of the day’s context. Missing data aretypical in self-administered questionnaires, especially in heterogeneous samples ofolder adults. Older adults are less familiar with survey formats and heterogeneoussamples of older participants include people with low education, as well as sensory-motor and cognitive limitations. In this context, it is notable that 64 % of the 580 age-eligible HRS respondents were excluded from the present analyses because theirquestionnaire was completed by a proxy. The remaining 36 % of age-eligible partic-ipants who were not included in our analyses had either reported time spent on
Table 7 Relationship of socio-demographic, health, and day characteristics to four indicators of experiencedwell-being (Unstandardized coefficients and Standard errors)
Activity-PA Activity-NA Net affect AACa
Correlates Beta SE Beta SE Beta SE Beta SE
Sociodemographic
Age decade -0.07*** 0.02 0.08*** 0.01 -0.01 0.03 -.10*** 0.01
Gender (women=1) 0.04 0.04 -0.07** 0.02 0.10* 0.05 -0.15*** 0.02
Married 0.12** 0.05 0.02 0.02 0.14* 0.06 -0.05 0.03
Older Worker (1=yes) 0.01 0.01 0.01 0.01 -0.01 0.06 0.0 0.01
Income quintile 0.04* 0.01 -0.0 0.01 0.04* 0.02 00.03* 0.01
Education 0.08*** 0.02 0.03* 0.01 0.05*** 0.02 0.11*** 0.01
Health
Self-rated health 0.16*** 0.02 0.06*** 0.01 0.22*** 0.03 -0.05*** 0.01
Functional limitations -0.02 0.03 0.09*** 0.01 -0.10** 0.04 0.11*** 0.02
Depressive symptoms -0.26*** 0.06 0.34*** 0.03 -0.60*** 0.07 0.26*** 0.03
Situation yesterday
# Activities 0.19*** 0.01 -0.0 0.01 0.20*** 0.02 —
Well-rested 1=yes 0.38*** 0.04 -0.28*** 0.03 0.66*** 0.05 -0.26*** 0.03
Weekday 1=yes -0.22*** 0.04 0.04 0.02 -0.26*** 0.05 0.03 0.03
Intercept SE 20.08 0.12 0.72 0.07 0.40 0.15 -0.75 0.06
n 4472 4472 4472 4472
Total adjusted R2 0.14*** 0.11*** 0.18*** b0.19***
Age Decade reference 0=70s. Household Income Quintile reference=3; Education reference: 0=high schooldegree. Functional Limitations reference: 0=1-3; Depressive Symptoms: 0=≤ 3; 1=≥ 4a AAC Results from a Poisson Regression with # Activities treated as an offset (i.e., slope fixed to unitconstant). The coefficients for the Poisson regression are on the log scaleb Cragg and Uhler pseudo R2 tested with likelihood ratio test (Maddala, 1983)
***p<0.001, ** p<0.01, * p<0.05
72 J. Smith et al.
Author's personal copy
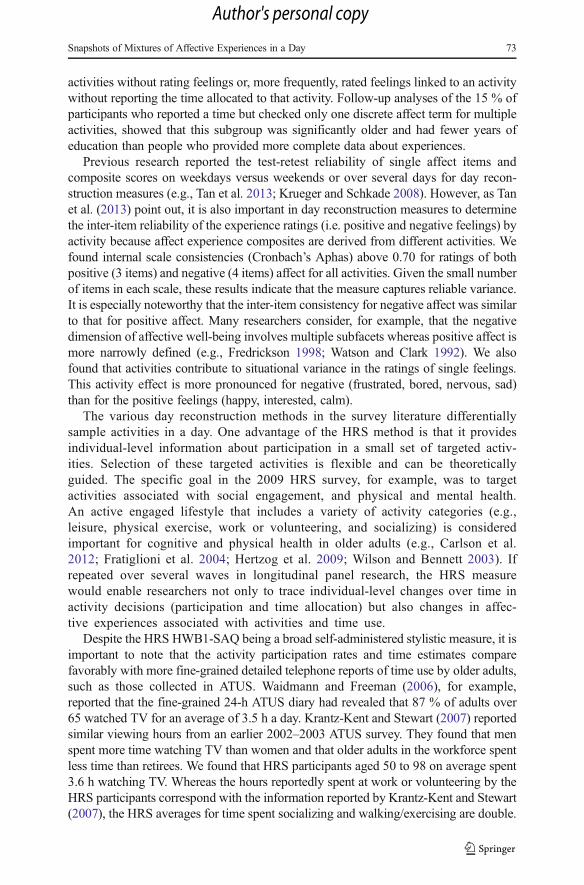
activities without rating feelings or, more frequently, rated feelings linked to an activitywithout reporting the time allocated to that activity. Follow-up analyses of the 15 % ofparticipants who reported a time but checked only one discrete affect term for multipleactivities, showed that this subgroup was significantly older and had fewer years ofeducation than people who provided more complete data about experiences.
Previous research reported the test-retest reliability of single affect items andcomposite scores on weekdays versus weekends or over several days for day recon-struction measures (e.g., Tan et al. 2013; Krueger and Schkade 2008). However, as Tanet al. (2013) point out, it is also important in day reconstruction measures to determinethe inter-item reliability of the experience ratings (i.e. positive and negative feelings) byactivity because affect experience composites are derived from different activities. Wefound internal scale consistencies (Cronbach’s Aphas) above 0.70 for ratings of bothpositive (3 items) and negative (4 items) affect for all activities. Given the small numberof items in each scale, these results indicate that the measure captures reliable variance.It is especially noteworthy that the inter-item consistency for negative affect was similarto that for positive affect. Many researchers consider, for example, that the negativedimension of affective well-being involves multiple subfacets whereas positive affect ismore narrowly defined (e.g., Fredrickson 1998; Watson and Clark 1992). We alsofound that activities contribute to situational variance in the ratings of single feelings.This activity effect is more pronounced for negative (frustrated, bored, nervous, sad)than for the positive feelings (happy, interested, calm).
The various day reconstruction methods in the survey literature differentiallysample activities in a day. One advantage of the HRS method is that it providesindividual-level information about participation in a small set of targeted activ-ities. Selection of these targeted activities is flexible and can be theoreticallyguided. The specific goal in the 2009 HRS survey, for example, was to targetactivities associated with social engagement, and physical and mental health.An active engaged lifestyle that includes a variety of activity categories (e.g.,leisure, physical exercise, work or volunteering, and socializing) is consideredimportant for cognitive and physical health in older adults (e.g., Carlson et al.2012; Fratiglioni et al. 2004; Hertzog et al. 2009; Wilson and Bennett 2003). Ifrepeated over several waves in longitudinal panel research, the HRS measurewould enable researchers not only to trace individual-level changes over time inactivity decisions (participation and time allocation) but also changes in affec-tive experiences associated with activities and time use.
Despite the HRS HWB1-SAQ being a broad self-administered stylistic measure, it isimportant to note that the activity participation rates and time estimates comparefavorably with more fine-grained detailed telephone reports of time use by older adults,such as those collected in ATUS. Waidmann and Freeman (2006), for example,reported that the fine-grained 24-h ATUS diary had revealed that 87 % of adults over65 watched TV for an average of 3.5 h a day. Krantz-Kent and Stewart (2007) reportedsimilar viewing hours from an earlier 2002–2003 ATUS survey. They found that menspent more time watching TV than women and that older adults in the workforce spentless time than retirees. We found that HRS participants aged 50 to 98 on average spent3.6 h watching TV. Whereas the hours reportedly spent at work or volunteering by theHRS participants correspond with the information reported by Krantz-Kent and Stewart(2007), the HRS averages for time spent socializing and walking/exercising are double.
Snapshots of Mixtures of Affective Experiences in a Day 73
Author's personal copy

Although these discrepancies may be reduced when sample weights are applied to theHRS data, they could be due to measurement and coding differences.
The Complexity of Affective Experiences Associated with Activities
Our findings highlight conceptual issues in assessing and interpreting the complexity ofaffective experience in older adults (Diener and Tay 2013; Lindquist and Barrett 2008;Watson et al. 1999). The particular activities targeted in this study on average filled at least1 h in the day so that the potential for several feelings to be experienced during this timearises. Each activity is also associated with a different pattern of feelings and individualsdiffer in the experiences they report (see for example Tables 3 and 4). As found in previousday reconstruction research (e.g., Krueger et al. 2009a), the highest ratings of feelinghappy were for socializing, followed by work/volunteering and exercise (see also Fig. 1).Although a considerable proportion of the day is spent watching TV, consuming TVappears to contribute less to overall positive well-being in older adults than other activitiesthat involve more social, cognitive, and physical engagement. Indeed, among HRSparticipants, TV also evokes high ratings for feeling frustrated, nervous, bored, and sad.Only managing and spending money is ranked higher than TV for experiences offrustration and feeling nervous. Given that this HRS survey was collected during aneconomic slump when discussions about the economy were prominent, these negativeratings associated with finances seem plausible.
Older adults, especially retirees, generally self-select the routine activities thatcharacterize their days. Among other factors, this selection process is likely shaped tosome extent by individual differences in personality and preferences for emotionregulation. For example, some happy people may report similar levels of happinesson all the activities in their day regardless of the actual activity content and duration.Others, however, may report feeling happier on activities that they particularly like andindeed might structure their day to always end with activities like socializing that theyexpect will cheer them up. Interestingly, we found that roughly 50 % of the variance inthe intensity of positive affect (calm, interested, and happy) was associated withbetween-person differences, whereas the variance in negative affect associated withindividual differences was much lower, around 35 % across the different adjectives.This suggests that more of the variance in intensity of negative affect throughout a dayis associated with the specific activities and activity-related contexts people encoun-tered on a target day rather than their personal characteristics.
We compared four composites of affective experiences: three are aggregates ofintensity ratings (Activity-PA, Activity-NA, Net Affect) across activities and the otheris a frequency-based score (AAC) that captures the proportion of activities that includeda mixture of positive and negative feelings. Our findings for these composites are ofcourse constrained by the survey instrument (particularly the activities and feelingstargeted), mode, and the cross-sectional design. The four composites are related to eachother but do show different patterns of associations with predictors. Indeed, thefrequency-based AAC that we introduced in this paper showed unique relationshipswith socio-demographic, health, and situation-specific factors after controls for theintensity-based composites and also for global life satisfaction. This finding is in linewith previous proposals by Diener et al. (2009) and Schimmack and Diener (1997) thatfrequent experiences are important for subjective well-being.
74 J. Smith et al.
Author's personal copy

In this paper, we only reported the frequency-based mixture of positive and negativeexperiences that is analogous to the intensity-based mixture, Net Affect. However,frequency-based proportion scores can also be calculated for other conjunctions offeelings: namely a) only two or more positive and no negative feelings; and b) only twoor more negative and no positive feelings. When watching TV, for example, 31.5 % ofHRS participants reported experiencing some mixture of 2–3 positive feelings. A smallpercent (0.5 %; n=18) reported experiencing only a mixture of 2 or more negativefeelings when watching TV.
The associations of the affect composites reported in this study are consistent withprevious studies of predictors of life satisfaction in older adults (e.g., George 2010) anddemographic associations reported by Bradburn (1969). The gradients of Net Affectand AAC were similar for education and income (see Table 6). Interestingly, inspectionof these gradients reveal that, despite the overall negative association between NetAffect and AAC, higher education and higher income are associated with both higheractivity-related Net Affect and higher affective complexity. This finding provides somesupport for the idea that social advantage is linked to opportunities for a more variedand interesting life (Bradburn 1969: Hamermesh 2005).
Indeed, we found unique associations with education as well as the three healthvariables (self-rated health, number of functional limitations, and depressive symp-toms), after controls for all remaining variables in the regression models. Furthermore,we found that all composites were uniquely associated with sleep quality, a proximalhealth indicator. Given the particular salience of health for well-being in older adultsand the increased likelihood that health problems occur more frequently and interferemore with daily life than is the case for young adults, this finding is plausible.Surprisingly little research to date has examined the proximal context effect of healthor sleep quality on experienced well-being. Instead the focus has been on effects linkedto day-of-the-week. The significant proximal effect for number of activities revealed inthe regression models is consistent with proposals that an active engaged lifestylecontributes to positive well-being.
Limitations
The HRS 2009 measure sampled only a small set of activities and affective experi-ences. We need to learn much more about the validity of these particular activities andfeelings as snapshots of a day’s affective experiences in older adults. Unlike the DRMand the 24-h diary studies of experienced well-being, the short HRS measure providesonly a partial coverage of an individual’s waking hours in a day. It also assumes thatindividual’s categorize activities in similar ways. Although focus groups and cognitivetesting of the HRS pilot measure were conducted in an affiliated project, more work isneeded especially to determine appropriate ways to describe activities such as exercise,health-related activities, managing/spending money, household chores, and computeruse, which occupy time in an older adult’s day. Further research is also needed todetermine specific limitations due both to the restricted set of feelings included in theHRS measure and to the bounded recall and other memory biases involved in remem-bering activity-specific experiences from the previous day (e.g., Bradburn et al. 1987;Tourangeau et al. 2000). For example, in ratings of health-related activities (e.g.,doctor’s visits, treatments), in particular, we may have missed feelings such as fear,
Snapshots of Mixtures of Affective Experiences in a Day 75
Author's personal copy

anxiety, hope, or pain. In the context of other activities, feeling annoyed, irritated,impatient, cheerful, excited, or amused may have been relevant for some older partic-ipants. In addition, unlike previous day reconstruction studies, we did not weight thecomposites of experience for time. The extent that time allocation may contribute todifferences in findings about associations with correlates awaits future research (seealso Diener and Tay 2013).
Future studies should compare the HRS HWB1-SAQ directly with the originalDRM or one of the 24-h day reconstruction measures in a heterogeneous sample ofolder adults and determine effects associated with mode (e.g., paper versus telephone).It will also be important to extend our within-measure of internal reliability with aninvestigation of test-retest reliability over time. Moreover, the present study consideredonly concurrent correlates with health indicators. It will be important to examine long-term associations with these correlates and other outcomes.
Conclusions
Despite these limitations, our findings suggest the potential value of including shortmeasures of experienced well-being in longitudinal panel studies to complementinformation obtained from global indicators of life satisfaction. Furthermore, at thisearly stage in research on experienced well-being in older age groups, it seemsespecially important to consider different ways to aggregate the complexities of bothpositive and negative affective experiences in the context of activities (e.g., Cacioppoand Gardner 1999; Kuppens et al. 2012). Within the day reconstruction context, it willalso be important to examine the effects of activity categories (e.g., leisure, health)together with the extent that they are regular versus novel occurrences and alsoexperiential variations associated with socio-environmental contexts (e.g., time ofday, season, social, geographical).
In sum: We consider that the 2009 HRS pilot provides reliable information aboutexperienced well-being and that our new strategy of summarizing the proportion ofactivities in the day that involved some mixture of positive and negative affectiveexperiences indeed shows promise for survey researchers. It may be especially useful inlongitudinal and cross-national comparative survey research designs because it avoidsthe difficulties associated with response bias and comparability of subjective ratings.
Acknowledgments This work was supported by funding from the National Institute of Aging at theNational Institutes of Health (grant number R01 AG040635). The HRS (Health and Retirement Study) issponsored by the National Institute on Aging (grant number NIA U01AG009740) and is conducted by theUniversity of Michigan.
References
American Time Use Survey (ATUS) (2010). Well-being Module Questionnaire. U.S. Bureau of LaborStatistics and U.S. Census Bureau. Retrieved from http://www.bls.gov/tus/wbmquestionnaire.pdf.
Andrews, F. M., & Withey, S. B. (1976). Social indicators of well-being. New York: Plenum Press.
76 J. Smith et al.
Author's personal copy

Belli, R. F., Stafford, F. P., & Alwin, D. F. (2009). Calendar and time diary: Methods in life course research.Thousand Oaks: Sage.
Bradburn, N. M. (1969). The structure of psychological well-being. Chicago: Aldine.Bradburn, N. M., Rips, L. J., & Shevell, S. K. (1987). Answering autobiographical questions: the impact of
memory and inferences on surveys. Science, 236, 157–161.Cacioppo, J. T., & Berntson, G. G. (1994). Relation between attitudes and evaluative space: a critical review,
with emphasis on the separability of positive and negative substrates. Psychological Bulletin, 115, 401–423.
Cacioppo, J. T., & Gardner, W. L. (1999). Emotion. Annual Review of Psychology, 50, 191–214.Campbell, A., Converse, P. E., & Rodgers, W. L. (1976). The quality of American life: Perceptions,
evaluations, and satisfactions. New York: Russell Sage.Carlson, M. C., Parisi, J. M., Xia, J., Xue, Q.-L., Rebok, G. W., Bandeen-Roche, K., & Fried, L. P. (2012).
Lifestyle activities and memory: variety may be the spice of life. The Women’s Health and Aging StudyII. Journal of the International Neuropsychological Society, 18, 286–294.
Carstensen, L. L. (1993). Motivation for social contact across the life span: A theory of socioemotionalselectivity. In J. E. Jacobs (Ed.), Nebraska symposium on motivation: 1992, developmental perspectiveson motivation (Vol. 40, pp. 209–254). Lincoln: University of Nebraska Press.
Carstensen, L. L., Pasupathi, M., Mayr, U., & Nesselroade, J. R. (2000). Emotional experience in everyday lifeacross the adult life span. Journal of Personality and Social Psychology, 79, 644–655.
Chida, Y., & Steptoe, A. (2008). Positive psychological well-being and mortality: a quantitative review ofprospective observational studies. Psychosomatic Medicine, 70(7), 741–756.
Craik, F. I. M., & Rose, N. S. (2012). Memory encoding and aging: a neurocognitive perspective.Neuroscience & Biobehavioral Reviews, 36(7), 1729–1739.
Diener, E., & Chan, M. (2011). Happy people live longer: subjective well-being contributes to health andlongevity. Applied Psychology: Health and Well-being, 3(1), 1–43.
Diener, E., & Tay, L. (2013). Review of the Day Reconstruction Method (DRM). Social Indicators Research,Published online 01 March 2013.
Diener, E., Sandvik, E., & Pavot, W. (2009). Happiness is the frequency, not the intensity, of positive versusnegative affect. In E. Diener (Ed.), Assessing well-being: The collected works of Ed Diener (pp. 213–231).New York: Springer. Social Indicators Research Series Nr. 39.
Dockray, S., Grant, N., Stone, A. A., Kahneman, D., Wardle, J., & Steptoe, A. (2010). A comparison of affectratings obtained with ecological momentary assessment and the day reconstruction method. SocialIndicators Research, 99, 269–283.
Fratiglioni, L., Paillord-Borg, S., & Winblad, B. (2004). An active and socially integrated lifestyle in late lifemay protect against dementia. The Lancet: Neurology, 3, 343–353.
Fredrickson, B. L. (1998). What good are positive emotions? Review of General Psychology, 2, 300–319.George, L. K. (2010). Still happy after all these years: research frontiers on subjective well-being in later life.
Journal of Gerontology: Social Sciences, 65, 331–339.Hamermesh, D. S. (2005). Routine. European Economic Review, 49, 29–53.Hertzog, C., Kramer, A. F., Wilson, R. S., & Lindenberger, U. (2009). Enrichment effects on adult cognitive
development. Psychology Science in the Public Interest, 9, 1–65.Juster, F. T., Ono, H., & Stafford, F. P. (2003). An assessment of alternative measures of time use. Sociological
Methodology, 33, 19–54.Juster, F. T., & Stafford, F. P. (Eds.). (1985). Time, goods, and well-being. Ann Arbor: University of Michigan
Survey Research Center.Kahneman, D. (2011). Thinking fast and slow. New York: Farrar, Straus, and Giroux.Kahneman, D., Krueger, A. B., Schkade, D. A., Schwarz, N., & Stone, A. A. (2004). A survey method for
characterizing daily life experience: the day reconstruction method. Science, 306, 1776–1780.Kahneman, D., Schkade, D. A., Fischler, C., Krueger, A. B., & Krilla, A. (2010). The structure of well-being
in two cities: Life satisfaction and experienced happiness in Columbus, Ohio; and Rennes, France. In E.Diener, J. F. Helliwell, & D. Kahneman (Eds.), International differences in well-being. Oxford: OxfordUniversity Press.
Katz, S., Ford, A. B., Moskowitz, A. W., Jackson, B. A., & Jaffe, M. W. (1963). Studies of illness in the aged.The index of ADL: A standardized measure of biological and psychosocial function. JAMA, 185, 914–919.
Krantz-Kent, R., & Stewart, J. (2007). How do older Americans spend their time.Monthly Labor Review, 130,8–26.
Krueger, A. B., Kahneman, D., Schkade, D., Schwarz, N., & Stone, A. A. (2009a). National timeaccounting: The currency of life. In A. B. Krueger (Ed.), Measuring the subjective well-being
Snapshots of Mixtures of Affective Experiences in a Day 77
Author's personal copy

of nations: National accounts of time use and well-being (Vol. Ch. 1, pp. 9–86). Chicago:Chicago University Press.
Krueger, A. B., Kahneman, D., Fischler, C., Schkade, D., Schwarz, N., & Stone, A. A. (2009b). Time use andsubjective well-being in France and the U.S. Social Indicators Research, 93, 7–18.
Krueger, A. B., & Schkade, D. A. (2008). The reliability of subjective well-being measures. Journal of PublicEconomics, 92(8), 1833–1845.
Kuppens, P., Tuerlinckx, F., Russell, J. A., & Feldman Barrett, L. (2012) The relation between valence andarousal in subjective experience. Psychological Bulletin, Online First Publication, December 10, 2012.doi:10.1037/a0030811
Lachman, M. E., & Weaver, S. L. (1997). Midlife Development Inventory (MIDI) personality scales: Scaleconstruction and scoring. Unpublished Technical Report. Brandeis University. (http://www.brandeis.edu/projects/lifespan/scales.html).
Larson, R., Zuzanek, J., & Mannell, R. (1985). Being alone versus being with people: disengagement in thedaily experience of older adults. Journal of Gerontology, 40, 375–381.
Lawton, M. P., & Brody, E. M. (1969). Assessment of older people: self-maintaining and instrumentalactivities of daily living. Gerontologist, 9, 179–186.
Lindquist, K. A., & Barrett, L. F. (2008). Emotional complexity. In M. Lewis, J. M. Haviland-Jones, & L. F.Barrett (Eds.), Handbook of emotions (3rd ed., pp. 513–530). New York: The Guilford Press.
Loewenstein, G., O’Donoghue, T., & Rabin, M. (2005). Projection bias in predicting future utility. QuarterlyJournal of Economics, 118, 1209–1248.
Maddala, G. S. (1983). Limited dependent and qualitative variables in econometrics. Cambridge: CambridgeUniversity Press.
Miret, M., Caballero, F. F., Mathur, A., Naidoo, N., Kowal, P., Ayuso-Mateos, J. L., & Chatterji, S. (2012).Validation of a measure of subjective well-being: an abbreviated version of the Day ReconstructionMethod. PLOS One, 7(8), e43887.
Moss, M. S., & Lawton, M. P. (1982). Time budgets of older people: a window on four lifestyles. Journal ofGerontology, 37, 115–123.
Nagi, S. Z. (1976). An epidemiology of disability among adults in the United States. The Milbank MemorialFund quarterly. Health and Society, 439–467.
Powell, K. E., Paluch, A. E., & Blair, S. N. (2011). Physical activity for health: What kind? How much? Howintense? On top of what? Annual Review of Public Health, 32, 349–365.
Pressman, S. D., & Cohen, S. (2005). Does positive affect influence health? Psychological Bulletin, 131, 925–971.
Robinson, J., & Godbey, G. (1997). Time for life: The surprising ways Americans use their time. UniversityPark: The Pennsylvania State University.
Röcke, C., Li, S.-C., & Smith, J. (2009). Intraindividual variability in positive and negative affect over45 days: do older adults fluctuate less than young adults? Psychology and Aging, 24, 863–878.
Rosow, I., & Breslau, N. (1966). A Guttman health scale for the aged. Journal of Gerontology, 21, 556–559.Russell, J. A. (1980). A circumplex model of affect. Journal of Personality and Social Psychology, 39, 1161–
1178.Schimmack, U., & Diener, E. (1997). Affect intensity: separating intensity and frequency in repeatedly
measured affect. Journal of Personality and Social Psychology, 73, 1313–1329.Smith, J., Ryan, L.H., Becker, S., & Gonzalez, R. (2011). New survey measures of time use and experienced
well-being for older adults. Retrieved from http://sites.isr.umich.edu/DNN/Portals/27/Docs/ROBUST%20Bulletin.pdf.
Smith, J., Fisher, G., Ryan, L., Clarke, P. House, J., & Weir, D. (2013). HRS Psychosocial and LifestyleQuestionnaire 2006–2010: Documentation Report. Retrieved from http://hrsonline.isr.umich.edu/sitedocs/userg/HRS2006–2010SAQdoc.pdf.
Steffick, D. E. (2000). Documentation of Affective Functioning Measures in the Health and Retirement Study.Retrieved from http://hrsonline.isr.umich.edu/sitedocs/userg/dr-005.pdf.
Stiglitz, J. E., Sen, A., & Fitoussi, J-P. (2009) Report by the Commission on the Measurement of EconomicPerformance and Social Progress [http://www.stiglitz-sen-fitoussi.fr/en/documents.htm].
Stone, A. A., Schwartz, J. E., Schwarz, N., Schkade, D., Krueger, A., & Kahneman, D. (2006). A populationapproach to the study of emotion: diurnal rhythms of a working day examined with the DayReconstruction Method (DRM). Emotion, 6, 139–149.
Stone, A. A., Schwartz, J. E., Broderick, J. E., & Deaton, A. (2010). A snapshot of the age distribution ofpsychological well-being in the United States. Proceedings of the National Academy of Sciences USA,107(22), 9985–9990.
78 J. Smith et al.
Author's personal copy

Tan, L., Chan, D., & Diener, E. (2013). The metrics of societal happiness. Social Indicators Research,(published, online June 6, 2013).
Tourangeau, R., Rips, L. J., & Rasinski, K. (2000). The psychology of survey response. New York: CambridgeUniversity Press.
Ver Ploeg, M., Altonji, J., Bradburn, N., DaVanzo, J., Nordhaus, W., & Samaniego, F. (Eds.). (2000). Time-usemeasurement and research: Report of a workshop. Washington DC: National Academy Press.
Waidmann, T., & Freeman, V. (2006). The daily activities of the community-dwelling elderly: Evidence fromthe American time use survey. United States Department of Health and Human Services: Office ofdisability, aging and long-term care policy.
Watson, D., & Clark, L. A. (1992). Affects separable and inseparable: on the hierarchical arrangement ofnegative affect. Journal of Personality and Social Psychology, 62, 489–505.
Watson, D., & Clark, L. A. (1994). The PANAS-X: Manual for the Positive and Negative Affect Schedule—Expanded Form. Unpublished manuscript. University of Iowa, Iowa City. Retrieved from http://www.midss.org/content/panas-x-manual-positive-and-negative-affect-schedule.
Watson, D., & Clark, L. A. (1997). Measurement and mismeasurement of mood: recurrent and emergentissues. Journal of Personality Assessment, 68, 267–296.
Watson, D., Wiese, D., Vaidya, J., & Tellegen, A. (1999). The two general activation systems of affect:structural findings, evolutionary considerations, and psychobiological evidence. Journal of Personalityand Social Psychology, 76, 820–838.
Wilson, R. S., & Bennett, D. A. (2003). Cognitive activity and risk of Alzheimer’s disease. Current Directionsin Psychological Science, 12, 87–91.
Wilson, T. D., & Gilbert, D. T. (2005). Affective forecasting: knowing what to want. Current Directions inPsychological Science, 14, 131–134.
Snapshots of Mixtures of Affective Experiences in a Day 79
Author's personal copy