good morning.… · 1 results 2007 john richards – chief executive monday, 25 february 2008 good...
TRANSCRIPT

1
RESULTS 2007John Richards – Chief Executive
Monday, 25 February 2008
Good morning.
I am going to start with a brief overview. Simon Melliss will then cover the results, following which I’ve asked David Atkins to talk about our retail business in the UK before handing back to me.
There are three points I want you to take out of this presentation.
The first is that we have a portfolio of exceptional quality, which is not dependent on one market or sector, and which is enabling us to perform very well at the operating level.
The second is that we can continue to add value by driving the performance of the existing assets and capitalising on our development skills.
The third that is we have a robust balance sheet and continued access to capital.

2
2
PERFORMANCE IN 2007
� Adjusted pre-tax profit £117.3 million + 24.1%
� Adjusted earnings per share 40.3 pence +22.9%
� Total dividend per share 27.30 pence +25.9%
� EPRA NAV per share £15.45 +3.0%
� Return on shareholders’ equity 4.5%
These are the headline numbers.
We showed a strong operating performance in 2007 with adjusted pre-tax profits up by 24% and adjusted earnings per share up by 23%.
As we flagged some time ago, the proposed dividend increase for the full year is just over 25%.
NAV increased by 3.0%.
I think this is a good set of figures in a year when the investment markets became quite challenging, particularly in the last quarter.
To help put these results into context, let me say a few words now about property investment markets

3
3
INVESTMENT MARKETS
Q1 (2 months)
Q4
Q3
Q2
Q1
2008
2007
OfficesRetail OfficesRetail
FRANCE VALUESUK VALUES
This shows the direction of real estate values our markets. In the UK, values were generally up in the first half. However last Spring there were already indications that the investment market was slowing; purchasers were fewer and more selective.
We then hit the financial storm of last summer. The withdrawal of money from funds and the reluctance of banks to lend resulted in a sharp fall in values in the last months of the year. In broad terms, prime investment yields increased by about 50 basis points in the second half, implying a fall in values of around 10%. And there has been further weakness in the first two months of this year.
In France, by contrast, the investment markets remained healthy throughout 2007, with the market registering its strongest capital returns for several years Since the year end have we seen signs that activity in the Paris office market is slowing but valuations have been stable.
How did we perform? Simon will comment in detail on the portfolio performance in a few minutes. But in broad terms we did better than the market in the UK. We benefited from increased rents and rental values and from owning only prime assets.
In France, we also out-performed. Our five major shopping centres all showed total returns of over 20%.

4
4
STRATEGY SUITED TO CURRENT ENVIRONMENT
� Focus on two European markets and two sectors
� Selective disposals and reinvestment
� Active asset management to secure rent reviews and renewals
� Complete and let current developments
� Advance future development projects
In the light of these more challenging market conditions we haveinterrogated our strategy.
I believe the right answer is to continue to focus on two sectors, retail and offices, in both the UK and France. The out performance we have shown in 2007 demonstrates the benefits of this strategy.
We shall continue to continue to seek to enhance returns by selling more mature assets and reinvesting in new opportunities.
We shall drive the income line by active asset management.
We shall continue to use our development skills to generate capital profits and attractive yields on cost from newly created assets.
Before handing over to Simon, I’d like us to have a quick look at the shape of our portfolio…

5
5
Total portfolio: £6.7 billion
As at 31 December 2007
UK Shopping Centres 32%
UK Offices 22%
France Retail 23%
Average unexpired lease term 10.5 years
Occupancy rate 98.2%
Investment portfolio 6.6% reversionary
PORTFOLIO
Total portfolio: £7.3 billion
UK Retail Parks 17%
France Offices 5%
Germany Retail 1%
It is a portfolio of the highest quality. It provides a robust income stream from a broad spread of tenants and provides the potential for substantial growth in both income and capital.
Five of our six current developments complete this year and one in 2009. The estimated total cost of the six projects is £950 million and the projected yield on cost is 7.9% - these are profitable schemes.
Together with our pipeline of future schemes, that provides a very good base from which to take the business forward.
Now … over to Simon.

6
Simon Melliss
FINANCIAL REVIEW

7
7
NET RENTAL INCOME
Properties owned throughout 2007 and 2006 211.6 197.1
Acquisitions 22.5 6.7
Properties sold 7.0 21.8
Developments 32.4 10.6
Exchange translation and other 2.2 1.2
Net rental income 275.7 237.4
2007
(£ million)
2006
This slide compares rental income for last year with 2006. On the top line you will see that for properties owned throughout the two years income increased by £14.5 million, or 7.4% to £211.6 million. Like-for-like growth in the UK was 6.6% and in France 8.9%.
The income from developments, £32.4 million in the year, included £26 million from Bishops Square.

8
8
INCOME STATEMENT
Adjusted earnings
ReportedAdjusted earnings
Reported
2006
(£million)
2007
(£million)
117.3
(5.0)
(28.3)
39.8
(3.8)
-
(9.6)
110.4
(16.4)
17.6
(10.6)
101.0
94.5
-
-
-
-
-
-
94.5
1.0
-
-
93.5
94.5
664.8
(34.0)
95.8
(16.1)
(12.6)
-
792.4
(99.4)
333.8
(9.9)
1,016.9
117.3
-
-
-
-
-
-
117.3
(0.7)
-
-
116.6
Adjusted profit before tax
Losses on revaluation of properties
Bond redemption costs
Profit on sale of properties
Fair value of swaps
Goodwill impairment
Provisions and investment impairment
Profit before tax
Current tax
Deferred tax
Minority interests
Profit for the period
32.8
21.68
40.3
27.30
Adjusted EPS (pence)
Dividend per share (pence)
Profit before tax was £110 million, a decline of £682 million from 2006, reflecting the change in the investment property revaluation from a large increase in 2006 to a small deficit in 2007.
Excluding this revaluation and other exceptional items adjusted profit before tax increased by £23 million or 24% to £117.3 million. The main reasons for this increase were: disposals and acquisitions of £12 million; rent reviews in the UK and indexation in France of £12million; and income from new leases of £9 million.
These were partly offset by increased interest rates £5 million and higher overheads, also of £5 million.
The total dividend for 2007 is 27.3 pence, up 26% on last year.

9
9
CASH FLOW
62(119)Net cash flow before financing
119(17)Investing cashflows
(9)(11)Investments
628537Disposals
(280)(380)Capital expenditure
(220)(163)Acquisitions
(54)(95)Other cash flows
(5)-Other
(17)(67)REIT/SIIC entry payments
(32)(28)Bond redemption costs
(58)(73)Dividends
5566Operating cashflows
(4)(5)Current tax
(112)(137)Net Interest
171208Cash generated from operations
2007
£m
2006
£m
In 2007, there was a cash outflow before financing of £119 million, of which £64 million was financed by the issue of shares.
During the year we paid £67 million of the REIT and SIIC conversion charges with a further £50 million to be paid in 2008.
Capital investment was financed by property disposals.

10
10
BALANCE SHEET
4,1654,355Equity shareholders’ funds
(103)(100)Deferred tax
(205)(324)Other net liabilities
(2,243)(2,496)Net debt
4,2684,455
6,7167,275Property Assets
EPRA NAV per share £15.45 £15.00 Gearing 57% 54%
31 Dec 2007 31 Dec 2006
(£ million)
Reflecting the cash flow changes, net debt rose to £2.5 billion. Gearing increased marginally to 57% at the end of the year.
Net asset value per share was up by 3.0% to £15.45. At the30 June the group’s NAV was £16.35. To understand the movements, I think it is helpful to look separately at the valuation movements in the first half and second half of the year.

11
11
COMPONENTS OF VALUATION CHANGE - UK
-500
-400
-300
-200
-100
0
100
200
300
H1 2007 H2 2007
Change in valuation yields Income and rental value growth
Other movements Total
£ million
The movement in the first half is shown here. Values increased by just under £200 million, with 60% of that increase coming from increased income and rental values.
By contrast in the second half, values fell by £400 million. Without growth in income and rental values that fall would have been £475 million.
So overall we saw an underlying valuation decline in the UK of around £200 million.

12
12
COMPONENTS OF VALUATION CHANGE - FRANCE
-50
0
50
100
150
200
250
H1 2007 H2 2007
Change in valuation yields Income and rental value growthOther movements Total
£ million
By contrast in France values increased throughout the year. In the first half this was primarily due to lower yields whilst in the second half income and rental value growth added £83 million of value.
Overall, values increased by around £300 million in France.

13
13
CAPITAL RETURNS
8.388----8.388Germany
1.67,2751.02,020(5.8)1,3604.83,895Total
(11.9)
(5.1)
Return%
135
1,225
Value£m
Retail Parks
19.4
(2.6)
Return%
16.52,05714.63951,527France
(3.2)5,130(2.2)1,6252,280UK
Return %
Value£m
Return %
Value£m
Value £m
TotalOfficesShopping Centres
Year to 31 December 2007
So, bringing that together and looking at the year as a whole, the portfolio produced a total return of 5.4% and capital growth of 1.6%.
In France the capital growth was just over 16% , whilst in the UK there was a decline of 3%.
The relatively modest decline in the UK undoubtedly reflects thequality of the assets and the resilience of our regional shopping centres.
For Hammerson overall, the fall in value from increased yields was more than offset by rental growth and income growth.

14
14
FINANCING
� New £340 million five-year bank facility signed April 2007
� Redemption of the £106 million 10.75% 2013 bonds in July/Sept 2007
� 66% of borrowings were at fixed rates at 31 Dec 2007
� Weighted average maturity of debt approximately nine years
� Cash, deposits and undrawn facilities of £590 million at 31 Dec 2007
Turning now to financing. During 2007 we concluded one new bank facility and redeemed the remaining 10.75% 2013 bonds. At the end of the year, two thirds of our borrowings were at fixed rates of interest. Our cost of debt is now running at 5.9% per annum.
The financial markets remain difficult. For real estate borrowing margins have increased; few, if any, asset securitisations have happened since last Summer and the corporate bond market is dormant.
Accordingly, new finance at the moment has to come from the banking market where covenants are tighter and margins higher.
Against this background I am pleased to say that Hammerson is extremely well positioned.
At the end of December, Hammerson had cash and borrowing facilities available of £3.1 billion giving unused committed financial facilities of just under £600 million.

15
15
DEBT AND FACILITY MATURITY PROFILE – 31 DEC 2007
0
100
200
300
400
500
600
2008 2010 2012 2014 2016 2018 2020 2022 2024 2026 2028
Euro bonds Other debt Sterling bonds Bank debt drawn
£ million
This is the debt maturity chart at 31 December 2007.
We have a €500 million bond maturing in June this year. We have no further significant maturities until 2012.
Since December we have arranged new bank facilities of £300 million and a further £450 million is in negotiation. Accordingly, taking account of the unutilised facilities at December and these new arrangements, Hammerson is in an extremely strong financial position.

16
16
FINANCIAL SUMMARY
� Good underlying profit growth in 2007
� Valuations benefited from performance in France and income growth
� Strong financial position
2007 saw strong growth in our underlying profits.
The effects of adverse market conditions were mitigated by the excellent returns from our French business and by rental income uplifts.
We are in a strong financial position.

17
RETAIL - UK
David Atkins
I’m going to provide you with a review of Hammerson’s UK retail portfolio in 2007.
In particular, I will focus on the occupational and development aspects of the portfolio and where the Company performed very robustly during a difficult trading year.
But first by way of context, I will say a few words about the UK retail occupier market in general.

18
18
UK RETAIL MARKET
� Increase in retail spending of 4.2% overall in 2007
� Consumer confidence reduced in Q4
� Conditions for retailers remain challenging
� Continued rental growth forecast for best locations
� Retailers seeking high footfall and/or low cost modern space
On the face of it a pretty good year with consumer spending growing by a very respectable 4.2%. However, underlying profits for our retailers remain subdued at best.
Consumer confidence: Household finances were squeezed. With increased utility, fuel and mortgage costs, consumer confidence fell towards the end of the year. I anticipate this trend to continue in the short term leading to an equally challenging outlook for retailers in general over the same period.
Hammerson’s experience though is that retailers need to be in the high footfall locations - the dominant regional malls and the relatively low cost large flexible space offered by retail parks. And that will generate continued, albeit more modest, rental growth over the next12 – 18 months.
As you will see in a moment, our existing assets remain virtually fully let and our new developments are letting up very well. In fact, we saw greater letting activity in Q4 last year than in the previous three quarters. John and Simon covered earlier the current inertia in the capital markets but this, in our experience, has not translated into the occupier markets.
Let me illustrate the impact of this continuing tenant demand further.

19
19
Nominal index (2000=100)
100
105
110
115
120
125
130
135
140
145
2000 2001 2002 2003 2004 2005 2006 2007
Non-food retail sales Shopping centre rents WestQuay Retail warehouse rents
UK RETAIL SALES AND RENTS – WEST QUAY PERFORMANCE
Source: PMA/Hammerson
As this chart shows, average growth in shopping centre rents hasover the medium term broadly tracked the growth in non food retail of just over 3% p.a.
Out of town, a combination of strong tenant demand and restricted supply has resulted in stronger retail growth of around 4.5% p.a.
The dominant regional malls have though faired even better. Asillustrated by WestQuay, producing rental growth of around 5% p.a. during this period.

20
20
UK SHOPPING CENTRE UPDATE
� 31% of total portfolio
� Occupancy 99%
� Like-for-like income growth 3.1%
� Portfolio 7.4% reversionary
� Diversified tenant base
� Average unexpired lease term 10 years
Now turning to Hammerson’s shopping centre portfolio.
We currently have major interests in five of the top 30 retail destinations in the UK.
Our established regional centres are effectively fully let with only 10 units vacant, and these can be attributed largely to the vacancy we create by asset management initiatives. This in turn led to like-for-like income growth in 2007 of just over 3%. The portfolio is currently 7.4% reversionary. With this low level of vacancy letting incentive packages on average remained static at around 3 - 6 months depending on the scheme, although I anticipate this may increase marginally in the coming year.
The portfolio has a diversified and secure tenant base which attracts the best retailers, not only from the UK but also internationally. 25% of our new lettings are with overseas retailers.
By way of a few examples, last year we signed the first Holister unit in the UK, part of the Abercrombie & Fitch Group, and we’re currently close to signing a second. That is compared to their initial UK requirement for only five units. We recently signed our fifth unit with Apple, which has only 15 stores nationally.
Now, let’s turn to our developments

21
21
CABOT CIRCUS, BRISTOL
� 92,000m² retail/leisure scheme
� 50:50 JV with Land Securities
� Anchored by House of Fraser and Harvey Nichols
� Completion Sept 2008
� Estimated costs £245 million
� Projected income £18 million
� 78% let or under offer
Firstly, Cabot Circus, Bristol, the 92,000 m² retail led mixed use scheme, in a 50:50 joint venture with Land Securities, which will open in September this year.
The major construction works are now nearing completion as we move into the tenant fit out stage.
78% of the forecast rental income has now been secured. We have attracted some of the best UK and international fashion brands.Urban Outfitters, Reiss, Cruise, Ben Sherman and Ted Baker, to name a few. We have an exciting and varied catering offer, whichincludes Carluccio’s, Yo Sushi, Giraffe and Raymond Blanc’seponymous Brasserie.
At the same time rent free and capital contribution packages increased in the first half of the year for our developments from around 14 months to 18 months, but remained unchanged in the second half of the year.
On completion, Cabot Circus will firmly re-establish Bristol as a top ten UK retail destination.

22
22
HIGHCROSS, LEICESTER
� 61,000m² extension
� Totalling 100,000m² on completion
� 60:40 JV with Hermes
� Anchored by John Lewis
� Completion Sept 2008
� Estimated costs £210 million
� Projected income £12 million
� 68% let or under offer
In Leicester, the anchor store at the Highcross development has been handed over to John Lewis on schedule for fitting out, along with the Cinema de Lux shown here.
The scheme is a 60:40 joint venture with Hermes and just under 70% of the target income of £12 million has been secured or is in solicitors’hands. The shopping centre extension is again scheduled to open in September this year – not on the same day as Bristol I hasten to add!
When complete, the project will more than double the size of theexisting Shires centre, which itself is also undergoing a complete refurbishment. This will drive rental growth from the existing retail units.

23
23
UNION SQUARE, ABERDEEN
� Mall/open retail scheme totalling 49,000m²
� Estimated total development cost £245 million
� Projected income £16 million
� Completion Oct 2009
� 25% let or under offer
This is Union Square, Aberdeen, a city benefiting from the surge in oil and gas revenues but which has suffered from a very poor retail offer. The development on a nine hectare site adjacent to Aberdeen railway station will provide 49,000 m² of space, including retail units, leisure and catering in a part covered mall, part retail park configuration, a 200 bedroom hotel and 1,700 car parking spaces.
The scheme will be completed in October 2009 and 25% of the space is let or in solictors’ hands.

24
24
UK RETAIL PARKS UPDATE
� 17% of total portfolio
� Occupancy 97.8%
� Average unexpired lease term 15 years
� Like-for-like income growth 1.5%
� Portfolio 15% reversionary
� Planning consents secured for 33,000 m² of new space
� Plans progressed for a further 61,000 m² of developments
We made good progress with our retail parks business against a weakening occupier environment.
We signed 28 leases amounting to £6.3 million of annual rental income. As a result vacancy fell during the year to just over 2% and the portfolio has an average unexpired lease term of 15 years.
Rents grew on a like-for-like basis by 1.5% during the year but still remain at an average of only £17/ft², providing good scope for further growth.
This is reinforced by the fact that around 70% of the space has an open A1 or restricted open A1 planning consent, allowing us to attract high street retailers and maintain strong levels of demand.
Furthermore, I anticipate strong growth in future income arising from extensions and new developments.
During the year we achieved planning consents for 33,000 m² of new space and progressed plans for a further 61,000 m².
Let me provide a little more detail on a couple of these projects.

25
25
VICTORIA RETAIL PARK, NOTTINGHAM
This is Victoria retail park, Nottingham. In 2006, we downsized the B&Q, re-letting the space to Argos and Next, increasing rents from £14.50/ft² to £18/ft².
In 2007 we secured planning consent for 50,000/ft² of space and increased rents to £22 /ft²– a rise of 50% in two years.
26
26
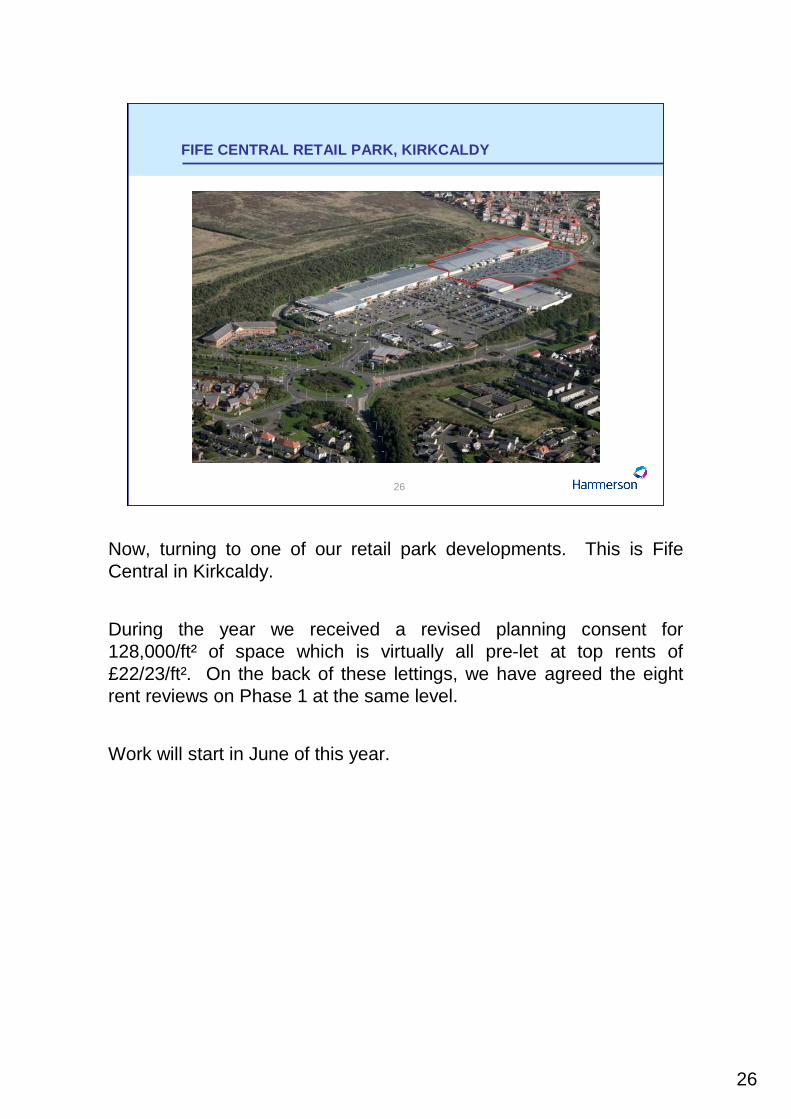
FIFE CENTRAL RETAIL PARK, KIRKCALDY
Now, turning to one of our retail park developments. This is Fife Central in Kirkcaldy.
During the year we received a revised planning consent for 128,000/ft² of space which is virtually all pre-let at top rents of £22/23/ft². On the back of these lettings, we have agreed the eight rent reviews on Phase 1 at the same level.
Work will start in June of this year.

27
27
UK RETAIL SUMMARY
� Prime assets in best performing retail sub-sectors
� Robust income stream
� Strong growth potential in retail parks
� Two new top 30 retail schemes completing in 2008
So, in summary, whilst the outlook for retail looks challenging over the short term, I believe Hammerson’s prime portfolio will continue to generate rental growth, albeit at reduced levels from recent years.
Our existing centres are almost fully let and provide a robust income stream.
Our parks portfolio provides the opportunity to generate good income growth from extensions and favourable planning consents and we have two top 30 shopping centre completions this year.

28
28
FRANCE
John Richards
A few words now on our French business.
2007 was the year we said goodbye to 9 place Vendôme in Paris, the building shown on this slide. A joint venture with AXA, we completed it in 2006 at a total cost to Hammerson of £90 million. We sold it in July on a yield of 3.4 % with our share of the proceeds amounting to £207 million. It showed a profit on our costs of 130%.

29
29
TOP TEN PROPERTIES
(5)
3
24
3
(1)
10
20
21
22
22
%
Total return 2007
%£m£m
597
394
361
313
280
275
275
246
213
197
Valuation 31/12/07
(1)
100
100
99
100
99
100
88
100
96
100
34.1
17.7
15.8
15.6
13.6
13.5
12.4
10.3
9.8
9.1
Bishops Square, London E1
Brent Cross, London NW4
Italie 2, Paris 13ème
Bullring, Birmingham
WestQuay, Southampton
The Oracle, Reading
Les 3 Quartiers, Paris 1er
Parinor, Paris (excl. extension)
Espace St. Quentin, St Quentin-en-Yvelines
Les 3 Fontaines, Cergy-Pontoise
Let by
Income(3)
Passing rent
(2)
Notes
(1) 1) Hammerson’s share of valuation and passing rent shown in respect of joint ventures(2) 2) Passing rents are post rent free periods
(3) 3) Percentage let or under offer at 31 December 2007
This slide shows our top ten properties by value. As you can seefive of them are shopping centres in France These five assets have an aggregate value of £1.3 billion around two thirds of our French business. Last year each one of them showed a total return in excess of 20%.

30
30
FRENCH RETAIL OCCUPATIONAL MARKET
� Real retail spending grew 2.7% in 2007
� Consumer confidence declined in second half
� Good demand for space in best centres
� Limited supply of new shopping centre space
� Continuing growth in ERVs anticipated
� Benefits of indexation
In France, there was an improvement in consumer confidence following the Presidential elections in May. We saw an upturn in consumerspending. However, consumer confidence fell in the second half of 2007.
But this is a long term business. Retailers are continuing to look for space in the best retail destinations and there are few new schemes being built. Historically planning in France for retail schemes has been very tight. Most of the new space coming on stream is extensions to existing centres.
I believe that we will see continuing growth in ERVs over the next 18 months or so and we shall continue to benefit from indexation.
Let me give you an example of our ability to add value in this sector.

31
31
PARINOR EXPANSION, PARIS
� 24,000 m² retail redevelopment
� Phased completion Apr/ Sept 2008
� Parinor will total over 90,000 m²
� Estimated development cost £80 million
� Projected income £7 million
� 82% let or under offer
We acquired Parinor in 2002 and have since made major improvements to the tenant mix and increased rental values.
Last year we started work on a major expansion programme that will increase Parinor’s size to 90,000 m², making it one of the largest shopping centres serving the north of Paris.
Retail leasing is well advanced. 82% is let or under offer at rents well ahead of our original appraisal. The expansion is also having a beneficial effect on rental values throughout the scheme, enhancing the returns from the existing asset.
Beyond Parinor, we are also working up improvement programmes at three of our other centres: Italie 2; Les 3 Fontaines; and Espace St Quentin.

32
32
PARIS OFFICE OCCUPATIONAL MARKET
� Paris office market remained strong in 2007
� Broad demand both from private and public sector occupiers
� Increase in prime CBD headline rent to c. €750/m²
� CBD vacancy currently at low of 3.3%
2007 saw continuing demand from a broad range of occupiers. Prime rents increased by over 7% to around €750/m².
Supply is very constrained in the CBD and the vacancy level is now only 3.3%.
Paris has a broad occupier base and is not so dependent on the financial services sector as London. However, it will show more volatility than retail, so as we go through the cycle, we should be able to identify some new opportunities in this sector.

33
OFFICES - UK
John Richards

34
34
CITY OF LONDON OFFICE OCCUPATIONAL MARKET
� Take-up in first half of 2007 at strongest level since 2000
� Rental growth to c.£65/ft² for prime space
� Take-up dampened in Q4
� City vacancy rate 3.5% at 31 Dec 2007
� Development completions to peak in 2009
� London employment forecast to continue long-term growth
In the first half, we saw the highest level of take up of space since 2000 leading to strong growth in rental levels to around £65 per sq ft for prime space.
Demand continued into the second half but slowed down with the emerging problems in the banking system in the late Summer.
The vacancy rate in the City for Grade A space was only 3.5.% at the year end.
But more space is coming to market over the next two years, so rental values will probably come off a bit.
Longer term, the central London office market should benefit from the City’s dominance as an international financial centre and London’seconomy and key employment drivers continue to be well set to support sustainable growth.

35
35
UK OFFICE PORTFOLIO UPDATE
� 22% of total portfolio
� Occupancy 99.7%
� Like-for-like rental growth of 18%
� Portfolio 3.1% reversionary
� Unexpired lease term 14 years
Our UK office investment portfolio, which is 22% of the total portfolio, is now almost fully let, with just a small vacancy at Exchange Tower in Docklands.
The income is very secure.
Our only letting exposure is to the two current office developments in the City.

36
36
125 OLD BROAD STREET, LONDON EC2
� Offices – 29,700m²
� Retail – 1,200m²
� Completion April 2008
� 50% interest sold Nov 2006 for £75 million
� Hammerson’s total development costs £45 million
� Hammerson’s projected annual income £10 million
� 40% under offer
125 Old Broad Street, the site of the former London Stock Exchange tower is nearing completion.
Our sale of a 50% interest in the project in November 2006 for £75 million crystallised a profit on cost of £46 million. Effectively this means that for our remaining 50% share, our costs will amount to only £45 million. The projected rents will provide a very attractive income return of 20%.
We are making progress with the letting. Three floors (levels 13-15) totalling 3,000m² have been let to the French law firm Gide at £60/ ft², with a 23 months rent free period.
The lower six floors totalling 9,300 m² are under offer and expected to exchange shortly.
We are continuing to see good interest for the remaining 17,700 m².

37
37
60 THREADNEEDLE STREET, LONDON EC2
� Offices – 19,400m2
� Retail – 1,200m2
� Completion Nov 2008
� Total development costs £125 million
� Projected annual income £12 million
The other major City development is 60 Threadneedle Street, which is adjacent to 125 Old Broad Street. We have 100% ownership. This is a nine-storey office building which will provide the best quality accommodation in one of the best locations in the City.
Because of our low land cost our projected yield on cost is nearly 10%.
We have seen some letting interest but I don’t expect a lease to be signed in the first half of this year.
Looking further ahead…

38
FUTURE DEVELOPMENTS
I’d like to turn now to some of the schemes in our development pipeline.
This pipeline provides the potential for the group to invest around £6 billion over the next ten years.
To date we have invested around £240 million in securing these opportunities and they generate an income of around £4 million per annum. That relatively modest outlay has effectively secured us some extremely attractive potential developments in both the retail and office sectors.

39
39
SEVENSTONE, SHEFFIELD
� 105,000m2 retail-led mixed use
� Hammerson interest 100%
� Planning consent granted August 2006
� Anchored by John Lewis
In Sheffield we have planning consent, John Lewis is confirmed as anchor and we are seeing very good interest from other retailers in a city centre which has suffered from a lack of retail provision over the last 20 years.
Enabling works are nearly complete and we are awaiting a CPO decision later this year.
This will allow us to conclude further pre-lettings and finalise our programme for the development.

40
40
EASTGATE & HAREWOOD QUARTERS, LEEDS
� 122,000m2 retail-led mixed-use
� Hammerson interest 90%
� Planning consent secured 2007
� Anchored by John Lewis and Marks & Spencer
In Leeds, the Council granted planning consent for our 122,000m²shopping centre last year. The scheme isanchored by a 17,900m²Marks & Spencer and a 26,000m² John Lewis and we’ve got interest from other large space users.
We are confident this will establish the scheme as the prime retail location. We now own the majority of the site and have completed the compulsory purchase inquiry which will enable the remainder to be acquired.
On both Sheffield and Leeds the timing of the start will be once site ownership and letting is further progressed.

41
41
BISHOPS PLACE, LONDON E1
� 1 hectare site north of BroadgateTower
� Planning application submitted 2007
� 100,000m² mixed use scheme
� Includes 60,000m² of offices
� Hotel and 300 residential units
And finally in London, Bishops Place.
We have an existing consent for around 100,000 m² of offices on this site but we think it can be improved on. A new planning application was submitted at the end of last year for a mixed-use scheme of around 100,000 m², including 60,000m² of offices, a hotel and residential units.
We expect a planning decision in March and then we can decide the best way forward. In this market we are unlikely to start without a pre-let.
I should also mention our scheme to develop a new European headquarters for JP Morgan Chase. We are working with our partner, the City of London to create a building of around 90,000m² on the site of St Alphage House. We aim to submit a planning application in the next few months, with a start on site next year. The deal structure envisages that JP Morgan Chase will own the building and we will receive fees for the development management role.

42
42
SUMMARY
Perhaps I could explain why I believe that the outlook for Hammerson remains attractive.

43
43
ADDITIONAL CONTRACTED INCOME
0
5
10
15
20
25
30
35
40
2008 2009 2010 2011
UK shopping centres UK retail parks France retail
£ million
Notes:
(1) Hammerson’s share of income shown for joint ventures(2) The bar chart shows rent receivable and not income smoothing under IFRS
We have substantial new contracted income – around £22 million of additional annual rent next year, rising to £35 million in 2011.
Over and above this, there is a further £50 million of income, which has not yet been secured, to come from the existing developments.
I am therefore very confident of continued strong income growth over the next few years.

44
44
HAMMERSON UK PERFORMANCE vs IPD
-10
-5
0
5
10
15
20
25
1998 1999 2000 2001 2002 2003 2004 2005 2006 2007
Hammerson UK IPD Annual Universe
%
Hammerson average 13.2%
IPD average 11.6%
IPD: - 2007 Total Returns on the IPD Quarterly Index Benchmark for all properties including transactions and developments.
We are also continuing to outperform in both the UK and France. We now outperformed IPD for nine out of the last 10 years in the UK on average by 160 basis points.
And in France we have beaten the benchmark over the five years that data has been available from IPD by 80 basis points on average.
I think that demonstrates exceptionally good performance.

45
45
SUMMARY
� Strong rental and earnings growth in 2007
� Robust income stream from high quality investment portfolio
� Attractive current development programme
� Strong balance sheet and access to capital
� Development pipeline provides potential for future growth
In summary, we showed a strong operating performance in 2007.
Our retail and office assets are of the highest quality and provide a robust and growing income stream.
There is more value to come from our current developments as they are completed and let.
We have a strong balance sheet and access to capital.
We are operating in somewhat uncertain markets. However, I am confident that we have the portfolio and the people to continue to out-perform.

46

47
APPENDICES

48
48
CAPITAL ALLOCATION AND RECYCLING
-600
-400
-200
0
200
400
600
800
1000
2003 2004 2005 2006 2007
Existing portfolio Developments Acquisitions Disposals
£million

49
49
NAV ANALYSIS
31 December 2006 4,286 15.00
Revaluation – equity changes 77 0.27
– income changes (5) (0.02)
Retained profit (excluding revaluations and bond redemption) 117 0.40
Bond redemption (28) (0.10)
Dividend (79) (0.27)
Issue of shares for acquisition 79 -
Exchange and other movements 27 0.17
31 December 2007 4,474 15.45
Shareholders’funds*
(£ million)
EPRA NAV* (£ per share)
* Excluding deferred tax and fair value of derivatives

50
50
NET ASSET VALUE (NAV)
15.45EPRA NAV
15.06Diluted NAV
0.11Effect of exercise of options and ESOP shares
15.29EPRA triple net NAV
0.05
0.34
Fair value of derivatives
Deferred tax
14.95Basic NAV per share
As at 31 December 2007£ per share

51
51
EARNINGS PER SHARE
40.3Adjusted EPS
1.8
(13.7)
1.3
(6.1)
6.1
2.9
9.8
3.3
Revaluation movement on properties
Profit on disposal of investment and development properties
Change in fair value of derivatives
Deferred tax
Tax on property disposals
Minority interests in respect of the above
Bond redemption costs
Provisions and impairment
34.9Diluted EPS per income statement
Pence per shareYear ended 31 December 2007

52
52
RENT REVIEWS
14.4
158.2
143.8
Total
£m
4.63.23.13.5Potential rent increases
72.225.824.236.0Projected rent after review at current ERV
67.622.621.132.5Rents passing from leases subject to review
2010
£m
2009
£m
2008
£mOutstanding
£m

53
53
LEASE EXPIRIES AND BREAKS
6.0
56.4
50.4
Total
£m
1.4
15.8
14.4
2010
£m
2009
£m
2008
£m
0.24.4Potential rent increases
9.830.8Current ERV
9.626.4Rents passing from leases subject to expiries or break

54
54
ADDITIONAL CONTRACTED INCOME
6.55.95.23.8Shopping Centres - France
1.91.91.0-Retail Parks - France
5.09.4
-
1.2
2008£m
4.94.92.5Retail parks - UK
21.328.5
12.6
2009 £m
34.733.6
32.633.6
Total - cash flow- accounting basis
21.419.9Shopping centres - UK
2011£m
2010 £m
Rents Passing
Note: Figures show Hammerson’s share of the income in respect of joint ventures.

55
55
CURRENT DEVELOPMENTS
Notes(1) Capital costs including capitalised interest(2) Cost shown net of disposal profit of £46 million arising in 2006(3) Hammerson share of costs, value and income for joint ventures
541
59
25
54
88
137
178
Cost to 31/12/07
£m(1)
Nov 2008
Apr 2008
Sep 2008
Oct 2009
Sep 2008
Sep 2008
Forecast completion
date
75
12
10
7
16
12
18
Estimated annual income
£m
41
-
-
82
25
66
75
Let at19/02/08
%
768
84
128
109
87
162
198
Value at 31/12/07
£m
24515749,000100Union Square, Aberdeen
452030,90050125 Old Broad Street, London EC2(2)
950409TOTAL
Retail
66
26
73
67
Cost to complete
£m(1)
8024,000100Parinor Extension, Aulnay-sous-Bois
20,600
61,000
92,000
LettableAream²
12510060 Threadneedle Street, London EC2
24550Cabot Circus, Bristol
Offices
210
Forecast total cost
£m(1)
60Highcross, Leicester
Ownership interest
%

56
56
FUTURE DEVELOPMENT PIPELINE
Major retail-led schemes
� Brent Cross, Cricklewood, NW London
� Central Area, Milton Keynes
� Eastgate Quarter, Leeds
� Kingston-upon-Thames
� Martineau Galleries, Birmingham
� North Westgate, Peterborough
� Sevenstone, Sheffield
� Swansea city centre
Offices
� Bishopsgate Goodsyard, London E1
� Bishops Place, London E1
� Paddington Triangle, London W2
� Shoreditch High Street, London E1
� Victoria, London SW1
Retail parks
� Abbey Retail Park, Belfast
� Fife Central Retail Park, Kirkcaldy
� Manor Walks, Cramlington
� Nice Lingostière, Nice
� Parc Tawe, Swansea
� The Orchard Centre, Didcot
Retail extensions
� Espace St Quentin, St Quentin-en-Yvelines
� Italie 2, Paris
� Les 3 Fontaines, Cergy Pontoise
� WestQuay III, Southampton

57
57
UK SHOPPING CENTRE EQUIVALENT YIELDS
0.0%
1.0%
2.0%
3.0%
4.0%
5.0%
6.0%
7.0%
8.0%
9.0%
Dec-00 Dec-01 Dec-02 Dec-03 Dec-04 Dec-05 Dec-06 Dec-07
0.0%
0.5%
1.0%
1.5%
2.0%
2.5%
Prime (LHS) Secondary (LHS) Difference (RHS)
Source: CBRE

58
58
DISCLAIMER
This presentation contains certain statements that are neither reported financial results nor other historical information. These statements are forward-looking in nature and are subject to risks and uncertainties. Actual future results may differ materially from those expressed in or implied by these statements.
Many of these risks and uncertainties relate to factors that are beyond Hammerson's ability to control or estimate precisely, such as future market conditions, currency fluctuations, the behaviour of other market participants, the actions of governmental regulators and other risk factors such as the Company's ability to continue to obtain financing to meet its liquidity needs, changes in the political, social and regulatory framework in which the Company operates or in economic or technological trends or conditions, including inflation and consumer confidence, on a global, regional or national basis.
Readers are cautioned not to place undue reliance on these forward-looking statements, which speak only as of the date of this document. Hammerson does not undertake any obligation to publicly release any revisions to these forward-looking statements to reflect events or circumstances after the date of these materials. Information contained in this presentation relating to the Company or its share price, or the yield on its shares, should not be relied upon as a guide to future performance.

59