good news from the dump - clean air task force (catf) · good news from the dump ... moreover,...
TRANSCRIPT

1
Good News From the Dump Methane Emissions from Solid Waste: Current Conditions and Future Prospects ELAINE MATTHEWS DECEMBER 2012

2
Founded in 1996, the Clean Air Task Force is a nonprofit organization dedicated to restoring clean air and healthy environments through scientific research, public education, and legal advocacy.
This paper was written by Elaine Matthews, a consultant to the Clean Air Task Force, following a joint project between CATF and NASA's Goddard Institute for Space Studies (GISS). Elaine has worked at GISS since the early 1980s, and began research on the global methane cycle in the mid-1980s estimating global methane emissions from anthropogenic and natural sources including fossil fuel production, processing and consumption, rice cultivation, ruminant animal husbandry, termites and natural wetlands. Her recent work has focused on future methane emissions and mitigation strategies and plausible projections appropriate for policy studies. MAIN OFFICE 18 Tremont Street Suite 530 Boston, MA 02108 617.624.0234 [email protected] www.catf.us

3
Executive Summary
Overview
Estimates of recent historical and future methane emissions from solid waste rely
primarily on one of the methodologies promoted by the Intergovernmental Panel
of Climate Change (IPCC). One approach is a First Order Decay (FOD) model
appropriate for individual landfills as well as whole countries but that requires
substantial multi-decadal landfill data including amount of waste in place,
management and waste composition. The more commonly used is a simpler
approach initially outlined in IPCC (1996) that relies on country-specific or
default values for a series of variables to calculate solid waste produced,
landfilling and anaerobic landfilling rates, carbon content of waste, methane
fraction of gas produced, and methane capture, oxidation and emission. Studies
based on the latter IPCC approach report global methane emissions from landfills
to be ~35 Tg (1012g) CH4/year although several researchers report values as low
as ~10 Tg CH4/yr as well as methodological and data-based explanations why the
higher values may be overestimates.
Studies that predict future methane emissions from solid waste universally
indicate that emissions from developing countries will rise dramatically (by a
factor of 3-4 by 2030) due to: 1) large population increases, especially in cities
with higher per capita waste production than rural areas; 2) increases in per
capita waste generation due to economic growth and greater overall
consumption; 3) increased landfilling rates; and 4) construction of landfills to
replace open dumps, thereby favoring anaerobic conditions and methane
production.
However, there are many current factors and dynamics suggesting that future
trends may not rise so rapidly. Much of the world does not currently have
managed landfills for disposal of waste after collection. In fact, much of the world
does not have standard procedures for waste collection and management
although municipalities throughout the developing world are officially
responsible for waste management. The ‘informal’ sector (i.e., scavengers, waste-

4
pickers, recyclers) play a major role in removal, recycling and reuse of discarded
items in all developing countries, as well as in some industrialized countries
(Chikarmane and Narayan, 2009). Although information about activities and
impacts of the informal sector is mostly qualitative and anecdotal, most agree
they play a substantial role. The impact of informal waste pickers was shown over
the last decade in Cairo, Egypt when an established community of pickers - the
Zabaleen - was partially eliminated from the waste-management process when
European and Egyptian companies were hired to collect and dispose of Cairo's
waste. Recycling and reuse plummeted, costs rose, more space for disposal was
needed and Cairo, like many other cities, is now attempting to develop a
management system that explicitly includes the informal sector (Fahmi et al.,
2010).
Industrialized countries are generally reducing the fraction of waste disposed of
in managed landfills although the US still landfills >60% of municipal solid waste
(MSW). EU countries have lowered this fraction substantially. The Netherlands
has achieved an extraordinarily low landfilling rate equal to 3% of produced
MSW by volume, and that consists largely of ash from incineration. As of 1999,
no new landfills can be constructed in the EU so coordinated local and regional
efforts are operating and in development to recycle, reuse, and compost waste.
In developing countries, much of the solid waste that is not recycled or reused is
disposed of at open dumps; some are official while the majority appears to be
unofficial or illegal. Shallow open dumps are often aerobic but large sites, located
mostly around rapidly growing cities, can be deep enough that lower layers of
waste are anaerobic. Moreover, dumps often grow in low-lying areas that
encompass ponds, streams or rivers, and may be inundated in rainy seasons.
Some of these dumps are decades old and tens of meters deep. Organics,
especially fresh material such as food waste, decompose aerobically to CO2 in
shallow open dumps, especially in dry climates. However, organics produce both
methane and CO2 when they degrade anaerobically in deep and/or saturated
dump sites and in sanitary landfills.

5
Current and Prospective Waste Disposal Approaches
1. Composting
In some developing countries, food waste is separated before disposal and
applied to farmland as nutrient supplements and soil amendments, or fed to
animals. In some cases (e.g., Beijing), animals feed directly on organic waste in
dumps. However, source separation is not widely practiced and is crucial to
successful composting.
The high organic content (50-80% of wet weight) of solid waste in developing
countries, together with the scarcity of space for waste disposal near large cities
and the need for fertilizers and soil amendments for farms and urban gardens,
makes composting an excellent option to include in solid-waste management.
Nevertheless, composting is currently a little used approach especially in
developing countries despite high organic content of waste. In some cases,
composting facilities were constructed but stopped operating after a short time.
Problems included: a) failure to achieve a high quality product due to lack of
source separation and subsequent contamination of compost with, e.g., heavy
metals; b) lack of spare parts and technical expertise for compost facilities
equipped with heavy equipment; c) lack of markets for compost (expectations
often involve municipalities as the major consumer of the product); d) lack of
companies to operate facilities due to risk of failure and e) problems with
transporting organics to facilities. Another probable explanation for low
composting rates in developing countries is that more income may be made in
collecting and transporting waste to landfills and dumps. There are however
successful composing facilities, e.g., Brazil. Composting not only represents a
good fit to waste composition and funding limitations in developing countries but
it is an effective strategy to mitigate methane emissions from solid waste
disposed of in landfills. Estimates of potential mitigation of methane emission
for 2000-2030 reported here indicate that plausible expansion of composting
may reduce emissions by ~25% compared to a baseline emission projection.
2. Thermal processing
Incineration of waste (not including open burning) with energy recovery is
relatively scarce in developing countries except in China which now has >100
waste-to-energy plants. Reasons include very high costs of construction and

6
maintenance, and dependence on foreign suppliers for construction, replacement
parts and expertise. Incineration without source separation of organics is not
economically or technically feasible since high organic and water contents of
waste require potentially expensive preprocessing and often auxiliary fuel as well.
Another obstacle is poor infrastructure (human, mechanical, institutional) for
incineration plants.
China is atypical in the waste-to-energy arena. Extremely high economic growth
rates in China over the last few decades has produced massive growth of cities,
competition for peri-urban space, and increased per capita consumption of
products (and waste). These trends conflate to produce wealth to pay for
expensive incineration technology and production of enormous amounts of MSW
requiring disposal. While this trend is likely to continue in China, and some fast-
growing cities in India may take a similar route, is it highly unlikely that the
number of waste-to-energy plants in developing countries will rise rapidly in
coming decades.
Open burning of waste, both informally and as a disposal strategy, remains very
uncertain with respect to amount, composition and process. Data on waste-
collection rates compiled for this study (Table 2) indicate that globally, maybe
75% of generated waste is collected leaving the remaining 25% unaccounted for,
and possibly disposed of through informal burning.
3. Anaerobic digestion
The series of stages in anaerobic digestion converts organic material (most often
sewage sludge but also organics from the solid waste stream) into gas (methane
and CO2), digestate, and water. Anaerobic digestion has been promoted primarily
as a producer of fuel rather than as a waste-management option. While systems
can be relatively simple (i.e., single-stage digestion), they still require, at a
minimum, dedicated equipment, temperature control, and pre-treatment of the
feedstock (shredding, pulping etc.). Large facilities further require mechanisms
to transport methane to consumers. Small-scale, domestic anaerobic digestion
has been introduced in China in part because China has a long history of
domestic maintenance of biogas pits but the cost, and need for constant supply of
feedstock indicates that this anaerobic digestion will not experience major growth

7
in developing countries, and will likely continue to be used to process manure
from industrial farms and sludge from wastewater treatment.
4. Landfills and dumps
Waste disposal in developing countries (especially in cities) is overwhelmingly in
open, peri-urban dumps even if regulations exist requiring construction and
maintenance of landfills. Dumps are located convenient to collection vehicles and
often pose environmental and health risks to resources and to residents living
nearby or in the dumps (Ray et al., 2005). Disposal sites in developing countries,
including landfills, are rarely lined allowing leachate to contaminate soil and
surface and ground water. Lack of security permits uncontrolled dumping of toxic
and other materials. In contrast to sanitary landfills, waste is not compacted nor
frequently covered with clean soil. Waste pickers are a common feature at
landfills and their activities depend on the composition of waste arriving at the
landfill. Substantial, although mostly unquantified, diversion of products via
recycling and reuse occurs prior to and following disposal at dumpsites and
landfills. Sanitary, engineered landfills provide the anaerobic conditions required
for methane production through decomposition. Many landfills are not equipped
with the equipment to capture landfill gas allowing a substantial fraction to
migrate to the surface and emitted to the atmosphere. Even in instrumented
landfills, gas collection is delayed until cells are closed during allowing generated
methane to escape. As a result capture rates are likely ~50-60% of generated
methane over the lifetime of the landfill. Moreover, in countries where disposal is
relatively free (i.e., open dumping), constructing landfills represents a new cost.
5. Integrated management
As demand rises for valuable and increasingly rare materials (e.g., metals and
rare earths), reclamation of these products is being formalized at disposal sites in
developing countries. Many countries and cities are attempting to upgrade
existing dump sites to control waste input, institute leachate treatment, and
provide facilities for composting, recycling, and reclamation. These approaches
are often quasi-local efforts, which means they are likely to continue in spite of
political changes that would threaten government-funded projects. They are also
likely to provide more jobs than more mechanized or high technology
approaches.
8
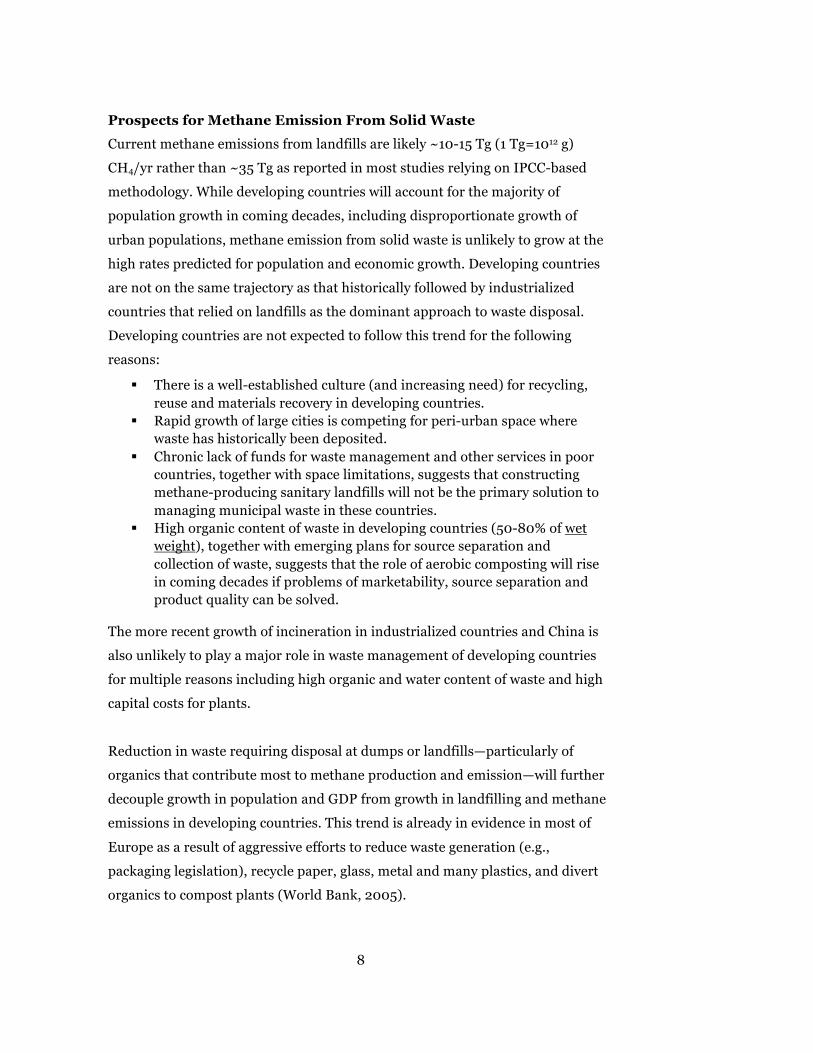
Prospects for Methane Emission From Solid Waste
Current methane emissions from landfills are likely ~10-15 Tg (1 Tg=1012 g)
CH4/yr rather than ~35 Tg as reported in most studies relying on IPCC-based
methodology. While developing countries will account for the majority of
population growth in coming decades, including disproportionate growth of
urban populations, methane emission from solid waste is unlikely to grow at the
high rates predicted for population and economic growth. Developing countries
are not on the same trajectory as that historically followed by industrialized
countries that relied on landfills as the dominant approach to waste disposal.
Developing countries are not expected to follow this trend for the following
reasons:
There is a well-established culture (and increasing need) for recycling, reuse and materials recovery in developing countries.
Rapid growth of large cities is competing for peri-urban space where waste has historically been deposited.
Chronic lack of funds for waste management and other services in poor countries, together with space limitations, suggests that constructing methane-producing sanitary landfills will not be the primary solution to managing municipal waste in these countries.
High organic content of waste in developing countries (50-80% of wet weight), together with emerging plans for source separation and collection of waste, suggests that the role of aerobic composting will rise in coming decades if problems of marketability, source separation and product quality can be solved.
The more recent growth of incineration in industrialized countries and China is
also unlikely to play a major role in waste management of developing countries
for multiple reasons including high organic and water content of waste and high
capital costs for plants.
Reduction in waste requiring disposal at dumps or landfills—particularly of
organics that contribute most to methane production and emission—will further
decouple growth in population and GDP from growth in landfilling and methane
emissions in developing countries. This trend is already in evidence in most of
Europe as a result of aggressive efforts to reduce waste generation (e.g.,
packaging legislation), recycle paper, glass, metal and many plastics, and divert
organics to compost plants (World Bank, 2005).

9
Composting offers the best option for addressing multiple solid-waste
problems including methane emission including:
Well adapted to high-organic waste characteristics of all developing
countries
Provides a low-technology, and relatively low cost, alternative to
incineration and landfills
Emits low-to-no methane
Requires less land, and longer lifetime, than landfills
Provides useful soil amendment and fertilizer
Reduces health and pollution impacts by minimizing leachate
production at disposal sites
Low current methane emissions associated with solid waste management,
and future modest emission growth, imply that mitigation of waste-related
CH4 emissions, including Clean Mechanism Projects, is a poor candidate
for limiting climate change.

10
Good News From the Dump........................................................................................................... 1!Executive Summary ........................................................................................................................ 3!1. Introduction............................................................................................................................... 11!2. Overview of processes and conditions related to solid waste and methane emission .............. 13!
2.1 Waste generation................................................................................................................. 13!2.2 Waste composition.............................................................................................................. 15!2.3 Collection............................................................................................................................ 16!2.4 Disposal............................................................................................................................... 18!
2.4.1 Recycling, reuse, and materials recovery .................................................................... 18!2.4.2 Composting .................................................................................................................. 20!2.4.3 Thermal treatments ...................................................................................................... 23!2.4.4 Anaerobic digestion ..................................................................................................... 25!2.4.5 Landfills and dumps..................................................................................................... 26!
2.5 Integrated management....................................................................................................... 27!3. Processes and dynamics of methane emission from solid waste .............................................. 27!
3.1 Methodology - how are estimates done? ............................................................................ 27!3.2 Projections of solid waste and methane emission............................................................... 29!
4. Comparison to existing methodologies and data, and implications for methane emissions..... 34!5. Missing Links and Reducing Uncertainties .............................................................................. 38!
5.1 Missing links between waste studies and modeling studies ............................................... 38!5.2 Reducing uncertainties........................................................................................................ 41!
5.2.1 Fires.............................................................................................................................. 41!5.2.2 Anaerobicity in uncontrolled landfills and dumps....................................................... 42!
6. Prospects for solid waste management and methane emission................................................. 43!7. References................................................................................................................................. 47!8. Appendix................................................................................................................................... 58!Figure 1. Tanner Triangle for rapid assessment of combustibility. Perimeter of shaded area indicates maximum values for main variables supporting combustion without auxiliary fuel. ... 60!Figure 2. Comparison of reference estimates of methane emission from municipal solid waste, 1990-2030. .................................................................................................................................... 61!Figure 3. GISS 2030 results relative to 2000, grouped by variable (2000 = 1). ........................... 62!Figure 4. GISS 2030 results relative to 2000, grouped by projection (2000 = 1)......................... 63!Table 1. Waste composition as percent of total waste. ................................................................. 64!Table 2. Waste-collection rates as percent of population or of generated waste. ......................... 73!Table 3. Waste-disposal methods as percent of generated waste. ................................................ 76!Table 4. Calorific values (CV) of waste materials........................................................................ 81!Table 5. Environmental ranges and optima for composting. ....................................................... 82!Table 6. Typical carbon-to-nitrogen (C:N) ratios of compostable materials................................ 83!Table 7. GISS 2030 results for all projections, relative to 2000 (2000 = 1)................................. 84!Table 8. GISS 2030 results for all projections, in Tg except CH4 mitigation in percent .............. 85!difference from REF. .................................................................................................................... 85!Table 9. Regional waste-composition defaults as percent of generated waste (IPCC, 2000). .... 86!

11
1. Introduction Landfills are currently estimated to emit ~10-35 Tg (1012g) methane annually out
of the anthropogenic emission total of ~600 Tg. The production and emission of
methane in landfills and other waste-disposal sites is controlled by a suite of
processes and characteristics that vary over time and space. Primary drivers
include:
1. Size, living standard and urbanization of human populations.
2. Amount and composition of waste generated (e.g., organic content,
recyclables).
3. Collection and disposition of waste (e.g., extent of collection services,
recycling, incineration, composting, unregulated dumping, landfilling).
4. Presence, type and efficiency of gas-capture in landfills (e.g., active or
passive capture).
5. Disposition of captured methane (vented, flared, used as energy source).
6. Methane oxidation in landfill covers.
The local nature of waste generation and management means that information on
amount, composition and disposition of waste is typically scarce, particularly for
developing countries although statistics for industrialized countries are available.
Regional review papers and studies for large cities in developing countries have
been published but suffer from uncertainties due to data gaps and/or generic
assumptions in the absence of reliable data. For example, waste studies reporting
daily per capita waste generation may reflect only residential waste, or the latter
plus industrial and commercial waste; construction and demolition (C&D) waste
is typically not included but may double waste generation for the former three
categories. The prevalence of unofficial settlements in cities makes reliable
population counts almost impossible. Illegal dumping and burning of waste is not
reported and rarely estimated.
In developing countries, all waste streams, including medical and other toxic
materials, are often disposed of at the same sites. Because most dumps and
uncontrolled landfills are illegal, quantification and analysis of composition and
amount in place is very difficult. The anaerobic conditions required for methane
production may or may not be supported in uncontrolled dumps depending upon

12
composition, depth and aeration of waste, climate, local topography, and
management, if any.
Recycling is primarily carried out by informal sectors, making this component of
waste dynamics extremely difficult to quantify. Because waste-collection rates are
notoriously low in poor, peri-urban and unofficial settlements in cities of the
developing world, it is critical to account for the gap between generated and
collected waste when estimating emissions. While methane dynamics at sanitary,
engineered landfills are complex, data on waste production, composition,
recycling and landfilling rate, as well as the existence and location of landfills, are
more available in industrialized countries where these disposal sites dominate.
However, these are also the countries that will contribute modestly to future
trends in waste generation. Therefore, reducing uncertainties in future emission
estimates requires closing data gaps in developing countries.
The Intergovernmental Panel of Climate Change (IPCC) has published
methodologies for estimating methane emissions from landfills and other
sources. Initial methods (IPCC, 1996) rely on calculations including, inter alia,
daily per capita waste production, landfilling and anaerobic landfilling rates,
organic content of waste and other variables to estimate methane generation and
emission from landfills (Tier I approach). The methodology provides default
values for parameters when country-specific values are not available. The Tier I
method, including default values, is still frequently used to estimate methane
emissions associated with solid waste, particularly for developing countries
where region specific data are more difficult to obtain. Subsequently IPCC (2000)
outlined good practice approaches if data are available but the essence of the Tier
I method remains. IPCC's Good Practice document (2000) offers guidance for
characterizing carbon contents of individual waste components to improve
estimates of methane-producing potential, but fails to adapt the basic method to
reflect emerging data and information about solid waste management in
developing countries. The most recent inventory guidelines (IPCC, 2006) rely
heavily the existing methodology with some additions that are only applicable
with substantial amounts of data that are often lacking for poor countries. For
example, although IPCC (1996, 2006) methodologies supply methane correction

13
factors (MCf) to reflect methane-generating potential of different types of
disposal sites, introduction of a generic disposal category !Solid Waste Disposal
Site (SWDS) ! lessens the reliable application of MCfs that are linked to type of
disposal site.
The goals of this study are to:
1. summarize fundamental processes associated with methane production from solid waste
2. provide an overview of current conditions, practices and characteristics of
waste management as related to methane emission for countries and
regions
3. present recent historical and future projections of waste generation and
management, and resultant methane production and emission, to bracket
the role of plausible mitigation strategies on future methane
concentrations.
4. summarize remaining uncertainties and their potential impact on
estimates of current and future methane emissions from solid waste.
5. offer approaches to reducing uncertainties in estimating methane
emissions from solid waste for current and future periods
2. Overview of processes and conditions related to solid waste and methane emission
2.1 Waste generation Municipal solid waste (MSW) is typically understood to mean household,
commercial and industrial waste. In some studies, it also includes waste from
construction and demolition (C&D). Per capita waste-generation rates are
reported for many cities but rarely for rural areas. These studies focus on
household, commercial, and industrial waste; C&D waste is less often reported
although it may be equal to 75% or more of MSW.
Per capita waste-generation rates are arrived at in several ways. They can be
calculated from an estimate of total waste generation and population statistics.
Alternatively, total waste generation can be calculated using per capita generation
rates and population statistics. Per capita rates can also be built up from field
observations of household, industrial and commercial waste generation in
specific cities. Because per capita values are very sensitive to population data,

14
which are often unreliable particularly in megacities with substantial unofficial
populations, it isn't productive to analyze these numbers in detail. However,
general patterns in per capita waste-generation rates reflect, inter alia, level of
economic development (more waste with higher economic development and
income), size of city (more per capita waste in larger, growing cities) and
urbanization (more per capita waste in cities than in villages and rural areas). A
universally robust pattern is that people in poor, less developed countries
typically generate ≤0.6 kg/capita/day on a wet weight basis (CalRecovery and
UNEP, 2005) equal to ~25-30% that for most industrialized countries. However,
the composition of waste generated by the poor is dominated by food with high
water content (Staley and Barlaz, 2009) meaning that, e.g., 0.6 kg of mostly food
waste represents substantially less volume than 0.6 kg waste generated by
wealthier people which has higher fractions of low density paper and plastics. It
is volume, and its reduction, that plays a defining role in planning for waste
disposal whereas weight may determine what fraction of waste is collected and
the cost of doing so.
Cities in low-income Asian countries exhibit generally low rates although per
capita generation for the majority of Indian States (Gidde et al., 2008) is <0.4
kg/capita/day. The World Bank (1999b) reports a mean of 0.73 kg/capita/day
for middle-income Asian cities based on the following city rates: Indonesia (0.76
kg/capita/day), Philippines (0.52), Thailand (1.10), and Malaysia (0.81).
Residents of high-income Asian cities are estimated to generate an average of
1.64 kg/capita/day relying on statistics from the Republic of Korea (1.59)
Singapore (1.10) and Japan (1.47). Differences among cities of varying size and
economic activity are apparent within individual countries such as Vietnam: Ho
Chi Minh City (1.3 kg/capita/day), Hanoi (1 kg) and Danang (0.9 kg) (Nguyen,
2005). Similarly the average for Vietnam cities, which encompass ~50% of the
population, is 0.7 kg/capita/day whereas rural populations are reported to
generate only 0.3 kg/capita/day (Nguyen, 2005). Households in small
communities in Central and South America and the Caribbean typically generate
0.25-0.5 kg/capita/day whereas households in large cities (>500,000 residents)
generate ~0.75 kg/capita/day (Espinoza et al., 2010). Unlike household
generation rates, non-household waste accounts for ~0.3 kg/capita/day in

15
settlements of all sizes. Staley and Barlaz (2009) report per capita waste
generation in the US to be 1.9 kg/person/day, which is bracketed with two other
recent studies reporting 1.44 (EPA, 2007) and 2.36 kg/person/day (Simmons et
al., 2006) for the US. European countries show similar generation rates although
some have recently achieved reductions in absolute per capita waste generation
primarily through packaging regulations.
2.2 Waste composition Table 1 provides a representative sample of waste-composition studies. Income
often determines the amount and composition of generated waste, among
countries as well as among cities within individual countries and even among
neighborhoods within cities. In developing countries, composition studies are
typically confined to major cities because the information is crucial to evaluating
options for waste management. Minimal effort is devoted to rural waste although
much of that is fed to animals and/or spread on fields.
Studies that rely on analyzing waste samples can be difficult to compare (Staley
and Barlaz, 2009). Samples may be taken at the generation source (e.g.,
household, factory), at collection sites (community bins, transfer stations), or at
disposal sites (Kumar et al., 2009; Mor et al., 2006; UNEP, 2009a,). Recycling,
activities of waste pickers and collection rates can substantially alter waste
composition, especially recyclables and organics, at these different locations. In
developing countries, reported waste composition follows some general patterns
(Table 1). Recyclables including plastic, glass and metals generally total <10% of
waste by wet weight while paper and cardboard account for 10-15%. A universal
feature of waste in developing countries is the high fraction of organic matter
(food, yard waste) that accounts for 40-80% of the total. It appears waste
generated in African cities contains the highest organic fractions while cities in
south Asia may be in the lower range (40-45%) although there is substantial
variation even for the same country or city from different authors (Table 1). The
mean compostable waste fraction for 23 cities studied by Sharholy et al. (2008) is
~42%. India is unusual in that inert materials, such ash and dust from street
sweeping, often account for 30-50% of total waste; the mean inert fraction is 40%
for 23 Indian cities.

16
Waste densities in developing countries are ~200 to >500 kg/m3 because of the
high water content of organics whereas densities, even of compacted waste, in
industrialized countries are 30-50% those in developing countries. As noted
above, high density poses major challenges to collection; it appears that a
substantial fraction of these organic wastes may go uncollected.
Paper and plastic fractions also show wide ranges although interpretation is
complicated because these materials are often recycled and it is usually
impossible to determine if reported composition reflects pre- or post-recycling.
2.3 Collection Collection rates (Table 2) reflect either the fraction of the population with waste-
collection services or the fraction of generated waste that is collected. Although
collection and transport of waste accounts for the majority of funds targeted for
solid waste management in poor countries, collection rates (either curbside or
from community bins) are especially low in poor, peri-urban and unofficial
settlements in cities of the developing world whereas collection service is scarce
or absent in rural areas and smaller cities. In a study of 59 Asian cities, Kumar et
al. (2009) report collection rates of 50-70% but even these are not evenly
distributed among neighborhoods. Low income, unofficial, and/or squatter
settlements receive little or no collection services while wealthier areas are well
serviced. Only seven of the 59 cities provided house-to-house collection while the
remainder provided community bins for residents to deposit their trash. Eleven
of the cities employed private companies, in part or in full, for collection services.
While only 15 of 59 cities had active waste-processing facilities, 2/3 of these were
composting facilities. Visvanathan and Glawe (2006) report the following
minimum and maximum collection rates (as % of population) for Asian
countries: Afghanistan (0-22%), Pakistan (0-60%), Bangladesh (40-90%), India
(50-90%) and Sri Lanka (10-40%). Hazra and Goel's (2009) study of Calcutta,
India concludes that ~61% of the population receives some type of collection
service (door-to-door or community trash bins). More specifically, 57% of people
in 'standard' residential areas receive door-to-door collection service, whereas
67% of people in registered slums and only 13% of those in unregistered slums
have any form of collection services. Sharholy et al. (2008) observe that

17
collection rates are higher where private companies and NGOs are responsible for
collection but private companies charge fees and thus are more likely to operate
in wealthier areas (Vin et al., 2007). Nguyen (2005) reports relationships
between collection service and income in and among Vietnamese cities. Yousef
and Rahman (2007) estimate that ~50% of the all waste generated in Dhaka,
Bangladesh is collected. Gamarra and Salhofer (2007) report urban waste-
collection rates in Central and South America ranging from of 20% in Honduras
to 81% in Ecuador (Table 2). However, large unexplained differences in collection
rates are apparent for the same country from different authors: collection rates
are reported for Honduras as 20% and 65% (Table 2). It is beyond the scope of
this study to reconcile these inconsistencies. Blight and Mussane (2007) studied
collection rates in the municipality of the Eastern Cape, South Africa whose
population distribution is ~22% in formal and informal urban areas and 78% in
dense rural villages; they conclude that only 19% of the population receives any
form of waste-removal services. About 75% of generated waste is collected in
Eastern Europe (Gamarra and Salhofer, 2007) while in the US and Western
Europe close to 100% is collected; lower collection rates in rural areas of the US
occur where residents are required to bring their waste to designated locations.
Systems for waste collection in major cities in developing countries rely primarily
on labor intensive techniques such as animal- or human-powered carts; trucks
and compactor trucks are less common in part because of high cost for purchase
and maintenance as well as because compaction of wet organic waste produces
large volumes of leachate that also requires disposal. In some urban areas with no
direct collection service, pre-collection is carried out by community groups thus
providing more opportunities for recycling and reuse. A special case is that of the
Zabaleen in Cairo, Egypt (Fahmi et al., 2010). The city, with a population of 8-10
million, relied entirely on the Zabaleen to collect and manage solid waste for
decades. With no government participation, cooperation or pay, the Zabaleen
collected waste – directly from outside the doors of apartments, houses and
stores – and brought it to their own neighborhood for sorting and recycling.
Estimates are that ~80% of the trash was recycled, leaving about 20% to be
disposed of at landfills or dumpsites. Specialists among the Zabaleen focused on
plastic bottles, metal, and paper. Organics, accounting for about half of Cairo's

18
waste, supported the Zabaleen's substantial pig population that provided
additional income and protein to the community. In 2009, all the pigs were
slaughtered by the government as a preventive measure against swine flu. With
no use for organic material, the Zabaleen no longer collect this putrescent portion
of Cairo's waste. The Cairo government, without consultation with the Zabaleen
whose livelihood relied exclusively on waste, decided to modernize and formalize
trash collection and disposal in the city. They contracted with European and
Egyptian companies to collect and dispose of Cairo’s trash, which proved to be
expensive and short-lived. While the effort provided employment for some, the
number was far less than the previous system; the Zabaleen were edged closer to
extreme poverty; minimal recycling by the new companies meant increased
demand for disposal space near the city and/or disposal of the trash by burning.
Cairo is now attempting to develop a new integrated waste-management that
includes the Zabaleen although they are being pressured to move outside of the
city, sharply increasing the time and effort required to transport waste collected
in the city to sorting areas. This approach of officially recognizing the traditional
informal sectors in waste management is echoed is many current plans for waste
management in developing cities although actual implementation lags behind the
plans.
Wide ranges in collection rates summarized here can exert a substantial influence
on estimates of methane emission from solid waste management if estimates
assume that all generated waste is collected - which is the standard approach.
Assuming that waste generated—minus that composted, incinerated and
recycled—is collected and transported to disposal sites that may produce
methane is not consistent with data for developing countries, and boosts
estimates of methane emission from solid waste for these countries.
2.4 Disposal
2.4.1 Recycling, reuse, and materials recovery
These terms are not universally agreed upon but generally refer to removal of
materials from initial waste streams for purposes including recycling for
processing and/or sale (plastic, glass, paper, gypsum), repair of products for

19
resale/reuse (furniture, electronics) and materials recovery (precious metal from
electronics) although the latter leaves the bulk of diverted products to be
disposed of. Data on recycling are often lacking in developing countries primarily
due to the dominant role of the informal waste-management sector, in addition
to uncertainties in amounts of generated recyclables. Estimates of recycling rates
and/or amounts are derived by calculating the difference between generated and
disposed of quantities of recyclable materials or by sampling differences in waste
composition at the source (e.g., households, offices) and at temporary or
permanent disposal sites (collection centers, landfills). Most studies of waste in
developing countries acknowledge both the importance of the informal sector in
recycling and materials recovery, and the difficulty of quantification. However,
several authors estimate that 10-25% of MSW is removed from the waste stream
mostly by informal sectors (Table 3). An alternative approach is to estimate total
recycled amounts from waste generation and composition, which is similarly
hampered by scarcity of reliable data.
Recovery and reuse of waste products is overwhelmingly via informal processes
in developing countries because these activities provide needed products and
income to large numbers of people and because funds for such services are
lacking in poor countries. In Africa, low-income households reuse and recycle
products themselves whereas domestic servants may recover and sell items in
higher income households. Waste pickers respond to volatile markets focusing on
materials for which there is a market and a reasonable resale price. Some pickers
carry out basic processing including pelletizing plastics or shredding or cleaning
textiles. Recycling rates are high where deposit systems are in place, which
applies almost universally to glass, and to tin and aluminum cans in some
countries. Commercial recycling operations are found in large African and Asian
cities. In some East Asian cities, waste reduction efforts rely in part on volume-
based fees and source separation. Such efforts reduced wastes requiring disposal
by 20-30% in South Korean cities after implementation in 1995 (UNEP, 2004).
In wealthier cities such as Singapore, commercial waste-trading companies
recycle ~40% of all generated waste (mostly industrial and commercial) although
recycling is also encouraged in designated locations at landfills. In many regions
of the developing world, individual street peddlers buy recyclables from

20
households and sell to dealers and/or wholesalers. Multiple levels of middlemen
expand the income differential between collectors and final purchasers (Agarwal
et al., 2005). In poorer cities, traditional collection, recycling, repair, processing
and reuse continue on an informal basis. In contrast, several large industrial
parks have recently been built in China to host commercial recycling and
reprocessing companies. However, the raw products are overwhelming imported
from other countries. Neighborhood centers, where individuals sell glass, paper
and textiles were established by the Chinese government but use has declined as
trade in more valuable materials such as metals is preferred and supported.
Recycling and recovery in large cities in Vietnam is often carried out by family
businesses, while small-scale collectors and peddlers are still common in African
countries.
2.4.2 Composting A large suite of microorganisms (chemical decomposers), including bacteria and
fungi account for most naturally occurring and managed decomposition of
organic materials. Aerobic bacteria are the most important chemical
decomposers because they eat almost anything and are the most abundant.
Oxidation of carbon in waste supplies energy to bacteria and is responsible for
heating up compost, whereas nitrogen provides protein to build body mass and
aid in reproduction. In the process of consuming plant material, organisms
release nutrients such as nitrogen, phosphorus and magnesium in a form
available for plant eventual uptake. If oxygen drops below 5%, populations and
activity of anaerobic bacteria rise but produce unavailable nitrogen, and gases
such has hydrogen sulfide, cadaverine, and putrescine that are responsible for the
odor of rotting trash.
Groups of aerobic bacteria operate at different temperature optima (Table 4).
Psychrophilic bacteria are most active in the range of 10-21˚C. The modest heat
they produce improves conditions for the very active mesophilic bacteria that
operate best between 21 and 38˚C. Above 38˚, mesophilic organisms either die
or migrate to the outer, cooler parts of the compost. Thermophilic bacteria
operate at 38-71˚C, raising the compost temperature to 54-51˚C where it
stabilizes. Addition of new materials is crucial to maintain these bacteria because

21
they rapidly use up degradable materials. If the compost cools down, the
mesophilics resurge and finish off the biological process. While temperatures
>60˚C typically kill pathogenic organisms - an advantage for compost that will be
applied to crops - such high temperatures are not necessary to complete the
composting process.
A carbon-to-nitrogen (C:N) ratio of 25-30 is optimum for rapid decomposition
(Table 5). At ratios >30, heat production declines and decomposition slows
whereas higher nitrogen content (lower C:N) can release ammonia and can boost
pH which may become toxic to some of the decomposers. Moisture for efficient
decomposition is typically between 40 and 60%. Above that, anaerobic conditions
prevail which slows decomposition and increases production of noxious gases
such as hydrogen sulfide. Below ~40%, bacteria slow down or stop activity.
Aeration of compost is crucial to maintaining conditions conducive to fast
decomposition that releases nutrients available for plant uptake. Aeration is
maintained by turning compost, either mechanically or manually, including
coarse material, and/or inserting ventilator stacks. In late stage composting,
Actinomycetes—higher bacteria similar to fungi and molds—decompose the more
recalcitrant materials including lignin, cellulose, starches, and proteins.
Although aerobic composting can be carried out in local, low-technology ways,
success depends on a suite of inputs and management steps to ensure the rapid
completion of biological processes required to produce good compost. Lack of
knowledge about the biology of composting is one of the tractable problems
preventing more widespread implementation of the technique. The most crucial
step in successful composting, whether centralized or small scale, is source
separation of waste.
In a small number of countries, food waste is separated before disposal and
applied to farmland as nutrient supplements and soil amendments, or fed to
animals (CalRecovery and UNEP, 2005). The high organic content of solid waste
in developing countries (Table 1), together with the scarcity of space for waste
disposal near large cities and the need for soil amendments for farms and urban
gardens, makes composting a good option to include in solid-waste management.

22
Nevertheless, composing is a little used approach in both developing and
developed countries (Table 3) with a few exceptions. While 58% of yard
trimmings was composted in the US in 2010, only ~3% of food waste was
composted in the same year although the country had ~2300 composting
facilities (http://www.epa.gov/osw/conserve/rrr/composting/basic.htm).
In some cases, composting facilities were constructed in developing countries but
stopped operating after a short time. The Indian government promoted
composting via funding and pilot programs starting in the 1970s and high-
capacity mechanical plants were constructed in large cities including Calcutta,
Mumbai, Indore, and Bangalore (Shekdar, 1999, 2009; Sharholy et al. (2008)
report that composting continues to grow in India. The Pan American Health
Organization (PAHO, 2010) reviewed the fate of ~30 mechanized composting
plants purchased but never installed in South and Central America, and
identified the major reason for failure as lack of technical expertise. Several
authors note the perception that compost produced from 'garbage' is not clean
enough for use on food crops which may explain why vermicompost (produced
from worms feeding exclusively on food waste) has been more successful in some
regions (CalRecovery and UNEP, 2005). Problems with composting in
developing countries include: a) failure to achieve a high quality product due to
lack of source separation and subsequent contamination of compost with, e.g.,
heavy metals; b) over-emphasis on mechanized processes rather than labor
intensive operations; c) lack of expertise in biological process requirements; d)
lack of markets for compost (expectations often involve municipalities as the
major consumer of the product); e) dearth of companies willing to operate
facilities due to risk of failure and/or low return; and f) problems with
transporting organics to facilities (World Bank, 1999b). Another possible
explanation is that more income can be made by private companies in collecting
and transporting MSW to landfills and dumps than in composting. The World
Bank (1999b) identifies what they term 'perverse incentives', e.g., government
funding may subsidize the purchase of chemical fertilizers rather than support
composting, or emphasize capital intensive projects where less costly, labor-
intensive facilities may be more appropriate and sustainable. Financial barriers
to success include difficulties in securing financing since the revenue generated

23
by compost sales rarely covers costs. Some researchers claim that composting will
never pay entirely for itself and should be considered a cost-reduction strategy
rather than as an income producer. However, waste is dumped freely in many
countries such that composting may represent a new cost. The reality of limited
funds, especially in poor countries, suggests that successful composting efforts
will have to produce some income although subsidies will most likely be required
to maintain programs. A consistent theme in the waste literature is that large-
scale composting facilities, requiring mechanization, have not been successful in
cities of developing countries and that future efforts are likely to take the form of
smaller efforts, organized by NGOs and community groups.
2.4.3 Thermal treatments The Tanner Triangle (Figure 1) is used for rapid, initial assessments of waste
combustibility. The shaded area in Figure 1 indicates the limits for combustibles,
moisture and ash (inerts) within which materials can burn without auxiliary fuel.
While organics are not explicitly assessed in the method, moisture is a reasonable
indicator of organic content.
Thermal treatment of solid wastes can involve simple burning of waste that is
notoriously difficult to quantify. Set and accidental fires occur in backyards,
streets and dump sites. Because the fuel is usually mixed waste, temperatures are
relatively low, combustion is incomplete, and pollutants such as black carbon,
NOx, CO and toxics are released from these fires. Planned thermal treatment,
with the combined goal of reducing waste and producing energy, comprises
incineration, pyrolysis, and gasification, each of which operate at different
temperatures and produce different types of byproducts.
The optimal feedstock for incineration with energy recovery (Waste-to-Energy) is
materials of high calorific value such as plastics and paper (Table 6) (Staley and
Barlaz, 2009); the process occurs at 750-1000˚C and energy recovery takes the
form of steam, heat or electricity.
Alternatively, mass incineration plants are designed for mixed waste feedstocks
with no pre-treatment or sorting and thus require auxiliary fuel to operate. The
minimum weighted calorific value for waste to burn without supporting fuel is

24
~3400 kcal/kg waste. Table 4 shows representative calorific values for individual
fuels (Staley and Barlaz, 2009). Food waste is lowest at ~1300 kcal/kg whereas
plastics are all 5000->9000 kcal/kg. Ranges for calorific values for municipal
solid waste exhibit an interesting pattern before and after recycling. Values at the
low end of the range rise after recycling, probably reflecting the removal of low
CV inerts like glass and metal. However, the upper value declines with recycling,
reflecting removal of high CV materials such as plastics and cardboard.
Pyrolysis, or indirect gasification, involves heating materials in an anaerobic
environment to produce solid, liquid or gaseous fuels. Conventional or slow
pyrolysis is most often used in charcoal production, and produces solid, liquid
and gaseous fuels in approximately equal amounts. Fast pyrolysis (thermolysis)
requires rapid heating of biomass feedstock to high temperatures in the absence
of oxygen
Contained incineration of waste with energy recovery is extremely rare in
developing countries with the exception of China which now has >100 waste-to-
energy plants. Reasons include very high capital and maintenance costs, high
organic and moisture content of waste, and dependence on foreign suppliers for
construction, replacement parts and expertise. Another obstacle is poor quality of
the infrastructure that is required to guarantee usable feedstock and its delivery.
High organics and high moisture, together with current weakness in source
separation, mean that WtE plants are only economically and technically feasible
in wealthier and economically growing regions.
China is atypical in the waste-to-energy arena. Extremely high economic growth
rates in China over the last few decades has produced massive growth of cities,
competition for peri-urban space, and increased per capita consumption of
products (and waste generation). These trends conflate to produce wealth to pay
for expensive incineration technology and production of enormous amounts of
MSW requiring disposal. While this trend is likely to continue in China, and
some fast-growing cities in India may take a similar route, is it highly unlikely
that the number of waste-to-energy plants in developing countries will rise
rapidly in coming decades.

25
2.4.4 Anaerobic digestion The series of stages in anaerobic digestion (AD) converts organic material (most
often sewage sludge but also organics from the solid waste stream) into biogas
(methane and CO2), digestate, and water. Anaerobic digestion has been promoted
primarily as a supplier of fuel and secondarily as a waste-management option.
While systems can be relatively simple (i.e., single-stage digestion), they still
require, at a minimum, dedicated equipment, temperature control, and pre-
treatment of the feedstock (shredding, pulping etc.). Small-scale, domestic
anaerobic digestion has been introduced in China in part because China has a
long history of domestic maintenance of biogas pits but the cost and need for
substantial feedstock indicates that this anaerobic digestion will not experience
major growth in developing countries, and will likely continue to be used to
process manure from industrial farms and sludge from wastewater treatment.
UN Habitat (2010) refers to the spread of biodigesters in developing countries,
except for China, India, Bangladesh and Nepal, as 'disappointing' noting many of
the same problems that plague composting efforts: poor quality of feedstock, low
temperatures, and lack of technical competence and of incentives. The report
also highlights that large AD systems (such as those used on commercial dairy
farms) have been the focus of research but minimal attention has been devoted to
small digesters that are the only likely candidates for large scale use in the
developing world. As with composting, the ecological process is relatively simple,
as are management requirements, but systems must maintain these fundamental
requirements to succeed in producing fuel. Again similar to composting, large
centralized AD facilities require costly mechanization as well as separation and
transport of appropriate feedstock.
As an option to dispose of organic waste and produce a needed product (methane
fuel in this case), anaerobic digestion may be considered as an alternative or
addition to composting. However, it is less likely that AD will be implemented
more widely than composting: there is less tradition supporting the technique
than with composting, and technical requirements (equipment and management)
are more difficult to achieve (UN Habitat, 2010).

26
2.4.5 Landfills and dumps Waste disposal in developing countries (especially in cities) is overwhelmingly in
open, peri-urban dumps even when regulations require construction and
maintenance of landfills. Dumps are located convenient to collection vehicles and
often pose environmental and health risks to resources and to residents living
nearby or in the dumps. Disposal sites are not lined, allowing leachate to
contaminate soil and water. Lack of security at sites permits uncontrolled
dumping of toxic and other materials. In contrast to sanitary landfills,
compaction and daily covers of clean soil do not accompany trash placement.
Waste pickers are a common feature at dumps and landfills in developing
countries and their activities depend on the composition of waste arriving at the
landfill and prices for recyclables. Substantial, although mostly unquantified,
diversion of products via recycling and reuse occurs prior to disposal at
dumpsites and landfills.
Methane capture at landfills with installed equipment is usually not enabled until
cells are closed and capped but sloping edges of cells are sometimes uncovered
until final capping of the landfill. Consequently, capture efficiency can reflect
either instantaneous rates or the rate over the lifetime of the landfill, the latter
being much lower than the former. Moreover, biogas capture efficiency at
engineered landfills is not a simple measurement but rather is calculated as the
difference between methane generation (modeled or estimated) and the sum of
gas captured (measured), oxidized (estimated or modeled) and emitted
(estimated or modeled). Kohler et al. (2011) reports instantaneous capture rates
of 50-75% for the UK, suggesting that reported rates as high as 85% can only be
achieved at closed facilities with very low pipe leakage, and lifetime rates of 60-
70% might be possible but only at landfills with very stringent controls. They
conclude that 50% may be more representative of instantaneous efficiency and
25% for lifetime efficiency. These capture rates are similar to those measured by
Amini and Reinhart (2011) for closed and active landfills. Dever et al. (2011) used
several methods to derive capture efficiency at an Australian landfill. The
uncalibrated IPCC first order decay (FOD) model resulted in CH4 generation that
was less than CH4 capture measured at the site but a site-specific calibration of
the model indicated that instantaneous capture efficiency could be quite high
(~85%) and that emission accounted for ~20% of generated methane. However,

27
the high data requirements, as well as site calibration of the FOD model, seriously
limit its application to many sanitary landfills in developed countries, and make it
impossible to use for uncontrolled dump sites everywhere else.
2.5 Integrated management As demand and production costs rise for valuable and/or increasingly rare
materials (e.g., metals and rare earths), reclamation of these products is being
formalized at disposal sites in developing countries.
Many countries and cities are attempting to upgrade existing dump sites to
control waste input, institute leachate treatment, and provide facilities for
composting, recycling, and reclamation. These approaches are often quasi-local
efforts meaning that they are likely to continue in spite of political changes that
threaten government-funded projects. They are also likely to provide more jobs
than more mechanized or high-technology approaches.
The literature indicates that similar waste management plans and practices are
arising internally in developing countries. These include: 1) less reliance on high-
tech and expensive projects funded and built by foreign countries and banks like
the World Bank or European Investment Bank. 2) developing strategies to
manage, upgrade and control existing open dumps including compaction,
leachate collection, onsite recycling, composting and legitimization and
integration of traditional informal waste pickers into management systems, 3)
encouragement of source separation to achieve a high-quality organic stream for
composting; 4) moving toward community management of composting and
recycling (cities) and working toward locally controlled systems with costs and
management shared by multiple towns (rural areas).
3. Processes and dynamics of methane emission from solid waste 3.1 Methodology - how are estimates done? Early estimates of emission from landfills ranged from 7-70 Tg CH4/yr based on a
very sparse data set of measured or estimated national solid waste generation,

28
fractions of MSW landfilled and anaerobically landfilled, DOC content, fraction of
DOC and methane content of the landfill biogas.
The IPCC (1996) proposed methodologies to estimate emissions from multiple
sources of methane and other climate-relevant constituents. The following is the
approach for estimating methane emission from solid waste.
Methane emitted (Tg) = {[MSWt * MSWf * MCf * DOC * DOCf * F * (16/12)] - R} * (1- OX) (1)
where:
MSWt = total municipal solid waste generated (Tg)
MSWf = fraction MSW disposed in engineered landfill
MCf = CH4 correction factor (fraction MSW decomposing anaerobically);
default = 0.4-1.0
DOC = fraction biodegradable organic carbon in MSW (defaults = 10-15% dry
weight)
DOCf = fraction DOC dissimilated to CH4 or CO2 (default = 0.77)
F = CH4 fraction of landfill gas (default = 0.5)
R = recovered CH4 via active extraction (Tg/yr)
OX = methanotrophic oxidation factor (fraction); default = 0
IPCC (1996) provides default values for variables if country-specific information
is not available. Overall, emissions estimated with this methodology show a high
bias due to high rates of waste generation, landfilling and anaerobic landfilling,
and assuming that waste generated is collected and disposed of. For example,
default landfilling rates were ~60% for Asian countries (IPCC, 1996). These
values, combined with high estimates of the fraction of landfilled waste disposed
of under anaerobic conditions (~40% for most countries), results in anaerobic
landfilled waste equal to 24% for Asian developing countries. Table 3 (waste
disposition) shows that assumptions of landfilling and anaerobic landfilling rates
in the IPCC method are not consistent with field observations and produce a high
bias in methane production and emission. The method also implicitly assumes
that generated waste is collected and disposed of at landfills, further introducing
a high bias in estimated emissions. Carrying out the full set of calculations, from
waste generation through methane emission, using the IPCC method and defaults

29
produces emissions (~33 Tg CH4 /yr) very similar to those reported by others
who rely on the method confirming quantitatively the high bias in the method
and defaults.
The work of Bogner and Matthews (2003) relied on a modified version of this
methodology as follows:
Methane emitted (Tg) ={[MSWt * MSWf * MCf * DOC * DOCf * F * (16/12)] - R} * (1- OX) (2)
where:
MSWt = total municipal solid waste generated
DOCt = dissimilated fraction DOC in MSW reduced from 0.77 (default) to 0.5
OX = methanotrophic oxidation factor increased from 0 (default) to 0.1
The major difference in this approach relates to MSW generation; defaults for per
capita waste-generation are replaced with the proxy of per capita energy
consumption. This approach, together with reducing the fraction of dissimilated
DOC from 0.77 to 0.5 and accounting for methane oxidation in the landfill cover,
lowers the global estimate of methane emission by >50%. Matthews and
Themelis (2007) employed this proxy approach to explore the impact of recycling
and waste-to-energy efforts on reducing emission from solid waste for the period
2000-2030. The study incorporates estimates for MSW recycled (14% of total
MSW generated) and MSW treated in WtE plants (4 Tg) for the start year of
2000); DOC content was set to 0.3 for all countries. Note that we now consider
that this recycling rate is an overestimate but has modest influence on emission
results. However, assumed DOC content is also considered an overestimate with
a substantial impact on emission estimates. I.e., emissions are likely lower than
reported by Matthews and Themelis (2007).
3.2 Projections of solid waste and methane emission Figure 3 shows five global projections of methane emission from municipal solid
waste (MSW) illustrating some of the range and uncertainty in global estimates of
emissions for current and future periods. Emissions in 2000 vary by factor of
four. The Environmental Protection Agency's estimates (EPA-REF06 and REF11)
reflect primarily the IPCC Tier I methodology with high rates of waste generation,
landfilling, and anaerobic landfilling resulting in high methane production and

30
emission (EPA, 2006, 2011). Baseline (Current Legislation) emissions from the
GAINS model (GAINS-CLE) developed at the International Institute for Applied
Systems Analysis (IIASA) (Hoglund-Isaksson, 2012) start in 2005 and are similar
to EPA. The highest (RCP-8.5) emission scenario from the IPCC's Representative
Concentration Pathways (RCP) (Moss et al. 2010) totals ~40 Tg in 2000.
The GISS-REF result relies on most of the modifications discussed above, e.g.,
lower per capita MSW generation rates derived from a per capita energy
consumption proxy, as well as lower landfilling and anaerobic landfilling rates
based on regional data, and lower efficiencies for landfill gas capture.
Relevant populations (urban populations for developing countries and total
populations for developed countries) rise ~35% between 2000 and 2030
suggesting that unabated emissions could rise a minimum of ~35% solely in
response to population dynamics. However, CH4 increases of >35% can be
expected due to, e.g., faster growth of urban vs. total populations and rising
landfilling rates whereas future emissions could be moderated by other
management practices such as declining per capita waste generation and
diversion of organic waste to composting.
The numerous variables influencing solid-waste methane emission, along with
poor transparency for some projections, make comparing causes for different
trends difficult. However, the flat EPA06- and EPA11-REF trajectories, rising 9%
and 19%, respectively, in response to 25% larger population by 2020 and 35%
larger by 2030, are difficult to explain without invoking mitigation measures that
are not documented; legislative impacts are not included in this inventory
approach and thus do not contribute to trends.
GAINS-CLE shows modest growth of 11% which amounts to 4 Tg CH4 more
annually by 2030. The GAINS-CLE trajectory is somewhat predictable because
these CLE scenarios account for legislation that acts to reduce emissions,
although is not designed to do so. GISS-REF rises by 120%. However the low
initial 2000 value of ~10 Tg in GISS-REF means that this large relative increase
only brings the global emission total to ~22 Tg CH4 in 2030.

31
Current methane emissions from landfills are likely closer to 10 Tg CH4/yr than
to 35 Tg as reported in most studies relying on IPCC-based methodology. While
developing countries will account for the majority of population growth in
coming decades, including disproportionate growth of urban populations,
methane emission from solid-waste management is not likely to grow at the high
rates exhibited by projected trends in population and economic growth. There are
reasons to support the hypothesis that developing countries are on a different
trajectory than that historically followed by industrialized countries i.e., almost
complete reliance on landfilling of waste, followed by conversion to incineration.
Reasons include:
Developing countries have well-established cultures (and increasing need)
of recycling, reuse and recovery.
Rapid growth of large cities is competing for peri-urban space where
waste has historically been deposited and where new housing is needed.
Chronic lack of funds for waste management and other services in poor
countries, together with space limitations, suggests that constructing
methane-producing sanitary landfills will not be the primary solution to
managing municipal waste.
High organic content (50-80%) of waste in developing countries, together
with emerging plans for source separation and collection of waste,
suggests that the role of aerobic composting will rise in coming decades if
problems of marketability, product quality and source separation can be
solved.
Reduction of the amount of waste requiring disposal at dumps or
landfills—particularly of organics that contribute most to methane
production and emission—represents a decoupling of landfilling and
methane emission from population and economic growth.
Low current methane emissions from waste disposal, together with future
modest trends outlined here, imply that mitigation of waste-related CH4
emission, including Clean Development Mechanism (CDM) projects, is a
weak candidate for limiting climate change.
The GISS-REF scenario reflects a plausible trajectory for solid waste generation
and management and associated methane emission. The results rely largely on
the modifications discussed above. However, DOC contents were lowered from

32
30% (Matthews and Themelis, 2007) to those used by Bogner and Matthews
(2003) (15-20% of waste on a dry weight basis) after confirming these lower
values from observations of waste composition and water content. Note that
waste composition reported in Table 1 is on a wet weight basis; converting to dry
weight reduces carbon contents by about 50%.) Additional assumptions include
gradual increases in landfilling rates for developing countries.
Three projections investigating the potential for mitigating future emissions
through more aggressive incineration and composting practices were developed
in relation to the GISS REF estimate:
MIT1-I (incineration): REF + incineration prescribed at 1% of generated waste
for all developing countries in 2015 and evolving at +1%/yr of waste generated
afterward
MIT2-C (compost): REF + composting prescribed at 1% of DOC for all
countries in 2010, evolving at +1.5% DOC/yr afterward
MIT3-I+C: REF + MIT1-I + MIT2-C
Global results are shown here although calculations were carried out for each
country and year. For context, 2000 values are: MSW production, 887 Tg; DOC
production, 133 Tg; CH4 production, 16 Tg; CH4 capture, 4 Tg; CH4 oxidation in
the landfill cover, 2 Tg; and CH4 emitted, 10 Tg. MSW and DOC production are
constant for all scenarios.
Figure 3 compares GISS 2030 REF and MIT results, relative to 2000, grouped by
variable; Figure 4 shows 2030 results, relative to 2000, grouped by projection, to
better illustrate the dynamics generated by projection assumptions; Table 7
summarizes these relative results; Table 8 summarizes 2030 results in Tg for all
but MIT projections which are shown as percentage change relative to 2030 REF.
While relative results highlight interrelationships among variables and scenarios,
absolute values, especially of methane produced, emitted and mitigated, govern
the impact of scenarios on climate-chemistry interactions and may guide policy
decisions regarding the effectiveness of alternative mitigation options.
33
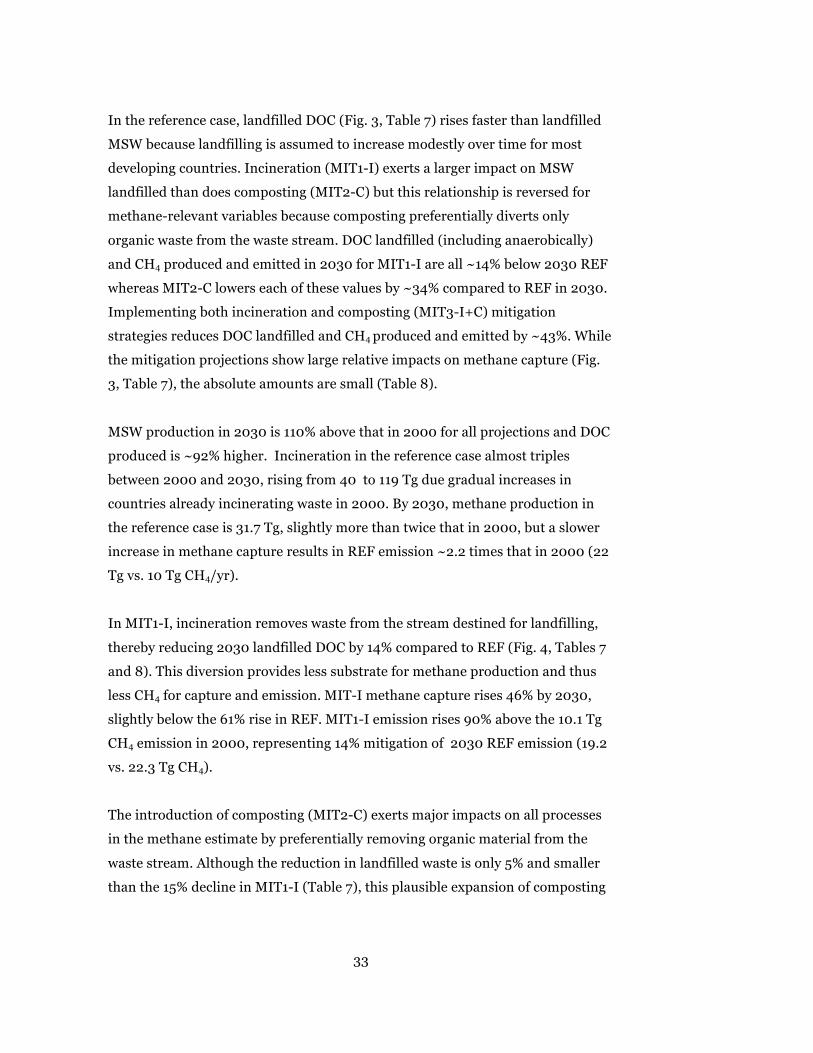
In the reference case, landfilled DOC (Fig. 3, Table 7) rises faster than landfilled
MSW because landfilling is assumed to increase modestly over time for most
developing countries. Incineration (MIT1-I) exerts a larger impact on MSW
landfilled than does composting (MIT2-C) but this relationship is reversed for
methane-relevant variables because composting preferentially diverts only
organic waste from the waste stream. DOC landfilled (including anaerobically)
and CH4 produced and emitted in 2030 for MIT1-I are all ~14% below 2030 REF
whereas MIT2-C lowers each of these values by ~34% compared to REF in 2030.
Implementing both incineration and composting (MIT3-I+C) mitigation
strategies reduces DOC landfilled and CH4 produced and emitted by ~43%. While
the mitigation projections show large relative impacts on methane capture (Fig.
3, Table 7), the absolute amounts are small (Table 8).
MSW production in 2030 is 110% above that in 2000 for all projections and DOC
produced is ~92% higher. Incineration in the reference case almost triples
between 2000 and 2030, rising from 40 to 119 Tg due gradual increases in
countries already incinerating waste in 2000. By 2030, methane production in
the reference case is 31.7 Tg, slightly more than twice that in 2000, but a slower
increase in methane capture results in REF emission ~2.2 times that in 2000 (22
Tg vs. 10 Tg CH4/yr).
In MIT1-I, incineration removes waste from the stream destined for landfilling,
thereby reducing 2030 landfilled DOC by 14% compared to REF (Fig. 4, Tables 7
and 8). This diversion provides less substrate for methane production and thus
less CH4 for capture and emission. MIT-I methane capture rises 46% by 2030,
slightly below the 61% rise in REF. MIT1-I emission rises 90% above the 10.1 Tg
CH4 emission in 2000, representing 14% mitigation of 2030 REF emission (19.2
vs. 22.3 Tg CH4).
The introduction of composting (MIT2-C) exerts major impacts on all processes
in the methane estimate by preferentially removing organic material from the
waste stream. Although the reduction in landfilled waste is only 5% and smaller
than the 15% decline in MIT1-I (Table 7), this plausible expansion of composting

34
reduces methane emission by 34% compared to REF in 2030, primarily by
lowering landfilled DOC through, diversion of organics (Fig. 4, Table 8).
Despite the large relative rise (120%) in REF emission over the 30 year period,
this increase represents only ~12 Tg CH4/yr and total baseline emission from this
study in 2030 remains below emissions reported for 2000 by others, highlighting
the importance of reliable initial-year emission values (Fig. 1). Similarly, the
substantial mitigation of 43% in 2030 emissions, achieved through implementing
both incineration and composting strategies, amounts to <20 Tg CH4/yr.
The incineration and composting mitigation projections presented here (MIT1-
Iand MIT2-C) are designed to reflect plausible strategies, i.e., assuming low
initial, and gradually rising, rates of implementation, unlike most scenarios that
assume near complete adoption of mitigation technologies in all countries (EPA,
2006b; UNEP, 2011a,b; Hoglund-Isaksson, 2012).
4. Comparison to existing methodologies and data, and implications for methane emissions The results and data compilations from this study are compared to current
methods and defaults used to estimate methane emissions from solid waste
(IPCC and EPA) and to waste-related data relevant to estimating methane and
other emissions (Hoornweg and Bhada-Tata, 2012). As discussed above, current
global methane emissions, including those of IPCC, EPA and IIASA, are ~35 Tg
CH4/yr whereas our recent estimate is ~10 CH4/yr; differences in future
emissions are also substantial in trend and absolute amounts. Causes for these
differences are attributable to differences in underlying data, default values and,
to some extent, methodology among the studies.
Equations 1 and 2 assume oxidation of methane in landfill cover materials of 0%
and 10%, respectively. The latter, from a single study of a New Hampshire landfill
(Czepial et al., 1996), remains the IPCC standard. Subsequent laboratory and
field measurements of oxidation rates in cover soils confirm the occurrence of
higher oxidation rates that vary with cover type, season (temperature) and
moisture (e.g., Boeckx and Van Cleemput, 1996; Chanton et al., 2009; Spokas et

35
al., 2012). Chanton et al. (2009) reviewed oxidation rates in landfill cover soils
from 72 studies. A subset of 15 extending over a full annual cycle displays a range
of oxidation rates from 11 to 89%, with a mean of 35%; only 4 of 72 studies
reported methane oxidation rates of 10% or less suggesting that the 10% IPCC
default contributes to overestimates of emission. It is important to note that
applying more realistic oxidation rates would lower estimated emissions only
from managed landfills, which occur overwhelmingly in developed countries.
However, IPCC (1996) landfilling defaults (and thus emissions) are likely
overestimated for many developing countries and the 10% oxidation default
further contributes to the high bias in emissions for these countries.
Table 1 lists waste-composition data for a wide variety of countries and cities
compiled as part of this study; Table 9 lists regional IPCC default values for waste
composition from IPCC's Good Practices (2000). (Note that Table 9 is missing
many values requiring caution when applying the numbers. Percentages for half
the 19 regions in the table sum to <90%, which may underestimate emission if
the missing values are not filled in to total 100%.) Despite variability in the
observations, differences between the data compilation and IPCC default values
are evident. The most important difference with relevance for methane estimates
is that IPCC default fractions for food waste (Table 9) are substantially lower than
waste studies indicate (Table 1). For example, IPCC proposes default food
fractions for Asia from 26% to 40% whereas observed fractions are higher (~45%
to 82%), barely overlapping with the IPCC range. Similarly, except for South
Africa, IPCC food defaults for African regions are 40-54% whereas most studies
report values of 50-95%. For Europe and the US, IPCC values are similar to those
in Table 1 whereas South and Central American IPCC values for food appear to be
somewhat low. Paper and cardboard is the second most important waste
component influencing methane emission. Differences between IPCC defaults
and the new data compilation are less pronounced although these composition
data are more variable than those for food, making comparisons difficult.
However, IPCC defaults appear to be higher than the data for most of Asia while
more closely resembling the field reports for developed Asian countries and
cities. Taken alone, low IPCC defaults for food waste underestimate methane

36
emissions from solid waste. This low bias may be modesty offset if default paper
fractions are overestimated for some regions.
The low food/organic default fractions from IPCC (2000) are more than offset by
high default rates for landfilling. These rates are major contributors to high
current and future estimates of methane emissions from waste from studies
following IPCC methods, including those by EPA and by UNFCC when estimating
emissions for countries that do not submit their own reports. As noted, IPCC
methods do not explicitly account for collection rates, which are substantially
<100% of generated waste according to field measurements and estimates (Table
2). However, IPCC (1996) includes implicit collection efficiency in the form of
landfilling rates. The latest IPCC (2006) guidelines dispense with landfilling
rates, and indirectly address collection rates via defaults for proportion of waste
disposed of in SWDSs. As in the 1996 guidelines, uncollected waste then drops
out of the calculation. More importantly, non-specific disposal information!i.e.,
SWDS!does not facilitate applying methane-correction factors in an informed
way.
Hoglund-Isaksson (2012) reported methane emissions from the GAINS model for
all anthropogenic methane sources for a baseline scenario - referred to as Current
Legislation (CLE) - and a mitigation scenario (Maximum Feasible Reduction
(MFR)). GAINS-CLE emissions for MSW are shown in Fig. 2. This CLE scenario
is not strictly comparable to other inventory-based results such as those of GISS
and EPA because legislation exerts a considerable influence to lower emissions
although the purpose is not mitigation. For MSW, emissions with legislative
effects are ~30% lower than the non-legislation case; technological mitigation
further reduces 2030 CLE emissions by 85%.
Data are currently lacking to characterize the extent of anaerobicity in dump
sites. Nevertheless, it is anticipated that further data analysis will confirm that
defaults for DOC decomposing under anaerobic conditions in unmanaged
dumpsites are overestimates in IPCC methods. IPCC's high anaerobic landfilling
rates, in combination with high methane potential of the waste, are the dominant

37
controllers of the high bias in methane emissions resulting from IPCC-based
estimates.
Composting, open burning and waste-to-energy presumably account for the
difference between generated and landfilled waste although these disposal
mechanisms were not explicitly addressed in IPCC (1996). While waste diverted
to WtE plants may be reasonably well quantified and is included in the 2006
methodology, the extent of informal composting and open burning is highly
uncertain and poorly documented. Although IPCC landfilling rates indirectly
'subtract' some waste from that destined for landfills (landfilling rates <100%),
the fate of this waste remains unaddressed despite the fact that some guidance is
given for emissions if these data are available. The consequence of dropping this
waste fraction from the calculation is to underestimate the waste disposed of via
informal and/or spontaneous open burning, and perhaps via informal
composting. Informal burning produces little methane but emits other air
pollutants including black carbon that have known negative impacts on both
climate and human health (UNEP, 2011a). It is critical to deal explicitly with this
unaccounted-for waste disposal in order to reduce uncertainties associated with
methane emissions and emissions of other pollutants generated from burning.
Hoornweg and Bhada-Tata (2012) recently published What a Waste: Waste - A
Global Review of Solid Waste Management which may be used to estimate
methane and other emissions from waste although the report's focus is on
planning for integrated waste management. They compiled data from a several
large data sets (PAHO, OECD, and UN). The authors applied information on per
capita waste generation to population statistics to estimate total waste produced,
collected and disposed of for the current period; projections of population and
increases in per capita waste generation were used to estimate waste in 2025.
Hoornweg and Bhada-Tata (2012) stratified the country/city data with World
Bank's income classification to report typical values for variables by income and
region. A preliminary comparison of Hoornweg and Bhada-Tata's country lists
and underlying data sets against the data compiled for this report (Tables 1, 2, 3)
reveals several patterns. Some of the same data sources were used in both reports
but there was less source overlap than expected:

38
Food-waste fractions from Hoornweg and Bhada-Tata (2012) are higher
than the low defaults from IPCC (2000) (Table 9) and appear to be
modestly lower than those in Table 1 which might introduce a low bias
into methane-emission estimates if these data are used.
Waste-collection rates from Hoornweg and Bhada-Tata (2012) are
generally similar to those listed in Table 2; the impact of explicitly
including waste-collection rates in methane estimates has not yet been
investigated; while the fate of uncollected waste will determine whether
emission is higher or lower by accounting for this waste amount, the most
likely impact of integrating collection data would be to lower emission
estimates.
Disposal sites are classed into landfills and dumps by Hoornweg and
Bhada-Tata (2012), which is of more practical use than IPCC's generic
SWDS, as well as being relevant for waste planning. However, this
distinction does not provide sufficient information about disposal to
improve estimates methane emission from solid waste. Table 3
distinguishes among sanitary landfills, controlled landfills and dumps,
and open dumps which is of direct relevance to methane studies.
Identifying the prevalence of sanitary landfilling as a disposal strategy is
important for estimating methane emissions, whereas characterizing
depth and anaerobicity of controlled landfills/dumps and of open dumps
is more difficult but also critical for emissions.
5. Missing Links and Reducing Uncertainties 5.1 Missing links between waste studies and modeling studies The lack of connection between waste studies and 1) inventory methods, 2)
integrated assessment modeling and 3) climate-chemistry modeling is
remarkable and curious (IPCC, 1996, 2000, 2006; Nakicenovic et al., 2000;
Monni et al., 2006; EPA, 2006a,b; Bahor et al., 2009; Lamarque et al., 2010;
UNEP, 2010c, 2011a, b). This problem is particularly obvious in studies
investigating future climate, health and other impacts of emissions and
mitigation technologies (UNEP, 2011a) that rely on a list of mitigation
technologies proposed more than a decade ago (EPA, 1999).

39
The reasons for this lack of connection are unclear. For example, UNEP's waste
report (2010c) states that "reliable data is costly and time-consuming to obtain.
For these reasons, the IPCC provides a set of default values, which can be used
where data is unavailable to calculate national GHG emissions from landfill."
However, the origin of the IPCC defaults is obscure, and UNEP offers no
assessment of the IPCC defaults or of their impact on estimated methane
emission. While acknowledging that the international literature linking waste and
climate change focuses largely on developed countries, the report attributes this
to a lack of data on waste streams and management for developing countries, a
conclusion inconsistent with data reported here and elsewhere. The problem does
not seem to be that data are unavailable but rather that the extensive array of
waste publications is ignored. UNEP (2010c) also states that the assumed rate of
landfill gas capture is a key parameter in estimating methane emissions whereas
the present study identifies alternate assumptions and data, including waste
composition, disposal, and landfilling rates, as most critical to global methane
emission from solid waste; assumed capture rate is not a major determinant since
most countries do not have landfills and even fewer have gas capture in place.
The massive literature on all aspects of waste is dominated by studies that assess
current conditions in order to develop plans for integrated solid-waste
management; they report on waste composition, collection, and disposal along
with cultural, institutional, financial and regulatory influences on conditions and
practices associated with solid waste, and propose practical solutions to
recognized problems. In contrast, the majority of inventory methods and
projections/scenarios of emissions (IPCC, 1996, 2000, 2006; Nakicenovic et al.,
2000; EPA, 2006a; Moss et al., 2010; Hoglund-Isaksson, 2012) rarely refer to
this literature. This historical pattern continues for the next IPCC assessment
report (AR5), which relies on very aggregated emission scenarios (RCPs) (Moss et
al., 2010; Lamarque et al., 2010) from updated versions of the integrated
assessment models that provided emissions in 2000 (Nakicenovic et al., 2000).
Further complicating matters is the lack of transparency typically surrounding
emission estimates, making it difficult to determine specifics about assumptions
and technologies that drive baseline and mitigation projections, and

40
consequently to interpret results of the climate-chemistry studies based on these
emissions. The RCP projections are almost completely lacking in transparency
whereas the recent work of Hoglund-Isaksson (2012) offers comprehensive
information on data sources, underlying data, assumptions, emission factors etc.
For reasons discussed above, estimates of methane emission from solid waste
based on the commonly-used IPCC methodology, are high! perhaps 2-3 times
actual values for the contemporary period (Figure 1). Mitigation projections
reported in the literature also probably overestimate abatement potential by
assuming almost universal adoption, and substantial reduction potential, of
implemented technologies (EPA, 2006b; Hoglund-Isaksson, 2012). The present
study, designed to represent plausible trajectories for baseline and mitigated
emissions, reports much lower current emission and less dramatic abatement
potential in 2030.
Development of policies aimed at mitigation of emissions from solid waste
crucially depends on the reliability of both the magnitude of future methane
emission (i.e., is the source large enough to warrant mitigation?) and plausible
abatement of emission (i.e., is it possible to implement policies widely enough to
plausibly reduce emission from the source?). While providing a wide range of
possible emission futures for climate-chemistry studies is of scientific value, wide
emission ranges do not provide the information necessary to make policy
decisions. Similarly, the standard approach of assuming near-universal adoption
of abatement technologies to define maximum mitigation potential has little
relevance when policies must be considered for implementation in real
circumstances. For example, exploring the impact of landfill-gas capture as a
methane-mitigation strategy is largely irrelevant in light of the documented
ubiquity of uncontrolled waste dumping together with the likelihood that landfills
will not be a primary disposal strategy for solid waste in coming decades.
The consequence of the gulf between waste studies and modeling studies is that
projections/scenarios, and the studies that rely on them, may fail to realistically
reflect solid-waste conditions and processes thus failing to address plausible
approaches to projecting future baseline and mitigation emissions of methane

41
and other climate-relevant constituents. The problem is not lack of data per se;
large amounts of data are available albeit much remains in dispersed form and
data reliability remains a challenge in improving estimates of methane emission
from solid waste. However, a willingness to cross disciplinary barriers will speed
progress in improving the reliability, and reducing the uncertainties, inherent in
quantifying the role of solid waste in biogeochemical and climate dynamics.
5.2 Reducing uncertainties 5.2.1 Fires Fires in dumps and other uncontrolled environments occur for several reasons.
Some accidentally ignite while others are purposely set in dumps and elsewhere.
Once ignited, fires in dumps deep enough to produce methane are fueled not just
by the waste but also by methane migrating from below. Methane is explosive in
concentrations between 5 and 15% by volume of air so methane in decomposing
waste is fuel awaiting a fire. Catastrophic collapses in large dumps, following
destabilization by rain (e.g., Payatas and Smokey Mountain in the Philippines),
bury homes and agricultural fields killing hundreds maybe thousands of people
in and near the dumps. Spontaneous fires, fueled by methane migration in deep
dumpsites, can erupt when landsides release pressure and thus cause further
destruction following the collapses.
Many studies anecdotally note fire as a waste management tool (Table 3)
although quantification is difficult because of their ubiquitous and small-scale
occurrence, especially when informally carried out in communities. Set and
spontaneous fires in landfills and dumpsites in developing countries are
common, the former to reduce waste volume and retrieve valuable metals, the
latter as a consequence of uncontrolled conditions. For example, Smokey
Mountain in the Philippines was named for the continuous fires that pollute the
environment surrounding the dump. In addition to causing explosions in dumps,
fires contribute to the release of an array of other pollutants (i.e., black carbon,
CO, mercury) that negatively influence human health and atmospheric chemistry
and climate.

42
How common are fires as a strategy for waste management? What is the role of
fires at landfills, dumpsites, and communities? How can we reduce the large
uncertainties associated with estimates of amount of waste burned and gases and
particles emitted from these fires?
Very briefly outlined here are several approaches that may reduce uncertainties
related to waste fires.
1. If dump/landfill locations are established, it may be possible to use
selected, high resolution satellite data such as MODIS or Terra to
characterize the seasonality and extent of fires at large sites. It may be
useful to explore combining these temporal and spatial fire patterns with
information on waste composition to estimate emissions from large
dumpsite fires surrounding large population centers. It may also be
possible to evaluate these estimates through local or regional modeling
efforts and additional satellite data on air quality.
2. Another possible approach to reduce the uncertainty in amounts of waste
burned informally on small scales (backyards, within cities) is to integrate
city data on waste generation and disposal with local waste-collection
rates to deduce the uncollected fraction of waste whose fate is
unaccounted for and unknown. This amount provides an upper estimate
for waste that is informally burned or otherwise disposed of outside of
collection systems. This uncollected portion is a nontrivial amount—about
50% in many cities of the developing world—and is not explicitly
unaccounted for in inventories of methane and other constituents
associated with waste (Table 2). The likely impact of the current
methodological gap is an overestimate of landfilled waste, which
translates into overestimated emission.
5.2.2 Anaerobicity in uncontrolled landfills and dumps Dumping in low-lying areas including rivers, riverbanks and 'water bodies' is
commonly mentioned in the waste literature. How much waste goes to open
dumps that support anaerobic (methane-producing) conditions either because
they are deep or they are located in wet areas? How deep are dumps and how
prevalent are inundated conditions? How can we explicitly address the world's

43
substantial use of uncontrolled sites for waste disposal and its role in emitting
methane?
A large and representative data base on waste composition has been developed
for this study but needs augmentation and quality control. Hoornweg and Bhada-
Tata (2012) also report on a new data compilation, including waste composition.
Although individual numbers may not all be reliable, robust patterns emerge
from analysis of the data in Table 1, particularly for the organic (food) waste
fraction that constitutes the dominant controller of methane production and
emission in most of the world's disposal sites.
Reducing uncertainties may be accomplished via further data mining to better
characterize uncontrolled waste-disposal sites to improve estimates of the
fraction of waste deposited in anaerobic conditions; existing data sets (OECD,
2008; PAHO, 2005) are not equipped to address this issue. Similar to others, the
GISS methodology employs landfilling and anaerobic landfilling rates to estimate
the amount of waste in anaerobic conditions in uncontrolled landfills and dumps.
Landfilling rates reported in this study (Table 3) are lower than the IPCC defaults
(Table 9) but there is little to confirm or reject these lower values without more
focused data collection and site characterization. Because the extensive study of
Hoornweg and Bhada-Tata (2012) does not distinguish disposal at sanitary,
partially controlled and uncontrolled landfills, their data cannot be used to
characterize the extent of anaerobic waste disposal in poorly controlled sites.
6. Prospects for solid waste management and methane emissions As of 1999, no new landfills can be built within the European Union. This
legislation was preceded by years of consistent and strong government
implementation and facilitation of recycling, composting and reuse programs.
For example, he Netherlands landfills only 3% by weight of all waste produced in
the country, consisting mostly of ash from incineration. Moreover, bulky
products like wood, furniture, and construction and demolition waste, as well as
clothing, paper and plastics, are recycled in an industrial ecology model that

44
operates on a quasi-regional scale. Many countries in Eastern Europe, such as the
Czech Republic, have a short history of landfills. It is therefore likely that
methane emission will continue to decline in Europe
The US continues to landfill a high fraction of waste (~65%) due in part to high
consumption of disposable items, excessive packaging, and low recycling rates for
paper, plastic, and bulky items like furniture, and C&D waste. The environment
for businesses producing and using recycled products is volatile in price and
supply although public projects in cities sometimes incorporate recycled building
materials. Paper recycling is relatively high but a small fraction of plastics is
recycled because many cities recycle only a small faction of plastic materials and
because compliance and education are generally poor. Rather than reducing
waste, and boosting reuse including recycling and composting, the US has moved
toward closing small landfills and establishing regional megafills (Staley and
Barlaz, 2009). While many of the small landfills did not capture landfill gas, and
therefore probably emitted more methane per unit waste than larger facilities,
the regional model requires long-distance transport of waste via rail and truck,
adding to greenhouse gas emissions associated with solid-waste management.
Developing countries have a long history of informal recycling and reuse, and few
sanitary landfills. Informal sectors continue to play a large role in waste
management but rapidly growing megacities, especially in Asia, are straining or
overwhelming current systems, and unmanaged and unsorted waste is causing
serious health hazards due to toxics, fires in dumps, and water pollution. Despite
historical and current pressure from industrialized countries to build sanitary
landfills and mechanized composting plants, integrated indigenous systems are
emerging in developing countries.
The waste literature discussed here is almost universally focused on integrated
waste management plans comprising collection, transport, sorting/separation,
and disposal; the latter includes composting, recycling, reuse, materials recovery,
landfilling, and leachate capture with treatment or recirculation. Space for
controlled landfills is universally limited as is funding for waste management in
developing countries.

45
Unlike the EU and North America, developing countries have many illegal and/or
unregulated dumps while managed landfills, including sanitary landfills, are
relatively scarce. In order to provide controlled locations for disposal of solid
wastes, dumps require upgrading and addition of services such as recycling and
composting areas, and leachate capture. For example, the Centro de Tratamento
de Resíduos Sólidos (CTRS, Solid Waste Treatment Centre) in Belo Horizonte,
Brazil, includes a sanitary landfill, a small materials recovery area and leachate
capture and treatment.
Rehabilitation is costly for the large, deep sites that are likely producing methane.
Because most dumps in developing countries receive waste from all sectors
(residential, industrial, commercial, construction and demolition and hospitals),
they represent large mixed reservoirs including toxic and other dangerous
constituents such as heavy metals, pathogens, and medical waste. Leachate
capture and treatment is essentially nonexistent in existing dumps even when
waste disposal is controlled to some extent. Leachate is a long-term problem
posing serious risks to soil, ground and surface water, and human health and
treatment systems are expensive. An alternative is to capture leachate and re-
circulate it into the site's waste, which reduces but does not eliminate pollution
risks.
Composting the large fraction of organics in waste of developing countries (Table
1) is the most likely candidate to mitigate waste-related methane emission now
and in the future. It would also divert the dominant source of leachate that
contaminates soil, and ground and surface water at disposal sites. Composting
could also reduce costs associated with waste collection and disposal but only if
municipalities are providing these services. However, because illegal dumping is
prevalent (Table 3) and inexpensive, implementation of composting programs
would represent additional costs if these programs replace open dumping for the
disposal of organic waste. For this reason, plans for initiating and/or broadening
composting programs in developing countries typically address development of
steady markets for the finished product which is not a trivial effort. For example,
even in the U.S., where large-scale composting is carried out primarily by

46
municipalities and yields a usable product, the finished compost is usually given
away because markets have not materialized.
If composting is further implemented in developing countries, low-cost and low-
technology manual composting is most likely to succeed given the historical
failure of costly, mechanized plants. While composting is the disposal approach
best suited to the waste composition and financial constraints of developing
countries, crucial barriers to successful composting must be addressed to ensure
success. These include, inter alia, the poor quality of input material due to lack of
source separation and lack of expertise in the biological and environmental
requirements of the composting process.

47
7. References Abel, A., An analysis of solid waste generation in a traditional African city: The
example of Ogbomoso, Nigeria. Environ. Urban., 19, 527-537, doi: 10.1177/0956247807082834, 2007.
Abu Qdais, H.A., M. F. Hamoda and J. Newham, Analysis of residential solid waste at
generation sites. Waste Manage. Res., 15, 395-406, 1997. Agarwal, A., A. Singhmar, M. Kulshrestha and A.K. Mittal, Municipal solid waste recycling and
associated markets in Delhi, India. Resources, Conserv. Recyc., 44, 73-90, 2005. Amini, H.R. and D.R. Reinhart, Evaluating landfill gas collection efficiency uncertainty. In
Proceedings, Sardinia 2011, Thirteenth International Waste Management and Landfill Symposium, S. Margherita di Pula, Cagliari, Italy, 3-7 October 2011. CISA, Italy, 2011.
Asian Institute of Technology (AIT), Municipal Solid Waste Management in Asia, Asian Reg.
Res. Prog. Environ. Technol. (ARRPET), AIT, Thailand, 2004. Asian Institute of Technology and United Nations Environment Programme (AIT/UNEP),
Municipal waste management report: Status quo and issues in Southeast and East Asian countries. UNEP, Thailand, 2010.
Arena, U., Process and technological aspects of municipal solid waste gasification. A review.
Waste Manage., 32, 615-639, 2012. Azevedo, M., M. Cruz And T. Novais, Forming public consortiums for final solid
waste Disposal and treatment in Brazil. Proceedings Sardinia 2011, Thirteenth International Waste Management and Landfill Symposium. S. Margherita di Pula, Cagliari, Italy, 3-7 October, 2011. CISA, Sardinia, 2011.
Bahor, B. M. Van Brunt, J. Stovall, and K. Blue, Integrated waste management as
a climate change stabilization wedge. Waste Manage. Res., 27, 839–849, doi: 10.1177/0734242X09350485, 2009.
Blight, J. and L. Mussane, Sustainability and recycling in poor communities: A
case study in the Eastern Cape, South Africa. In Management of Solid Wastes in Developing Countries, edited by L. F. Diaz, L. L. Eggerth and G.M. Savage, p. 202-212. CISA, Padova, Italy, 2007.
Boeckx, P. and O. Van Cleemput, Methane oxidation in a neutral landfill cover
soil: Influence of moisture content, temperature, and nitrogen-turnover. J. Environ. Qual., 25(1), 178-183, 1996.
Bogner, J. and E. Matthews, Global methane emissions from landfills: New
methodology and annual estimates 1980–1996. Global Biogeochem. Cycles, 17(2), 1065, doi:10.1029/2002GB001913, 2003.
Brunner, P.H. and J. Fellner, Setting priorities for waste management strategies in developing
countries. Waste Manage. Res. 25, 234-240, 2007.

48
California Compost Quality Council, Compost Maturity Index.
http://Www.Epa.Gov/Osw/Conserve/Rrr/Composting/Pubs/Ca-Index.Pdf, 2001.
CalRecovery and United Nations Environment Programme (UNEP), Div.
Technology, Industry and Economics, International Source Book on Environmentally Sound Technologies (ESTs) for Municipal Solid Waste Management (MSWM), Vol. II, Regional Overviews and Information Sources, 2005.
Chanton, J. and K. Liptay, Seasonal variation in methane oxidation in a landfill
cover soils determined by an in situ stable isotope technique. Global Biogeochem. Cycles, 14(1), 51-60, 2000.
Chanton, J.P., D.K. Powelson and R.B. Green, Methane oxidation in landfill cover
soils, is a 10% default value reasonable? J. Environ. Qual., 38, 654–663, 2009.
Chikarmane, P. and L. Narayan, Rising From the Waste - Organising wastepickers in India,
Thailand and the Philippines, Committee for Asian Women, Bangkok, Thailand, 2009. Clarke, L. and J. Weyant, Introduction to the EMF Special Issue on climate change control
scenarios. Energy Econ., 31, S630S81, 2009. Cointreau-Levine, S., Private sector participation in municipal solid waste services in
developing countries, Urban Management Programme Discussion Paper No. 13. World Bank, Washington, D.C., 1994.
Czepiel, P.M., B. Mosher, P.M. Crill, and R.C. Harriss, Quantifying the effects of
oxidation on landfill methane emissions. J. Geophys. Res., 101(Dll), 16,721-16,729, 1996.
Damodaran, N., A. Robinson, E. Dadid and N. Kalas-Adams, Solid waste generation and
management in India. Proceedings Sardinia 2003, Thirteenth International Waste Management and Landfill Symposium. S. Margherita di Pula, Cagliari, Italy, 6-10 October 2003, CISA, 2003.
Daskalopoulos, E., O. Badr and S. D. Probert, Economic and environmental
evaluations of waste treatment and disposal technologies for municipal solid waste. Appl. Energy, 58(4), 209-255, 1997.
Dentener, F. The impact of air pollutant and methane emission controls on
tropospheric ozone and radiative forcing: CTM calculations for the period 1990-2030. Atmos. Chem. Phys. Discuss. 4:1-68, 2005.
Dever, S., T. Clingan, X. Wang and S. Bateman, Evaluating landfill gas emission
at the Wollert landfill, Australia. In Proceedings Sardinia 2011, Thirteenth International Waste Management and Landfill Symposium. S. Margherita di Pula, Cagliari, Italy, 3-7 October, 2011. CISA, Sardinia, 2011.

49
De Visscher, A., I. De Pourcq, and J. Chanton, Isotope fractionation effects by diffusion and methane oxidation in landfill cover soils, J. Geophys. Res., 109, D18111, doi:10.1029/2004JD004857, 2004.
Dhande A.D., S.T. Ingle, S.B. Attarde and N.D. Wagh, Ecofriendly approach of
urban solid waste management: A case study of Jalgaon city, Maharashtra. J. Environ. Biol., 26(4), 747-52, 2005.
Diaz, L.F., L. L. Eggerth and G.M. Savage (eds.), Management of Solid Wastes in Developing
Countries, CISA, Padova, Italy, 2007a. Diaz, L.F., L. L. Eggerth and G.M. Savage, The management of solid wastes in economically
developing countries. In Management of Solid Wastes in Developing Countries, edited by L.F. Diaz, L. L. Eggerth and G.M. Savage, p. 17-29. CISA, Padova, Italy, 2007b.
DoE (Department of Environment) Country Paper-Bangladesh. SAARC Workshop on Solid
Waste Management, 10-12 October, 2004. Dhaka, Bangladesh, 2004. Elango, D., N. Thinakaran, P. Panneerselvam and S. Sivanesan, Thermophilic composting of
municipal solid waste. Appl. Energy, 86, 663-668, 2009. Energy Information Administration (EIA), Methodology for Allocating Municipal
Solid Waste to Biogenic and Non-Biogenic Energy. U.S. Dept. Energy, Washington, D.C., 2007.
Espinoza, P.T., E.M. Arce, D. Daza, M.S. Faure and H. Terraza, Report on the
Regional Evaluation of Municipal Solid Waste Management Services in Latin America - 2010 Report. Pan American Health Organization (PAHO), Washington, D.C., 2010.
Fahmi, W., K. Sutton U. Glawe, C. Visvanathan and M. Alamgir, Cairo’s contested garbage:
Sustainable solid waste management and the Zabaleen’s right to the city. Sustainability, 2, 1765-1783, doi:10.3390/su2061765, 2010.
Fricke, K., H. Santen and W. Bidingmaier, Biotechnological processes for solving
waste management problems in economically less developed countries. In Management of Solid Wastes in Developing Countries, edited by L. F. Diaz, L. L. Eggerth and G.M. Savage, p. 41-55, CISA, Padova, Italy, 2007.
Gamarra, P. and S. Salhofer, A comparison of waste management in Peru and
some Latin-American countries: An overview of major problems, characteristics and real needs in the region. In Management of Solid Wastes in Developing Countries, edited by L. F. Diaz, L. L. Eggerth and G.M. Savage, p. 71-81, CISA, Padova, Italy, 2007.
Gheewala, S.H., S. Bonnet and W. Wanichpongpan, Methodological approach for
improvement of municipal solid waste management in Hua Hin, Thailand. Proceedings, International Conference on Integrated Solid Waste Management in Southeast Asian Cities, 5-7 July 2005, Siem Reap, Cambodia, p. 89-95, 2007.

50
Gidde, M.R., V.V. Todkar and K.K. Kokate, Municipal Solid Waste Management in Emerging Mega Cities: A case study of Pune City. Proceedings, GCE 2008, Indo Italian Conference on Green and Clean Environment, March 20-21, MAEER's MIT College of Engineering, Pune, India, p. 441-450, 2008.
Glawe, U., C. Visvanathan, and M. Alamgir, Solid waste management in least
developed Asian countries – A comparative analysis. Proceedings, International Conference on Integrated Solid Waste Management in Southeast Asian Cities, 5-7 July 2005, Siem Reap, Cambodia, p. 37-47, 2007.
Goel S., Municipal solid waste management (MSWM) in India: A critical review.
J. Environ. Sci. Eng., 50(4), 319-28, 2008. Gómez, M.A., M. Baldini, M. Marcos, A. Martínez, S. Fernández and S. Reyes,
Aerobic microbial activity and solid waste biodegradation in a landfill located in a semi-arid region of Argentina. Ann. Microbiol., 62(2), 745-752, doi: 10.1007/s13213-011-0314-6, 2012.
Hamoda, M.F., H.A. Abu Qdais and J. Newham, Evaluation of municipal sold waste composting
kinetics. Resources, Conserv. Recyc., 23, 209-223, 1998. Hazra, T. and S. Goel, Solid waste management in Kolkata, India: Practices and challenges.
Waste Manage., 29, 470-478, 2009. Hoglund-Isaksson, L., Global anthropogenic methane emissions, 2005-2030:
Technical mitigation potentials and costs. Atmos. Chem. Phys. Disc., 12, 11275-11315, 2012.
Hoornweg, D. and P. Bhada-Tata What a Waste - A Global Review of Solid
Waste Management. World Bank, Washington, D.C., 2012. Huttner, E, and F. Kebekus, Mechanical-biological potential applications in developing
countries. In Management of Solid Wastes in Developing Countries, edited by L. F. Diaz, L. L. Eggerth and G.M. Savage, p. 327-332. CISA, Padova, Italy, 2007.
Ishigaki, T. O. Hirata, T. Oda, K. Wangyao, C. Chiemchaisri, S. Towprayoon, D.-
H. Lee and M. Yamada, Greenhouse gas emission from solid waste disposal sites in Asia, Chapter 23 in Integrated Waste Management, Vol. II, edited by S. Kumar, InTech, 2011.
Iftekhar, E., A.H.Md. Maqsood Sinha, and S.S.A. Khan, Urban Solid Waste Management
Scenario of Bangladesh: Problems and Prospects, Waste Concern Publications, Dhaka, Bangladesh, 2005. http://www.wasteconcern.org/.
IPCC, Revised 1996 IPCC Guidelines for National Greenhouse Gas Inventories.
IGES, Japan, 1996. IPCC, Good Practice Guidance and Uncertainty Management in National
Greenhouse Gas Inventories. IGES, Japan, 2000.

51
IPCC, 2006 IPCC Guidelines for National Greenhouse Gas Inventories. National Greenhouse Gas Inventories Programme, edited by H.S. Eggleston, L. Buendia, K. Miwa, T. Ngara and K. Tanabe. IGES, Japan, 2006.
International Solid Waste Association & United Nations Environment Programme (ISWA &
UNEP), Waste Management: Industry as a partner for sustainable development. ISWA & UNEP, 2002.
International Solid Waste Association (ISWA), Waste and Climate Change.
ISWA, Vienna, 2009. Khalid, A., M. Arshad, M. Anjum, T. Mahmood, and L. Dawson, The anaerobic
digestion of solid organic waste. Waste Manage., 31(8), 1737-1744, 2011.
Khatib, I.A., Municipal solid waste management in developing countries: Future challenges and possible opportunities. In Integrated Waste Management, Vol. II, edited by S. Kumar, InTech, doi: 10.5772/935, 2011.
Kohler, N, R.G. Gregory and D. Cornish, Developing landfill gas to energy
systems in South Africa. Proceedings Sardinia 2011, Thirteenth International Waste Management and Landfill Symposium, S. Margherita di Pula, Cagliari, Italy, 3-7 October, 2011. CISA, Sardinia, 2011.
Korner, I., I. Saborit-Sanchez, and Y. Aguilera-Corrales, Proposal for the integration of
decentralized composing of the organic fractions of municipal solid waste into the waste management system of Cuba. Waste Manage., 28, 64-72, 2008.
Kumar, S. J.K. Bhattacharyya, A.N. Vaidya, T. Chakrabarti, S. Devotta and A.B.
Akolkar, Assessment of the status of municipal solid waste management in metro cities, state capitals, class I cities, and class II towns in India: An insight. Waste Manage., 29, 883-895, 2009 or 2006.
Lamarque, J.F., T.C. Bond, V. Eyring, C. Granier, A. Heil, Z. Klimont, D. Lee, C.
Liousse, A. Mieville, B. Owen, M.G. Schultz, D. Shindell, S.J. Smith, E. Stehfest, J. Van Aardenne, O.R. Cooper, M. Kainuma, N. Mahowald, J.R. McConnell, V. Naik, K. Riahi and D.P. Van Vuuren, Historical (1850-2000) gridded anthropogenic and biomass burning emissions of reactive gases and aerosols: Methodology and application. Atmos. Chem. Phys. Disc., 10, 4963-5019, 2010.
Manandhar, R., Private Sector Participation in Solid Waste Management in Kathmandu,
Kitakyushu Initiative Seminar on Solid Waste Management, 19-20 September 2002, Kitakyushu, Japan, 2002.
Mancini, S.D., A.R. Noguera, DA Kagohara, JAS Schwartzman and T. de Mattos,
Recycling potential of urban solid waste destined for sanitary landfills: The case of Indaiatuba, SP, Brazil. Waste Manage., 25, 517-523, 2007.

52
Matthews. E. and N.J. Themelis, Potential for reducing global methane emission from landfills, 2000-2030. In Proceedings, Sardinia 2007, Eleventh International Waste Management and Landfill Symposium, S. Margherita di Pula, Cagliari, Italy, 1-5 October, 2007.
Ménard, C., A. A. Ramirez, J. Nikiema, M. Heitz, Biofiltration of methane and
trace gases from landfills: A review. Environ. Rev., 20(1), 40-53, doi: 10.1139/a11-022, 2012.
Minghua, Z., F. Xiumin, A. Rovetta, H. Qichang, F. Vicentini, L. Bingkai, A. Giusti
and L. Yi, Municipal solid waste management in the Pudong New Area, China. Waste Manage., 29, 1227-1233, 2009.
Monni, S., R. Pipatti, A. Lehtilla, I. Savolainen, and S. Syri, Global climate
change mitigation scenarios for solid waste management. Tech. Res. Centre of Finland. VTT Pub. 603, Espoo, 2006.
Mor, S., K. Ravindra, A.D. Visscher, ,R.P. Dahiya and A. Chandra, Municipal solid
waste characterization and its assessment for potential methane generation: A case study. J. Sci. Total Environ., 371 (1), 1–10, 2006.
Moss, R.H., J.A. Edmonds, K.A. Hibbard, M.R. Manning, S.K. Rose, D.P. van
Vuuren, T.R. Carter, S. Emori, M. Kainuma, T. Kram, G.A. Meehl, J.F.B. Mitchell, N. Nakicenovic, K. Riahi, S.J. Smith, R.J. Stouffer, A.M. Thomson, J.P. Weyant and T.J. Wilbanks, The next generation of scenarios for climate change research and assessment. Nature, 463,747-756, 2010.
Mwesigye, P., J. Mbogoma, J. Nyakang'o, I.A. Idan, D. Kapindula, S. Hassan and
R. Van Berkel, Integrated Assessment of present status of environmentally-sound management of wastes in Africa. Prepared for the U.N. Industrial Development Organization, 2009.
Nakicenovic, N., J. Alcamo, G. Davis, B. de Vries, J. Fenhann, S. Gaffin, K.
Gregory, A. Gruebler, T.Y. Jung, T. Kram, E. Emilio la Rovere, L. Michaelis, S. Mori, T. Morita, W. Pepper, H. Pitcher, L. Price, K. Riahi, A. Roehrl, H. Rogner, A. Sankovski, M. Schlesinger, P. Shukla, S. Smith, R. Swart, S. van Rooyen, N. Victor, and Z. Dadi, Special Report on Emissions Scenarios. Cambridge Univ. Press, Cambridge, 2000.
Nas, S. S, and A. Bayram, Environmental problems from the open dump in Gumushane
Province and investigation of biological recycling for the organic solid wastes. In Survival and Sustainability: Environmental Concerns of the 21st Century, edited by H. Gökçekus, U. Türker and J.W. LaMoreaux. Springer-Verlag, Berlin, doi: 10.1007/978-3-540-95991-5, 2011 or 2008 (Table 1).
Nehrenheim, E., P. Klintenberg and M. Odlare, recirculation of biogas residue to
agricultural land in Namibia – Risks and potentials in full utilization of organic waste. Proceedings Sardinia 2011, Thirteenth International Waste Management and Landfill Symposium, S. Margherita di Pula, Cagliari, Italy, 3-7 October 2011. CISA, Sardinia, 2011.
53
Nguyen, T., Solid waste management in Vietnam: AN industrial ecology study. Unpublished manuscript, Earth Engineering Center, Columbia University, 2005.
Norbu and S. Dilokwanich, Municipal solid waste management in Phuntsholing City, Bhutan.
EnvironmentAsia, 3(1), 111-116, 2010. Nyachhyon, B.L., Zero waste approach-A new culture for a new century, WASTE 2004
conference. Organisation for Economic Co-operation and Development (OECD),
Environmental Data, Compendium 2006-2008, Waste. OECD, 2008. Parmadi, D.A. and S. Wangsaatmodja, Environmental audit of solid waste final disposal site in
Bogor Municipality; Proactive effort to evaluate the environmental management performance case study: Pondok Rajeg SWEDS, Cibinong, Bogor Municipality. Proceedings, International Conference on Integrated Solid Waste Management in Southeast Asian Cities, 5-7 July 2005, Siem Reap, Cambodia, p. 137-146, 2007.
Parrot, L., J. Sotamenou, and B. Kamgnia Di, Municipal solid waste management
in Africa: Strategies and livelihoods in Yaoundé, Cameroon. Waste Manage., 29, 986-995, 2009.
Pokhrel, D. and T. Viraraghavan, Municipal solid waste management in Nepal: Practices and
challenges. Waste Manage., 25, 555-562, 2005. Rathi , S., Alternative approaches for better municipal solid waste management
in Mumbai, India. Waste Manage., 26, 1192–1200, 2006. Ray, M.R., S. Roychoudhury, G. Mukherjee, S. Roy and T. Lahiri, Respiratory and
general health impairments of workers employed in a municipal solid waste disposal at an open landfill site in Delhi. Int. J. Hyg. Environ.-Health, 208, 255–262, 2005.
Riahi, K. A. A. Gruebler and N. Nakicenovic, Scenarios of long-term socio-
economic and environmental development under climate stabilization. Technol. Forecast. Social Change, 74(7), 887-935, 2007.
Rogger, C., F. Beaurain, T. S Schmidt, Composting projects under the Clean
Development Mechanism: Sustainable contribution to mitigate climate change. Waste Manage., 31(1), 138-46, doi: 10.1016/j.wasman.2010.09.007, 2011.
Royal Government of Bhutan, Comprehensive Master Plan of Solid Waste Management System,
Thimphu. Department of Urban Development and Engineering Studies (DUDES), Thimphu City Corp., Mowhs, Bhutan, 2009.
Saini, S., P. Rao and Y. Patil, City based analysis of MSW to energy generation in India,
calculation of state-wise potential and tariff comparison with EU. Procedia-Soc. Behav. Sci., 27, 407-416m, 2012.

54
Seck, M.A., R. Badiane and C. Lo, Decentralized composting of urban waste in Rufisque (Senegal): Study of the agronomic quality of compost. In Management of Solid Wastes in Developing Countries, edited by L. F. Diaz, L. L. Eggerth and G.M. Savage, p. 289-294, CISA, Padova, Italy, 2007.
Shapkota, P., N. Coowanitwong, C. Visvanathan and J. Traenkler, Potentials for
recycling municipal solid waste in Asia vis-a-vis recycling in Thailand. In Proceedings, International Conference on Integrated Solid Waste Management in Southeast Asian Cities, 5-7 July 2005, Siem Reap, Cambodia, p. 195-209, 2007.
Sharholy, M., K. Ahmad, R.C. Vaishya and R.D. Gupta, Municipal solid waste
characteristics and management in Allahabad, India. Waste Manage., 27(4), 490–496, 2007.
Sharholy, M., K. Ahmad, G. Mahmood and R.C. Trivedi, Municipal solid waste management in
Indian cities - A review. Waste Manage., 28, 459-457, 2008. Shekdar, A.V., Sustainable solid waste management: An integrated approach for Asian
countries. Waste Manage., 29, 1438-1448, 2009. Shekdar, A.V., Municipal solid waste management – the Indian perspective. J.
Indian Assoc. Environ. Manage., 26 (2), 100-108, 1999. Simmons, P., N. Goldstein, S.M. Kaufman, N.J. Themelis, and J. Thompson, The
state of garbage in America. Biocycle, 47(4), 26–43, 2006. Singh, R.P., V.V. Tyagi, T. Allen, M.H. Ibrahim and R. Kothari, An overview for exploring the
possibilities of energy generation from municipal solid waste (MSW) in Indian scenario. Renew. Sustain. Energy Rev., 15, 4979-4808, 2011.
Spokas, K., J. Bogner, J.P. Chanton, M. Morcet, C. Aran, C. Graff, Y. Moreau-Le Golvan and I.
Hebe, Methane mass balance at three landfill sites: What is the efficiency of capture by gas collection systems? Waste Manage., 26(5), 516-525, doi:10.1016/j.wasman.2005.07.021 2006.
Spokas, K., J. Bogner, and J. Chanton, A process-based inventory model for
landfill CH4 emissions inclusive of seasonal soil microclimate and CH4 oxidation, J. Geophys. Res., 116, G04017, doi:10.1029/2011JG001741, 2012.
Staley, B.F. and M.A. Barlaz, Composition of municipal solid waste in the United States and
implications for carbon sequestration and methane yield. J. Env. Engin. p. 901-909, doi: 10.1061/_ASCE_EE.1943-7870.0000032, 2009.
Sundana, E.J., Development of regional solid waste management strategy in
Indonesia: Case study of Greater Bandung Area. In Proceedings, International Conference on Integrated Solid Waste Management in Southeast Asian Cities, 5-7 July 2005, Siem Reap, Cambodia, p. 59-71, 2007.

55
Suttibak, S. and V. Nitivattananon, Enhancing solid waste management capacity
of local government authorities: Review of current status in Thailand. In Proceedings, International Conference on Integrated Solid Waste Management in Southeast Asian Cities, 5-7 July 2005, Siem Reap, Cambodia, p. 105-119, 2007.
Trovar, L.R., R.A. Castro and M.E. Gutierrez, Landfill gas availability in Mexico
Coty Bordo Poniente Stage IV. Proceedings Sardinia 2011, Thirteenth International Waste Management and Landfill Symposium, S. Margherita di Pula, Cagliari, Italy, 3-7 October 2011, p. 529-530. CISA, Sardinia, 2011.
Turan, N. Gamze, S. Coruh, A. Akdemir and O.N. Ergun, Municipal solid waste management
strategies in Turkey. Waste Manage., 29, 465-469, 2009. United Nations (UN) Habitat, WTE Industry in Latin America, 2010. United Nations Economic and Social Commission for Asia and Pacific (UNESCAP), State of the
Environment in Asia and the Pacific. ESCAP and Asian Development Bank, United Nations Pub., New York, 2005.
United Nations Environment Programme (UNEP), International Environmental Technology
Centre (IETC), State of Waste Management in South East Asia, 2004. http://www.unep.or.jp/Ietc/Publications/spc/State_of_waste_Management/index.asp).
United Nations Environment Programme (UNEP), International Environmental
Technology Centre (IETC), Strategic Action Plan for Integrated Solid Waste Management Plan, Pune [India], Vol. I, prepared by P. Modak. UNEP, 2007.
United Nations Environment Programme (UNEP), Integrated Solid Waste
Management Plan for City of Matale, Sri Lanka, UNEP, 2008a. United Nations Environment Program (UNEP), Weak Spot and Gap Analysis of the Baseline
Assessment for the Development of an Integrated Solid Waste Management System in Maseru City [Lesotho]. UNEP, 2008b.
United Nations Environment Program (UNEP), Waste Quantification and
Characterization – Novo Hamburgo [Brazil]. UNEP, 2009. United Nations Environment Programme (UNEP), International Environmental Technology
Centre (IETC), Solid Waste Management in Nairobi: A Situation Analysis. Technical Document accompanying the Integrated Solid Waste Management Plan. Prepared by A. Kasozi, A. and H. von Blottnitz. UNEP, 2010a.
United Nations Environment Programme (UNEP), Solid waste characterization and
quantification of Bahir Dar City for development of an ISWM plan. UNEP, 2010b.

56
United Nations Environment Program (UNEP), Waste and Climate Change: Global Trends and Strategy Framework. International Environmental Technology Centre (IETC), Osaka, Japan, 2010c.
United Nations Environment Program (UNEP) and World Meteorological
Organization (WMO), Integrated Assessment of Black Carbon and Tropospheric Ozone: Summary for Decision Makers. UNEP, 2011a.
United Nations Environment Program (UNEP), Towards an Action Plan for
Near-term Climate Protection and Clean Air Benefits. UNEP, 2011b. U.S. EPA, Global Anthropogenic Non-CO2 Greenhouse Gas Emissions: 1990-
2020. US EPA, Washington, D.C., 2006a. U.S. EPA, Global Mitigation of Non-CO2 Greenhouse Gases. US EPA,
Washington, D.C., 2006b. U.S. EPA, Municipal solid waste generation, recycling, and disposal in the
United States: Facts and figures for 2006. Rep. No. EPA-530-F-07-030, U.S. EPA, Office of Solid Waste, Washington, D.C., 2007. http://www.epa.gov/epaoswer/nonhw/muncpl/pubs/msw06.pdf
U.S. EPA, Draft: Global Anthropogenic Non-CO2 Greenhouse Gas Emissions:
1990-2030, US EPA, Washington, D.C., 2011. van Beukering, P., M. Sehker, R. Gerlagh and V. Kumar, Analysing urban solid
waste in developing countries: A perspective from Bangalore, India. Working Paper no. 24. CREED, 1999.
vanVuuren, D.P., M.G.J. denElzen, P.L. Lucas, B. Eickhout, B.J. Strengers, B.
van Ruijven, S. Wonink and R. van Houdt, Stabilizing greenhouse gas concentrations at low levels: an assessment of reduction strategies and costs. Climatic Change, 81(2), 119-59, 2007.
Vin, S., V. Nitivattananon and A.T.M. Nurul Amin, Assessment of solid waste contracted
services: Case study of solid waste collection in Siem Reap Town, Cambodia. Proceedings, International Conference on Integrated Solid Waste Management in Southeast Asian Cities, 5-7 July 2005, Siem Reap, Cambodia, p. 245-269, 2007.
Visvanathan, C. and U. Glawe, Domestic solid waste management in South Asian countries!A
comparative analysis. Presented at 3-R South Asia Expert Workshop, 20 Aug.-1 Sept., 2006, Kathmandu, Nepal, 2006.
World Bank, What a Waste: Solid Waste Management in Asia. World Bank, Washington, D.C.,
1999a. World Bank, Municipal Solid Waste Incineration. World Bank, Washington, D.C., 1999b. World Bank, Waste Management in China: Issues and Recommendations. World Bank, Urban
Devel. Work. Pap. 9. Washington, D.C., 2005.

57
Water and Sanitation Program South Asia (WSP-SA), Community Based Pilot Project on Solid Waste Management in Khulna City: General Project Description. World Bank, Dhaka, 2000.
Yousef, T.B. and M. Rahman, Monitoring quantity and characteristics of
municipal solid waste in Dhaka City. Environ, Monit. Assess., 135, 3-11, 2007.
Zurbrügg, C., Urban Solid Waste Management in Low-Income Countries of Asia,
How to Cope with the Garbage Crisis. Presented at Scientific Committee on Problems of the Environment (SCOPE) Urban Solid Waste Management Review Session, Durban, South Africa, November 2002. http://www.sandec.ch/Publications/PublicationsHome.htm

58
8. Appendix What conditions favor growth of incineration (with or without energy recovery)?
Large cities: o large population requiring housing space (competing for
landfill/dump space) o sufficient supply of high CV waste to support efficient operation of
large plants Wealthy cities: can afford high expense of plants Countries undergoing rapid economic growth China (>100 waste-to-energy plants), some large cities in India; Japan; US
What conditions favor growth of composting?
High organic waste fraction Limited funds for waste management and expensive, high technology
solutions Land constraints Need for soil supplements for agriculture, gardens, etc. Abundant labor May take form of decentralized plants or larger plants co-located with
recycling, materials recovery, and/or landfill Most areas in developing countries
What conditions favor growth of landfilling?
Sufficient land to accommodate limited lifespan (20-30 years) of landfills. Disposal of some inerts (e.g., post incineration ash) will always require
landfills Environmental and health problems associated with uncontrolled
dumping Landfilling is becoming a last-choice option for waste disposal in
integrated waste-management plans
Which management techniques are complementary?
Some components of waste will always require landfilling. These comprise
materials such as ash from incineration, and inert, nonreusable/
nonrecyclable materials separated from the waste stream and street
sweepings. However, these materials typically constitute small fractions of
waste streams.
Waste-to-energy plants require feedstocks with low moisture content and
high calorific value, i.e., low organics, high plastic and paper content. Source
separation of organics is essential to produce appropriate feedstock for waste-

59
to-energy plants unless they are capable of mass incineration which then
requires auxiliary fuel and/or preprocessing such as drying or pressing to
remove moisture. Consequently, waste-to-energy and composting could, in
principal, be complementary because of their mutually exclusive feedstocks.
However, plastics have among the highest calorific values of any potential fuel
making them excellent feedstock for waste-to-energy plants at the same time
that they are the primary recyclable, by volume, in developing countries.
Consequently, expensive waste-to-energy facilities are not likely to be paired
(put in competition) with plastics recycling due to prevailing economic
conditions. Moreover, large centralized composting plants have proven
unsuccessful in most cases outside of Europe. Thus, while feedstock and
processing (source separation) also make WtE and composting
complementary in principal, the different scales and costs of these waste-
management strategies strongly suggest that they will not be widely practiced
in concert.

60
Figure 1. Tanner Triangle for rapid assessment of combustibility. Perimeter of shaded area indicates maximum values for main variables supporting combustion without auxiliary fuel. moisture content
(M)
ash content combustibles (A) (C)

61
Figure 2. Comparison of reference estimates of methane emission from municipal solid waste, 1990-2030.
References: EPA06-REF: EPA, 2006 EPA11-REF: EPA, 2011 GISS-REF: this study GAINS-CLE (current legislation): Hoglund-Isaksson, 2012 RCP-8.5: Riahi et al., 2007 EDGAR: Edgar version 4.0
0!
30!
60!
90!
1990! 2000! 2010! 2020! 2030!
Tg C
H4!
EPA06-REF!
EPA11-REF!
GISS-REF!
GAINS-CLE!
RCP-8.5!
EDGAR 4.0!

62
Figure 3. GISS 2030 results relative to 2000, grouped by variable (2000 = 1). MSW and DOC produced are constant in all cases.
DOC landfilled
1.0
1.5
2.0
2.5
REF MIT1-I MIT2-C MIT3-I+C
CH4 captured
1.0
1.5
2.0
2.5
REF MIT1-I MIT2-C MIT3-I+C
CH4 emitted
1.0
1.5
2.0
2.5
REF MIT1-I MIT2-C MIT3-I+C
MSW landfilled
1.0
1.5
2.0
2.5
REF MIT1-I MIT2-C MIT3-I+C
CH4 produced
1.0
1.5
2.0
2.5
REF MIT1-I MIT2-C MIT3-I+C
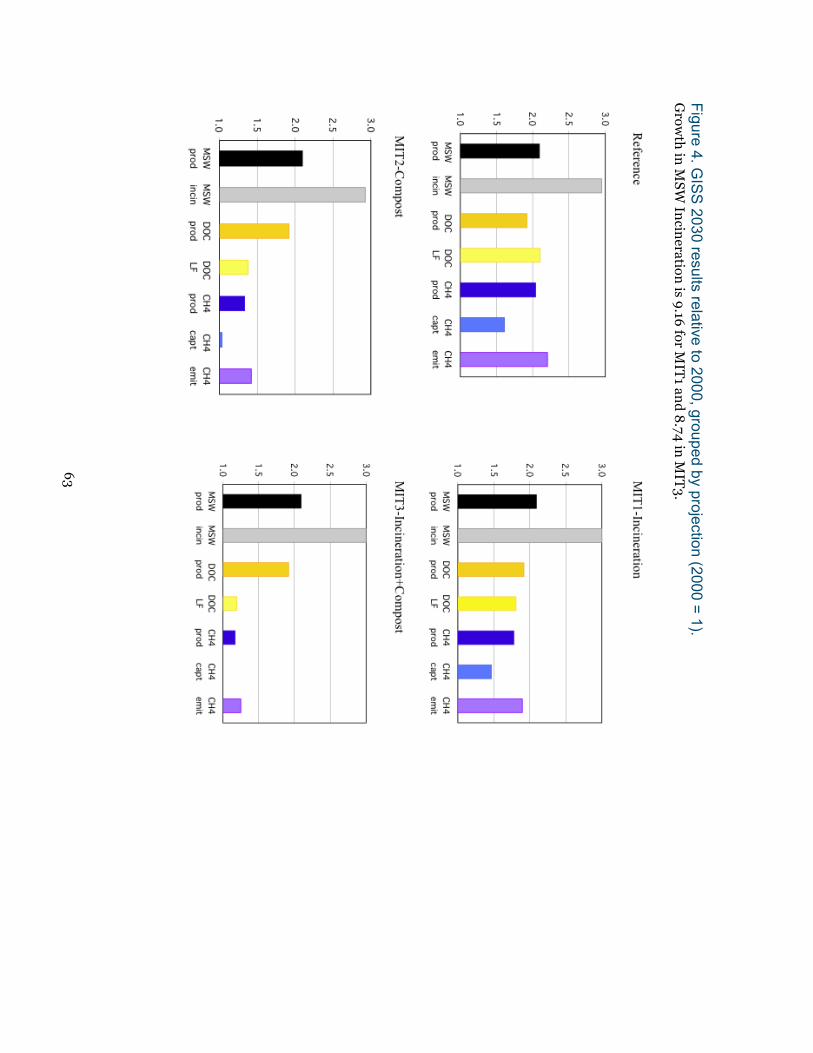
63
Figure 4. GIS
S 2030 results relative to 2000, grouped by projection (2000 = 1).
Grow
th in
MS
W In
cineration
is 9.16
for MIT
1 and
8.74
in M
IT3.

6
4
Table 1. Waste com
position as percent of total waste.
Southeast Asia
food paper
wood/
grassrub/ leath
textileplastic
glassm
etalinert
otherreference
Brunei D
arussalam,
Brunei-M
uara 36
18
163
423
AIT/U
NEP, 2010
Cam
bodia, Phnom Penh
63.36.4
15.51.2
0.613
AIT/U
NEP, 2010
China
35.83.7
3.82
0.347.5
World B
ank, 1999bC
hina31
2.52.5
1.51
160.5
Fricke et al., 2007C
hina 49
1616
12
16A
IT/UN
EP, 2010C
hina, Pudong N
ew A
rea55
4.02.0
3.033.0
3.0M
inghua et al., 2009
Indonesia 63
1110
1.51
13.5A
IT/UN
EP, 2010Indonesia
7410
102
22
Zurbrügg et al., 2002Indonesia, Taiping: m
id-income
4821
124
28
Fricke et al, 2007
Indonesia, Bogor
82.85.15
0.50.75
1.37
11.3
0.4Parm
adi & W
angsaatmodja,
2007Indonesia, B
andung, 65
111.8
13.81.6
26.7
Sundana, 2007
Indonesia (Bandung)
Kota B
andung63.6
10.41.7
9.8a1.5
0.9512.2
Sundana, 2007 K
abupaten Bandung
6511
213a
21
6Sundana, 2007
Kota C
imahi
67.47.35
1.718.2a
11.2
1.1Sundana, 2007
Kabupaten Sum
edang52.2
13.2
14.2a2.1
3.17.4
Sundana, 2007Laos
54.33.3
0.87.8
8.53.8
22.5V
isvanathan & G
lawe, 2006
Laos, Vientienne
30Sundana, 2007
2
recyclables = 22 paper, m
etal plastic

6
5
Tab
le 1. Waste com
position
as percen
t of total waste (con
tinu
ed).
Southeast Asia
food paper
wood/
grassrub/ leath
textileplastic
glassm
etalinert
otherreference
Malaysia
4015
315
43
20W
orld Bank, 1999b
Malaysia
4715
43
143
410
AIT/U
NEP, 2010
Malaysia, Penang
4521
44
176
3Zhang et al., 2010
Malaysia, K
uala Lumpur:
high income
45.729.9
93.9
5.14.3
Fricke et al., 2007
Myanm
ar 73.3
2.217.8
0.50.2
6.1A
IT/UN
EP, 2010Philippines
41.619.5
13.82.5
4.817.9
Zhang et al., 2010Philippines
32.712.5
24.7
3.15
22A
IT/UN
EP, 2010Philippines, M
anila46
14.58.6a
2.71.3
Diaz et al., 2007b
Philippines, Manila
4512
81.4
3.523.1
1.34.1
0.80.7
World B
ank, 1999b
Philippines, Manila
4919
176
9W
orld Bank 2001, in
Zurbrügg et al., 2002Sri Lanka
76.410.6
5.72
1.34.7
Zhang et al., 2010
Sri Lanka, Colom
bo83
76
12
1Zhang et al., 2010
Sri Lanka, Matale:
low incom
e82
6.30.9
40.3
1.33.9
UN
EP, 2008a
Sri Lanka, Matale:
mid-incom
e79
6.75.1
5.60.5
0.33.1
UN
EP, 2008a
Sri Lanka, Matale:
high income
595.7
3.73.5
0.40.3
0.1U
NEP, 2008a
Thailand48.6
14.613.9
5.13.6
14.2Shapkota et al., 2007
Thailand 43
12.1
10.96.6
3.523.9
AIT/U
NEP, 2010

6
6
Tab
le 1. Waste com
position
as percen
t of total waste (con
tinu
ed).
Southeast Asia
food paper
wood/
grassrub/ leath
textileplastic
glassm
etalinert
otherreference
Thailand, Bangkok
539
193
1U
NEP, 2001 in Zurbrügg et
al., 2002Thailand, Phitsanulok
615
26
21
5H
uttner & K
ebekus, 2005Thailand, H
ua Hin
48.431.8
17.10
0.352.5
Shapkota et al., 2007Thailand, N
an Dong
627.7
122
0.515.8
Fricke et al., 2007Thailand, U
donthani67.2
11.40.8
1.610.5
6.10.8
1.6A
IT, 2004 Thailand, N
akhon Ratchasim
a44.6
17.21.3
1.61.3
10.71.1
1.121.3
AIT, 2004
Thailand, Chang M
ai59.3
10.92.5
4.41.4
11.63.6c
5.60.8
AIT, 2004
Thailand, Hat Y
ai56.5
5.2511.2
2.80.7
14.23c
3.53.1
AIT, 2004
Thailand, Rayong
38.69.7
6.53.4
13.46.3c
5.51.4
AIT, 2004
Thailand, Pattaya64.3
31.1
2.81.1
212.3c
1.53.3
AIT, 2004
Thailand, Pathumthani
49.64.5
6.53.9
5.524
2.7c2.9
0.4A
IT, 2004 V
ietnam58
41.8
5.68.5
1.527.5
World B
ank, 1999bV
ietnam, H
anoi41.9
1.915.6
7.26
27.4A
IT/UN
EP, 2010V
ietnam, H
anoi57-89
0-93-14
0-100-18
0.6G
heewala et al., 2007
Vietnam
, Hanoi
50.14.2
5.52.5
37.7U
NEP, 2001, in Zurbrügg et
al., 2002V
ietnam, H
aiphong 50.6
7.54.5
0.20.6
36.5G
heewala et al., 2007
Vietnam
, Habong
40-456
3-50-1
4-936-48
Gheew
ala et al., 2007V
ietnam, D
anang32
6.822.5
12
36G
heewala et al., 2007
Vietnam
, Ho C
hi Minh
41.324.8
8.81.6
5.618
Hazra &
Goel, 2009
7

6
7
Tab
le 1. Waste com
position
as percen
t of total waste (con
tinu
ed).
Developed A
sia/Pacificfood
paperw
ood/ grass
rub/ leath
textileplastic
glassm
etalinert
otherreference
Australia
4723
134
75
OEC
D, 2008
Hong K
ong38
263
193
29
World B
ank, 1999bJapan
2646
97
812
World B
ank, 1999bJapan
1550
201
24
AIT/U
NEP, 2010
Singapore44.4
28.311.8
4.14.8
6.6A
IT, 2004Singapore
19.822.8
22.82.3
3.428.9
AIT/U
NEP, 2010
Taiwan
3126
922
74
World B
ank, 1999bSouth K
orea26.3
21.48.9
4.78
30.7A
IT/UN
EP, 2010South K
orea28
2428
85
7O
ECD
, 2008South K
orea, Seoul22.3
16.227.5
9.6a10.3
4.1D
iaz et al. 2007b

6
8
Tab
le 1. Waste com
position
as percen
t of total waste (con
tinu
ed).
South & W
est Asia,
Middle E
astfood
paperw
ood/ grass
rub/ leath
textileplastic
glassm
etalinert
otherreference
Bhutan, Phuntsholing C
ity31
2011
115
85
Norbu &
Dilokw
anich, 2010
Bhutan, Thim
phu City
4925
314
41
5R
oyal Gov't of B
hutan, 2009B
angladesh, Dhaka
6512
12
1
5
7Y
ousef & R
ahman, 2007
Bangladesh, D
haka70
4.34.7
0.30.1
16K
asi 1999, in Zurbrügg et al., 2002
India, cities42
64
42
240
Sharholy et al., 2008India, cities
40-60
<1<1
<130-40
Kum
ar et al., 2006India, Tier I cities
32-5543
Kum
ar et al., 2006India, Tier II cities
32-7334
Kum
ar et al., 2006India, B
angalore75.2
1.53.1
0.90.2
0.119
Fricke et al., 2007India, N
ew D
elhi38
66
10.2
3514
Agarw
al et al., 2005India, A
llahabad45.3
3.62.22
2.90.7
2.541.7
1.1Sharholy et al., 2007
India, Pune65
87a
46
10U
NEP, 2007
India, Kolkata
459
Hazra &
Goel, 2009
Iraq46-71
~4
~45-8
~4~4
10G
lawe et al., 2007
Iran62.3
10.95.5
4.110.3
4.23.2
Visvanathan &
Glaw
e, 2006K
uwait
37.535
53.5
5.5A
bu Qdais et al., 1997
Mongolia
16.825.2
12.14.4
2.539
AIT/U
NEP, 2010
Nepal
659
12
83
110
2Zhang et al., 2010
Nepal, K
athmandu
6810
412
11
6V
isvanathan & G
lawe, 2006
Pakistan, Karachi
4010
97
21
32V
isvanathan & G
lawe, 2006
Qatar
53.317.7
1515
4.3A
bu Qdais et al., 1997
Saudi Arabia
3534
11
5A
bu Qdais et al., 1997
Turkey40-65
7-185-14
2-61-6
7-24Turan et al., 2009
United A
rab Emirates,
Abu D
habi49
612
98
16A
bu Qdais et al., 1997
9
1617
4.6

6
9
Tab
le 1. Waste com
position
as percen
t of total waste (con
tinu
ed).
Africa
food paper
wood/
grassrub/ leath
textileplastic
glassm
etalinert
otherreference
Africa
35-8010-15
<10<10
<10Y
ousef & R
ahman, 2007
Ethiopia, Bahir D
ar (city average)
43.59.4
13.60.9
1.33.3
1.11.3
27.4e2.6g
UN
EP, 2010b
Ghana, K
umasi
844.9
Mw
esigye et al., 2009
Ghana, A
ccra85.1
12.93.4
1.9M
wesigye et al., 2009
Kenya, N
airobi: high incom
e52
17.36.7
2.42.7
11.82.3
2.62.7
UN
EP, 2010a
Kenya, N
airobi: m
id-income
5017
82
314
23
7U
NEP, 2010a
Kenya, N
airobi: low
income
5716
23
212
21
4U
NEP, 2010a
Kenya, N
airobi: at source
5117.5
16.12
211.4
UN
EP, 2010a
Kenya, N
airobi: at collection sites
4312.1
15.15.6
2.721.7
UN
EP, 2010a
Lesotho, Masera
23.922.5
3.414.5
9.13.6
25.1U
NEP, 2008b
Morocco
73~25
El Edghiri, 2002N
igeria, Ibadan55.8
6.31.8
2.6
Mw
esigye et al., 2009
Nigeria, O
gbomosa
Abel et al., 2007
city core21.6
15.724.3
3.72.5
10.49.8
10.5bA
bel et al., 2007transition
15.317
25.66.1
2.511.9
8.27.8b
Abel et al., 2007
suburb10.7
17.313.5
5.53.4
12.46.3
24.5bA
bel et al., 2007Senegal
69.67.4
4.16.7
1.83.2
7.2Seck et al., 2006
Rw
anda, Kigali
94M
wesigye et al., 2009
Uganda, K
ampala
75
Mw
esigye et al., 2009
6.4
1.55.6

70
Tab
le 1. Waste com
position
as percen
t of total waste (con
tinu
ed).
Americas/C
aribbeanfood
paperw
ood/ grass
rub/ leath
textileplastic
glassm
etalinert
otherreference
Argentina, A
suncion61
12.213.2
4.4a4.6
2.3D
iaz et al., 2007bB
razil, Indaiatuba40
9.213.5
10.73.2
2.70.9
16.4M
ancini et al., 2007B
razil, Rio de Janeiro
50.919.8
0.417.6
23.2
Fricke et al., 2007B
razil, Alto Paranaiba
67.110.2
8.73
3.78.8
Fricke et al., 2007B
razil, Ilhabela49
19.917
14.4Fricke et al., 2007
Brazil, N
ovo Ham
burgo, com
mercial dow
ntown
18.620.2
29.85.9
421.5d
UN
EP, 2009
Brazil, N
ovo Ham
burgo, high incom
e40.5
12.618.8
3.84.9
19.3U
NEP, 2009
Brazil, N
ovo Ham
burgo, m
iddle income
38.210.3
11.21.2
1.437.7
UN
EP, 2009
Brazil, N
ovo Ham
burgo, low
income
39.311.8
23.61
<124.1
UN
EP, 2009
Canada
2447
83
613
OEC
D, 2008
Cuba, H
avana60
9.09.0
1.23.1
8.03
0.614.8
14.0K
orner et al., 2008M
exico, Mexico C
ity59.8
11.93.5
Fricke et al., 2007M
exico51
1518
66
3O
ECD
, 2008
U.S.
17.923.8
14.41.5
4.215.8
4.91.4
16.2Staley &
Barlaz, 2009
U.S.
2534
1612
58
OEC
D, 2008

71
Tab
le 1. Waste com
position
as percen
t of total waste (con
tinu
ed).
Europe
food paper
wood/
grassrub/ leath
textileplastic
glassm
etalinert
otherreference
Austria
3522
19j11
85
OEC
D, 2008
Belgium
3917
29j5
73
OEC
D, 2008
Denm
ark29
2732j
15
6O
ECD
, 2008
France32
2026j
910
3O
ECD
, 2008
Germ
any14
3412j
2212
5O
ECD
, 2008
Hungary
2915
35j17
22
OEC
D, 2008
Iceland26
2624j
174
3O
ECD
, 2008
Ireland25
3123j
115
4O
ECD
, 2008
Italy29
2822j
513
2O
ECD
, 2008
Luxembourg
4522
16j1
124
OEC
D, 2008
Netherlands
3526
12j19
44
OEC
D, 2008
Norw
ay30
3320j
94
4O
ECD
, 2008
Portugal34
2123j
117
4O
ECD
, 2008
Slovakia38
1331j
78
3O
ECD
, 2008
Spain49
217j
128
4O
ECD
, 2008
Sweden
i68i
17j2
112
OEC
D, 2008
Switzerland
2920
29j15
43
OEC
D, 2008
small province
29.89.8
7.81.4
3.31.6
25.7g20.6
Nas &
Bayram
, 2008
3 medium
cities h50.3
7.7
0.9
5.22.6
1.84.9g
28.4N
as & B
ayram, 2008
5 large cities h53.9
31.210.1
42.9
15.1
Nas &
Bayram
, 2008

72
Notes to Table 1.
b animal dung
c glass and stoned m
ixede ash, soil and stone
g ash and scoria
i presumably 68%
paper includes organic
j textiles and other
a rubber, leather and plastic
f animal rem
ains, hazardous, e-waste and other
h multi-city m
eans do not add to 100%
rub/ leath is rubber and leather

73
Table 2. Waste-collection rates as percent of population or of generated waste.
location % referenceAfghanistan 0-22 Visnathathan & Glawe 2006Argentina 100 Espinoza et al., 2010Bangladesh 40-90 Visnathathan & Glawe 2006Bangladesh, Dhaka 50 Yousef & Rahman, 2007Belize 85 Espinoza et al., 2010Bolivia 68 Gamarra & Salhofer, 2007Bolivia 83 Espinoza et al., 2010Brazil 71 Gamarra & Salhofer, 2007Brazil 96 Espinoza et al., 2010Cameroon, Yaoundé 43 Parrot et al, 2009Chad, Ndjamena 15-20 Parrot et al, 2009Chile 98 Espinoza et al., 2010Côte d’Ivoire, Abidjan 30–40 Parrot et al, 2009Costa Rica 66 Gamarra & Salhofer, 2007Costa Rica 90 Espinoza et al., 2010Ecuador 81 Hazra & Goel, 2009Ecuador 84 Espinoza et al., 2010El Salvador 79 Espinoza et al., 2010Guatemala 78 Espinoza et al., 2010Haiti 30 Gamarra & Salhofer, 2007Honduras 20 Gamarra & Salhofer, 2007Honduras 65 Espinoza et al., 2010Hungary 90 OECD, 2008India 50-90 Visnathathan & Glawe 2006India, 59 cities 50-70 Kumar et al., 2009India, New Delhi 62 Visnathathan & Glawe 2006India, Calcutta 61 Hazra & Goel, 2009
standard housing 57 Hazra & Goel, 2009registered slums 67 Hazra & Goel, 2009
unregistered slums 13 Hazra & Goel, 2009India (mean) 72 Hazra & Goel, 2009

74
Table 2. Waste-collection rates as percent of population or of generated waste (continued).
location % referenceIndia
Andra Pradesh 74 Sharholy et al., 2008Bihar 59 Sharholy et al., 2008
Gujarat 61 Sharholy et al., 2008Haryana 82 Sharholy et al., 2008
Karnataka 80 Sharholy et al., 2008Kerala 82 Sharholy et al., 2008
Madhya Pradesh 73 Sharholy et al., 2008Maharashtra 72 Sharholy et al., 2008
Orissa 61 Sharholy et al., 2008Punjab 71 Sharholy et al., 2008
Rajasthan 62 Sharholy et al., 2008Tamil Nadu 73 Sharholy et al., 2008
Uttar Pradesh 78 Sharholy et al., 2008West Bengal 74 Sharholy et al., 2008
Iraq, Kabul 23 Glawe et al., 2007Ireland 76 OECD, 2008Jamaica 74 Espinoza et al., 2010Kenya, Nairobi 30-45 Parrot et al, 2009Mauritania, Nouakchott 20-30 Parrot et al, 2009Mexico 93 Espinoza et al., 2010Mexico 70 Gamarra & Salhofer, 2007Nicaragua 92 Espinoza et al., 2010Pakistan 81 Visnathathan & Glawe 2006Pakistan, Karachi 24 Visnathathan & Glawe 2006Panama 85 Espinoza et al., 2010Paraguay 48 Gamarra & Salhofer, 2007Peru 84 Espinoza et al., 2010Peru 74 Gamarra & Salhofer, 2007Sri Lanka 10-40 Visnathathan & Glawe 2006Senegal, Dakar 30–40 Parrot et al, 2009South Africa, Eastern Cape 19 Blight & Mussane, 2007Tanzania, Dar es salaam 48 Parrot et al, 2009Togo, Lomé 42 Parrot et al, 2009

75
Table 2. Waste-collection rates as percent of population or of generated waste (continued).
location % referenceTurkey 73 OECD, 2008Uruguay 98 Espinoza et al., 2010Venezuela 100 Espinoza et al., 2010Vietnam, cities (mean) 71 Nguyen, 2005Vietnam 72 Zhang et al., 2010Vietnam Nguyen, 2005
cities >500K 76 Nguyen, 2005cities 100-250K 70 Nguyen, 2005
rural, high income 20 Nguyen, 2005rural, low income ~0 Nguyen, 2005
Vietnam, Lon An 45 Nguyen, 2005Vietnam, Hue 75 Nguyen, 2005Vietnam, Hanoi 80 Zhang et al., 2010Vietnam, Hai Phong 79 Zhang et al., 2010Vietnam, Hai Duong 51 Zhang et al., 2010Vietnam, Quang Ninh 40 Zhang et al., 2010

76
Table 3. Waste-disposal m
ethods as percent of generated waste.
Southeast Asia
sanitary LF
control LF/dum
popen dum
pinciner-
ationcom
postrecycle
otherreference
Cam
bodia, Phnom Penh
745a
15U
NESC
AP, 2005
China
57
2913
1EEC
, Coum
bia Univ.
China
9U
NEP, 2010c
China, Pudong N
ew A
rea22
4038
Minghua et al., 2009
Indonesia5
UN
EP, 2010cIndonesia
Jakarta78
22U
NESC
AP, 2005
Bandung
7916a
5U
NESC
AP, 2005
Semarang
7426
UN
ESCA
P, 2005 Surabaya
7030
UN
ESCA
P, 2005 C
ebu100
UN
ESCA
P, 2005M
alaysia, Penang80
1010
UN
ESCA
P, 2005M
alaysia, Kuala Lum
pur4
UN
EP, 2010cM
yanmar, Y
angon86
14U
NESC
AP, 2005
Myanm
ar, Mandalay
10U
NEP, 2010c
Philippines54
UN
EP, 2010cSri Lanka, M
atale49
206
520
UN
EP, 2008aV
ietnam, H
anoi20
Nguyen, 2005
Vietnam
, Hanoi
6515
20U
NESC
AP, 2005
Thailand, Bangkok
991
UN
ESCA
P, 2005Thailand, C
hiang Mai
982
UN
ESCA
P, 2005V
ietnam18-22
UN
EP 2010c

77
Tab
le 3. Waste-d
isposal m
ethod
s as percen
t of generated
waste (con
tinu
ed).
Developed A
siasanitary
LFcontrol
LF/dump
open dum
pinciner-
ationcom
postrecycle
otherreference
Australia
114
030
0O
ECD
, 2008H
ong Kong
5743
Singh et al., 2011Japan
20U
NEP, 2010c
Japan0.0
140.0
17<1
OEC
D, 2008
New
Zealand1
00
150
OEC
D, 2008
Singapore34
66U
NESC
AP, 2005
South Korea
<174
049
0O
ECD
, 2008Taiw
an21
79K
umar et al., 2009
South & W
est Asia,
Middle E
astB
hutan, Phuntsholing C
ity80e
eN
orbu & D
ilokwanich, 2010
Bangladesh
955
Visvanathan &
Glaw
e, 2006B
angladesh, Dhaka C
ity51
3711
Yousef &
Rahm
an, 2007India
1060
510
10V
isvanathan & G
lawe, 2006
India, New
Delhi
17A
garwal et al., 2005
Iran
6024
15a2
Zhang et al., 2010N
epal70
Visvanathan &
Glaw
e, 2006Pakistan
580
510
Visvanathan &
Glaw
e, 2006A
fricaN
amibia
'most'
Nehrenheim
et al., 2011

78
Tab
le 3. Waste-d
isposal m
ethod
s as percen
t of generated
waste (con
tinu
ed).
Americas/C
aribbeansanitary
LFcontrol
LF/dump
open dum
pinciner-
ationcom
postrecycle
otherreference
Argentina
6510
251a
Espinoza et al., 2010A
rgentina, cities small
10
Gam
arra & Salhofer, 2007
medium
40
Gam
arra & Salhofer, 2007
large75
Gam
arra & Salhofer, 2007
largest100
Gam
arra & Salhofer, 2007
Belize
00
8515a
Espinoza et al., 2010B
olivia45
1611
2a26c
Espinoza et al., 2010B
olivia50
Gam
arra & Salhofer, 2007
Brazil
28G
amarra &
Salhofer, 2007B
razil55
2025
<1cEspinoza et al., 2010
Brazil, M
inas Gerais
1418
64 A
zevedo et al., 2011B
razil, Indaiatuba, Sao Paulo
321
67 A
zevedo et al., 2011
Canada
1227
O
ECD
, 2008C
hile82
144
01
Espinoza et al., 2010C
olombia
824
131a
<1cEspinoza et al., 2010
Colom
bia32
Gam
arra & Salhofer, 2007
Costa R
ica68
249
00
Espinoza et al., 2010C
uba90
G
amarra &
Salhofer, 2007D
ominican R
epublic34
2532
10a<1c
Espinoza et al., 2010Ecuador
6619
14G
amarra &
Salhofer, 2007Ecuador
3046
211
2cEspinoza et al., 2010
El Salvador78
014
7a1c
Espinoza et al., 2010G
uatemala
1510
700
5cEspinoza et al., 2010
Honduras
1160
1514a
0Espinoza et al., 2010
Honduras
0G
amarra &
Salhofer, 2007Jam
aica0
1000
0Espinoza et al., 2010
7 4

79
Tab
le 3. Waste-d
isposal m
ethod
s as percen
t of generated
waste (con
tinu
ed).
Europe
sanitary LF
control LF/dum
popen dum
pinciner-
ationcom
postrecycle
otherreference
Austria
721
4527
1O
ECD
, 2008B
elgium12
3423
310
OEC
D, 2008
Czech R
epublic80
143
10
OEC
D, 2008
Denm
ark5
5415
260
OEC
D, 2008
Finland60
100
300
OEC
D, 2008
France36
3414
160
OEC
D, 2008
Germ
any18
2517
337
OEC
D, 2008
Greece
920
08
0O
ECD
, 2008H
ungary90
61
30
OEC
D, 2008
Iceland72
99
160
OEC
D, 2008
Ireland66
00
340
OEC
D, 2008
Italy54
1233
00
OEC
D, 2008
Luxembourg
1939
1923
0O
ECD
, 2008N
etherlands f2
3223
250
OEC
D, 2008
Norw
ay26
2515
340
OEC
D, 2008
Poland92
03
40
OEC
D, 2008
Portugal64
216
90
OEC
D, 2008
Slovakia78
121
17
OEC
D, 2008
Spain52
733
90
OEC
D, 2008
Sweden
550
1034
1O
ECD
, 2008Sw
itzerland1
5016
340
OEC
D, 2008
Turkey98
01
01
OEC
D, 2008
UK
648
917
1O
ECD
, 2008

8
0
No
tes to T
able 3.
c water bodies, anim
al feed
e dry waste deposited at landfill is burned in open
f components sum
to 83%
d landfilling and 'other'
a open burnb Latin A
merica and C
aribbean
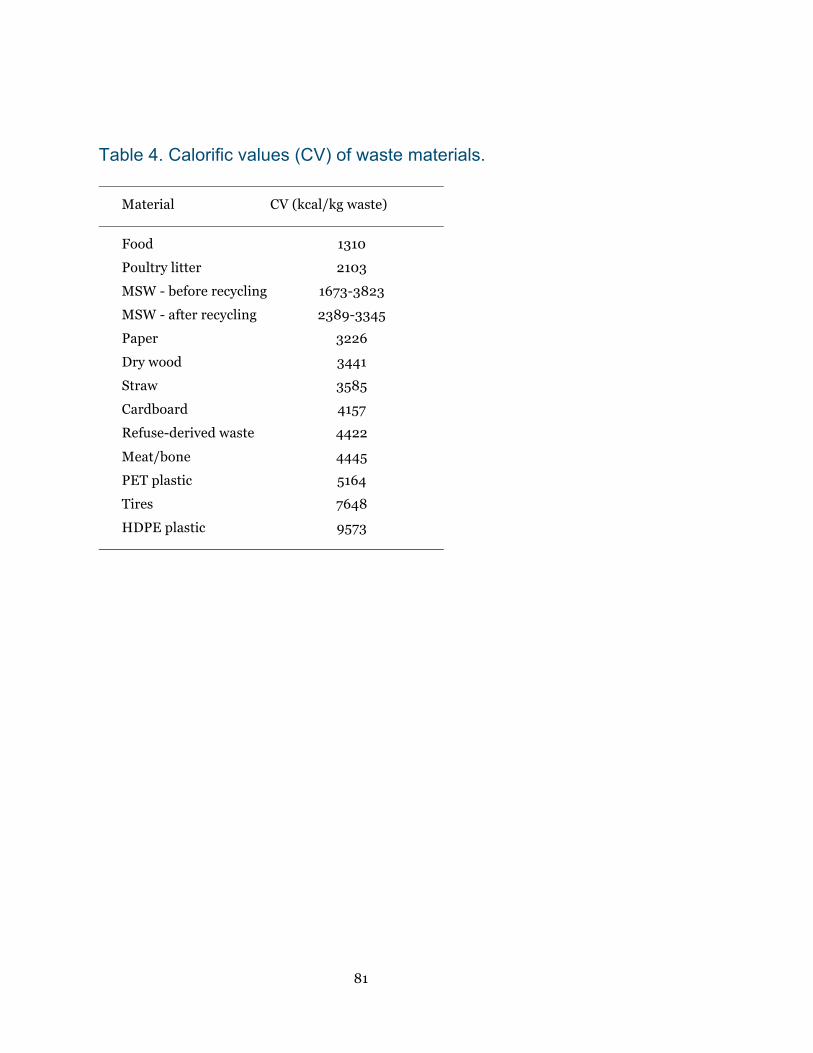
81
Table 4. Calorific values (CV) of waste materials.
Material CV (kcal/kg waste)
Food 1310
Poultry litter 2103
MSW - before recycling 1673-3823
MSW - after recycling 2389-3345
Paper 3226
Dry wood 3441
Straw 3585
Cardboard 4157
Refuse-derived waste 4422
Meat/bone 4445
PET plastic 5164
Tires 7648
HDPE plastic 9573

82
Table 5. Environmental ranges and optima for composting.
Optimum Impacts above/below range
Moisture 40-60% <40%: microorganisms may go dormant >60%: anaerobic
C:N ratio 25-30:1 >30: heat production declines, decomposition slows
<25: ammonia is released, pH increases, may be toxic to microorganisms
Temperature psychrophilic, 10-21˚C <10˚C: microorganisms go dormant mesophilic, 21-38˚C therrmophilic, 38-71˚C >71˚C: microorganisms die off
pH ~7 >7: may be toxic to microorganisms

83
Table 6. Typical carbon-to-nitrogen (C:N) ratios of compostable materials.
Material C:N ratio
Wood ashes 25:1 Cardboard, shredded 350:1 Corn stalks 50-100:1 Fruit waste 35:1 Leaves 30-80:1 Newspaper, shredded 175:1 Paper 170-200:1 Peanut shells 35:1 Pine needles 80:1 Sawdust 200-500:1 Straw 75:1 Woodchips 500-700:1 Alfalfa 12:1 Clover 23:1 Coffee grounds 20:1 Food waste 20:1 Garden waste 30:1 Grass clippings 12-25:1 Hay 25:1 Manures 20-25:1 Vegetable scraps 25:1 Seaweed 19:1
Source: http://web.extension.illinois.edu/homecompost/science.html

84
Table 7. GISS 2030 results for all projections, relative to 2000 (2000 = 1).
MSW MSW DOC CH4 CH4 CH4 incin. LF LF prod. capt. emit.
REF 2.95 2.36 2.10 2.04 1.61 2.20
MIT1-I 9.16 2.02 1.81 1.78 1.46 1.90
MIT2-C 2.93 2.26 1.38 1.33 1.03 1.44
MIT3-I+C 8.74 1.93 1.19 1.17 0.96 1.25
LF, landfilled prod, produced capt, captured emit, emitted
High values for MSW incinerated in MIT1-I and MIT3-I+C reflect the low level of incineration in 2000.

85
Table 8. GIS
S 2030 results for all projections, in Tg except C
H4 m
itigation in percent difference from
RE
F.
D
OC
D
OC
D
OC
D
OC
C
H4
CH
4 C
H4
CH
4
prod
. com
post
LF
L
Fan
p
rod.
capt.
emit.
mit.
All
256
RE
F
0
172
9
5 31.7
6.9
2
2.3
Mit1-I
0
14
8
83
27.6
6
.3 19
.2
-13%
Mit2
-C
11.8
113
62
2
0.7
4.5
14.6
-35%
Mit3-I+
C
11.8
9
8
55 18
.2
4.1
12.7
-4
3%

86
Table 9. Regional waste-composition defaults as percent of generated waste (IPCC, 2000).
food paper wood plastic tex- rub/ metal glass other total tile leath
Asia E Asia 26 19 4 14 4 1 2.7 3.1 7 81 S-C Asia 40 11 8 6 3 1 4 4 22 98 S-E Asia 44 13 10 7 3 1 3 4 16 101 W Asia/ME 41 18 10 6 3 1 1 2 5 88 Africa East 54 8 7 6 2 1 2 2 12 92 Middle 43 17 7 5 3 4 2 2 81 North 51 17 2 5 3 4 2 2 84 South 23 25 15 63 West 40 10 4 3 1 1 59 Europe East 30 22 8 6 5 1 10 15 96 North 24 31 10 13 2 4 8 91 South 37 17 11 7 72 West 24 28 11 64 Oceania Aus/NZ 36 30 24 90 other 68 6 3 77 Americas North 34 23 6 9 4 1 5 7 10 98 Central 44 14 14 7 3 2 1 4 12 99 South 45 17 5 11 3 1 3 3 13 100 Caribbean 47 18 2 10 5 2 5 6 4 99
ME, Middle East Totals summed from regional values are included to show that percentages do not consistently add to 100%.