goods m chapter - tularecog.org · goods movement chapter 5 - 4 addition, as industries within the...
TRANSCRIPT
G O O D S M O V E M E N T C H A P T E R
5 - 1
INTRODUCTION Located in the heart of California’s Central Valley, Tulare County is at the core of
California’s agricultural industry. With 460,437 residents and a diversified agricultural industry, Tulare County contains many of California’s key goods movement corridors. The Business, Transportation and Housing Agency has identified the Central Valley, including Tulare County, as one of the four priority regions for goods movement in the State of California [Figure 5-1]. The Valley and Tulare County serve as a primary trade corridor for California’s two largest metropolitan areas: Los Angeles and San Francisco.
Tulare County’s geographic location, availability of land, growing population, and large agricultural industry makes its highways and corridors some of the most traveled in the state of California. In 2007, nearly 500 million tons of goods moved into, out of, intra-regionally, or through the San Joaquin Valley, transported by trucks, rail, water, and air freight modesand is expected to grow to almost $800 million tons by 2040 (SJV Interregional Goods Movement Plan 2013). As one of California’s fastest growing regions, goods movement and transportation will become increasingly important in the future. GOODS MOVEMENT
The Tulare County region relies heavily on goods movement due to its agricultural production, centralized location and distribution centers. Goods Movement in the San Joaquin Valley is currently dominated by a single transportation mode – trucking. In 2007, of the 500 million tons of goods that moved into, out of, or within the region, more than 90% moved by truck. There are some good reasons for this, and trucks will always be a very important component to goods movement in the San Joaquin Valley (SJV). However, it is important to continue to study the potential of expanding other modes in the region – including short haul rail (in particular from an inland port at Shafter or Crows Landing to the Port of Oakland), improved access to Class I rail, and increased use of air cargo.
The Commodity flow of products entering and leaving Tulare County are diverse and numerous. The type of products that are being moved include farm products, aggregates, food, materials, fuels, paper products, plastics, electronics, textiles, consumer products to be shipped into distributions and to be shipped out to market. It is anticipated to continue to grow from 2007 to 2040 by an average of 56% (SJV Interregional Goods Movement Plan 2013). Figure 5-2 shows the typical commodity flow of agricultural products. Tulare County is the number one producer of milk in the Country. Tulare County also produces a large amount of citrus, nuts, berries, and other agricultural related products that are shipped across the country and the world to international markets.
Tulare County’s numerous agribusiness industries heavily rely on the transfer of goods throughout the State of California. Goods such as grapes, peaches, plums, and many others, rely on the local corridors and highways in order to make it from farm-to-market in a timely manner. This farm-to-market timeliness has huge economic implications. With the proper implementation of goods movement infrastructure, Tulare County can preserve its local and international markets.

G O O
O D S MM O V E MM E N T
FCalifornia
C H A P
5 - 2
Figure 5-1 a Trade Cor
P T E R
rridors

G O O
In
99% incragricultu
Tshipped tare also sother expCountrieCounty’s MOakland,connectiv
O D S M
n 2016 over rease since 2
ural products
The flow of cto Long Beashipped via Uport facilitiess. The effecs agribusines
Many of the T, LA/Long Bvity is essent
M O V E M
$6.37 billion2002). There are listed in
Ora
Ca
PAlm
Source:
commoditiesch, OaklandUnion Pacifis throughoutctive movemss and entireTulare Coun
Beach, and Stial to the liv
M E N T
FCom
n worth of ae were 45 con Table 5-1.
Top AgProduct
Milk ranges, Naveand Valenciaattle & Calv
Grapes Tangerines
Pistachio Nutmonds, Meat
Hulls Corn
Walnuts Lemons
2016 Tulare Coun
s is vital to Td, Port of Stoic Rail and Bt the United
ment of goods economy.
nty’s agriculttockton to avelihood of t
C H A P
5 - 3
Figure 5-2 modity Flow
gricultural gommodities v
Table 5-1gricultural P
20$
els, as ves
ts s, &
nty Annual Crop a
Tulare Countockton and ABurlington NStates. Tabls throughout
tural and manccess to natithe Tulare C
P T E R
w
goods were pvalued over
1 Products
016 Total Va$1,645,572,0$838,593,00
$660,400,00$600,200,00$343,380,00$339,208,00$301,869,00
$186,202,00$137,651,00$117,810,00
and Livestock Repo
ty’s agricultuAirport (FarmNorthern andle 5-2 displat Tulare Cou
nufacturing ional and int
County, and s
produced in $1 million.
alue 000 00
00 00 00 00 00
00 00 00 ort
ural market. mington facid Santa Fe toays the top 1unty is crucia
products utiternational mshould be pre
Tulare CounThe top
Products arlity). Produ
o Canada and0 Export al for Tulare
ilize the Portmarkets. Thiseserved. In
nty (a
re ucts d
e
t of s
G O O D S M O V E M E N T C H A P T E R
5 - 4
addition, as industries within the San Joaquin Valley strive to move up the value chain in agricultural production, these links to domestic and international markets will become even more crucial. Institutional support for marketing Tulare County products include California’s International Trade Coordinating Council, California Enterprise Zones, and Free Trade Zones established at several locations throughout the SJV.
Table 5-2 Top 10 Export Countries
Country Cartons Republic of Korea 6,462,469 China 5,418,167 Japan 4,499,572 Mexico 2,602,482 Taiwan 2,113,534 Hong Kong 1,756,161 Australia 1,190,349 Philippines 1,016,159 Malaysia 756,698 Netherlands 636,714 Source: 2016 Tulare County Annual Crop and Livestock Report
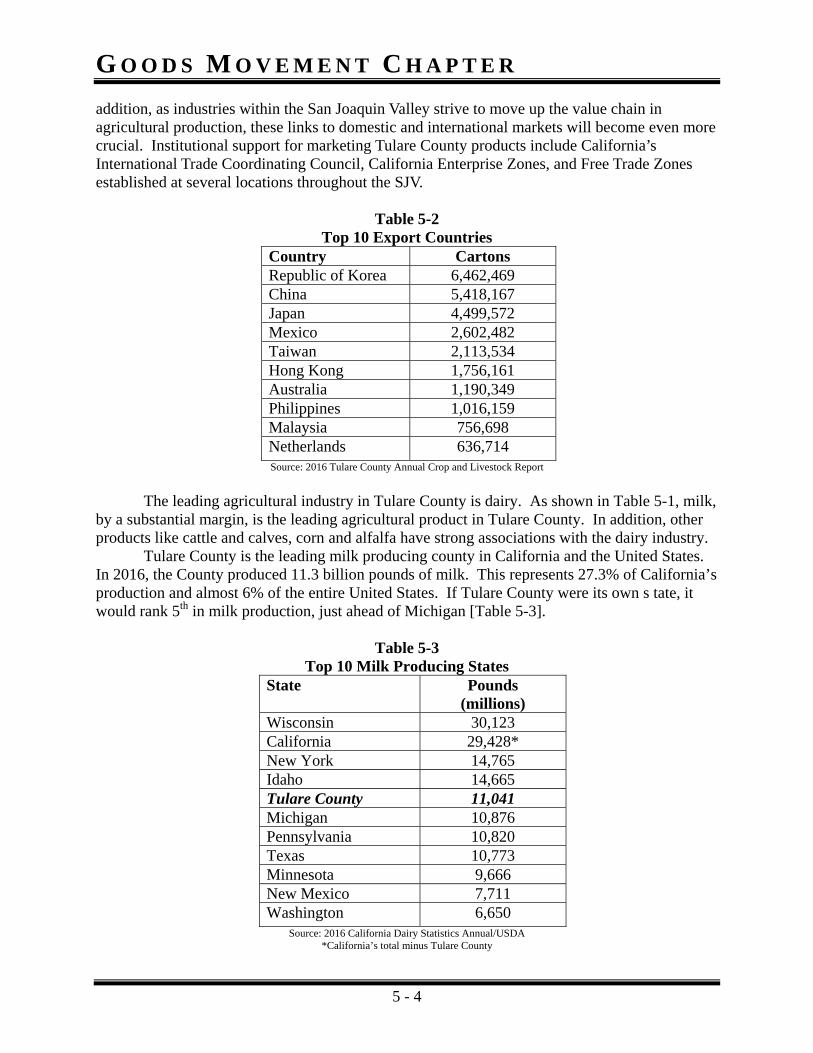
The leading agricultural industry in Tulare County is dairy. As shown in Table 5-1, milk, by a substantial margin, is the leading agricultural product in Tulare County. In addition, other products like cattle and calves, corn and alfalfa have strong associations with the dairy industry. Tulare County is the leading milk producing county in California and the United States. In 2016, the County produced 11.3 billion pounds of milk. This represents 27.3% of California’s production and almost 6% of the entire United States. If Tulare County were its own s tate, it would rank 5th in milk production, just ahead of Michigan [Table 5-3].
Table 5-3 Top 10 Milk Producing States
State Pounds (millions)
Wisconsin 30,123 California 29,428* New York 14,765 Idaho 14,665 Tulare County 11,041 Michigan 10,876 Pennsylvania 10,820 Texas 10,773 Minnesota 9,666 New Mexico 7,711 Washington 6,650
Source: 2016 California Dairy Statistics Annual/USDA *California’s total minus Tulare County
G O O D S M O V E M E N T C H A P T E R
5 - 5
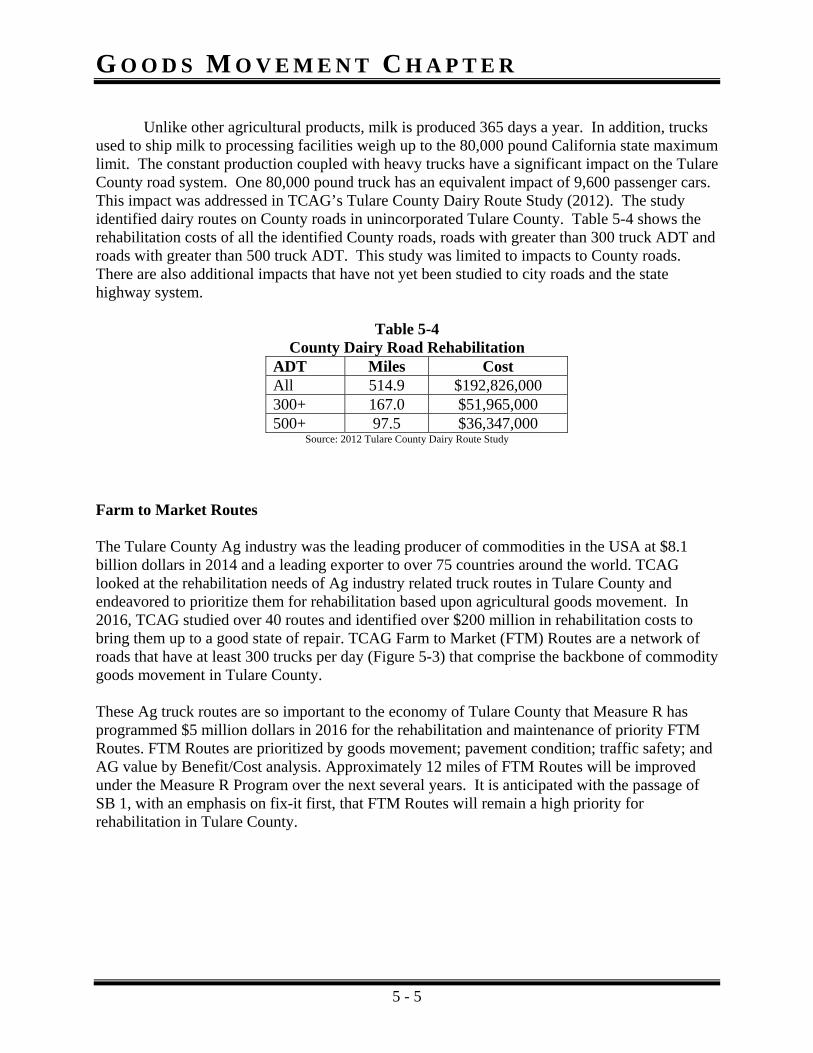
Unlike other agricultural products, milk is produced 365 days a year. In addition, trucks used to ship milk to processing facilities weigh up to the 80,000 pound California state maximum limit. The constant production coupled with heavy trucks have a significant impact on the Tulare County road system. One 80,000 pound truck has an equivalent impact of 9,600 passenger cars. This impact was addressed in TCAG’s Tulare County Dairy Route Study (2012). The study identified dairy routes on County roads in unincorporated Tulare County. Table 5-4 shows the rehabilitation costs of all the identified County roads, roads with greater than 300 truck ADT and roads with greater than 500 truck ADT. This study was limited to impacts to County roads. There are also additional impacts that have not yet been studied to city roads and the state highway system.
Table 5-4 County Dairy Road Rehabilitation
ADT Miles Cost All 514.9 $192,826,000 300+ 167.0 $51,965,000 500+ 97.5 $36,347,000
Source: 2012 Tulare County Dairy Route Study
Farm to Market Routes The Tulare County Ag industry was the leading producer of commodities in the USA at $8.1 billion dollars in 2014 and a leading exporter to over 75 countries around the world. TCAG looked at the rehabilitation needs of Ag industry related truck routes in Tulare County and endeavored to prioritize them for rehabilitation based upon agricultural goods movement. In 2016, TCAG studied over 40 routes and identified over $200 million in rehabilitation costs to bring them up to a good state of repair. TCAG Farm to Market (FTM) Routes are a network of roads that have at least 300 trucks per day (Figure 5-3) that comprise the backbone of commodity goods movement in Tulare County. These Ag truck routes are so important to the economy of Tulare County that Measure R has programmed $5 million dollars in 2016 for the rehabilitation and maintenance of priority FTM Routes. FTM Routes are prioritized by goods movement; pavement condition; traffic safety; and AG value by Benefit/Cost analysis. Approximately 12 miles of FTM Routes will be improved under the Measure R Program over the next several years. It is anticipated with the passage of SB 1, with an emphasis on fix-it first, that FTM Routes will remain a high priority for rehabilitation in Tulare County.

G O O
O D S MM O V E M
Fig
M E N T
gure 5-3 Fa
C H A P
5 - 6
arm to Mark
P T E R
ket Routes
G O O D S M O V E M E N T C H A P T E R
5 - 7
Air Quality Concerns Tulare County also suffers from some of the worst air quality in the nation. In large part,
this is due to the San Joaquin Valley’s bowl-shaped geography. Residents of the San Joaquin Valley often suffer from asthma attacks, acute bronchitis, lost work days, reduced activity, hospital admissions, school absences, and even premature death because of exposure to air pollution. The American Lung Association in 2017 listed the top 10 most polluted cities:
1. Visalia-Porterville-Hanford (SJV) 2. Bakersfield (SJV) 3. Fresno-Madera (SJV) 4. San Jose – San Francisco - Oakland 5. Los Angeles- Long Beach 6. Modesto-Merced (SJV) 7. El Centro 8. Pittsburgh-New Castle-Weirton 9. Cleveland-Akron-Canton 10. San Luis Obispo-Paso Robles
Goods movement in the Tulare County region results in environmental and safety impacts
to communities. Movement of trucks, trains, and airplanes all contribute to the region’s air pollution problems, as well as the associated impacts to public health and the environment. Compared to the total emission sources for Tulare County as displayed in Table 5-5 heavy duty trucks (tractor trailers) account for 6.4% (measured in tons per day) of Total Organic Gases, 6.12% Raw Organic Gases, 3.52% Carbon Monoxide, 36.37% Nitrogen Oxide, 15.38% Sulfur Oxide, 28.19% Particulate Matter 10 microns and 29.22% Particulate Matter 2.5 microns. Moving goods by rail has less emissions and impact on the Valley Air making it a desirable mode alternative to improve air quality conditions in the San Joaquin Valley. Trains contribute 1.69% (measured in tons per day) of Total Organic Gases, 1.51% Raw Organic Gases, 0.69% Carbon Monoxide, 7.87% Nitrogen Oxide, 7.69% Sulfur Oxide, 4.79% Particulate Matter 10 microns and 5.19% Particulate Matter 2.5 microns.
In addition, safety concerns exist around at-grade rail crossings, as well as along some corridors not designed to safely carry high truck traffic, and places where truck shortages lead to illegally parked trucks. Incompatible land uses – residents near distribution centers, rail yards, and other goods movement facilities can be impacted by light and noise pollution, as well as from runoff pollution to regional drinking water. In some cases, expanding urban/residential areas can move incompatible land uses into close contact, causing conflicts between residents and the goods movement facilities
As Tulare County’s population continues to grow, it will become increasingly important to develop efficient techniques to for improving commodity flow and logistics of moving products from point A to point B to reduce emissions and fuel consumption.

G O O D S M O V E M E N T C H A P T E R
5 - 8
Increased Load Capacity With the increase cost of fuel and air quality, greenhouse gas emissions and improved technology, the California Trucking Association (CTA) is advocating to increase payload weight limits on trailers. The current standard in California is on a Tandem axle trailer 34,000 lbs. (Gross Vehicle Weight of 80,000 lbs.) with 65 foot tractor and trailer limits. In other states the weight limit on tandem axel trailers is as high as 42,000 lbs, and in some states they allow a tridem axle weight limit of 42,000 lbs. to 54,000 lbs. With the increased weight limits more products can be moved using less fuel and reducing emissions. The opportunity to increase weight limits is legislative, and would require additional science and engineering to determine what limits the highways can bare and the maintenance cost by adding additional weight vs. axle displacement (third axel). Adding length is another opportunity to move additional goods that would lower fuel costs and emissions. California has a 65 foot limit double trailers (53 foot for single trailers) while other states allow for triple trailers on interstates only. This becomes a safety issue and must be determined by legislation. These arguments can be made and merit discussion in the State legislative process.

G O O D S M O V E M E N T C H A P T E R
5 - 9
Table 5-5 2015 Estimated Annual Average Emissions by California ARB
Tons per Day
MOBILE SOURCES TOG ROG CO NOX SOX PM PM10 PM2.5
ON-ROAD MOTOR VEHICLES LIGHT DUTY PASSENGER (LDA) 1.44 1.33 11.78 0.97 0.02 0.17 0.17 0.09
LIGHT DUTY TRUCKS - 1 (LDT1) 0.88 0.83 6.91 0.65 0.01 0.07 0.07 0.04
LIGHT DUTY TRUCKS - 2 (LDT2) 1.25 1.17 9.92 1.13 0.01 0.13 0.13 0.08
MEDIUM DUTY TRUCKS (MDV) 0.72 0.66 6.29 0.76 0.01 0.07 0.07 0.05
LIGHT HEAVY DUTY GAS TRUCKS - 1 (LHDGT1)
0.29 0.28 1.73 0.4 0 0.01 0.01 0.01
LIGHT HEAVY DUTY GAS TRUCKS - 2 (LHDGT2)
0.11 0.1 0.55 0.12 0 0 0 0
MEDIUM HEAVY DUTY GAS TRUCKS (MHDGT)
0.18 0.17 1.52 0.13 0 0 0 0
HEAVY HEAVY DUTY GAS TRUCKS (HHDGT)
0.06 0.06 1.04 0.14 0 0 0 0
LIGHT HEAVY DUTY DIESEL TRUCKS - 1 (LHDDT1)
0.02 0.02 0.09 0.29 0 0.01 0.01 0
LIGHT HEAVY DUTY DIESEL TRUCKS - 2 (LHDDT2)
0.02 0.01 0.07 0.23 0 0 0 0
MEDIUM HEAVY DUTY DIESEL TRUCKS (MHDDT)
0.04 0.04 0.4 1.15 0 0.05 0.05 0.04
HEAVY HEAVY DUTY DIESEL TRUCKS (HHDDT)
0.77 0.68 2.88 8.8 0.02 0.36 0.36 0.29
MOTORCYCLES (MCY)
0.61 0.57 4.46 0.18 0 0.01 0.01 0
HEAVY DUTY DIESEL URBAN BUSES (UBD)
0.01 0.01 0.03 0.15 0 0 0 0
HEAVY DUTY GAS URBAN BUSES (UBG)
0.02 0.02 0.27 0.08 0 0 0 0
SCHOOL BUSES (SB) 0.03 0.02 0.24 0.29 0 0.01 0.01 0.01
OTHER BUSES (OB) 0.02 0.02 0.27 0.1 0 0 0 0
MOTOR HOMES (MH) 0.02 0.02 0.37 0.09 0 0 0 0
* TOTAL ON-ROAD MOTOR VEHICLES 6.5 6.01 48.82 15.66 0.08 0.9 0.89 0.63
OTHER MOBILE SOURCES AIRCRAFT 0.11 0.09 2.33 0.06 0.01 0.01 0.01 0.01
TRAINS 0.28 0.23 0.82 3.04 0 0.09 0.09 0.08
RECREATIONAL BOATS 1.02 0.98 7.58 0.36 0 0.08 0.07 0.06
OFF-ROAD RECREATIONAL VEHICLES 2.94 2.74 6.35 0.07 0.03 0.04 0.03 0.03
OFF-ROAD EQUIPMENT 1.17 1.06 11.22 2.32 0 0.14 0.14 0.12
FARM EQUIPMENT 1.14 0.99 7.52 5.36 0.01 0.3 0.3 0.27
FUEL STORAGE AND HANDLING 0.18 0.18 - - - - - -
* TOTAL OTHER MOBILE SOURCES 6.84 6.27 35.81 11.21 0.06 0.66 0.65 0.57 ** TOTAL MOBILE SOURCES 13.33 12.28 84.63 26.87 0.13 1.56 1.54 1.2
Source California ARB 2015 Estimated Annual Average Emissions for Tulare County. https://www.arb.ca.gov/app/emsinv/emssumcat_query.php?F_YR=2015&F_DIV=-4&F_SEASON=A&SP=2009&F_AREA=CO&F_CO=54&F_COAB=#8

G O O D S M O V E M E N T C H A P T E R
5 - 10
State Route 99 State Route (SR) 99 is the transportation backbone of Tulare County and the San Joaquin
Valley. It runs 275 miles (54 miles in Tulare County) through the Valley from I-5 in southern Kern County north to the San Joaquin/Sacramento County border. The highway serves as the vital link for agricultural goods leaving Tulare County and the Valley for intrastate, interstate, and international destinations. In addition to its importance to trade, SR 99 is the preeminent artery connecting the SJV’s population to the rest of the state and country.
SR 99 is mostly freeway, with a final few sections being converted from an expressway to a freeway in Merced County. SR 99 is designated as a High Emphasis Focus Route in the Interregional Transportation Strategic Plan (ITSP), and is a “Priority Global Gateway” for goods movement in the Global Gateways Development Program (January 2002). SR 99 is also classified as a principal arterial and is a part of the National Highway System (NHS) as a Strategic Highway Network (STRAHNET) Route. The Department of Defense has identified STRAHNET routes as critical for supporting defense requirements and they are mandatory components of the NHS. It is also on the national network from the Surface Transportation Assistance Act (STAA) for large trucks, and is a High Emphasis, Focus, and Gateway Route as part of the California Interregional Roadway System (IRR). SR 99 is an Intermodal Corridor of Economic Significance (ICES) between I 5 south of Bakersfield and SR 50 in Sacramento.
In 2005, legislation was enacted that designated the section of SR 99 from Bakersfield to Sacramento as a future potential interstate. At this time, it is unclear how the existing non-standard features on SR 99 would be treated if it were to be added to the interstate system. The regulations do make a “provisional” interstate designation available, provided that the facility is brought up to standards by 2030. The SJV Regional Transportation Planning Agency (RTPA) Executive Directors and the California Department of Transportation (Caltrans) approved the development of a study to determine the economic benefit of designating SR-99 as an interstate.
SR 99 is a critically vital farm to market route conveying agricultural goods to the country and to international destinations through the Ports of Oakland and Los Angeles/Long Beach while also serving as the primary artery connecting the major population centers in the San Joaquin Valley to the San Francisco and Los Angeles metro areas. The importance of SR 99 has been identified at the State and Federal levels. State Route 99 was designated as a “Major International Trade Highway Route” and “Priority Corridor” in the 2025 California Transportation Plan and the California Goods Movement Action Plan and was designated as a “National Highway System High Priority Corridor” by federal transportation acts (currently MAP 21).
SR 99 is currently under construction to expand to 6 lanes from the Fresno County line to south of SR 198. Funding was programmed from the SR 99 Corridor account from Proposition 1b to widen 12.6 miles of SR 99 to 6 lanes from Fresno County (Kingsburg) to Goshen which begun in 2010 with completion in 2014. With the cost savings from this section, a second section from Goshen (.9 miles south of west Visalia overhead to .2 miles North of the Goshen Overhead) began construction 2013 with completion in 2015. In the middle of these two sections Betty Drive Interchange leading into Visalia’s industrial park will begin construction in 2016 to be covered by Measure R and State Transportation Improvement Program (STIP) funds. TCAG is continuing to partner with Caltrans to leverage funding from TCAG’s share of the STIP with Caltrans’ Interregional Improvement Program (IIP) for further SR-99 widening projects south of SR-198 (north of Caldwell) [Table 5-6].

G O O D S M O V E M E N T C H A P T E R
5 - 11
Table 5-6
SR-99 Widening ProjectsLimits* Miles Open to
Traffic Cost ($
millions) Goshen to Fresno Co. 12.6 2013 $102 Caldwell to Goshen 4.0 2015 $52 Tagus to Caldwell 2.1 2017 $25 Prosperity to Tagus 4.6 2022 $96 Ave 200 to Prosperity 5.1 2029 $263 South of Tipton to Ave 200 9.5 2038 $193
Kern Co. to Tipton 16.0 Outside 2018
RTP Outside 2018
RTP * Limits are generalized. Refer to Table A-16 for precise limits
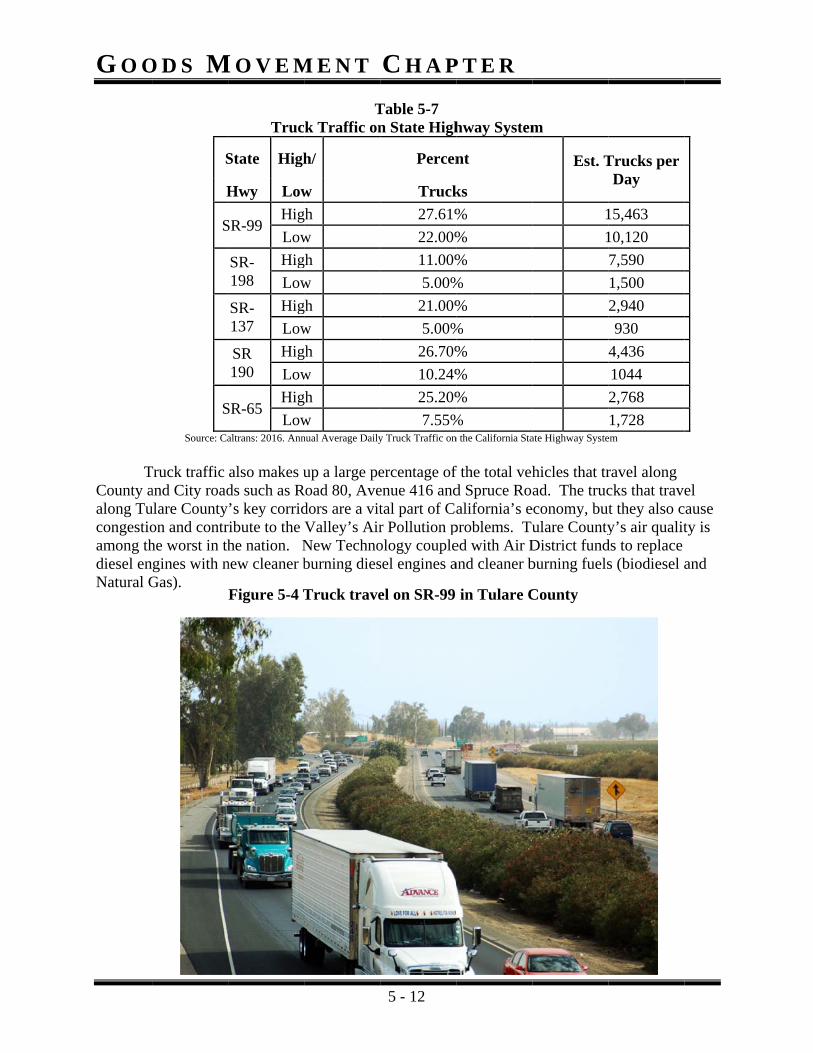
Trucks
Tulare County’s centralized location makes it an ideal location for goods movements via the use of heavy duty trucks. Many of Tulare County’s major distribution centers are located in the northern part of the county near Goshen, but distribution centers can be found throughout the entire county. Distribution centers for Wal-Mart, Joann’s Fabrics, Best Buy, Ruiz Frozen Foods, and several packaging and food processing companies are located throughout Tulare County. Many companies have taken advantage of the available and affordable land by locating in Tulare County. Tulare County is 2.5 hours from Los Angeles, 3.5 hours to Long Beach, 3.5 hours from the Port of Oakland and 4 hours from San Francisco. Tulare County is also an ideal hub to the Western United State reaching Washington, Oregon, Idaho, Wyoming, Montana, Utah, Nevada, Arizona, New Mexico, and Colorado, in less than 24 hours.
SR 99 is the preeminent truck corridor in Tulare County. As mentioned before, SR 99 is the transportation backbone of the entire San Joaquin Valley and, along with I 5, the entire State. The other major truck corridors on the State Highway System in Tulare County feed into SR 99. They include SR 198 (from SR 65 to Kings County), SR 65 (from Kern County to SR 137), SR 190 (from SR 65 to SR 99) and SR 137 (from SR 65 to SR 99). Truck traffic on the major state route corridors is listed below in Table 5-7.
G O O
T
County aalong Tucongestioamong thdiesel enNatural G
O D S M
S
H
S
S
Source: Ca
Truck traffic and City roadulare Countyon and contrhe worst in thgines with n
Gas).
M O V E M
Truc
State High
Hwy Low
SR-99 Hig
Low
SR-198
Hig
Low
SR-137
Hig
Low
SR 190
Hig
Low
SR-65 Hig
Lowaltrans: 2016. Ann
also makes uds such as R’s key corrid
ribute to the he nation. N
new cleaner b
Figure 5-4 T
M E N T
Tk Traffic on
h/
w
gh
w
gh
w
gh
w
gh
w
gh
w nual Average Daily
up a large peRoad 80, Avedors are a vitValley’s AirNew Technoburning dies
Truck trave
C H A P
5 - 12
Table 5-7 n State High
Percen
Truck
27.61%
22.00%
11.00%
5.00%
21.00%
5.00%
26.70%
10.24%
25.20%
7.55%y Truck Traffic on
ercentage of enue 416 andtal part of Car Pollution pology couplesel engines a
el on SR-99
P T E R
hway System
nt
ks
%
%
%
%
%
%
%
%
%
% n the California Sta
f the total vehd Spruce Roalifornia’s e
problems. Tued with Air Dand cleaner b
in Tulare C
m
Est. T
1
1
ate Highway Syste
hicles that trad. The truc
economy, butulare CountyDistrict fundburning fuels
County
Trucks per Day
15,463
10,120
7,590
1,500
2,940
930
4,436
1044
2,768
1,728 em
ravel along cks that travet they also cy’s air qualit
ds to replace s (biodiesel a
el cause ty is
and
G O O
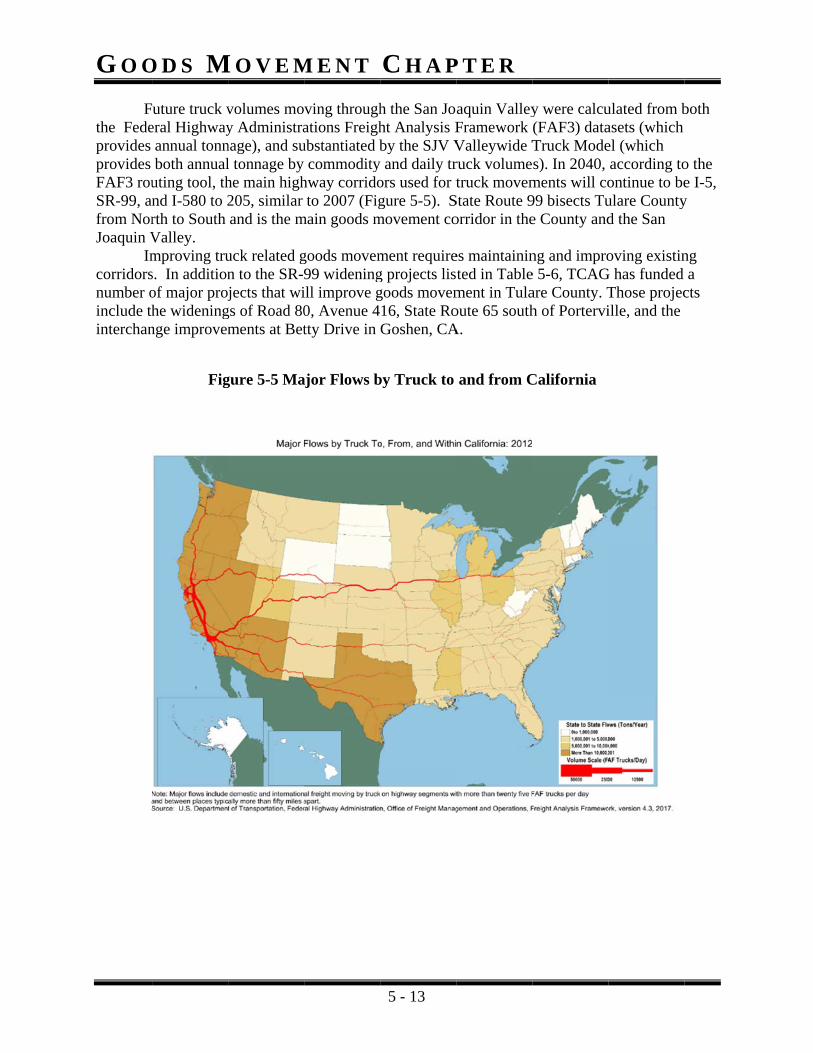
Fthe Fedeprovides provides FAF3 rouSR-99, anfrom NorJoaquin V
Imcorridorsnumber oinclude thinterchan
O D S M
uture truck veral Highwayannual tonnboth annual
uting tool, thnd I-580 to 2rth to South Valley. mproving trus. In additionof major projhe widening
nge improvem
Fig
M O V E M
volumes moy Administranage), and sul tonnage by he main high205, similar and is the m
uck related gn to the SR-9jects that wi
gs of Road 80ments at Bet
gure 5-5 Ma
M E N T
ving throughations Freighubstantiated b
commodityhway corridoto 2007 (Fig
main goods m
goods movem99 wideningill improve g0, Avenue 4tty Drive in
ajor Flows b
C H A P
5 - 13
h the San Joht Analysis Fby the SJV V
y and daily trors used for tgure 5-5). S
movement co
ment requireg projects lisgoods movem16, State RoGoshen, CA
by Truck to
P T E R
aquin ValleyFramework Valleywide Truck volumetruck movem
State Route 9orridor in the
es maintaininted in Tablement in Tulaoute 65 southA.
and from C
y were calcu(FAF3) dataTruck Modes). In 2040,
ments will co99 bisects Tue County and
ng and improe 5-6, TCAGare County. Th of Portervi
California
ulated from basets (which el (which according toontinue to beulare Countyd the San
oving existinG has funded
Those projecille, and the
both
o the e I-5, y
ng a
cts
G O O
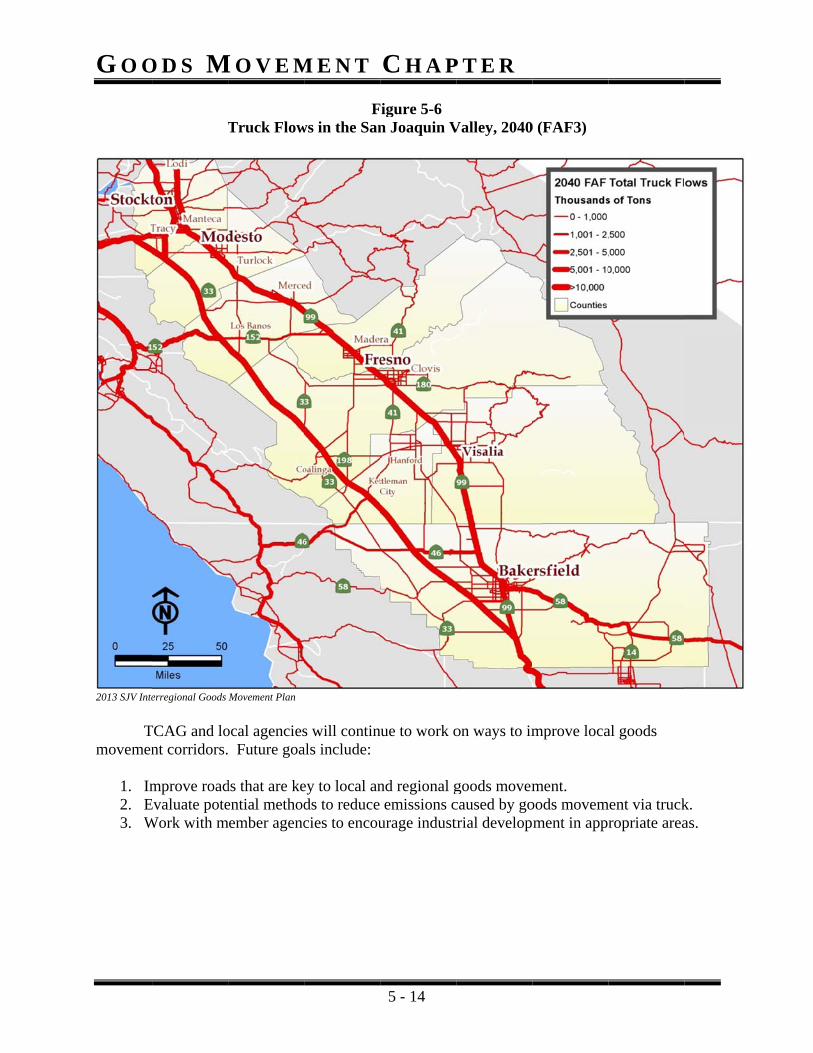
2013 SJV Inte
T
movemen
1. Im2. E3. W
O D S M
erregional Goods
TCAG and lont corridors.
mprove roadEvaluate poteWork with m
M O V E M
Truck Flow
Movement Plan
ocal agencies Future goa
ds that are keential method
member agenc
M E N T
Fws in the San
s will continals include:
ey to local ands to reduce cies to encou
C H A P
5 - 14
Figure 5-6 n Joaquin V
nue to work o
nd regional gemissions c
urage indust
P T E R
Valley, 2040
on ways to im
goods movemcaused by gotrial develop
0 (FAF3)
mprove loca
ment. oods movemment in appr
al goods
ment via truckropriate area
k. as.
G O O Rail
TRailroad,and Burli
Gexample,vehicles,specializThese spmodes oftypically the limitathan trucfoot truck
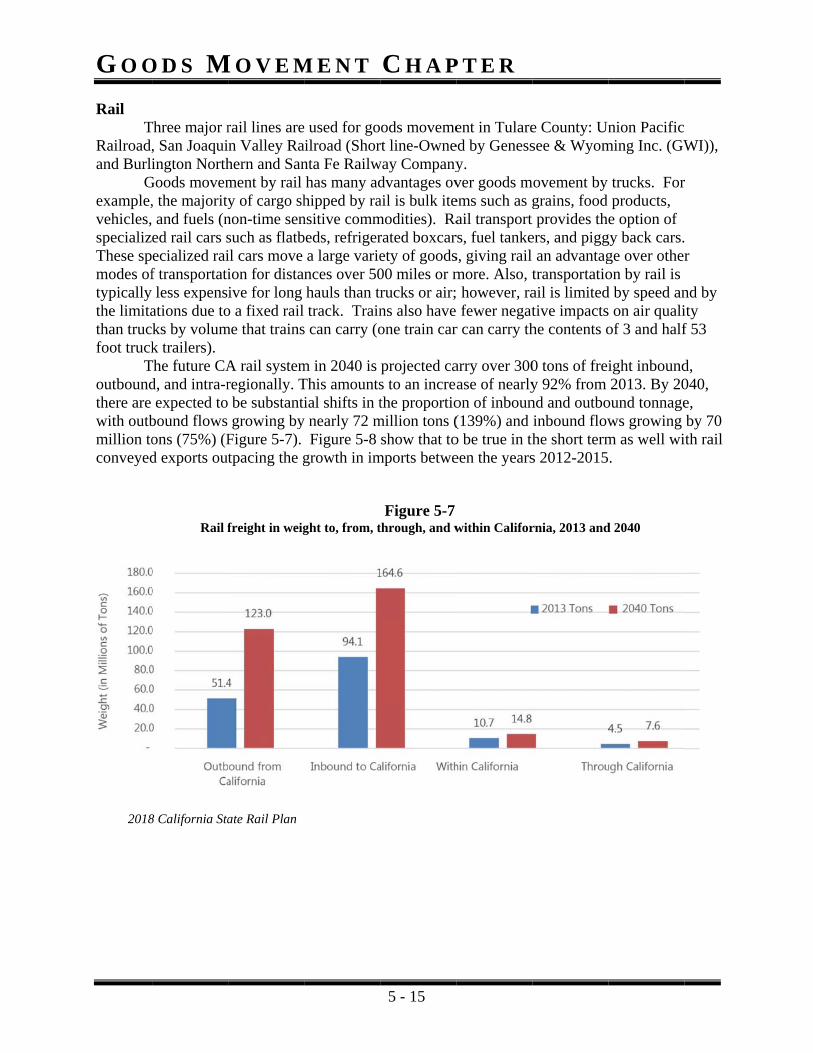
Toutboundthere are with outbmillion toconveyed
2018
O D S M
Three major r, San Joaquiington North
Goods movem, the majority and fuels (ned rail cars secialized raif transportatiless expens
ations due toks by volumk trailers).
The future CAd, and intra-rexpected to
bound flows ons (75%) (Fd exports out
8 California Sta
Rail f
M O V E M
rail lines aren Valley Rahern and Sanment by rail y of cargo sh
non-time sensuch as flatbil cars move ion for distanive for long
o a fixed rail me that trains
A rail systemregionally. T be substantigrowing by
Figure 5-7). tpacing the g
ate Rail Plan
freight in weig
M E N T
e used for goailroad (Shornta Fe Railwhas many adhipped by ra
nsitive commbeds, refriger
a large variences over 50hauls than trtrack. Train
s can carry (o
m in 2040 is This amountsial shifts in t
y nearly 72 m Figure 5-8growth in im
ght to, from, t
C H A P
5 - 15
ods movemert line-Owne
way Companydvantages ovail is bulk itemodities). Rarated boxcarety of goods00 miles or mrucks or air;ns also haveone train car
projected cas to an increthe proportio
million tons (show that to
mports betwe
Figure 5-7through, and w
P T E R
ent in Tulareed by Genessy. ver goods mems such as gail transport
rs, fuel tankes, giving rail more. Also, t however, ra fewer negat
r can carry th
arry over 300ase of nearlyon of inboun(139%) and o be true in theen the years
within Califor
e County: Unsee & Wyom
movement by grains, food t provides theers, and pigg an advantagtransportatioail is limitedtive impactshe contents o
0 tons of freiy 92% from nd and outboinbound flowhe short terms 2012-2015
rnia, 2013 and
nion Pacificming Inc. (GW
trucks. Forproducts, e option of
gy back cars.ge over otheron by rail is d by speed ans on air qualiof 3 and half
ight inbound2013. By 20
ound tonnagews growingm as well wi.
d 2040
WI)),
r
r
nd by ity f 53
d, 040, e, by 70
ith rail
G O O
C
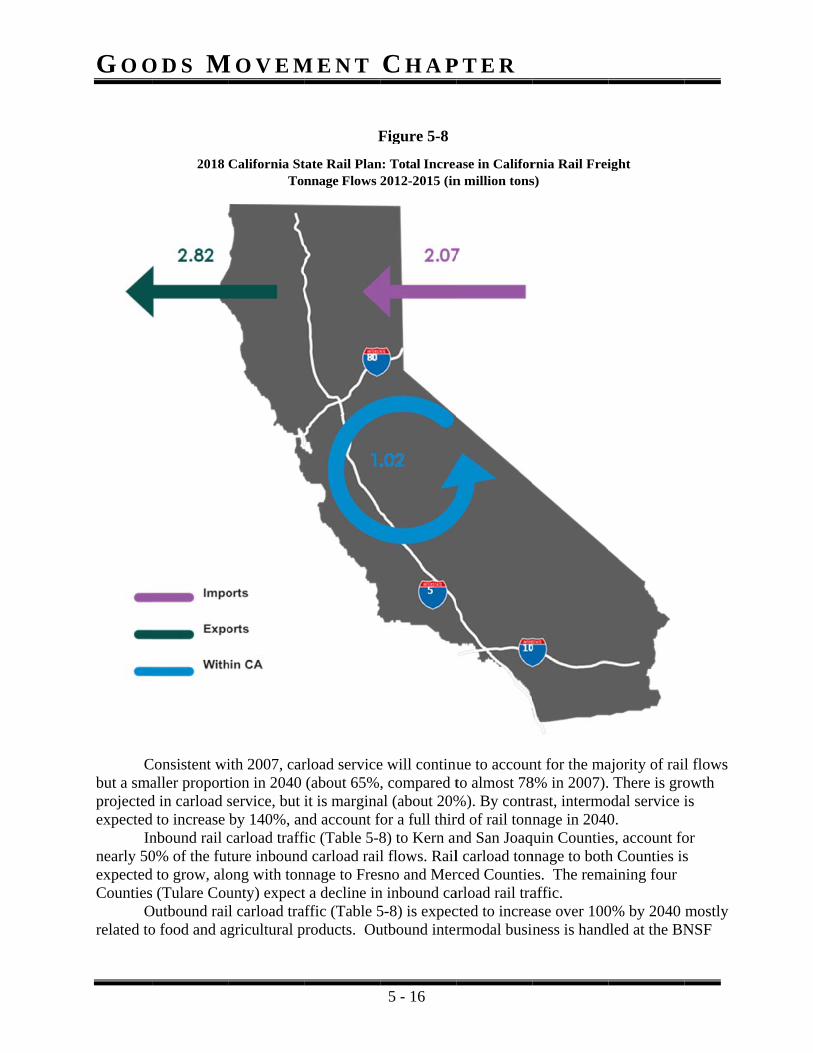
but a smaprojectedexpected
Innearly 50expectedCounties Orelated to
O D S M
Consistent wialler proportd in carload sd to increase nbound rail c0% of the futd to grow, alo
(Tulare CouOutbound raio food and ag
2018
M O V E M
ith 2007, cartion in 2040 service, but by 140%, ancarload traffture inboundong with tonunty) expectl carload tragricultural p
California StTo
M E N T
rload service(about 65%it is marginand account ffic (Table 5-8d carload railnnage to Frest a decline inaffic (Table 5products. Ou
F
tate Rail Plannnage Flows
C H A P
5 - 16
e will continu, compared tal (about 20%for a full thir8) to Kern anl flows. Railsno and Mern inbound ca5-8) is expecutbound inter
Figure 5-8
n: Total Increa2012-2015 (in
P T E R
ue to accounto almost 78%). By contrrd of rail tonnnd San Joaql carload tonrced Countiearload rail tracted to increarmodal busin
ase in Californ million tons
nt for the ma8% in 2007).rast, intermonage in 2040
quin Countiennage to bothes. The remaaffic. ase over 100ness is hand
rnia Rail Freis)
ajority of rai There is gro
odal service i0. s, account foh Counties isaining four
0% by 2040 dled at the BN
ight
l flows owth is
or s
mostly NSF
G O O D S M O V E M E N T C H A P T E R
5 - 17
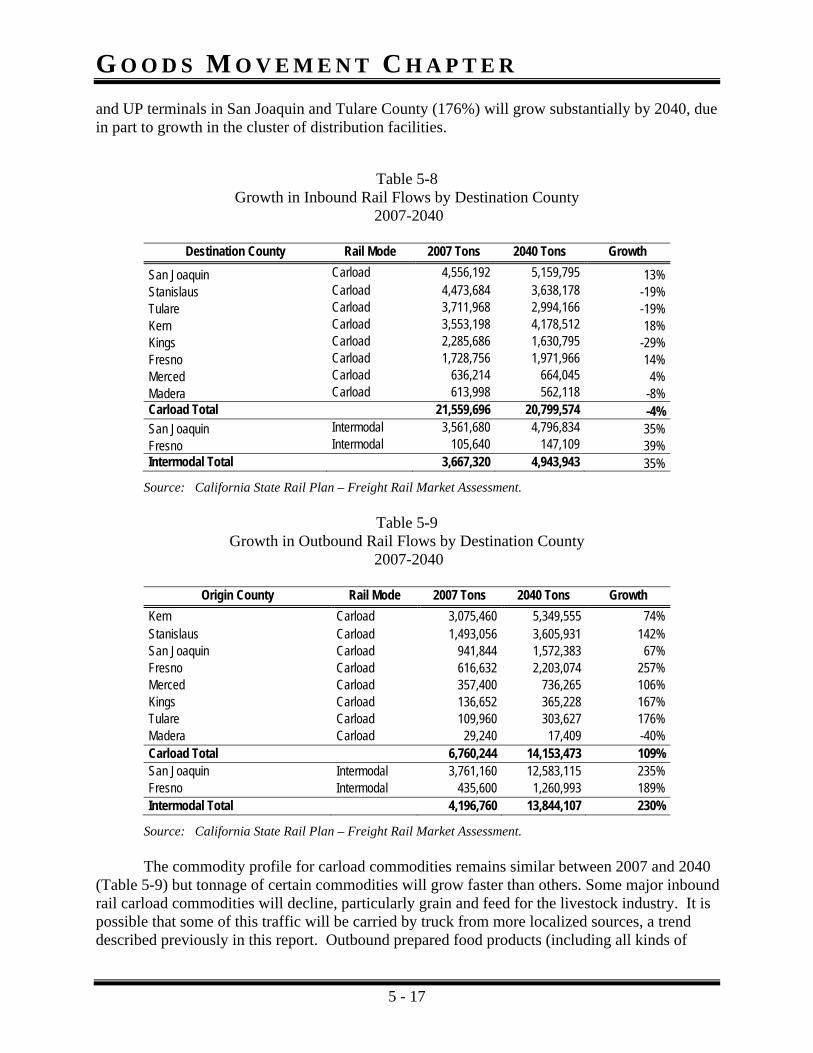
and UP terminals in San Joaquin and Tulare County (176%) will grow substantially by 2040, due in part to growth in the cluster of distribution facilities.
Table 5-8 Growth in Inbound Rail Flows by Destination County
2007-2040
Destination County Rail Mode 2007 Tons 2040 Tons Growth
San Joaquin Carload 4,556,192 5,159,795 13% Stanislaus Carload 4,473,684 3,638,178 -19% Tulare Carload 3,711,968 2,994,166 -19% Kern Carload 3,553,198 4,178,512 18% Kings Carload 2,285,686 1,630,795 -29% Fresno Carload 1,728,756 1,971,966 14% Merced Carload 636,214 664,045 4% Madera Carload 613,998 562,118 -8% Carload Total 21,559,696 20,799,574 -4% San Joaquin Intermodal 3,561,680 4,796,834 35% Fresno Intermodal 105,640 147,109 39% Intermodal Total 3,667,320 4,943,943 35%
Source: California State Rail Plan – Freight Rail Market Assessment.
Table 5-9 Growth in Outbound Rail Flows by Destination County
2007-2040
Origin County Rail Mode 2007 Tons 2040 Tons Growth
Kern Carload 3,075,460 5,349,555 74% Stanislaus Carload 1,493,056 3,605,931 142% San Joaquin Carload 941,844 1,572,383 67% Fresno Carload 616,632 2,203,074 257% Merced Carload 357,400 736,265 106% Kings Carload 136,652 365,228 167% Tulare Carload 109,960 303,627 176% Madera Carload 29,240 17,409 -40% Carload Total 6,760,244 14,153,473 109% San Joaquin Intermodal 3,761,160 12,583,115 235% Fresno Intermodal 435,600 1,260,993 189% Intermodal Total 4,196,760 13,844,107 230%
Source: California State Rail Plan – Freight Rail Market Assessment. The commodity profile for carload commodities remains similar between 2007 and 2040
(Table 5-9) but tonnage of certain commodities will grow faster than others. Some major inbound rail carload commodities will decline, particularly grain and feed for the livestock industry. It is possible that some of this traffic will be carried by truck from more localized sources, a trend described previously in this report. Outbound prepared food products (including all kinds of
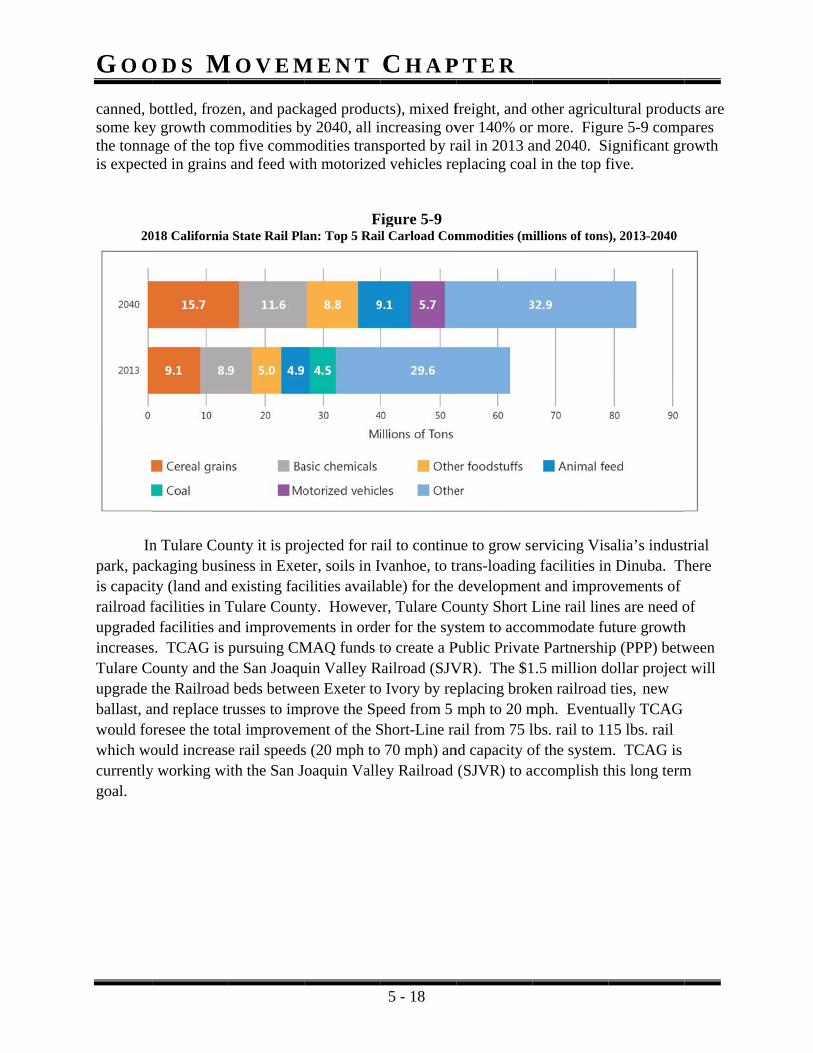
G O O canned, bsome keythe tonnais expect
20
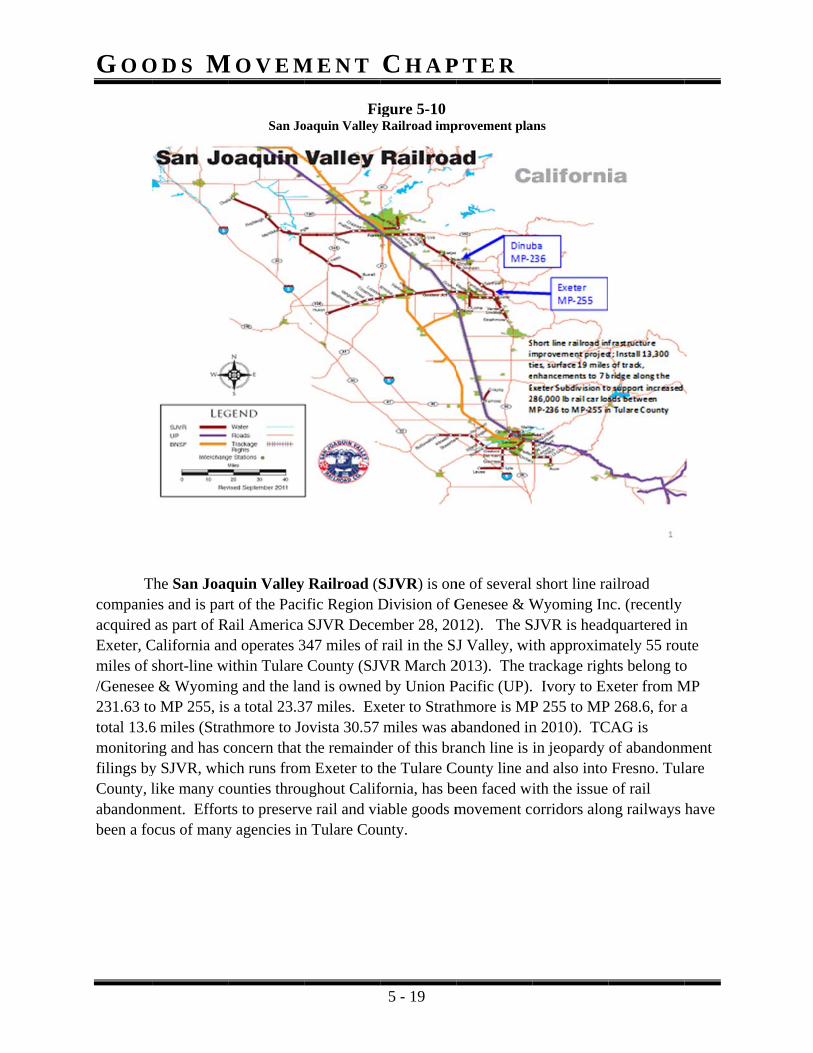
Inpark, pacis capacitrailroad fupgradedincreasesTulare Cupgrade tballast, awould fowhich wocurrentlygoal.
O D S M
bottled, frozey growth comage of the toped in grains
018 California
n Tulare Couckaging busity (land and facilities in Td facilities ans. TCAG is ounty and ththe Railroad
and replace troresee the totould increas
y working wi
M O V E M
en, and packmmodities byp five command feed wi
a State Rail Pla
unty it is proness in Exetexisting fac
Tulare Counnd improvempursuing CM
he San Joaqud beds betwerusses to imptal improveme rail speedsith the San J
M E N T
kaged producy 2040, all i
modities transith motorized
Fan: Top 5 Rai
ojected for rater, soils in Icilities availanty. Howevements in ordeMAQ funds tuin Valley Ren Exeter toprove the Sp
ment of the Ss (20 mph tooaquin Valle
C H A P
5 - 18
cts), mixed fncreasing ovsported by rad vehicles re
Figure 5-9 il Carload Com
ail to continuvanhoe, to tr
able) for the er, Tulare Coer for the systo create a P
Railroad (SJVo Ivory by repeed from 5 Short-Line ra 70 mph) aney Railroad
P T E R
freight, and over 140% orail in 2013 aeplacing coa
mmodities (m
ue to grow serans-loadingdevelopmen
ounty Short Lstem to acco
Public PrivatVR). The $1eplacing brokmph to 20 mail from 75 l
nd capacity o(SJVR) to a
other agricur more. Figuand 2040. Sial in the top f
millions of tons
ervicing Visg facilities innt and improLine rail line
ommodate fute Partnership1.5 million dken railroad mph. Eventulbs. rail to 11of the systemaccomplish th
ltural producure 5-9 compignificant grfive.
), 2013-2040
salia’s industn Dinuba. Thovements of es are need outure growthp (PPP) betw
dollar projectties, new
ually TCAG 15 lbs. rail
m. TCAG is his long term
cts are pares rowth
trial here
of h ween t will
m
G O O
Tcompanieacquired Exeter, Cmiles of /Genesee231.63 tototal 13.6monitorinfilings byCounty, labandonmbeen a fo
O D S M
The San Joaqes and is paras part of R
California anshort-line w
e & Wyomino MP 255, is6 miles (Strang and has cy SJVR, whilike many coment. Effortocus of many
M O V E M
San Jo
quin Valleyrt of the Paci
Rail America nd operates 3ithin Tulare
ng and the las a total 23.3athmore to Joconcern that ich runs fromounties throuts to preservy agencies in
M E N T
Fioaquin Valley
Railroad (Sific Region DSJVR Dece
347 miles of County (SJV
and is owned7 miles. Exovista 30.57 the remaind
m Exeter to tughout Califve rail and vin Tulare Cou
C H A P
5 - 19
igure 5-10 Railroad imp
SJVR) is onDivision of Gember 28, 20rail in the SJVR March 2
d by Union Pxeter to Strath
miles was ader of this brathe Tulare Cfornia, has beiable goods munty.
P T E R
provement pla
ne of several Genesee & W012). The SJ Valley, wi
2013). The tPacific (UP).hmore is MP
abandoned inanch line is
County line aeen faced wimovement c
ans
short line raWyoming In
SJVR is headith approximtrackage righ Ivory to ExP 255 to MPn 2010). TCin jeopardy
and also into ith the issue orridors alon
ailroad nc. (recently dquartered in
mately 55 rouhts belong toxeter from M
P 268.6, for aCAG is
of abandonmFresno. Tulof rail
ng railways
n ute o MP a
ment lare
have

G O O
Tdesignatidistribute
T
source of
1. Id2. E3. Id
ac4. Im
Aviation
Alimited intwo lightoperated Portervilowned aimay makCounty C
F
O D S M
To encourageing for induse their goods
TCAG and lof goods mov
dentifying anEncouraging dentify potenccess to railwmprove and
n Aviation is ann Tulare Coutly used privairports sucle Municipairports in theke goods moComprehensi
Figure 5-11 SJV Tr
M O V E M
e the future ustrial use in os.
ocal agenciesvement. Futu
nd preservinbusinesses tntial industriways. upgrade trac
nother methounty. There ately operateh as Woodlal and Visalia
e Capital Impvement by aive Airport L
rain crosses tracks
M E N T
use of rail, arorder to enco
s will continure goals inc
ng rail in areato use rail to ial areas alon
cks when fea
od for goodsare seven pu
ed airports (ake Municipa Municipal.provement Paviation morLand Use Pl
in Tulare County
C H A P
5 - 20
reas along raourage busin
nue to work oclude:
as critical to transport go
ng railways
asible.
s movement.ublic use airEckert Field
pal, Sequoia . There are pProgram (Tabe viable in Tan (CALUP
P T E R
ailways and nesses to exp
on ways to m
goods moveoods. which could
. Currently, rports in Tulad and Exeter Field, Meffoplans to upgble 4-18 in t
Tulare CountP) is in the pr
near rail stapand and use
make rail a m
ement
d provide bu
this mode oare County. Airport) and
ord Field (Tugrade and expthe Financiaty. In additirocess of bei
ations could be rail to
more viable
sinesses eas
of travel is fa These includ small publulare Municpand the publ Element) thion, the Tulaing updated.
be
ier
airly ude licly ipal), blicly hat
are
G O O D S M O V E M E N T C H A P T E R
5 - 21
Next Steps Goods movement is a vital part of Tulare County’s economy and transportation system.
Securing and improving the goods movement system is a key goal of TCAG. Future goods movement efforts will focus on reducing the impacts that goods movement has on traffic, roads and air quality. As part of that effort, TCAG will further evaluate the benefits of improving goods movement along rail corridors. TCAG will continue to encourage local agencies to take actions to prevent the future abandonment of rail right-of-ways. TCAG also supports the use of rail as a measure to alleviate conditions resulting from truck transport.
By pursuing best suited solutions and collaborating with stakeholders, TCAG will continue working to develop a better future for the Tulare County goods movement system.