google bigquery & tableau: best practices · google bigquery tableau bes pracices 2...
TRANSCRIPT
Google BigQuery & Tableau: Best Practices
2Google BigQuery & Tableau: Best Practices
Introduction
Tableau and Google BigQuery allows people to analyze massive amounts of data and get answers fast
using an easy-to-use, visual interface. Using the tools together, you can:
• Put the power of Google BigQuery into the hands of everyday users for fast, interactive analysis.
• Analyze billions of rows in seconds using visual analysis tools without writing a single line of
code and with zero server-side management.
• Create stunning dashboards in minutes that connect to your Google BigQuery data and keep your
organization up to speed.
• Share reports and insights on the web using Tableau Server and Tableau Online to allow anyone
to connect from any device.
• Combine the cloud agility of Google BigQuery with the blazing speed of Tableau to recognize
project value faster.
Optimizing the two technologies together will yield significant performance gains, shorten design
cycles, and help users and organizations become more successful. In this paper, we will discuss
techniques to optimize data modeling and query formation to maximize the responsiveness of
visualizations. We will also discuss techniques to get the best cost efficiency when using Tableau and
BigQuery together.
Authors
Pierce Young, Product Manager, Tableau
Vaidy Krishnan, Senior Product Manager, Tableau
Riley Maris, Senior Product Marketing Specialist, Tableau
Babu Prasad Elumala, Solutions Engineer, Google
Seth Hollyman Technical Program Manager, Google
Tino Tereshko, Enterprise Solutions Engineer, Google
Mike Graboski, Solutions Engineer, Google
3Google BigQuery & Tableau: Best Practices
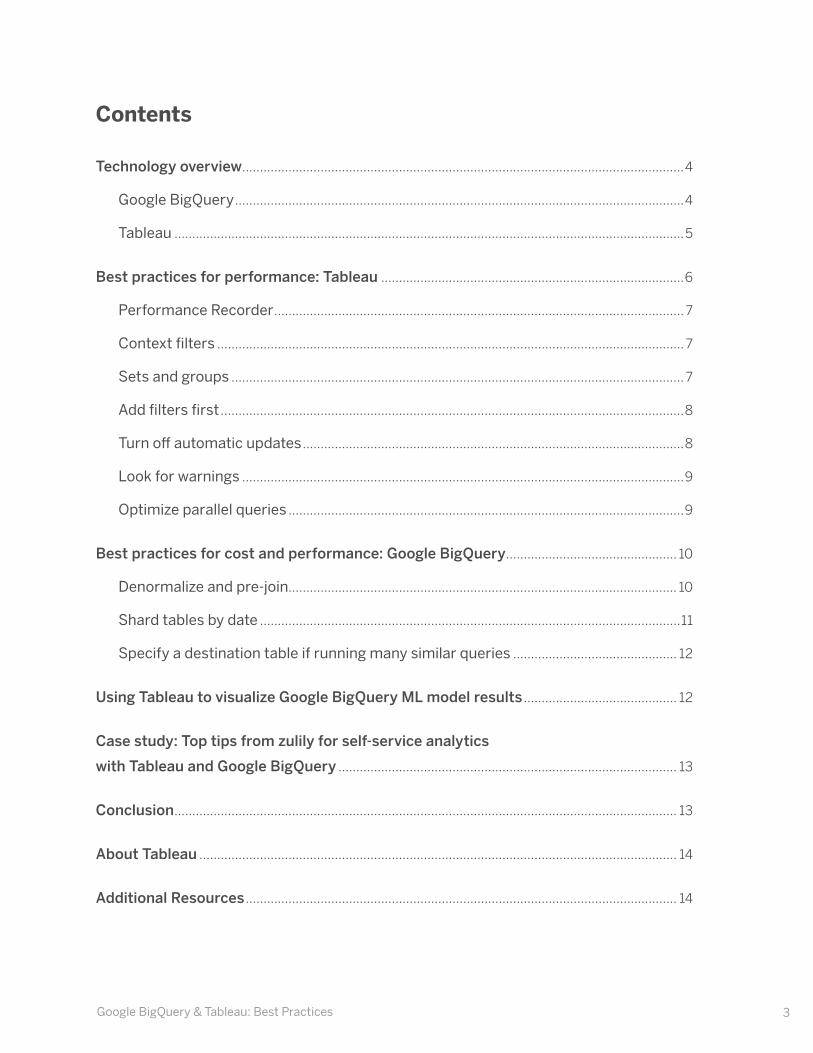
Contents
Technology overview ............................................................................................................................4
Google BigQuery ..............................................................................................................................4
Tableau ...............................................................................................................................................5
Best practices for performance: Tableau .....................................................................................6
Performance Recorder ................................................................................................................... 7
Context filters ................................................................................................................................... 7
Sets and groups ............................................................................................................................... 7
Add filters first ..................................................................................................................................8
Turn off automatic updates ...........................................................................................................8
Look for warnings ............................................................................................................................9
Optimize parallel queries ...............................................................................................................9
Best practices for cost and performance: Google BigQuery ................................................ 10
Denormalize and pre-join............................................................................................................. 10
Shard tables by date ......................................................................................................................11
Specify a destination table if running many similar queries .............................................. 12
Using Tableau to visualize Google BigQuery ML model results ........................................... 12
Case study: Top tips from zulily for self-service analytics
with Tableau and Google BigQuery ............................................................................................... 13
Conclusion ............................................................................................................................................. 13
About Tableau ...................................................................................................................................... 14
Additional Resources ......................................................................................................................... 14
4Google BigQuery & Tableau: Best Practices
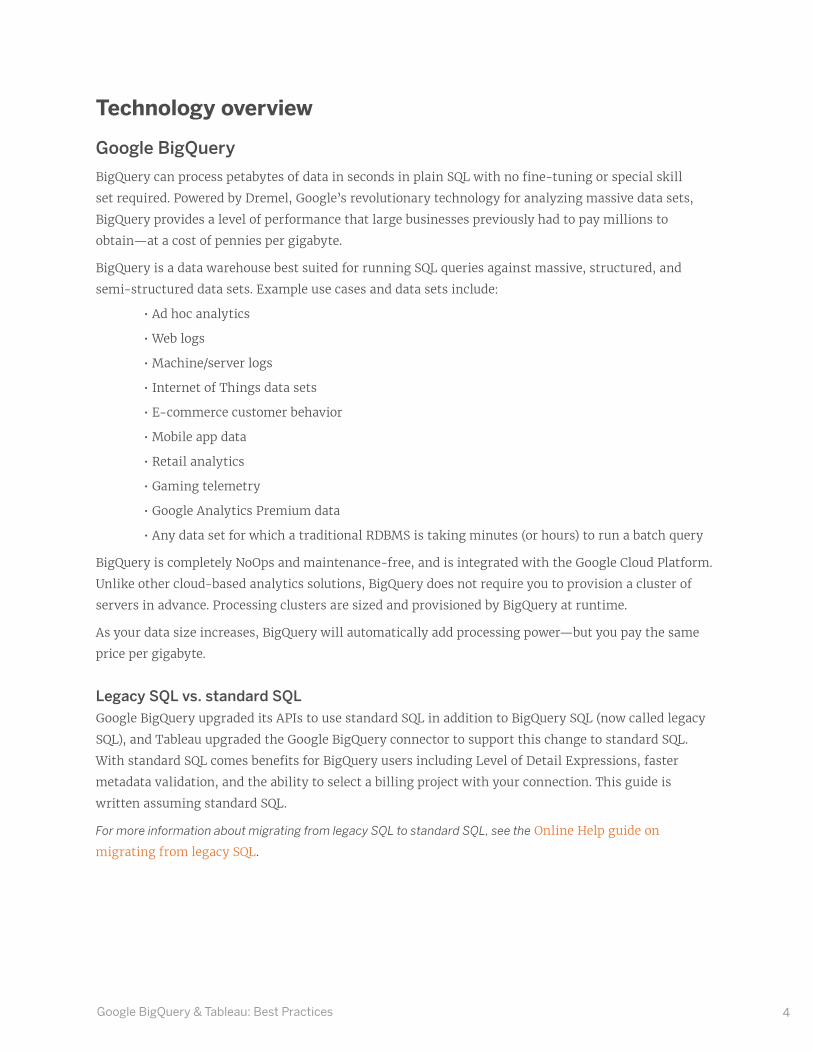
Technology overview
Google BigQuery
BigQuery can process petabytes of data in seconds in plain SQL with no fine-tuning or special skill
set required. Powered by Dremel, Google’s revolutionary technology for analyzing massive data sets,
BigQuery provides a level of performance that large businesses previously had to pay millions to
obtain—at a cost of pennies per gigabyte.
BigQuery is a data warehouse best suited for running SQL queries against massive, structured, and
semi-structured data sets. Example use cases and data sets include:
• Ad hoc analytics
• Web logs
• Machine/server logs
• Internet of Things data sets
• E-commerce customer behavior
• Mobile app data
• Retail analytics
• Gaming telemetry
• Google Analytics Premium data
• Any data set for which a traditional RDBMS is taking minutes (or hours) to run a batch query
BigQuery is completely NoOps and maintenance-free, and is integrated with the Google Cloud Platform.
Unlike other cloud-based analytics solutions, BigQuery does not require you to provision a cluster of
servers in advance. Processing clusters are sized and provisioned by BigQuery at runtime.
As your data size increases, BigQuery will automatically add processing power—but you pay the same
price per gigabyte.
Legacy SQL vs. standard SQLGoogle BigQuery upgraded its APIs to use standard SQL in addition to BigQuery SQL (now called legacy
SQL), and Tableau upgraded the Google BigQuery connector to support this change to standard SQL.
With standard SQL comes benefits for BigQuery users including Level of Detail Expressions, faster
metadata validation, and the ability to select a billing project with your connection. This guide is
written assuming standard SQL.
For more information about migrating from legacy SQL to standard SQL, see the Online Help guide on
migrating from legacy SQL.
5Google BigQuery & Tableau: Best Practices
Tableau
Tableau helps people to see and understand data. Our modern analytics platform, based on
technology developed at Stanford University, puts the power of data into the hands of everyday
people. This allows a broad population of users to engage with their data, ask questions, solve
problems, share insights, and create transformative value. Whether or not users comfortable with
traditional BI tools, people quickly learn to leverage Tableau to create and explore rich, interactive
visualizations and powerful dashboards with an intuitive, drag-and-drop user interface.
More recently, we’ve extended the capabilities of the Tableau platform to include visual, direct, and
smart data preparation capabilities, and the ability to query published data sources with natural
language.
Tableau native optimizations
Data source connector — Tableau has a native, optimized connector to Google BigQuery that
supports both live data connectivity and in-memory extracts. Tableau’s data blending allows users
to mash up data from BigQuery with data from any of our 67 other supported data sources. For
visualizations published to the cloud using Tableau Server or Tableau Online, direct connectivity to
Google BigQuery can be maintained.
Parallel queries — Tableau will take advantage of the capability of Google BigQuery and other
data sources to execute multiple queries at the same time for a total of up to 16 concurrent queries.
Batches of independent and de-duplicated queries are grouped together and sent to BigQuery if
the result is not already cached. Users should expect to see large performance gains due to parallel
queries because of BigQuery’s scale-out architecture.
Query fusion — Tableau will take multiple queries from workbooks and dashboards and fuse them
together when possible, reducing the number of queries sent to BigQuery. First, Tableau identifies
similar queries, excluding differences in the columns that are returned. Then, it combines queries
where the differences are only the level of aggregation or a user calculation.
External query cache — If the underlying data source hasn’t changed since the last time you ran
the same query, Tableau will automatically read from the previously saved query cache, providing
nearly instantaneous load times.
On-demand connections in Tableau Desktop — When you open a published workbook, Tableau
Desktop only connects to the data sources required to display the current sheet’s data. In other
words, you’ll see your data faster.

6Google BigQuery & Tableau: Best Practices
Best practices for performance: TableauBefore we get into additional tools and custom settings, our first recommendation is to continue
to update your Tableau deployment when you can. This way, you can take advantage of the
performance improvements we continue to introduce to the latest versions of the product.
Performance RecorderPerformance Recorder is a powerful built-in tool that allows you to pinpoint slow queries and
optimize your workbooks for maximum performance. It does this by tracking the elapsed time for
an individual workbook to execute a query and compute the layout. Hovering over one of the green
bars below will show the user the query that’s being generated against BigQuery. After identifying
a slow query, you can often resolve the performance issue by revisiting your data model.
In the Timeline view, the Workbook, Dashboard, and Worksheet columns identify the context for events.
Events with longer durations can help you identify where to look first if you want to speed up your workbook.
For more information on how to create or interpret a performance recording, visit the following:
Performance Recorder on Tableau Desktop (Create)
Performance Recorder on Tableau Server (Interpret)
7Google BigQuery & Tableau: Best Practices
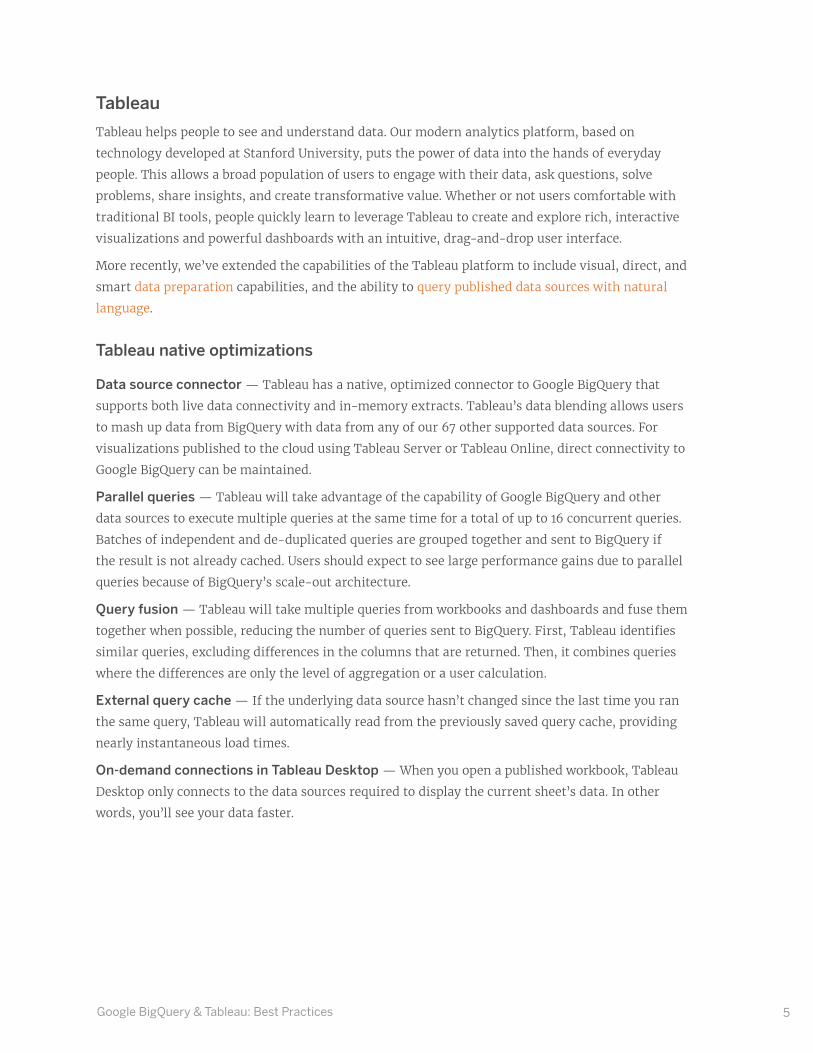
Context filters
If you are applying filters to a large data source, you can improve performance by setting up context filters.
A context filter is applied to the data source first, so that additional filters are applied only to the resulting
records. This sequence avoids applying each filter to each record in the data source.
If you are setting filters that significantly reduce the size of the data set and will use those filters for more
than several data views, then you should set those filters as context filters.
For more information, refer to our Online Help guide on improving view performance with context filters.
You can set one or more context filters to improve performance.
Aggregate measures
If the views you create are slow, make sure you are working with aggregated measures rather than
disaggregated measures. When views are slow, it usually means you are trying to view many rows of data at
once. You can reduce the number of rows by aggregating the data.
See if measures are aggregated in the Analysis menu. You can also set default aggregations for measures.
For more information, refer to our Online Help guide on data aggregation.

8Google BigQuery & Tableau: Best Practices
Sets and groups
If you want to filter a dimension to remove members based on a range of measure values, you should
create a set rather than using a quantitative filter. For instance, you can create a set that only returns the
top 50 items in a dimension, rather than all of the items in a dimension.
When creating a group from a selection, make sure you’ve included only the columns of interest. Each
additional column included in the set will result in decreased performance.
When you create groups in Tableau, you have the option to group all remaining members in an Other group.
For more information, refer to our Online Help guide on creating sets and our Online Help guide on creating
groups.
Add filters first
If you are working with a large data source and have automatic updates turned off, it is possible to create
a really slow query when adding filters to the view. Rather than build the view and then specify filters,
you should first specify the filters and then drag fields to the view. That way, when you run the update or
turn on automatic updates, the filters will be evaluated first.
9Google BigQuery & Tableau: Best Practices
Turn off automatic updates
When you place a field on a shelf, Tableau generates the view by automatically querying the data source.
If you are creating a dense data view, the queries might be time consuming and significantly degrade
system performance. In this case, you can instruct Tableau to turn off queries while you build the view.
You can then turn queries back on when you are ready to see the result.
Refer to our Online Help guide on automatic updates and performance for more information.
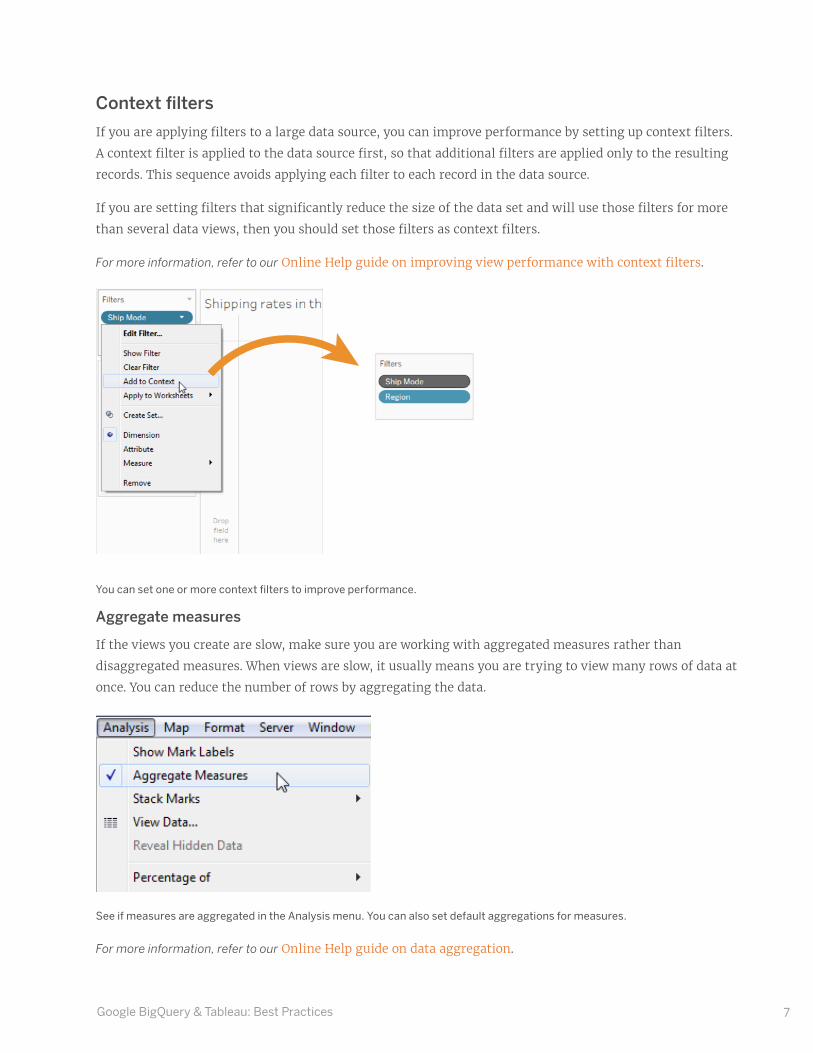
Look for warnings
Tableau displays a performance warning dialog box when you attempt to place a large dimension (with
many members) on any shelf. The dialog box provides four choices as shown in the figure below. If you
choose to add all members, you might experience a significant degradation in performance.
Tableau will warn when performance is at risk from placing a large dimension on a shelf.
10Google BigQuery & Tableau: Best Practices
Optimize parallel queries
You can use customization attributes to improve the performance of large result sets returned from
BigQuery to Tableau Online and Tableau Server, and on Tableau Desktop, by configuring parallel queries.
These customization attributes can be included in your published workbook or data source, as long as you
specify the attributes before you publish the workbook or data source to Tableau Online or Tableau Server.
For more information, refer to “Use customization attributes to improve query performance” in our Online Help
guide for Google BigQuery.
Best practices for cost and performance: Google BigQueryFor high performance querying and reduced costs, it is generally best to avoid using federated tables
where the data is in an external data source like Google Cloud Storage. In such cases, if you are looking
to perform iterative querying on the data set, you should use the Query API to materialize the data in
BigQuery (independent of Tableau) to enable high performance querying on the dataset with Tableau.
Denormalize and pre-join
BigQuery supports very large joins, and join performance is very good. That being said, BigQuery is a
Columnar Datastore, and maximum performance is achieved on denormalized data sets.
One benefit to the cloud is the ability to decouple storage and compute resources, allowing users to scale
and pay for each independently. Because BigQuery storage is very inexpensive and scalable, it is often
prudent to denormalize and pre-join data sets into homogeneous tables. In essence, this means you
will use fewer compute resources, but more storage resources (the latter being more performant and
cost-effective). Since BigQuery is a columnar store and can compress data well, decreasing compute for
increased storage is not a bad choice, and likely less costly.
BigQuery is an excellent ETL tool, allowing you to execute massive transforms and pipelines quickly and
efficiently. Be sure to enable “allow large results” when materializing data sets larger than 128 MB.
For more information on how to prepare data for loading and how to query data using BigQuery’s SQL dialect visit
the following:
Loading denormalized, nested, and repeated data
Writing large query results
11Google BigQuery & Tableau: Best Practices
Shard tables by date
Dividing a table into smaller partitions—“sharding”—can help to simplify data management and improve
query performance and costs. Furthermore, BigQuery supports clustering over a partitioned table, which
is useful if data is already partitioned on a date or timestamp column, or you have filters or aggregation
against particular columns in your queries.
Some data naturally lends itself to being partitioned by date: for example, log data, or any data for which
the records include a monotonically increasing timestamp. In this case, shard your BigQuery tables by
date and include the date in the table name. To take advantage of this, you would need to leverage custom
SQL in Tableau.
For more information see our Online Help guide on connecting to a custom SQL query.
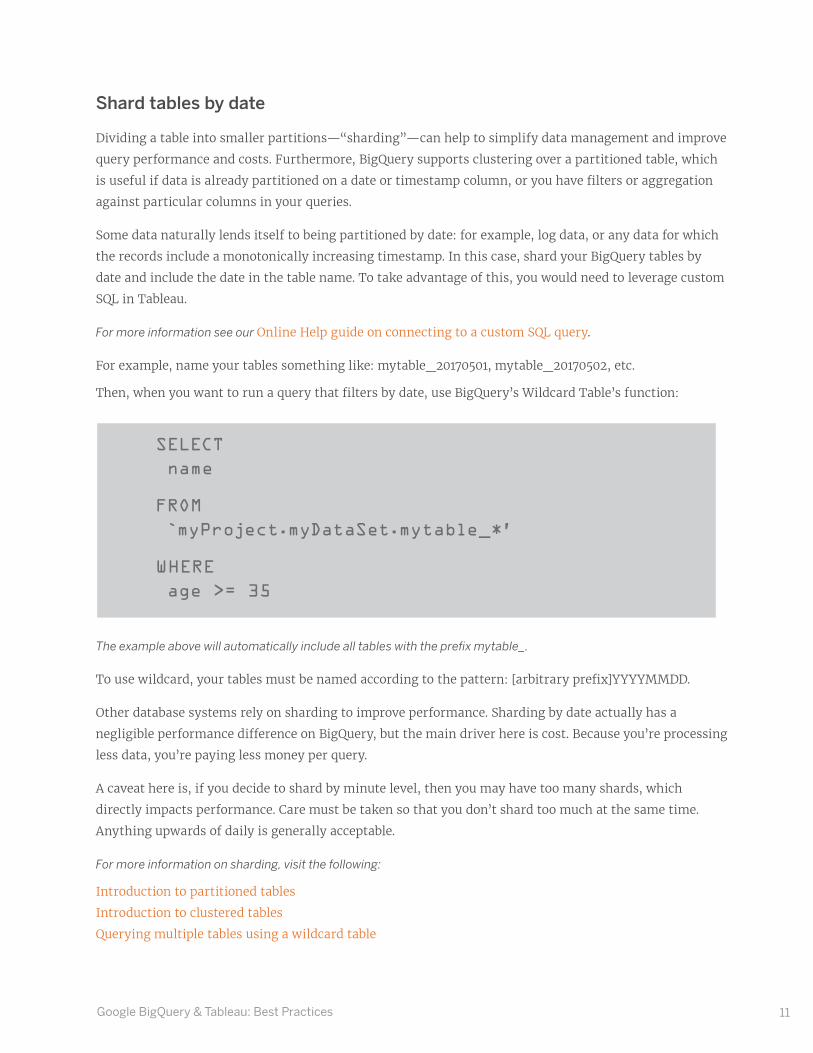
For example, name your tables something like: mytable_20170501, mytable_20170502, etc.
Then, when you want to run a query that filters by date, use BigQuery’s Wildcard Table’s function:
SELECT
name
FROM
`myProject.myDataSet.mytable_*’
WHERE
age >= 35
The example above will automatically include all tables with the prefix mytable_.
To use wildcard, your tables must be named according to the pattern: [arbitrary prefix]YYYYMMDD.
Other database systems rely on sharding to improve performance. Sharding by date actually has a
negligible performance difference on BigQuery, but the main driver here is cost. Because you’re processing
less data, you’re paying less money per query.
A caveat here is, if you decide to shard by minute level, then you may have too many shards, which
directly impacts performance. Care must be taken so that you don’t shard too much at the same time.
Anything upwards of daily is generally acceptable.
For more information on sharding, visit the following:
Introduction to partitioned tables
Introduction to clustered tables
Querying multiple tables using a wildcard table

12Google BigQuery & Tableau: Best Practices
Specify a destination table if running many similar queries
While query caching is useful if you’re running many identical queries, it won’t help if you’re running
similar, but slightly different, queries (e.g., changing only the values in a WHERE clause between query
runs). In this case, run a query on your source table and write the records you will repeatedly query to a
new destination table. Then, run queries against the new destination table that you created.
For example, let’s say you plan to run three queries with three different WHERE clauses:
WHERE col1 = “a”
WHERE col1 = “b”
WHERE col1 = “c”
Run a query against your source table, and write the output records into a destination table:
SELECT col1
FROM source
WHERE col1 = “a” OR col1 = “b” OR col1 = “c”
By “OR”ing the WHERE clauses together, we capture all relevant records. Our new destination table is
potentially much smaller than the original source table. Since BigQuery charges based on the amount of
data processed in a query, running subsequent queries against the new destination table will save money
instead of running the queries directly against the source table. Care must be taken to clean up these
tables in the future so as to prevent storage cost accumulating for these tables.
Using Tableau to visualize Google BigQuery ML model resultsBigQuery ML allows users to use embedded machine learning technology to train models based on data
stored in BigQuery. However, just like working with any other data, directly querying a database isn’t
always the ideal method to explore the output of your model.
With its BigQuery connector, Tableau allows you to easily manipulate the results of your predictive
models in a way that facilitates an intuitive understanding of the data. Additionally, Tableau allows users
an easy way to share their model and its results with others so that they can benefit from all your work.
To see an example, read about using BigQuery ML with Tableau to predict housing prices.
While custom SQL is necessary in this exercise for invoking a machine learning algorithm in Google
BigQuery ML, there are performance considerations to be aware of when using custom SQL in lieu of
Tableau’s native connections in other scenarios. When possible, leverage Tableau’s native data source
connections for optimized performance.
For more information on creating and executing machine learning models using standard SQL queries, refer to the
Online Help guide for Google Big Query ML.
13Google BigQuery & Tableau: Best Practices
Case study: Top tips from zulily’s for self-service analytics with Tableau and Google BigQueryzulily is a fast-growing e-commerce company that built a big data platform using Google BigQuery as
the business data warehouse and Tableau for data access and visual analytics. Integrating BigQuery and
Tableau allows the analytics to move fast on acquiring, ingesting, and using data to build reports and
models without needing to involve IT in everyday activities. Additionally, business users have real-time
access to key data used to make decisions quickly, without needing to involve analysts to generate basic
insights.
Here are a few of zulily’s best practices:
Reduce latency by using Tableau Server on Google Compute Engine — Rather than a
traditional model where regions are separate VPCs, you can leverage Google’s private backbone without
going to the Internet—and without additional setup. This also lets you right-size your deployments
without having to over-provision.
Use Federated Sources and point Tableau at BigQuery — For data within Google Cloud, you
should take advantage of BigQuery’s ability to query external data sourcesand treat BigQuery as your data
lake. In certain scenarios, you reduce the amount of data that needs to be pushed over the network and
into Tableau for analysis.
Process large datasets with a live connection in BigQuery — Take advantage of BigQuery’s
ability to process large datasets and only bring results across the network. Set your default Tableau
connection against BigQuery as “Live” unless you have a specific reason to extract the data.
For more information and the full list of all 10 tips, read the two-part blog series:
Part One: Why zulily created a self-service marketing analytics platform with Tableau and
Google BigQuery
Part Two: zulily’s top 10 tips for self-service analytics with Google BigQuery and Tableau
ConclusionBy applying best practices, business users and data analysts alike will be able to maximize the
performance and responsiveness of Tableau visualizations built against Google BigQuery. When these
technologies are combined, users can truly visualize billions of rows of data at the speed of thought.

About Tableau
Tableau is a complete, easy-to-use, enterprise-ready visual business intelligence platform that
helps people see and understand data through rapid-fire, self-service analytics at scale. Whether
on-premises or in the cloud, on Windows or Linux, Tableau leverages your existing technology
investments and scales with you as your data environment shifts and grows. Unleash the power of
your most valuable assets: your data and your people.
Additional resources
Tableau free trial
Tableau Online Help guide: Google BigQuery
Tableau Server and Google Cloud Platform: rapid-fire business intelligence in the cloud
Tableau and Google solutions
Tableau and big data: an overview
Why business analytics in the cloud?
Designing efficient workbooks