google fusion tables
TRANSCRIPT
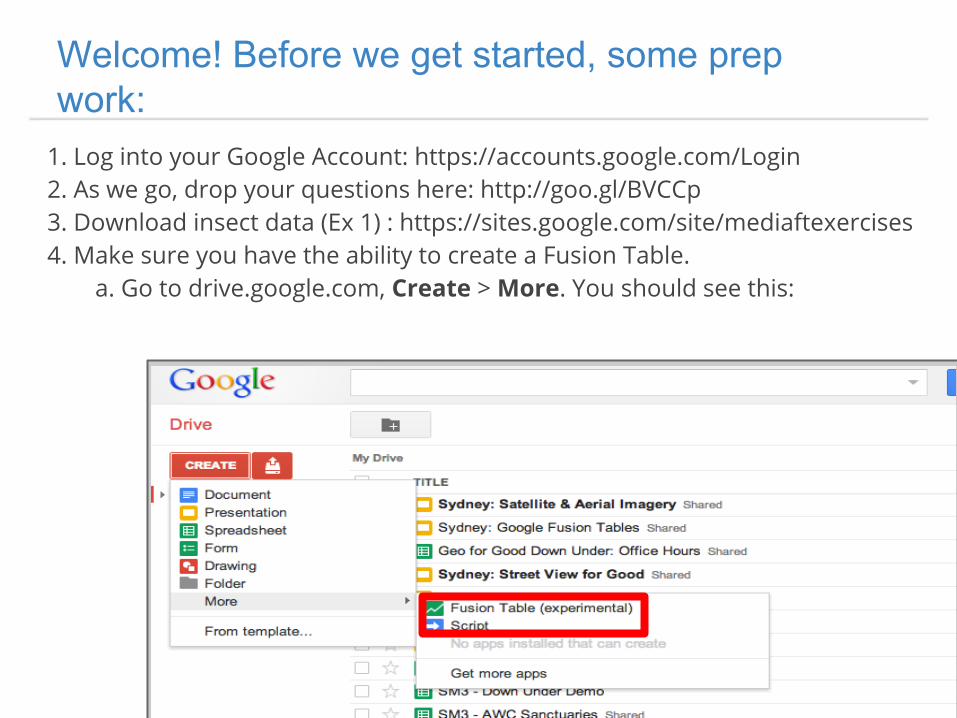
Welcome! Before we get started, some prep work:
1. Log into your Google Account: https://accounts.google.com/Login2. As we go, drop your questions here: http://goo.gl/BVCCp 3. Download insect data (Ex 1) : https://sites.google.com/site/mediaftexercises4. Make sure you have the ability to create a Fusion Table.
a. Go to drive.google.com, Create > More. You should see this:
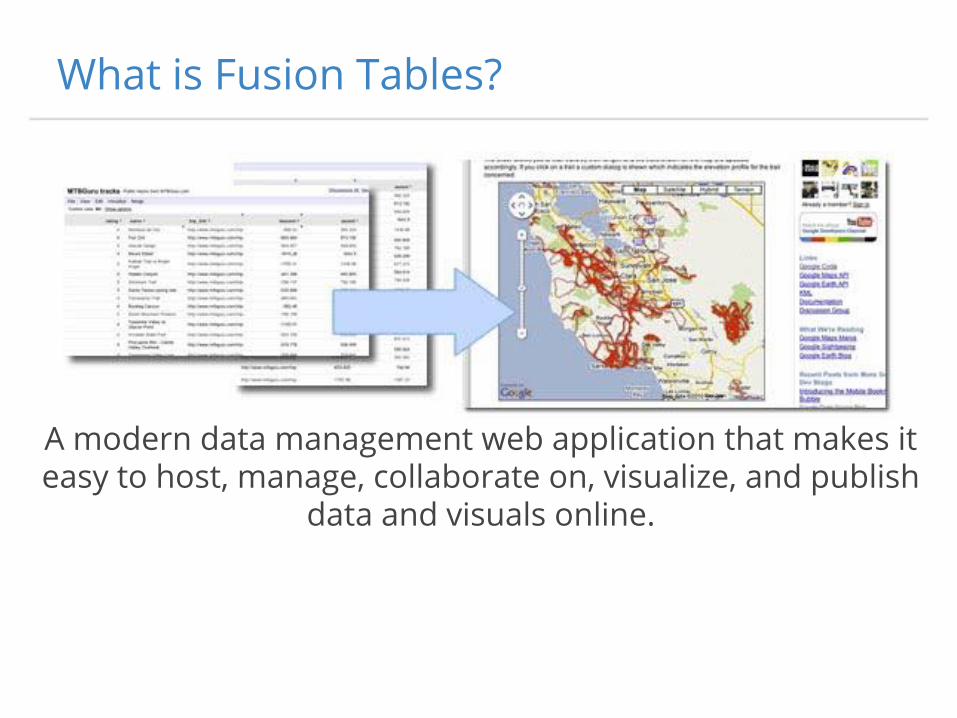
What is Fusion Tables?
A modern data management web application that makes it easy to host, manage, collaborate on, visualize, and publish
data and visuals online.
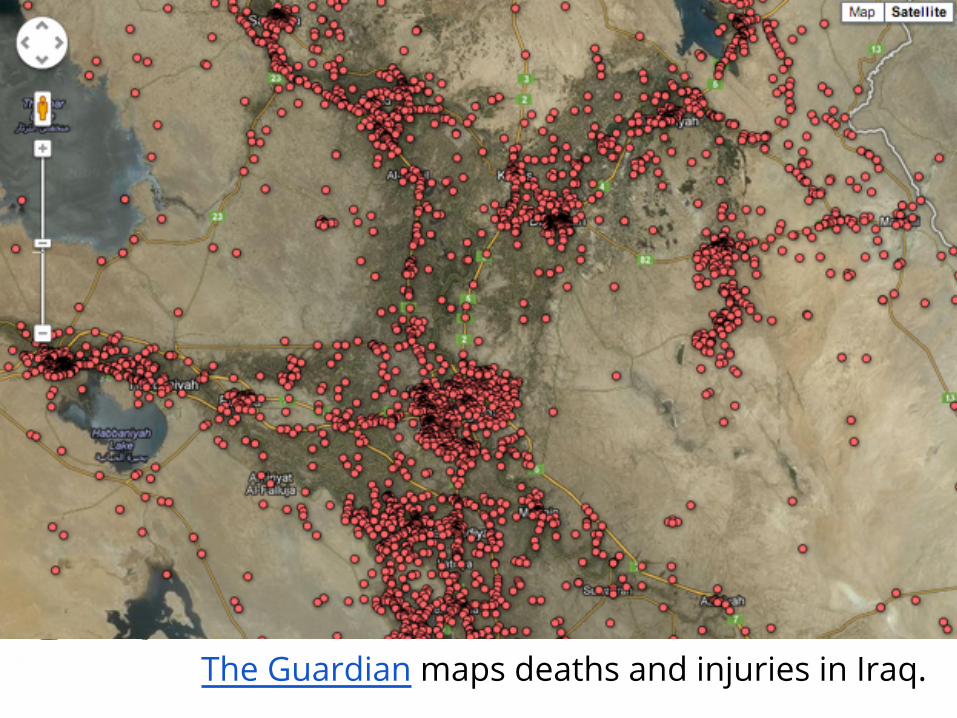
The Guardian maps deaths and injuries in Iraq.
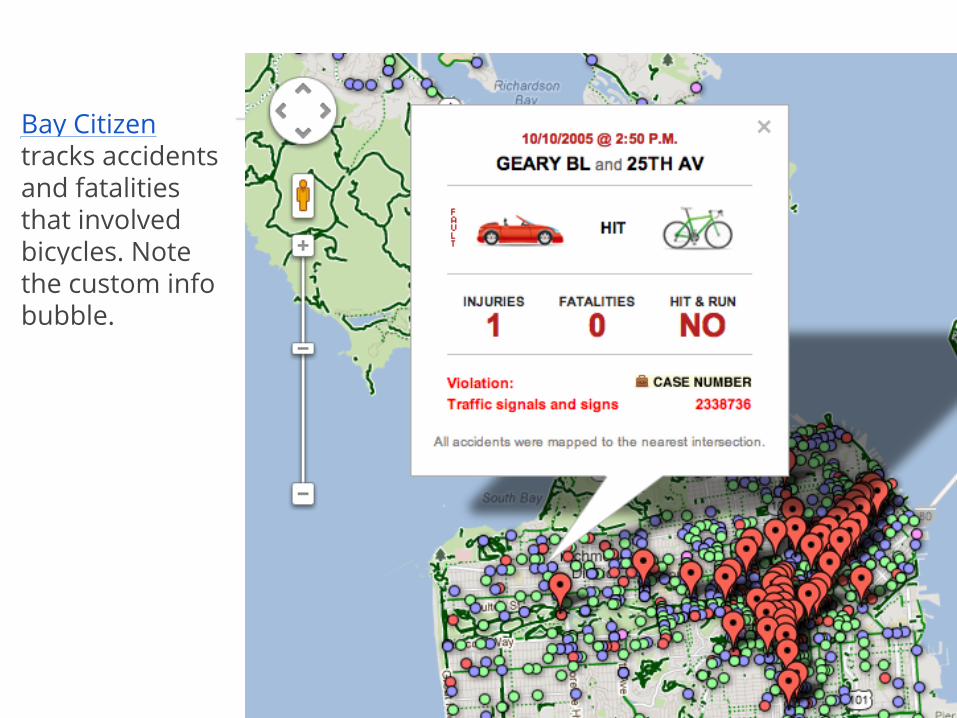
Bay Citizen tracks accidents and fatalities that involved bicycles. Note the custom info bubble.
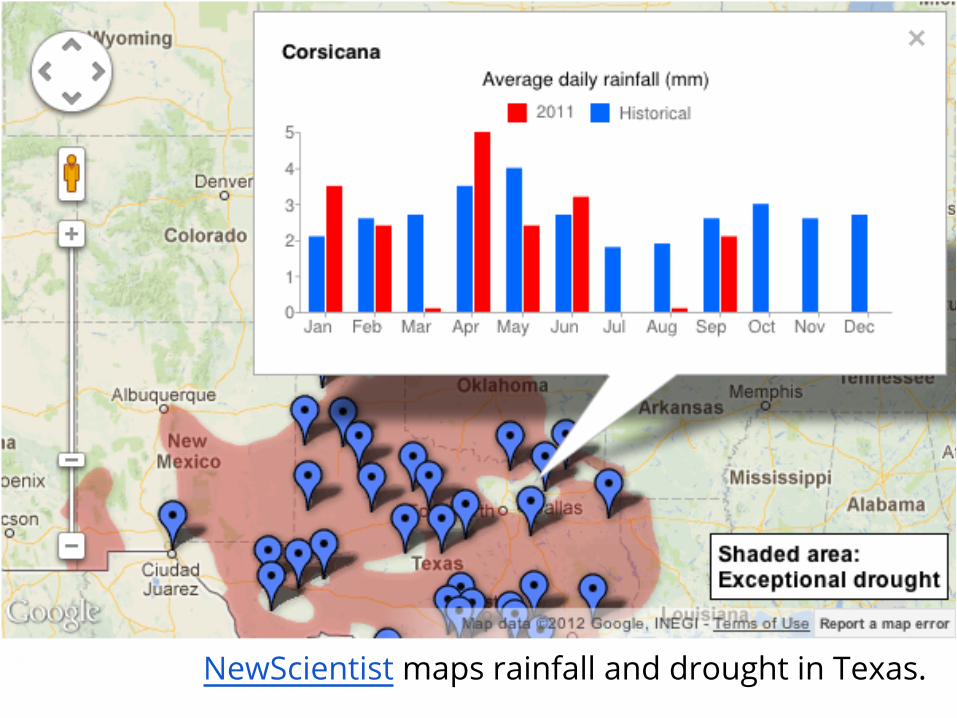
NewScientist maps rainfall and drought in Texas.
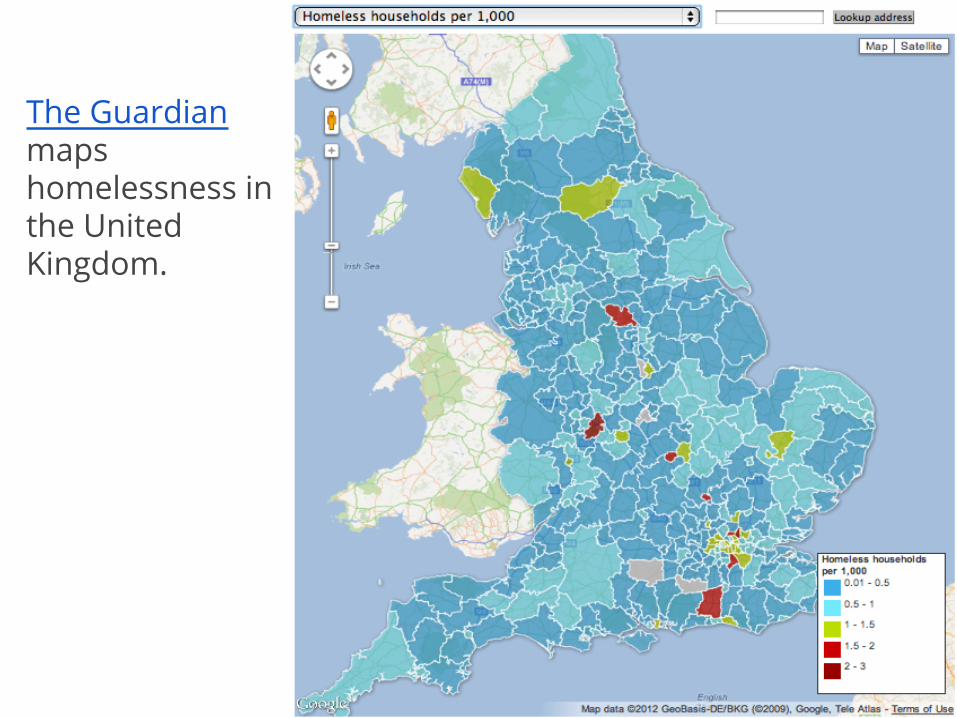
The Guardian maps homelessness in the United Kingdom.
What is Fusion Tables?
Lightweight database in the cloudManage a lot of data easilyOrganize table and geographic dataVisualize data as maps, charts, timelinesCollaborate with colleaguesNo offline access
Hands-on exercises
Import and map your dataStyle your map Filter your mapShare your Fusion Tables map Merge tablesCreate a custom intensity map Use FusionTablesLayer Wizard
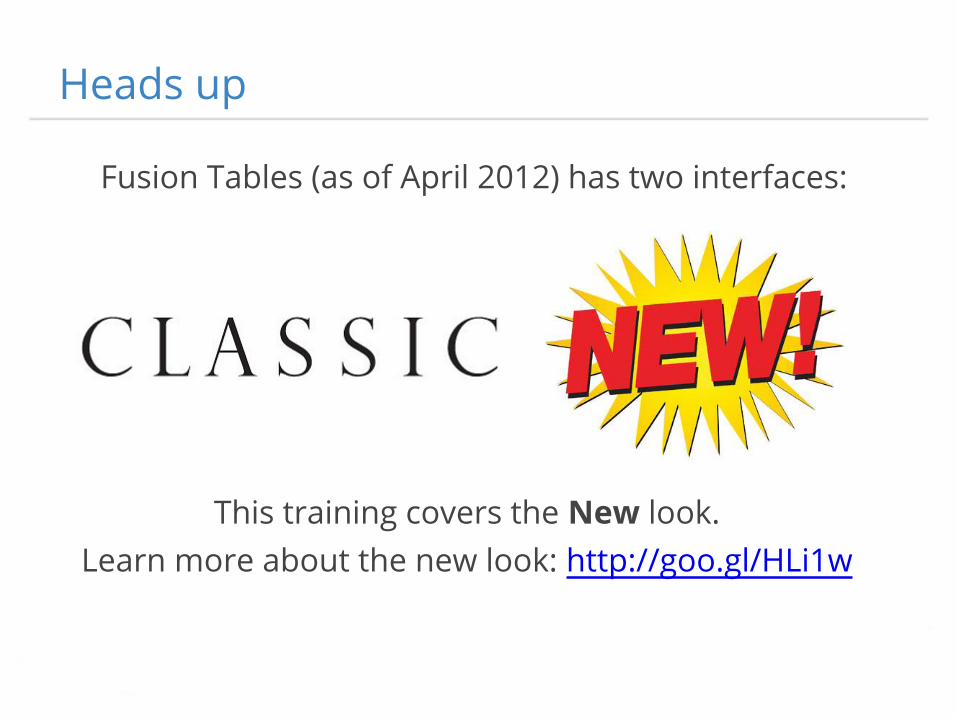
Heads up
Fusion Tables (as of April 2012) has two interfaces:
This training covers the New look. Learn more about the new look: http://goo.gl/HLi1w
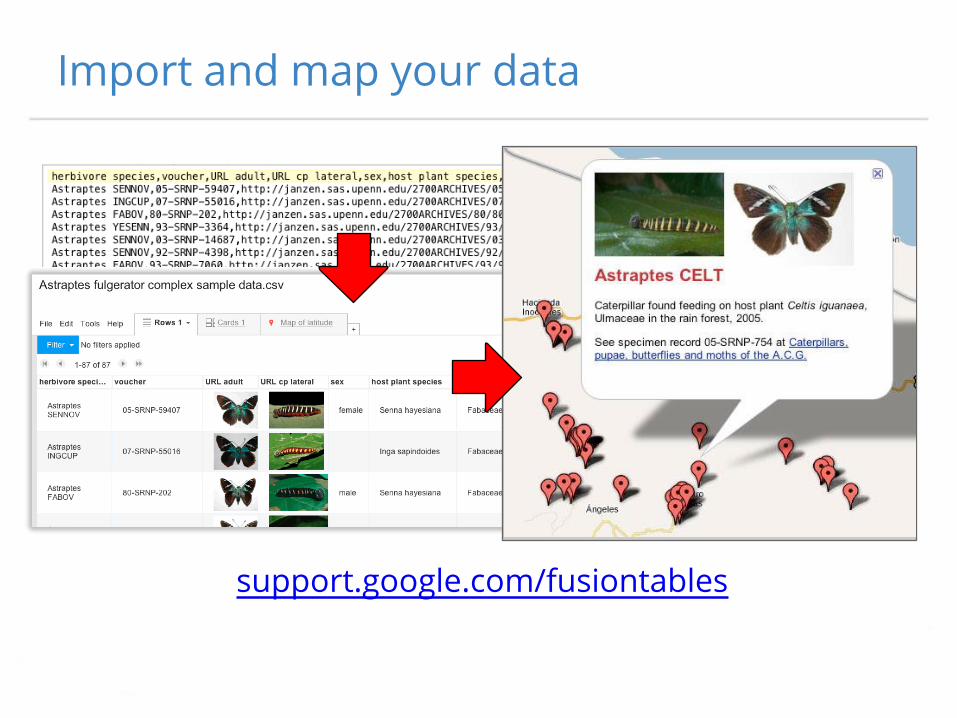
Import and map your data
support.google.com/fusiontables
File types and limits
You can import a file of up to 100 MB of these file types:● comma-separated text (.csv)● other text-delimited files (.tsv, etc)● KML (.kml)● spreadsheets (.xls, .xslx, .ods and Google Spreadsheets)
There are hard limits of 1,000 columns per table and 1MB of content per row. We support a quota of up to 250MB
per user.
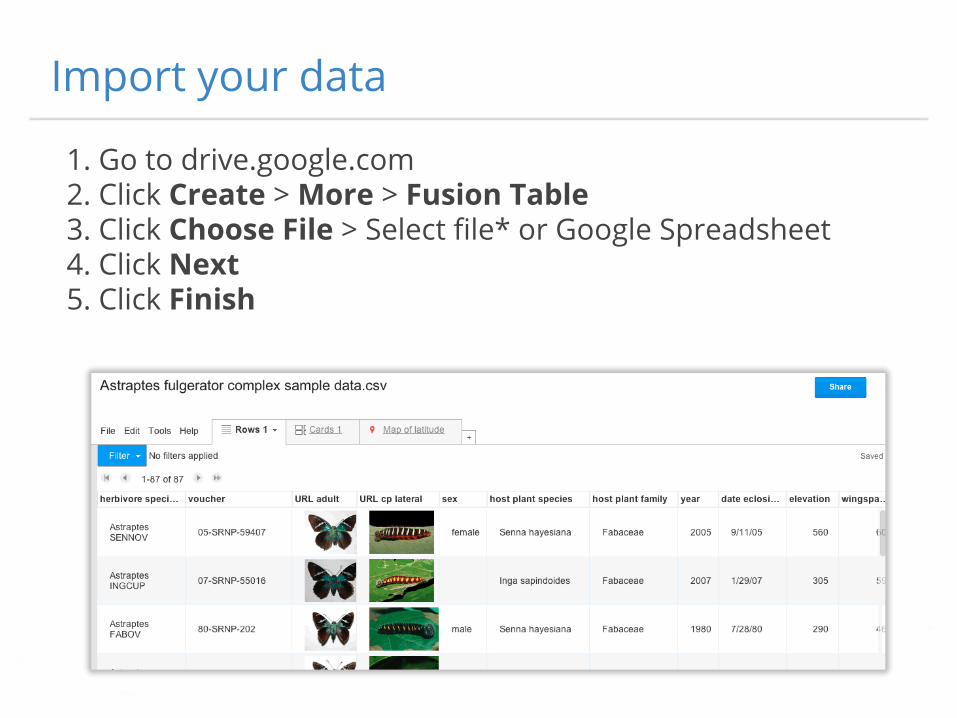
Import your data
1. Go to drive.google.com2. Click Create > More > Fusion Table3. Click Choose File > Select file* or Google Spreadsheet 4. Click Next 5. Click Finish
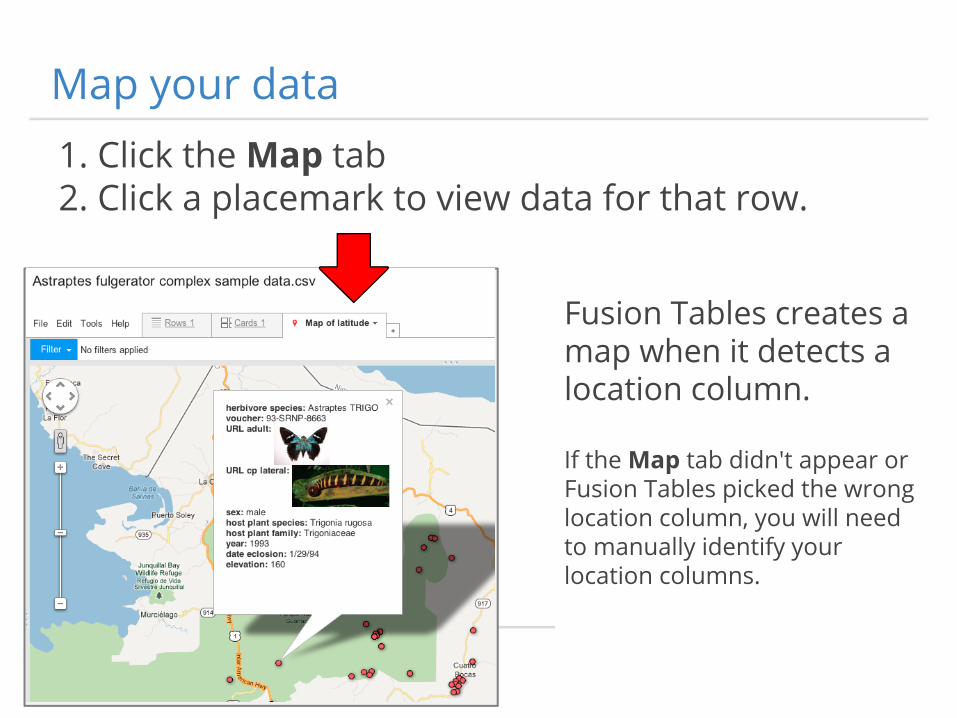
Map your data1. Click the Map tab 2. Click a placemark to view data for that row.
Fusion Tables creates a map when it detects a location column.
If the Map tab didn't appear or Fusion Tables picked the wrong location column, you will need to manually identify your location columns.
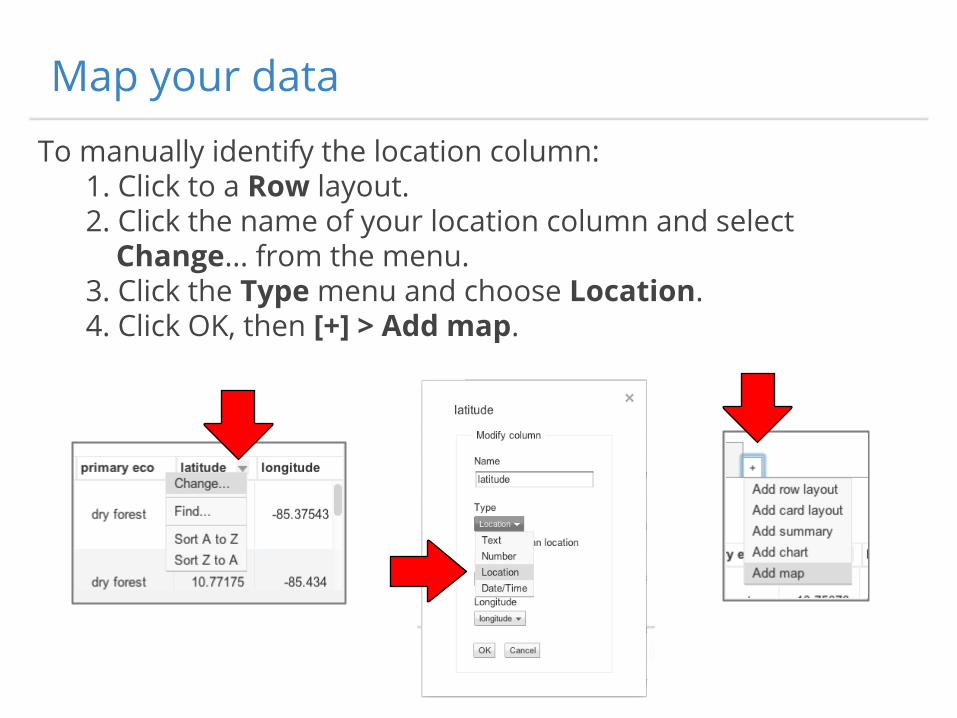
Map your data
To manually identify the location column:1. Click to a Row layout.2. Click the name of your location column and select Change... from the menu.3. Click the Type menu and choose Location.4. Click OK, then [+] > Add map.
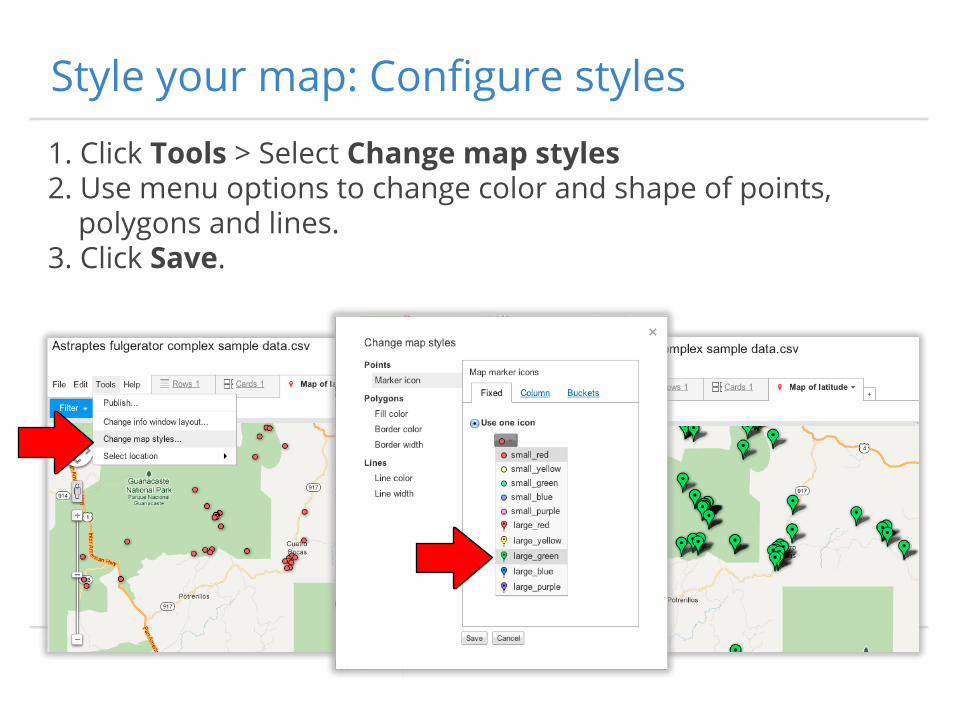
Style your map: Configure styles
1. Click Tools > Select Change map styles2. Use menu options to change color and shape of points, polygons and lines.3. Click Save.
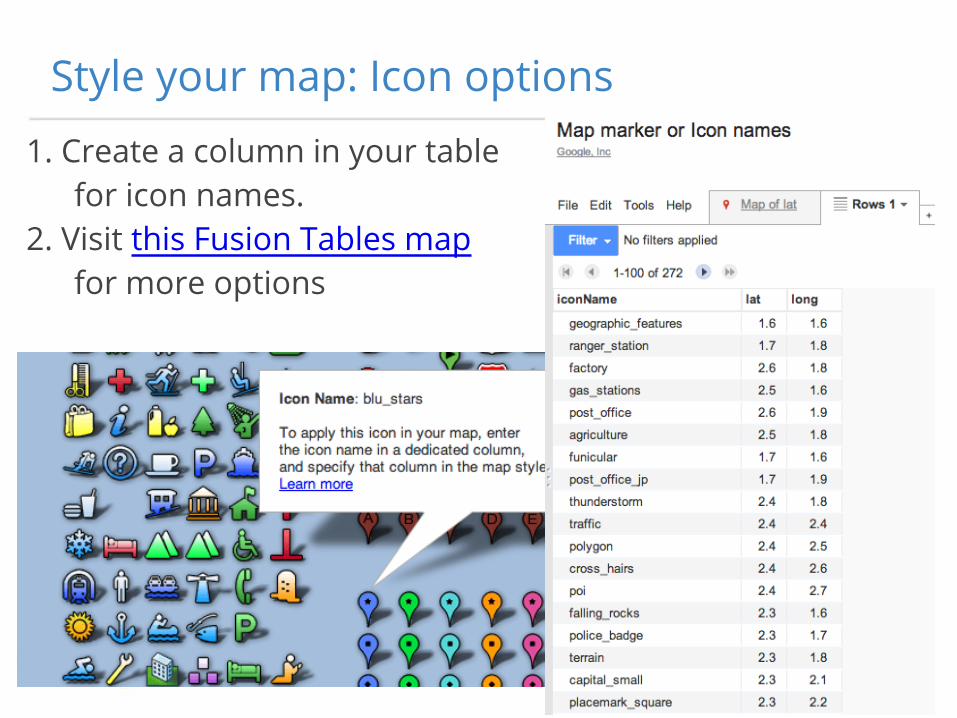
Style your map: Icon options
1. Create a column in your table for icon names.
2. Visit this Fusion Tables map for more options
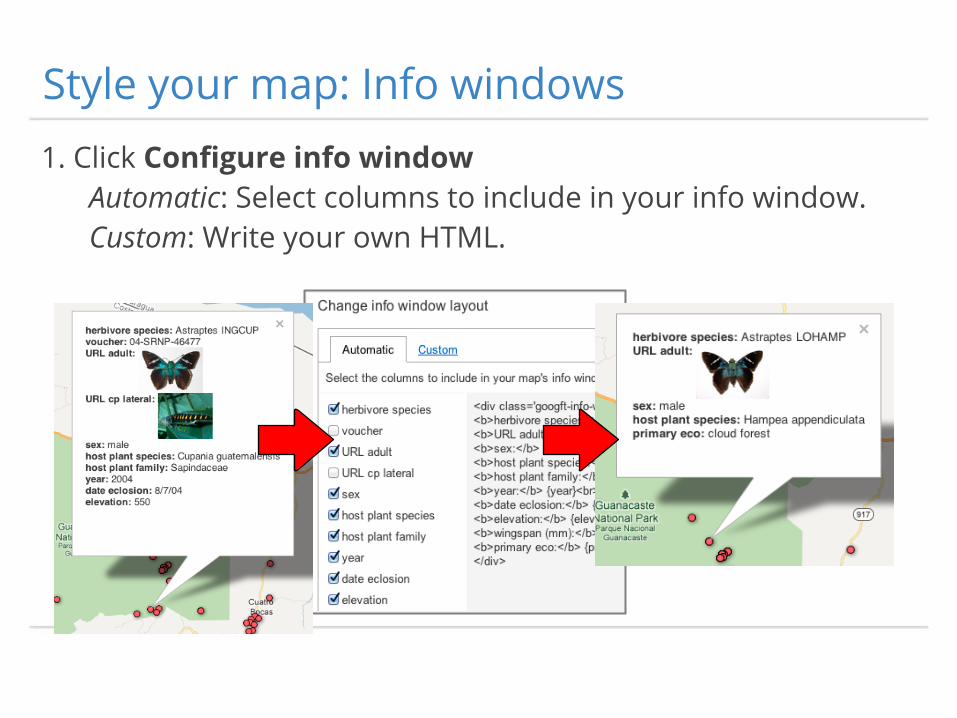
Style your map: Info windows1. Click Configure info window
Automatic: Select columns to include in your info window. Custom: Write your own HTML.
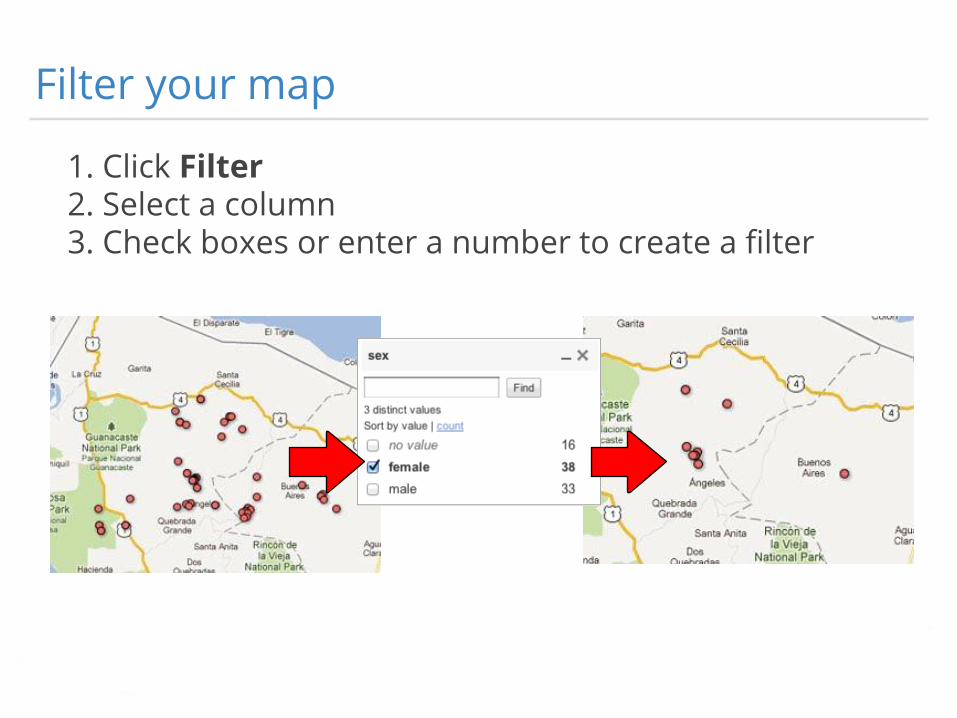
Filter your map
1. Click Filter 2. Select a column3. Check boxes or enter a number to create a filter
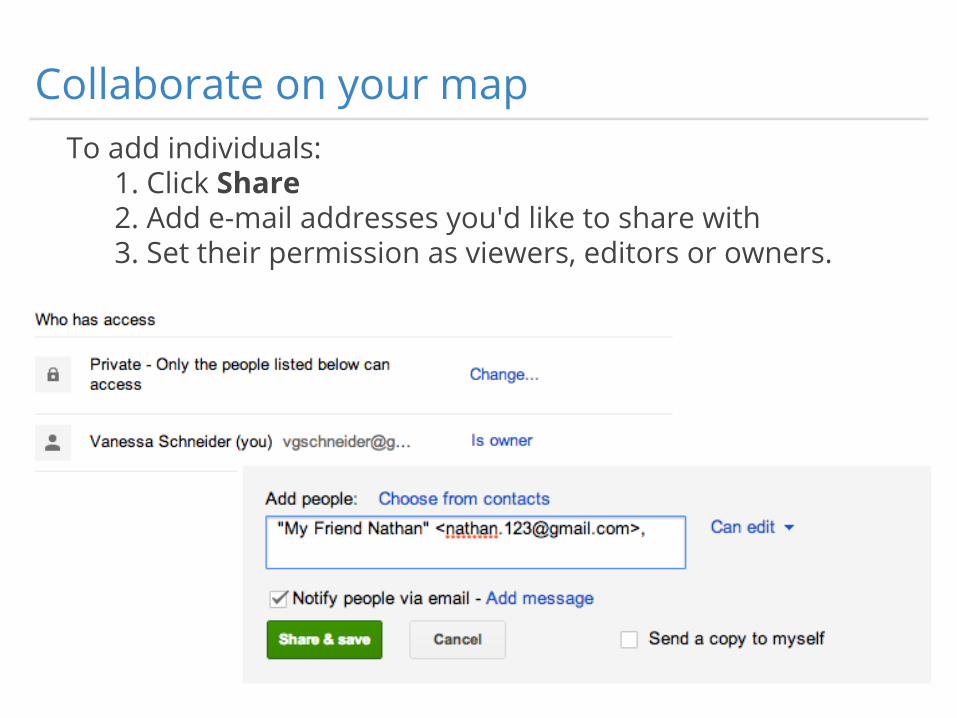
Collaborate on your mapTo add individuals:
1. Click Share2. Add e-mail addresses you'd like to share with 3. Set their permission as viewers, editors or owners.

Collaborate on your map
Make the map visible: 1. Click Share at upper right.2. Next to "Private", click the Change... link3. Select Public or Anyone with the link.*
Share a link to your table:1. Copy the URL from your browser.
*Your map must not require sign-in to view it if you want to embed it in a website or
create a network link for Google Earth.
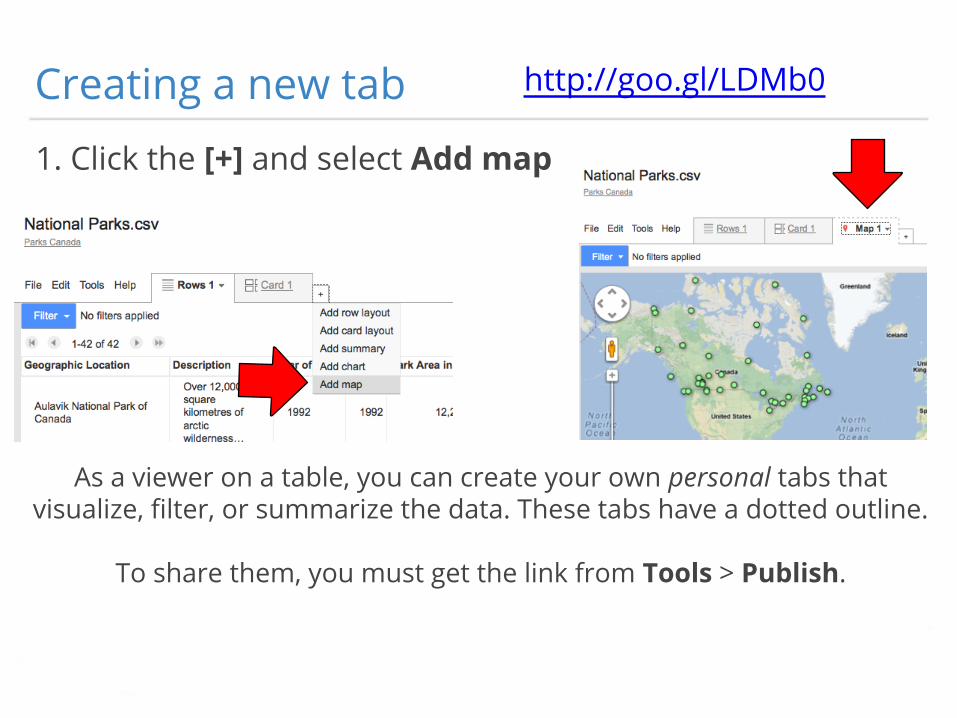
Creating a new tab
1. Click the [+] and select Add map
As a viewer on a table, you can create your own personal tabs that visualize, filter, or summarize the data. These tabs have a dotted outline.
To share them, you must get the link from Tools > Publish.
http://goo.gl/LDMb0
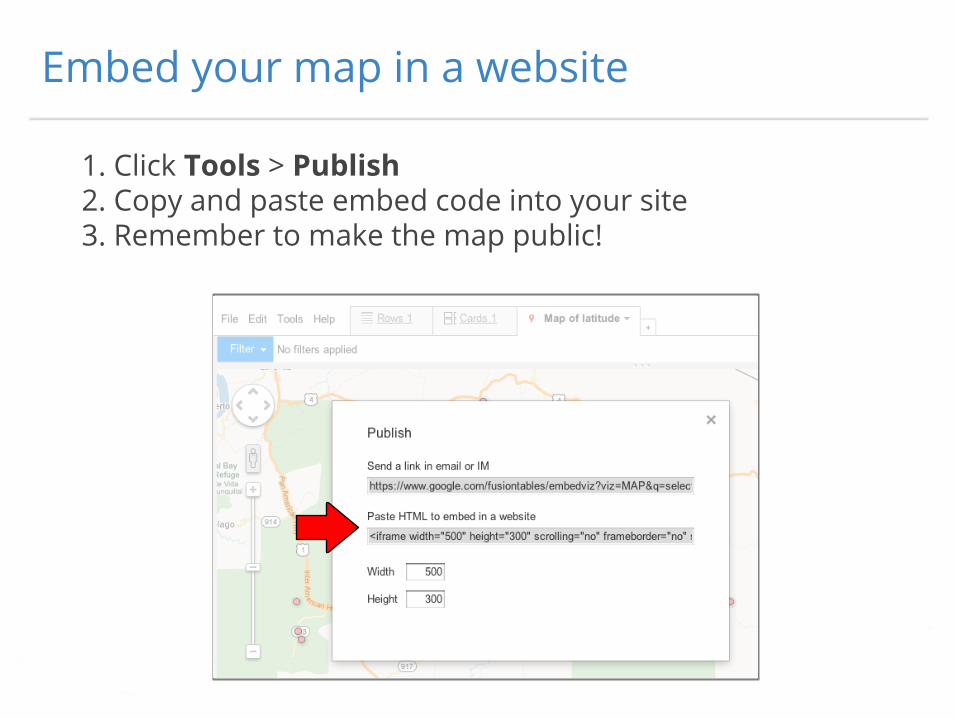
1. Click Tools > Publish2. Copy and paste embed code into your site3. Remember to make the map public!
Embed your map in a website
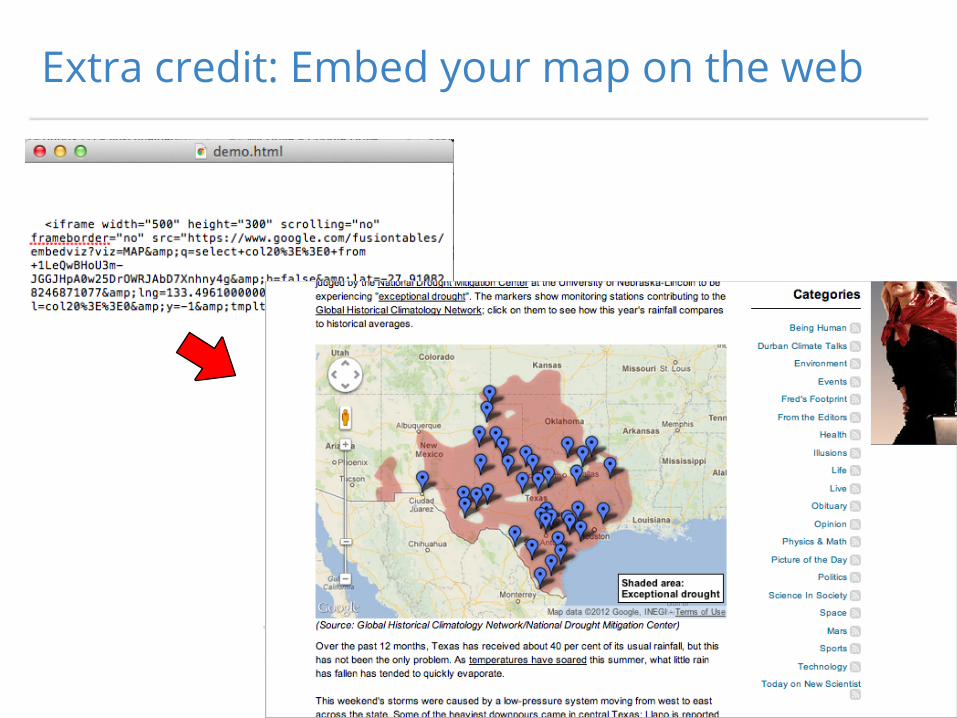
Extra credit: Embed your map on the web
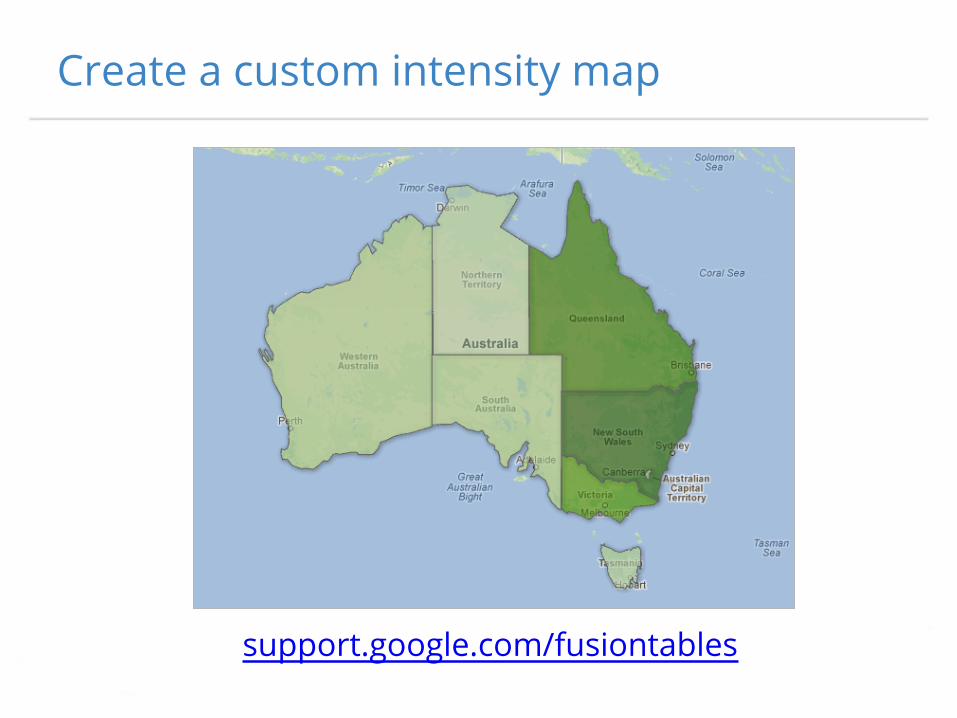
Create a custom intensity map
support.google.com/fusiontables
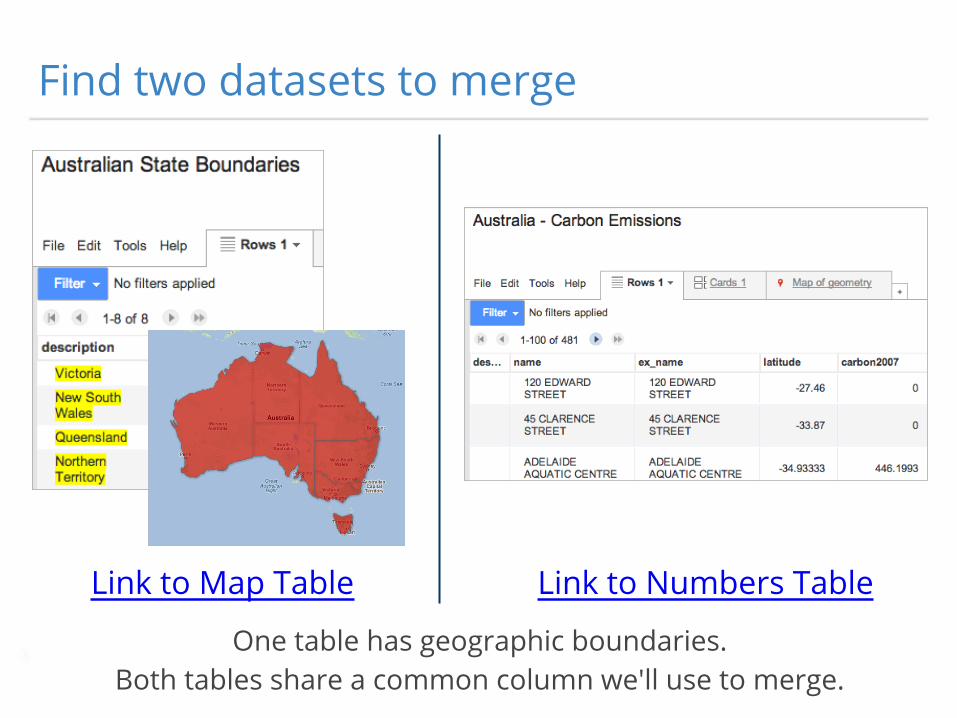
Find two datasets to merge
One table has geographic boundaries.Both tables share a common column we'll use to merge.
Link to Map Table Link to Numbers Table
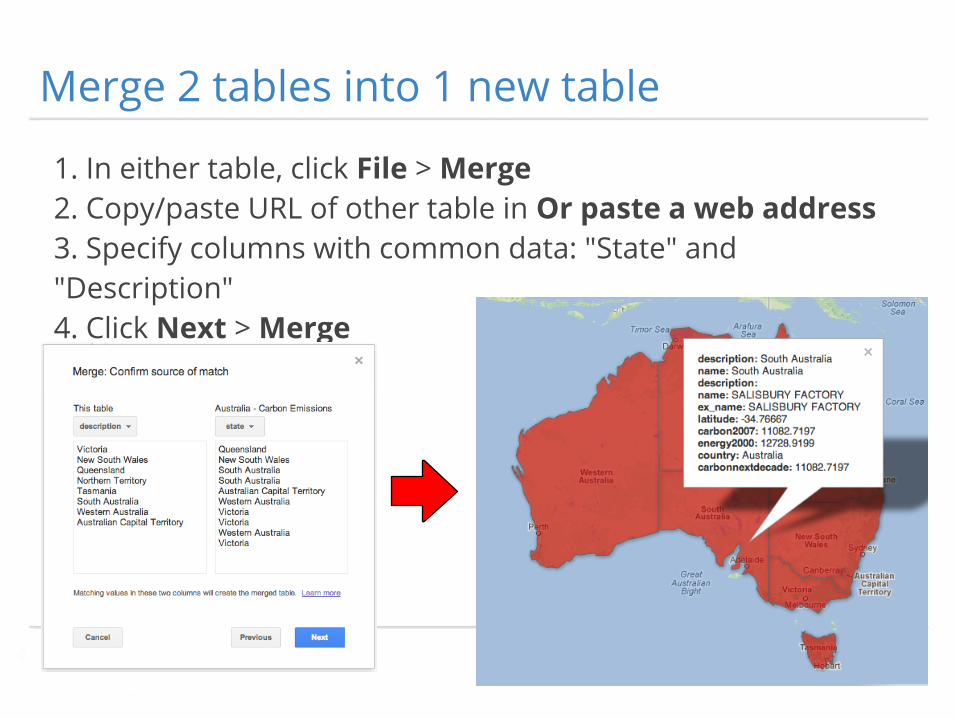
Merge 2 tables into 1 new table
1. In either table, click File > Merge2. Copy/paste URL of other table in Or paste a web address3. Specify columns with common data: "State" and "Description"4. Click Next > Merge
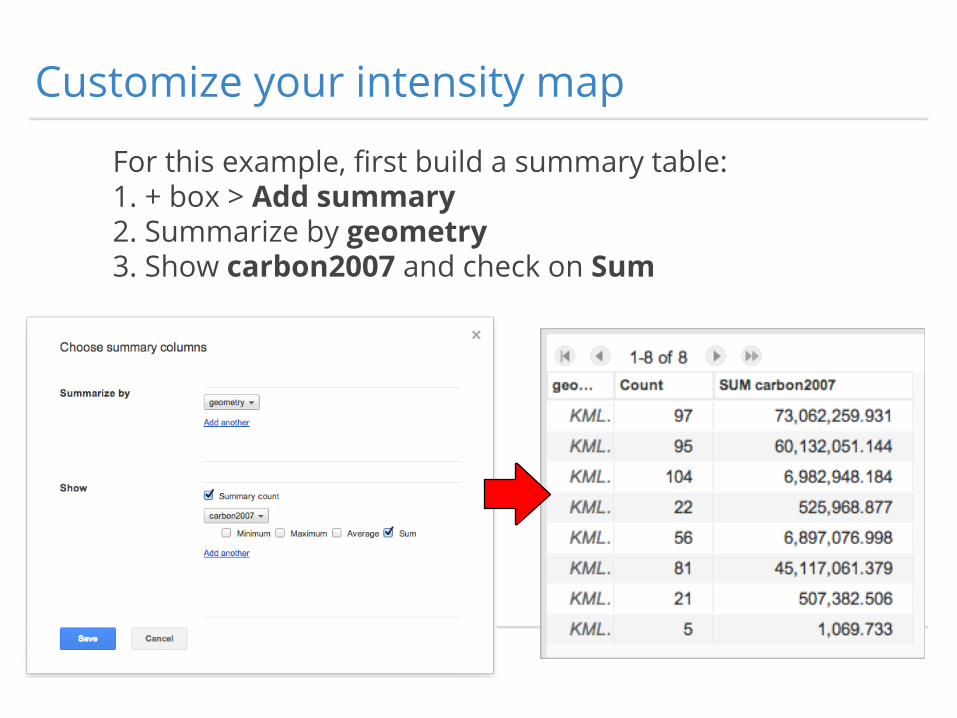
Customize your intensity map
For this example, first build a summary table:1. + box > Add summary 2. Summarize by geometry 3. Show carbon2007 and check on Sum
Customize your intensity map
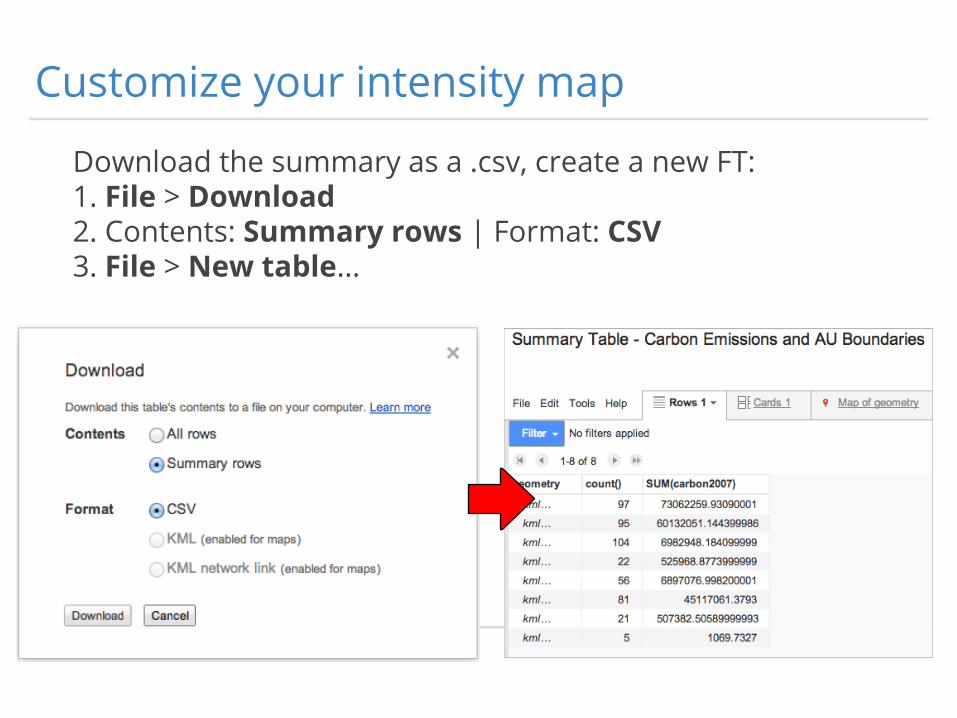
Download the summary as a .csv, create a new FT:1. File > Download 2. Contents: Summary rows | Format: CSV3. File > New table...
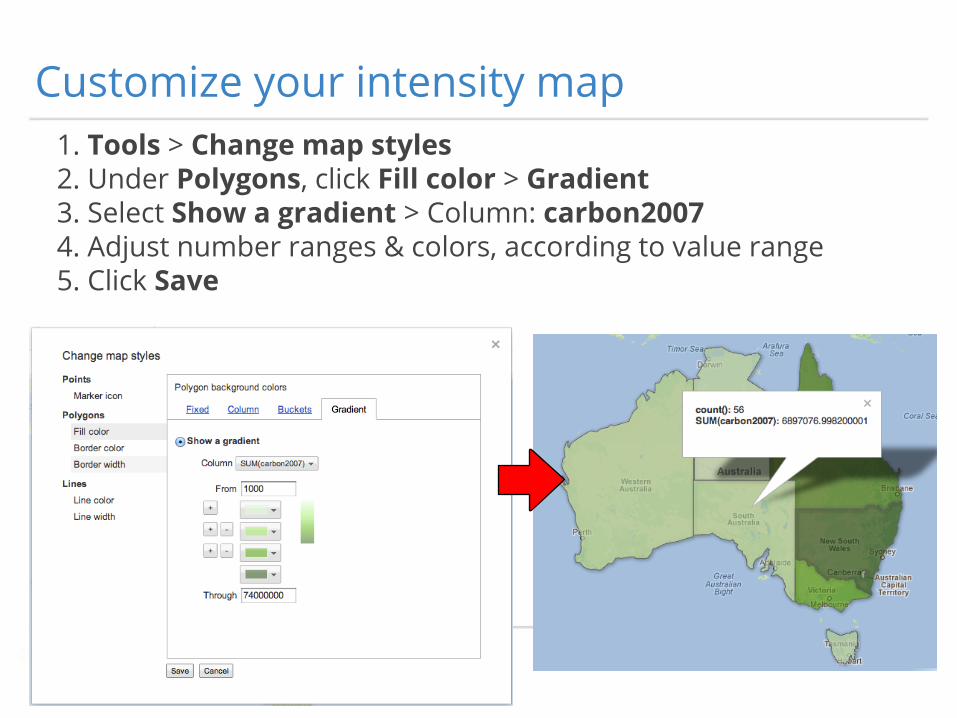
Customize your intensity map1. Tools > Change map styles2. Under Polygons, click Fill color > Gradient3. Select Show a gradient > Column: carbon20074. Adjust number ranges & colors, according to value range5. Click Save
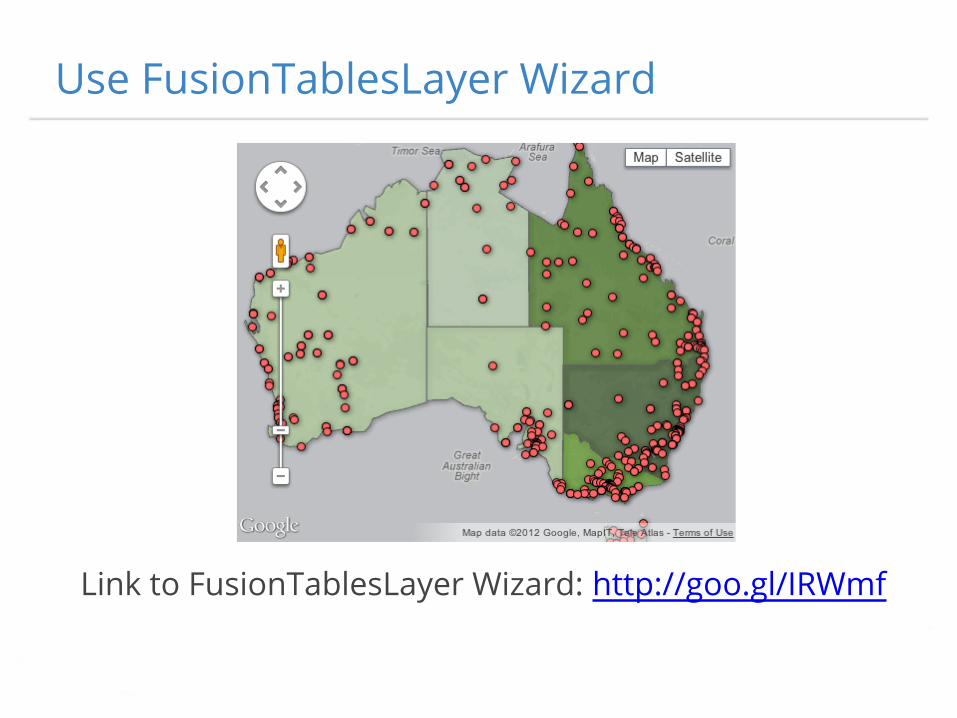
Use FusionTablesLayer Wizard
Link to FusionTablesLayer Wizard: http://goo.gl/IRWmf
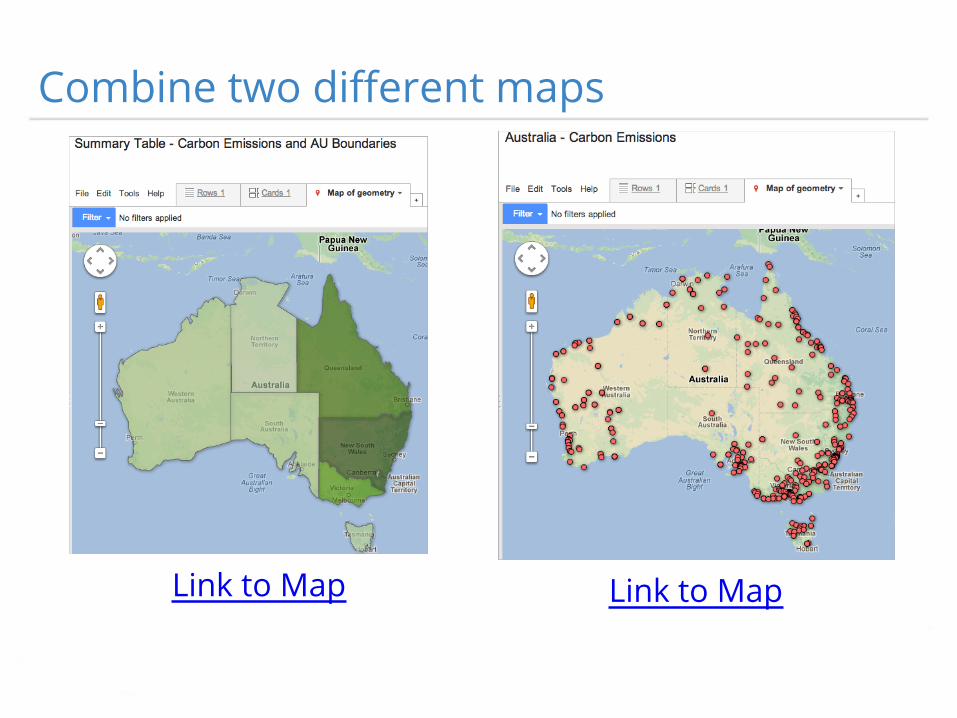
Combine two different maps
Link to MapLink to Map
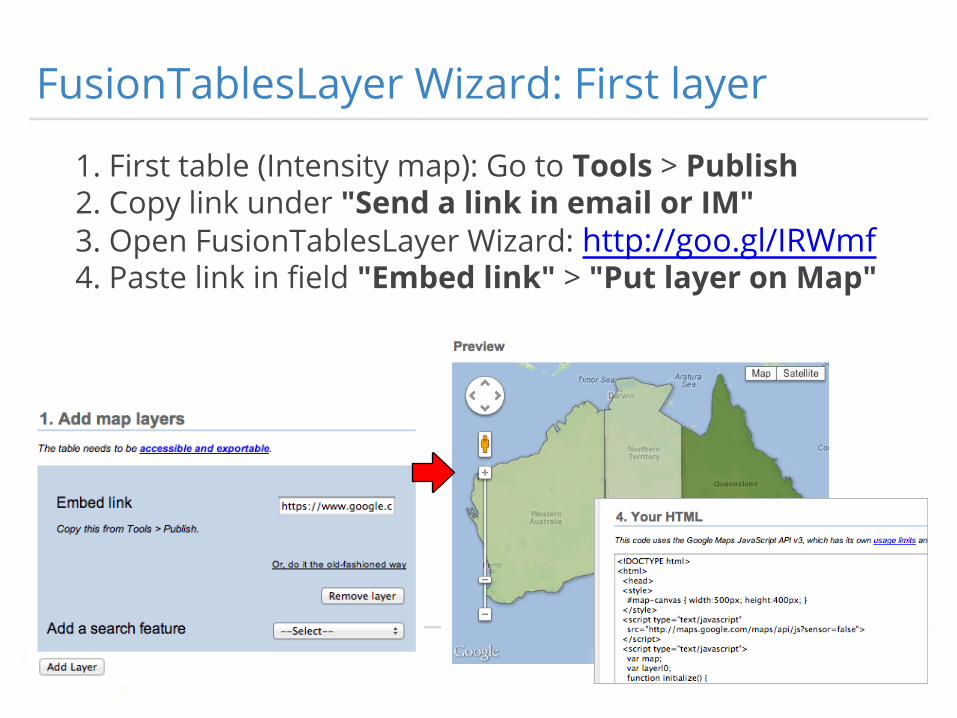
FusionTablesLayer Wizard: First layer
1. First table (Intensity map): Go to Tools > Publish2. Copy link under "Send a link in email or IM"3. Open FusionTablesLayer Wizard: http://goo.gl/IRWmf4. Paste link in field "Embed link" > "Put layer on Map"
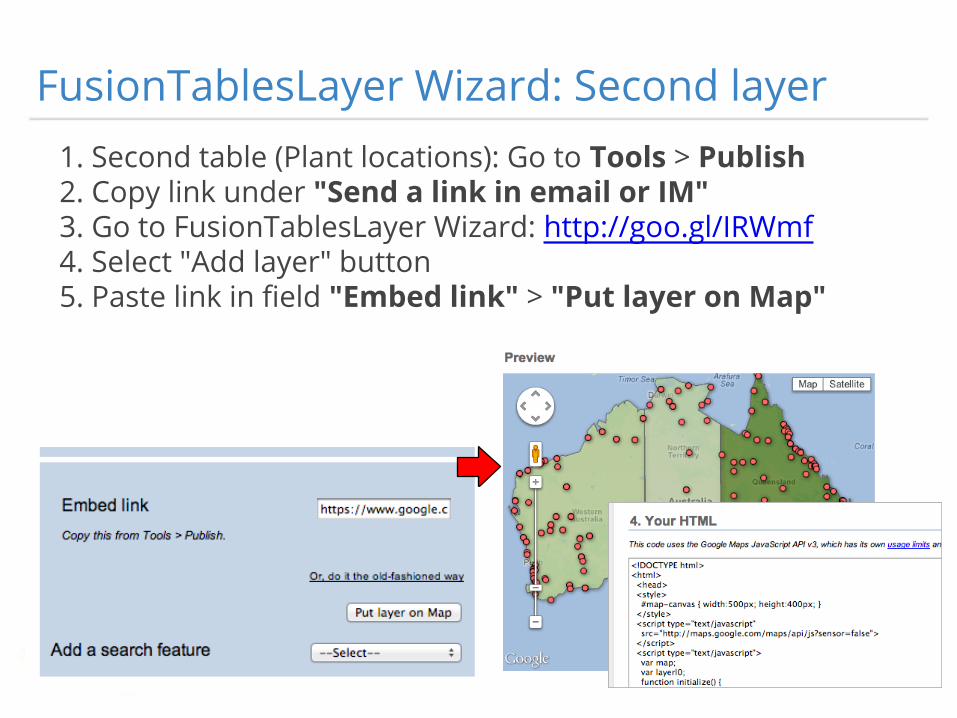
FusionTablesLayer Wizard: Second layer1. Second table (Plant locations): Go to Tools > Publish2. Copy link under "Send a link in email or IM"3. Go to FusionTablesLayer Wizard: http://goo.gl/IRWmf4. Select "Add layer" button5. Paste link in field "Embed link" > "Put layer on Map"
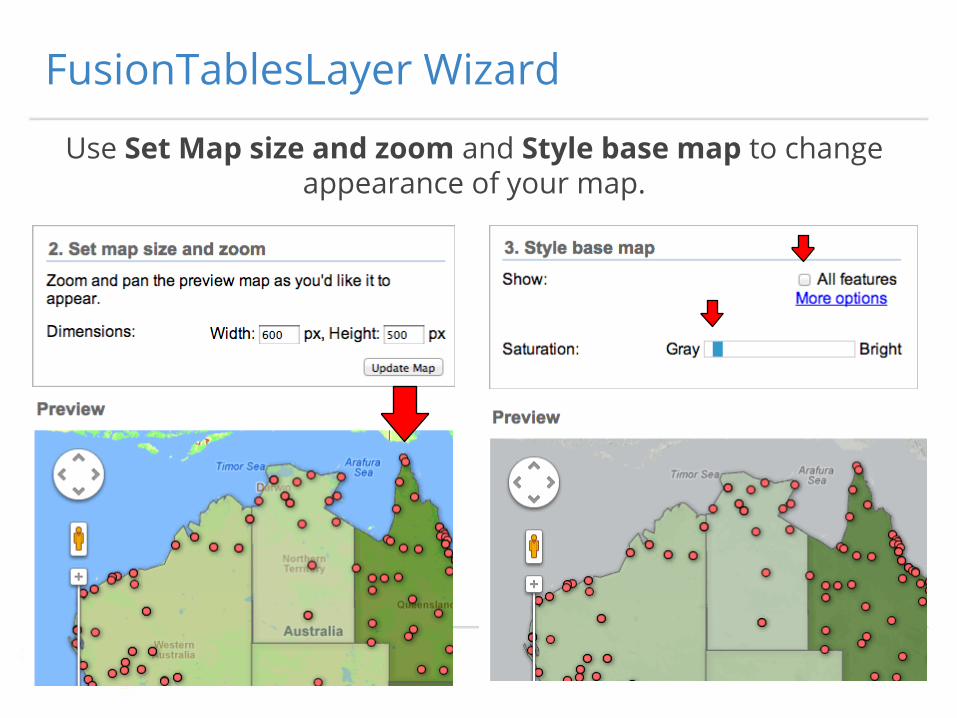
FusionTablesLayer Wizard
Use Set Map size and zoom and Style base map to change appearance of your map.
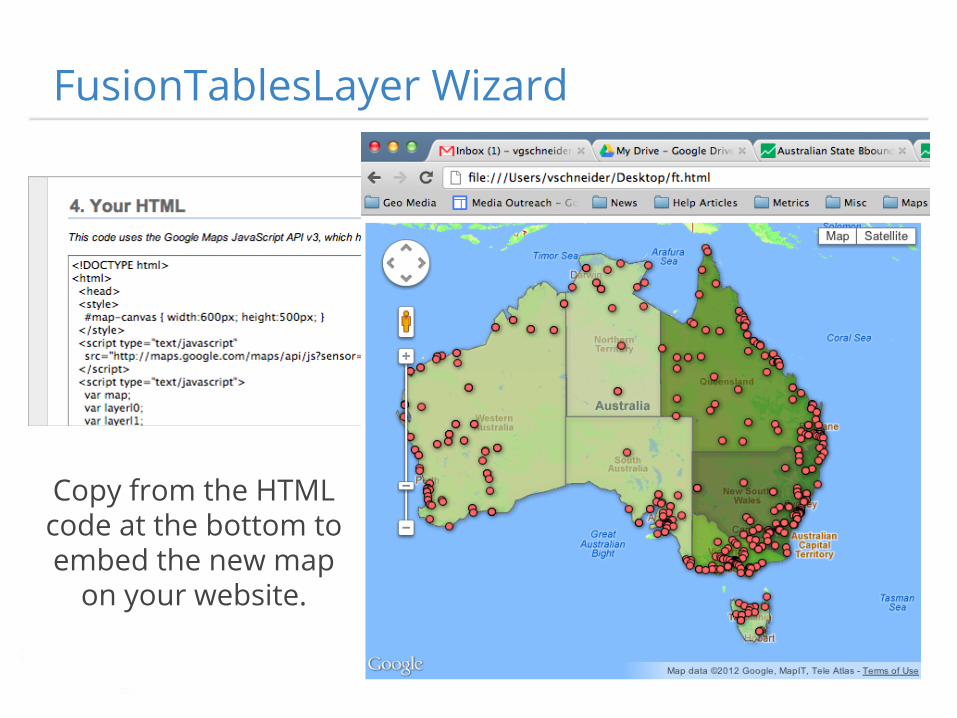
FusionTablesLayer Wizard
Copy from the HTML code at the bottom to embed the new map
on your website.
Review of Google Fusion Tables
Import and map your dataStyle your map Filter your mapShare your Fusion Tables map Merge tablesCreate a custom intensity map Use FusionTablesLayer Wizard
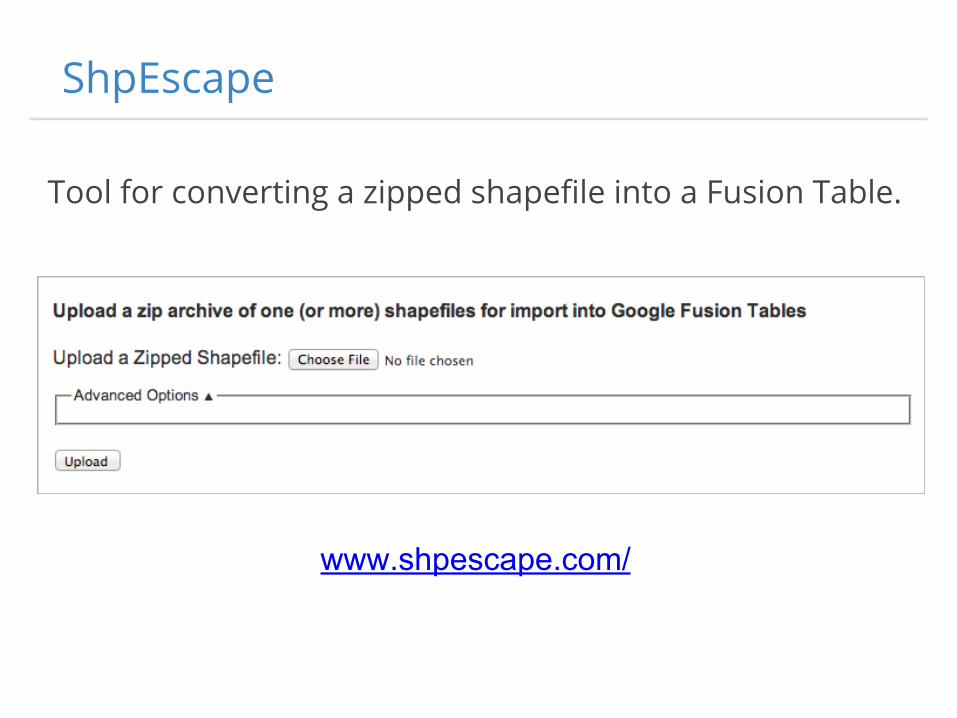
ShpEscape
Tool for converting a zipped shapefile into a Fusion Table.
www.shpescape.com/
ShpEscape
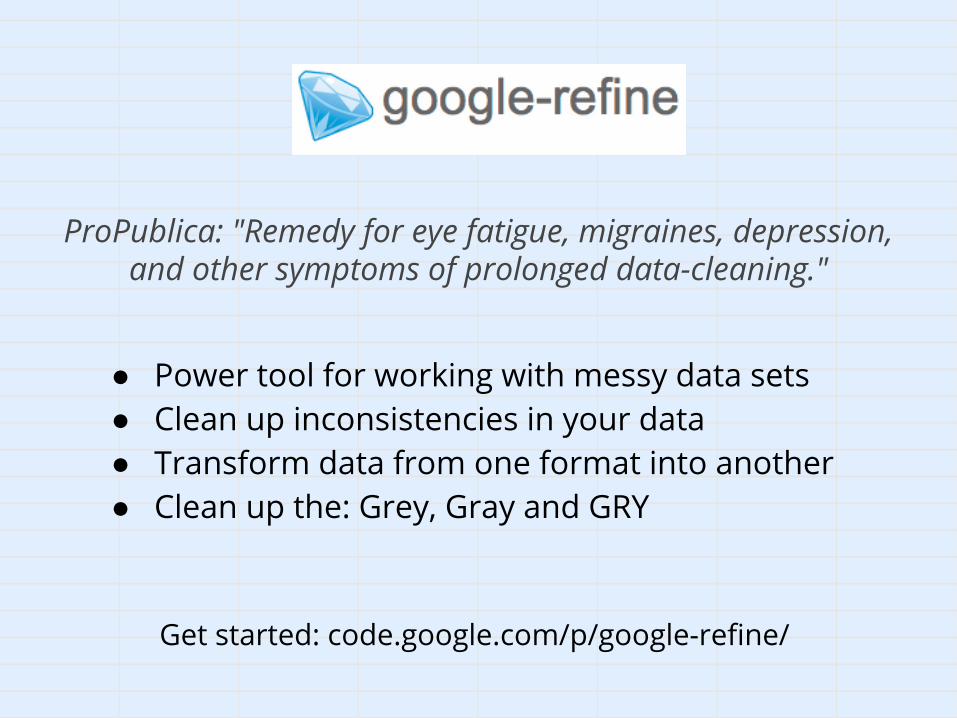
● Power tool for working with messy data sets● Clean up inconsistencies in your data● Transform data from one format into another ● Clean up the: Grey, Gray and GRY
ProPublica: "Remedy for eye fatigue, migraines, depression, and other symptoms of prolonged data-cleaning."
Get started: code.google.com/p/google-refine/
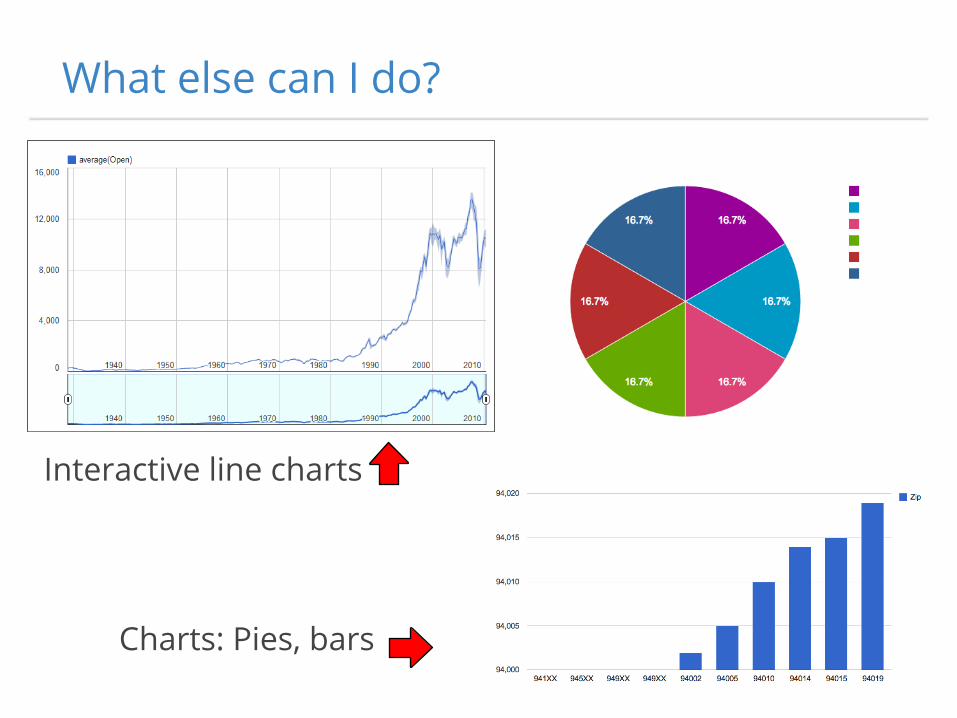
What else can I do?
Interactive line charts
Charts: Pies, bars