gottsmann, j., blundy, j., henderson, s., pritchard, m...
TRANSCRIPT
Gottsmann, J., Blundy, J., Henderson, S., Pritchard, M., & Sparks, S. (2017).Thermomechanical modeling of the Altiplano-Puna deformation anomaly:Multiparameter insights into magma mush reorganization. Geosphere, 13(4),1042-1065. DOI: 10.1130/GES01420.1
Publisher's PDF, also known as Version of record
License (if available):CC BY
Link to published version (if available):10.1130/GES01420.1
Link to publication record in Explore Bristol ResearchPDF-document
University of Bristol - Explore Bristol ResearchGeneral rights
This document is made available in accordance with publisher policies. Please cite only the publishedversion using the reference above. Full terms of use are available:http://www.bristol.ac.uk/pure/about/ebr-terms
Research Paper
1Gottsmann et al. | Mush reorganization at UturuncuGEOSPHERE | Volume 13 | Number 4
Thermomechanical modeling of the Altiplano-Puna deformation anomaly: Multiparameter insights into magma mush reorganizationJ. Gottsmann1,2, J. Blundy1,2, S. Henderson3, M.E. Pritchard1,4, and R.S.J. Sparks1,2
1School of Earth Sciences, University of Bristol, Wills Memorial Building, Queens Road, Bristol BS8 1RJ, UK2Cabot Institute and School of Earth Sciences, University of Bristol, Royal Fort House, Bristol BS8 1RJ, UK3Departamento de Geociencias, Universidad de los Andes, Cr 1 #18A-12, Edificio M1 Piso 3, Bogotá, Colombia4Department of Earth and Atmospheric Sciences, Cornell University, 2122 Snee Hall, 112 Hollister Drive, Ithaca, New York 14853, USA
ABSTRACT
A 150-km-wide ground deformation anomaly in the Altiplano-Puna vol-canic complex (APVC) of the Central Andes, with uplift centered on Uturuncu volcano and peripheral subsidence, alludes to complex subsurface stress changes. In particular, the role of a large, geophysically anomalous and par-tially molten reservoir (the Altiplano-Puna magma body, APMB), located ~20 km beneath the deforming surface, is still poorly understood. To explain the observed spatiotemporal ground deformation pattern, we integrate geo-physical and petrological data and develop a numerical model that accounts for a mechanically heterogeneous and viscoelastic crust. Best-fit models imply subsurface stress changes due to the episodic reorganization of an intercon-nected vertically extended mid-crustal plumbing system composed of the APMB and a domed bulge and column structure. Measured gravity-height gra-dient data point toward low-density fluid migration as the dominant process behind these stress changes. We calculate a mean annual flux of ~2 × 10⁷ m3 of water-rich andesitic melt and/or magmatic water from the APMB into the bulge and column structure accompanied by modest pressure changes of <0.006 MPa/yr. Two configurations of the column fit the observations equally well: (1) a magmatic (igneous mush) column that extends to a depth of 6 km below sea level and contains trapped volatiles, or (2) a volatile-bearing hybrid column composed of an igneous mush below a solidified and permeable body that extends to sea level. Volatile loss from the bulge and column structure reverses the deformation, and explains the absence of broad (tens of kilome-ters) and long-term (>100 yr) residual deformation at Uturuncu. Episodic mush reorganization may be a ubiquitous characteristic of the magmatic evolution of the APVC.
INTRODUCTION
The structural and chemical evolution of continental crust is intimately linked to igneous differentiation processes (e.g., Hawkesworth and Kemp, 2006). Both extensive recycling of material by crustal melting and new addi-tions from the mantle contribute to crustal growth (e.g., Patchett et al., 1982).
The Central Andes is a region where crustal thickening has occurred, leading to the formation of ~70-km-thick crust to the east of the Western Cordillera in the Altiplano-Puna region of southern Bolivia and northern Argentina (lat 18°S to 22°S; e.g., Zandt et al., 1994). Satellite remote sensing studies identified a large (>70 km wide) near circular area of surface deformation (Pritchard and Simons, 2002) centered on Cerro Uturuncu (22.270˚S, 67.180˚W), a 6008-m-high Pleistocene dacitic volcano (e.g., Sparks et al., 2008) in the Altiplano-Puna vol-canic complex (APVC; de Silva, 1989). The mean maximum deformation rate of ~1 cm/yr has been ongoing from 1992 to 2011 (Fialko and Pearse, 2012; Hender-son and Pritchard, 2013).
As part of the central volcanic zone of the Andes, the APVC is interpreted as the volcanic expression of a crustal magmatic system that between 10 and 1 Ma fed episodic and cyclic silicic ignimbrite flare-ups (e.g., Salisbury et al., 2011). The explosive eruption of ~15,000 km3 of magma across the APVC formed numerous large collapse calderas (de Silva and Gosnold, 2007). Sev-eral geophysical methods have detected anomalies under the APVC that are interpreted as the Altiplano-Puna magma body (APMB) (see Table 1 for sum-mary and references).
The deformation anomaly covers a substantial part of the APVC and, al-though centered on Uturuncu (located ~100 km to the east of the active Holo-cene volcanic arc), it also includes several other Pleistocene and older volcanic edifices within an area of ~31,500 km2 (Fig. 1). Several explanations have been proposed for the deformation anomaly, including the pressurization of sub-surface cavities (as a proxy for magma reservoirs) located at various crustal depths above, within, and below the APMB, and complex interactions between multiple magmatic systems located at upper to lower crustal levels (Pritchard and Simons, 2002; Sparks et al., 2008; Hickey et al., 2013). Alternatively, Fialko and Pearse (2012) proposed the ascent of a magmatic diapir from the APMB to explain a broad moat of relative ground subsidence surrounding a central area of ground uplift (Figs. 1–3).
Here we integrate and interpret recent results from new geophysical, geodetic, geomorphic, and petrological studies conducted on and around Uturuncu including part of the PLUTONS project (probing Lazufre and Uturuncu together; http:// plutons .science .oregonstate .edu /about; a collabora-tion core-funded by the U.S. National Science Foundation and the U.K. Natural
GEOSPHERE
GEOSPHERE; v. 13, no. 4
doi:10.1130/GES01420.1
21 figures; 4 tables
CORRESPONDENCE: gljhg@ bristol .ac .uk; j.gottsmann@ bristol .ac .uk
CITATION: Gottsmann, J., Blundy, J., Henderson, S., Pritchard, M.E., and Sparks, R.S.J., 2017, Thermome-chanical modeling of the Altiplano-Puna deformation anomaly: Multiparameter insights into magma mush reorganization: Geosphere, v. 13, no. 4, p. 1–24, doi:10.1130/GES01420.1.
Received 20 August 2016Revision received 24 February 2017Accepted 11 April 2017
OPEN ACCESS
GOLD
This paper is published under the terms of the CC-BY license.
© 2017 The Authors
THEMED ISSUE: PLUTONS: Investigating the Relationship between Pluton Growth and Volcanism in the Central Andes
Research Paper
2Gottsmann et al. | Mush reorganization at UturuncuGEOSPHERE | Volume 13 | Number 4
Environment Research Council. We present a numerical deformation model to explain the observed ground deformation in the context of the multiparameter studies of the project.
BACKGROUND AND MULTIPARAMETER CONSTRAINTS
Many novel findings on the subsurface architecture and petrology of the APMB as well as Uturuncu volcano are presented in this themed Geosphere issue (and elsewhere) as a result of the PLUTONS project. Table 1 summa-rizes the key results that are employed to inform the numerical models devel-oped here.
Geophysics
Geophysical imaging techniques (seismic, gravimetric, and magnetotelluric) coupled with three-dimensional (3D) data inversion identify a broad region of low seismic velocity, low density, and low electrical resistivity at mid-crustal levels (≤20 km depth; Comeau et al., 2015; del Potro et al., 2013a; Ward et al., 2014). The joint inversion of surface wave dispersion and receiver functions (Ward et al., 2014) depict a voluminous, 11-km-thick low seismic velocity zone with a diameter of ~200 km and a top at depths of between ~9 and 30 km beneath the ground surface (4–25 km below mean sea level). Inverse models
of static potential field data image a topographically heterogeneous upper sur-face to this large body. Beneath Uturuncu a vertically elongated (column like) structure with a radius of between 6 and 12 km extends a further 8–10 km above the mean depth of the APMB (Comeau et al., 2015; del Potro et al., 2013a). Sev-eral vertically elongated low-density and high-conductivity structures connect the low velocity zone with near-surface crustal levels below composite vol-canic edifices of the APVC.
Petrology
The piecemeal assembly and eruption of chemically distinct batches of dacite magma from a chemically heterogeneous magma system beneath Uturuncu dominated the eruptive history during its protracted activity from 1050 to 250 ka (Muir et al., 2015, 2014a). Experiments determined the preerup-tive dacite storage pressures at Uturuncu to be 100 ± 50 MPa (Muir et al., 2014b) at ~870 °C (1143 K). Isotopic data from the Uturuncu dacites indicate a mixture of crustal-derived and differentiated mantle–derived melts (Michelfelder et al., 2014). Andesitic and basaltic andesitic enclaves in Uturuncu lavas and in silicic ignimbrites of the APVC (Michelfelder et al., 2014) are interpreted as aliquots of the least evolved resident magmas in the APMB entrained into the volu-metrically dominant, silica-rich dacite magmas (Sparks et al., 2008). The mafic magmas have less radiogenic strontium and more radiogenic neodymium iso-topes than associated dacites (Michelfelder et al., 2014) and are thought to be
TABLE 1. COMPILATION OF RECENT STUDIES AND AVAILABLE DATA TO INFORM THE NUMERICAL MODEL
Technique Key findings Available data for model input Reference
Magnetotellurics Low electrical resistivity anomaly at ~15 km depth below sea level with upper surface of 8–13-km-wide vertical anomaly shallowest beneath Uturuncu
Size and geometry of anomalous structures
Schilling et al. (2006); Comeau et al.(2015, 2016)
Gravimetry Approximately 12–24 km wide, vertically elongated (8–12 km high), low-density structures rooted at the top of the APMB at ~15 km below sea level
Size and geometry of anomalous structures
del Potro et al. (2013b)
Seismology Low seismic velocity zone at depths of between 4 and 25 km below sea level; seismic brittle-ductile transition at aroundsea level
Three-dimensional crustal shear wave velocity; depth of brittle-ductile transition
Ward et al. (2014); Jay et al. (2012);Chmielowski et al. (1999); Zandt et al. (2003)
Petrology Preeruptive dacite storage pressures at Uturuncu to 100 ± 50 MPa at 870 °C
Crustal temperature profile in mush column and APMB
Muir et al. (2014b)
Geodesy Approximately 150-km-wide displacement field with central InSAR line of sight velocities of ~1 cm/yr between May 1992 and January 2011; moat of subsidence surrounding central area of uplift; leveling data indicates uplift since 1960s; global positioning system data indicate slower uplift rate between 2010and 2015
Surface velocity and spatiotemporalevolution of deformation
Fialko and Pearse (2012); Henderson and Pritchard (2013); del Potro et al.(2013a); Blewitt et al. (2016)
Geomorphology Absence of sustained residual long-term deformation Null result for residual ground deformation at time, t > 100 yr
Perkins et al. (2016)
Note: See text for details on numerical model. APMB—Altiplano-Puna magma body.
Research Paper
3Gottsmann et al. | Mush reorganization at UturuncuGEOSPHERE | Volume 13 | Number 4
the heat source for crustal anatexis (Muir et al., 2015). These observations and interpretations are consistent with the hot zone concept of Annen et al. (2006), whereby repeated incursions of hot mantle-derive magmas into the lower or mid-crust drive differentiation by a combination of crystallization and anatexis.
Recent high-pressure electrical conductivity and petrological experiments (Laumonier et al., 2017) provide further insights into magma chemistry in the APMB. They show that the high electrical conductivity (~1 S m–1) of the APMB, while maintaining the low melt fractions defined seismically (Ward et al., 2014), can be matched by andesitic melts with high water contents (7–10 wt%). Note that an alternative scenario, wherein the APMB contains dacite melt contain-ing the observed dissolved water content of ≤4 wt%, cannot explain the high electrical conductivity of the APMB as imaged by Comeau et al. (2015). To do so, a substantially higher (by at least a factor of 1.5) melt fraction compared to
the seismically constrained fraction would be needed (Ward et al., 2014). Phase equilibrium experiments on andesite enclaves from Uturuncu show that the observed phenocrysts assemblage and characteristic calcic plagioclase com-position require pressures in the range 500–700 MPa, magmatic temperatures of 970 °C (1243 K) and dissolved H2O contents of 8–10 wt%, consistent with the conductivity studies (Laumonier et al., 2017). Together, the geophysical and petrological data support an APMB composed of 8–30 vol% water-rich andesite melt dispersed in a solid matrix. Mixing of these andesitic melts with crustal melts atop the APMB gave rise to the hybrid dacites at Uturuncu and elsewhere in the APVC (Fig. 4).
Thermal
The extensive magmatism and volcanism over the past 15 m.y. in the Alti-plano region is proposed to have left a thermal fingerprint in the upper crust beneath the APVC (de Silva and Gosnold, 2007). The bottom of the present-day seismogenic zone, inferred to be the brittle-ductile transition zone (BDTZ), around Uturuncu volcano is located at depths of 4.5–10 km beneath the ground
69°W
21°
22°
24°
23°
21°S
22°
24°
23°
68° 67° 66°
69° 68° 67° 66°
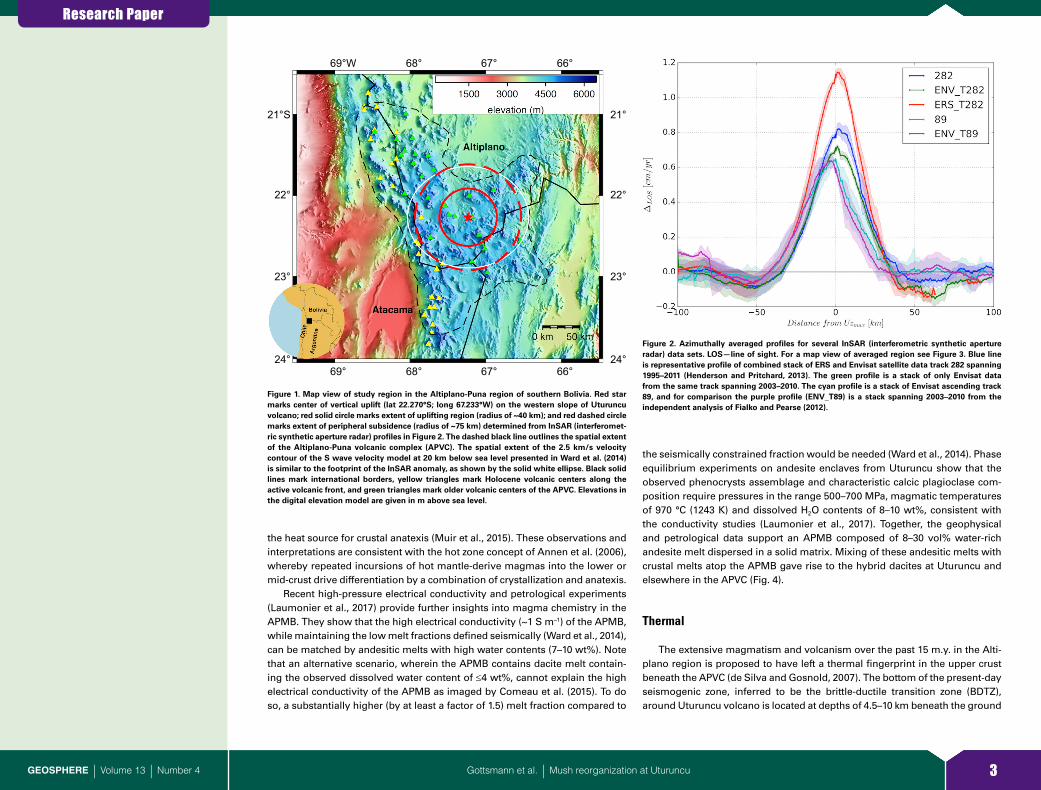
Figure 1. Map view of study region in the Altiplano-Puna region of southern Bolivia. Red star marks center of vertical uplift (lat 22.270°S; long 67.233°W) on the western slope of Uturuncu volcano; red solid circle marks extent of uplifting region (radius of ~40 km); and red dashed circle marks extent of peripheral subsidence (radius of ~75 km) determined from InSAR (interferomet-ric synthetic aperture radar) profiles in Figure 2. The dashed black line outlines the spatial extent of the Altiplano-Puna volcanic complex (APVC). The spatial extent of the 2.5 km/s velocity contour of the S wave velocity model at 20 km below sea level presented in Ward et al. (2014) is similar to the footprint of the InSAR anomaly, as shown by the solid white ellipse. Black solid lines mark international borders, yellow triangles mark Holocene volcanic centers along the active volcanic front, and green triangles mark older volcanic centers of the APVC. Elevations in the digital elevation model are given in m above sea level.
Figure 2. Azimuthally averaged profiles for several InSAR (interferometric synthetic aperture radar) data sets. LOS—line of sight. For a map view of averaged region see Figure 3. Blue line is representative profile of combined stack of ERS and Envisat satellite data track 282 spanning 1995–2011 (Henderson and Pritchard, 2013). The green profile is a stack of only Envisat data from the same track spanning 2003–2010. The cyan profile is a stack of Envisat ascending track 89, and for comparison the purple profile (ENV_T89) is a stack spanning 2003–2010 from the independent analysis of Fialko and Pearse (2012).
Research Paper
4Gottsmann et al. | Mush reorganization at UturuncuGEOSPHERE | Volume 13 | Number 4
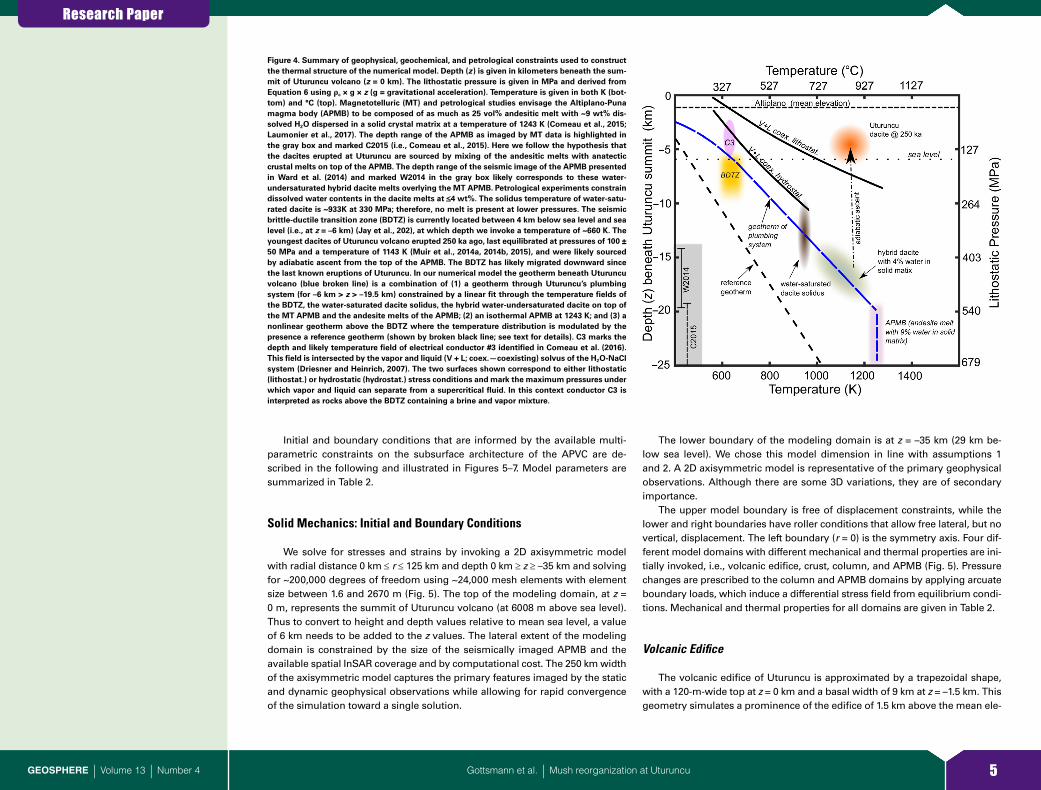
surface and is shallowest directly beneath Uturuncu (Sparks et al., 2008; Jay et al., 2012; Keyson and West, 2013). Pleistocene eruptions of Uturuncu pro-duced dacites having depths of last equilibration before eruption (see follow-ing) that coincide with the present-day BDTZ (Muir et al., 2014b). An estimate of the current temperature distribution between the APBM and the BTDZ, con-strained by petrological, experimental, and geophysical data, is summarized in Figure 4.
Satellite and Ground-Based Geodesy
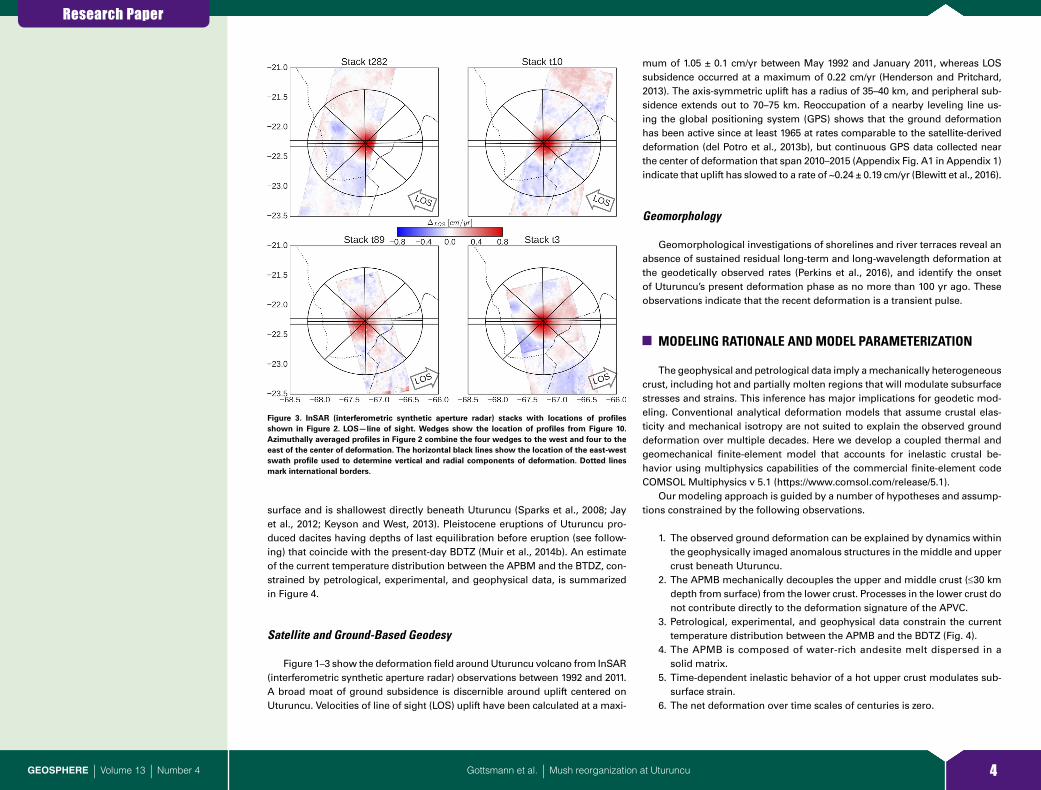
Figure 1–3 show the deformation field around Uturuncu volcano from InSAR (interferometric synthetic aperture radar) observations between 1992 and 2011. A broad moat of ground subsidence is discernible around uplift centered on Uturuncu. Velocities of line of sight (LOS) uplift have been calculated at a maxi-
mum of 1.05 ± 0.1 cm/yr between May 1992 and January 2011, whereas LOS subsidence occurred at a maximum of 0.22 cm/yr (Henderson and Pritchard, 2013). The axis-symmetric uplift has a radius of 35–40 km, and peripheral sub-sidence extends out to 70–75 km. Reoccupation of a nearby leveling line us-ing the global positioning system (GPS) shows that the ground deformation has been active since at least 1965 at rates comparable to the satellite-derived defor ma tion (del Potro et al., 2013b), but continuous GPS data collected near the center of deformation that span 2010–2015 (Appendix Fig. A1 in Appendix 1) indicate that uplift has slowed to a rate of ~0.24 ± 0.19 cm/yr (Blewitt et al., 2016).
Geomorphology
Geomorphological investigations of shorelines and river terraces reveal an absence of sustained residual long-term and long-wavelength deformation at the geodetically observed rates (Perkins et al., 2016), and identify the onset of Uturuncu’s present deformation phase as no more than 100 yr ago. These observations indicate that the recent deformation is a transient pulse.
MODELING RATIONALE AND MODEL PARAMETERIZATION
The geophysical and petrological data imply a mechanically heterogeneous crust, including hot and partially molten regions that will modulate subsurface stresses and strains. This inference has major implications for geodetic mod-eling. Conventional analytical deformation models that assume crustal elas-ticity and mechanical isotropy are not suited to explain the observed ground deformation over multiple decades. Here we develop a coupled thermal and geomechanical finite-element model that accounts for inelastic crustal be-havior using multiphysics capabilities of the commercial finite-element code COMSOL Multiphysics v 5.1 (https:// www .comsol .com /release /5.1).
Our modeling approach is guided by a number of hypotheses and assump-tions constrained by the following observations.
1. The observed ground deformation can be explained by dynamics within the geophysically imaged anomalous structures in the middle and upper crust beneath Uturuncu.
2. The APMB mechanically decouples the upper and middle crust (≤30 km depth from surface) from the lower crust. Processes in the lower crust do not contribute directly to the deformation signature of the APVC.
3. Petrological, experimental, and geophysical data constrain the current temperature distribution between the APMB and the BDTZ (Fig. 4).
4. The APMB is composed of water-rich andesite melt dispersed in a solid matrix.
5. Time-dependent inelastic behavior of a hot upper crust modulates sub-surface strain.
6. The net deformation over time scales of centuries is zero.
Figure 3. InSAR (interferometric synthetic aperture radar) stacks with locations of profiles shown in Figure 2. LOS—line of sight. Wedges show the location of profiles from Figure 10. Azimuthally averaged profiles in Figure 2 combine the four wedges to the west and four to the east of the center of deformation. The horizontal black lines show the location of the east-west swath profile used to determine vertical and radial components of deformation. Dotted lines mark international borders.
Research Paper
5Gottsmann et al. | Mush reorganization at UturuncuGEOSPHERE | Volume 13 | Number 4
Initial and boundary conditions that are informed by the available multi-parametric constraints on the subsurface architecture of the APVC are de-scribed in the following and illustrated in Figures 5–7. Model parameters are summarized in Table 2.
Solid Mechanics: Initial and Boundary Conditions
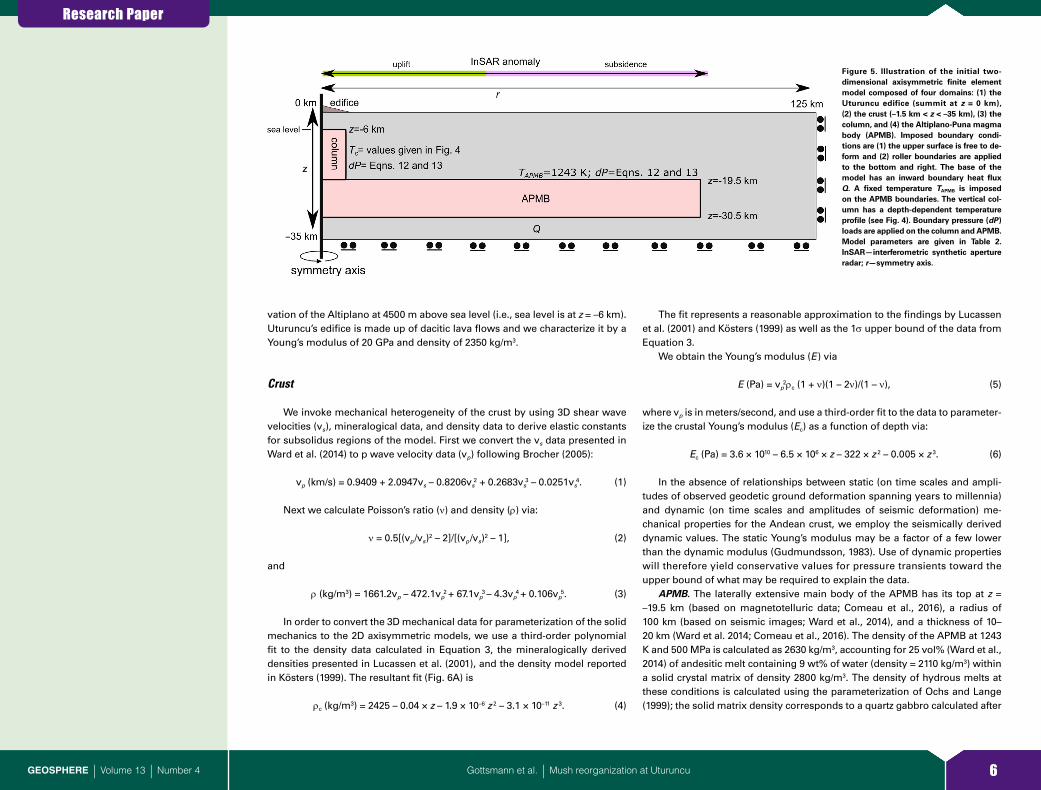
We solve for stresses and strains by invoking a 2D axisymmetric model with radial distance 0 km ≤ r ≤ 125 km and depth 0 km ≥ z ≥ –35 km and solving for ~200,000 degrees of freedom using ~24,000 mesh elements with element size between 1.6 and 2670 m (Fig. 5). The top of the modeling domain, at z = 0 m, represents the summit of Uturuncu volcano (at 6008 m above sea level). Thus to convert to height and depth values relative to mean sea level, a value of 6 km needs to be added to the z values. The lateral extent of the modeling domain is constrained by the size of the seismically imaged APMB and the available spatial InSAR coverage and by computational cost. The 250 km width of the axisymmetric model captures the primary features imaged by the static and dynamic geophysical observations while allowing for rapid convergence of the simulation toward a single solution.
The lower boundary of the modeling domain is at z = –35 km (29 km be-low sea level). We chose this model dimension in line with assumptions 1 and 2. A 2D axisymmetric model is representative of the primary geophysical observations. Although there are some 3D variations, they are of secondary importance.
The upper model boundary is free of displacement constraints, while the lower and right boundaries have roller conditions that allow free lateral, but no vertical, displacement. The left boundary (r = 0) is the symmetry axis. Four dif-ferent model domains with different mechanical and thermal properties are ini-tially invoked, i.e., volcanic edifice, crust, column, and APMB (Fig. 5). Pressure changes are prescribed to the column and APMB domains by applying arcuate boundary loads, which induce a differential stress field from equilibrium condi-tions. Mechanical and thermal properties for all domains are given in Table 2.
Volcanic Edifice
The volcanic edifice of Uturuncu is approximated by a trapezoidal shape, with a 120-m-wide top at z = 0 km and a basal width of 9 km at z = –1.5 km. This geometry simulates a prominence of the edifice of 1.5 km above the mean ele-
Figure 4. Summary of geophysical, geochemical, and petrological constraints used to construct the thermal structure of the numerical model. Depth (z ) is given in kilometers beneath the sum-mit of Uturuncu volcano (z = 0 km). The lithostatic pressure is given in MPa and derived from Equation 6 using ρc × g × z (g = gravitational acceleration). Temperature is given in both K (bot-tom) and °C (top). Magnetotelluric (MT) and petrological studies envisage the Altiplano-Puna magma body (APMB) to be composed of as much as 25 vol% andesitic melt with ~9 wt% dis-solved H2O dispersed in a solid crystal matrix at a temperature of 1243 K (Comeau et al., 2015; Laumonier et al., 2017). The depth range of the APMB as imaged by MT data is highlighted in the gray box and marked C2015 (i.e., Comeau et al., 2015). Here we follow the hypothesis that the dacites erupted at Uturuncu are sourced by mixing of the andesitic melts with anatectic crustal melts on top of the APMB. The depth range of the seismic image of the APMB presented in Ward et al. (2014) and marked W2014 in the gray box likely corresponds to these water-under saturated hybrid dacite melts overlying the MT APMB. Petrological experiments constrain dissolved water contents in the dacite melts at ≤4 wt%. The solidus temperature of water-satu-rated dacite is ~933K at 330 MPa; therefore, no melt is present at lower pressures. The seismic brittle-ductile transition zone (BDTZ) is currently located between 4 km below sea level and sea level (i.e., at z = –6 km) (Jay et al., 202), at which depth we invoke a temperature of ~660 K. The youngest dacites of Uturuncu volcano erupted 250 ka ago, last equilibrated at pressures of 100 ± 50 MPa and a temperature of 1143 K (Muir et al., 2014a, 2014b, 2015), and were likely sourced by adiabatic ascent from the top of the APMB. The BDTZ has likely migrated downward since the last known eruptions of Uturuncu. In our numerical model the geotherm beneath Uturuncu volcano (blue broken line) is a combination of (1) a geotherm through Uturuncu’s plumbing system (for –6 km > z > –19.5 km) constrained by a linear fit through the temperature fields of the BDTZ, the water-saturated dacite solidus, the hybrid water-undersaturated dacite on top of the MT APMB and the andesite melts of the APMB; (2) an isothermal APMB at 1243 K; and (3) a nonlinear geotherm above the BDTZ where the temperature distribution is modulated by the presence a reference geotherm (shown by broken black line; see text for details). C3 marks the depth and likely temperature field of electrical conductor #3 identified in Comeau et al. (2016). This field is intersected by the vapor and liquid (V + L; coex.—coexisting) solvus of the H2O-NaCl system (Driesner and Heinrich, 2007). The two surfaces shown correspond to either lithostatic (lithostat.) or hydrostatic (hydrostat.) stress conditions and mark the maximum pressures under which vapor and liquid can separate from a supercritical fluid. In this context conductor C3 is interpreted as rocks above the BDTZ containing a brine and vapor mixture.
Research Paper
6Gottsmann et al. | Mush reorganization at UturuncuGEOSPHERE | Volume 13 | Number 4
vation of the Altiplano at 4500 m above sea level (i.e., sea level is at z = –6 km). Uturuncu’s edifice is made up of dacitic lava flows and we characterize it by a Young’s modulus of 20 GPa and density of 2350 kg/m3.
Crust
We invoke mechanical heterogeneity of the crust by using 3D shear wave velocities (vs), mineralogical data, and density data to derive elastic constants for subsolidus regions of the model. First we convert the vs data presented in Ward et al. (2014) to p wave velocity data (vp) following Brocher (2005):
vp (km/s) = 0.9409 + 2.0947vs – 0.8206vs2 + 0.2683vs
3 – 0.0251vs4. (1)
Next we calculate Poisson’s ratio (n) and density (r) via:
n = 0.5[(vp/vs)2 – 2]/[(vp/vs)2 – 1], (2)
and
r (kg/m3) = 1661.2vp – 472.1vp2 + 67.1vp
3 – 4.3vp4 + 0.106vp
5. (3)
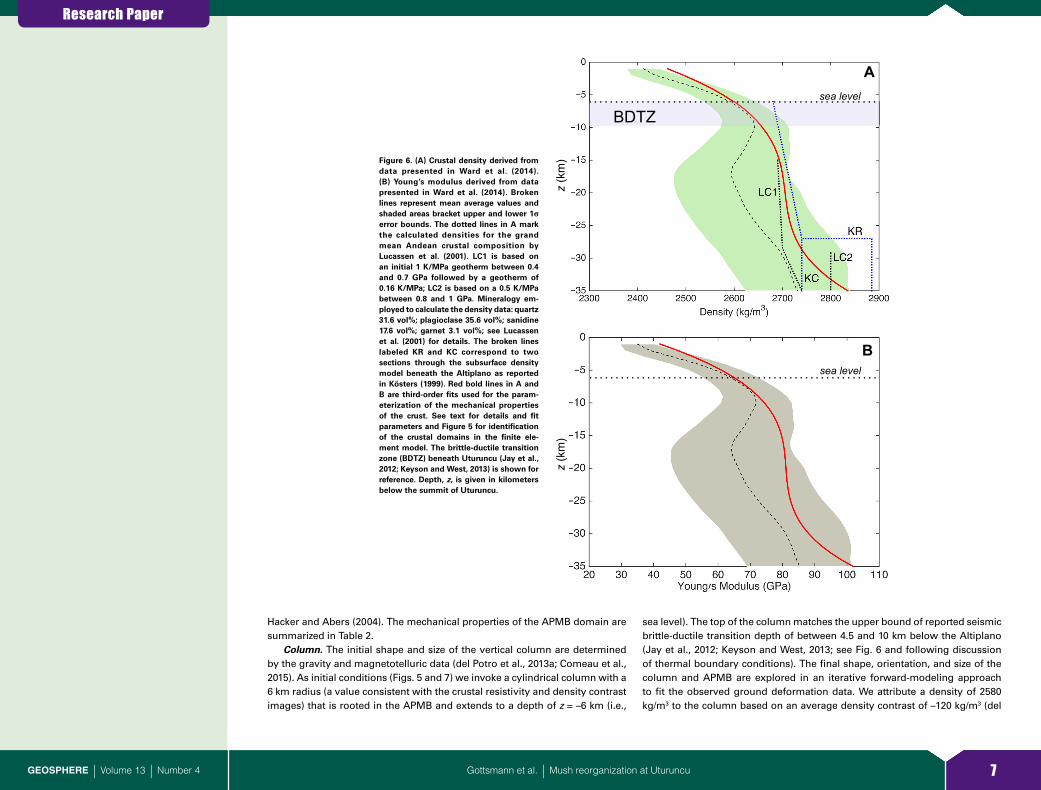
In order to convert the 3D mechanical data for parameterization of the solid mechanics to the 2D axisymmetric models, we use a third-order polynomial fit to the density data calculated in Equation 3, the mineralogically derived densities presented in Lucassen et al. (2001), and the density model reported in Kösters (1999). The resultant fit (Fig. 6A) is
rc (kg/m3) = 2425 – 0.04 × z – 1.9 × 10⁻⁶ z 2 – 3.1 × 10⁻¹¹ z 3. (4)
The fit represents a reasonable approximation to the findings by Lucassen et al. (2001) and Kösters (1999) as well as the 1s upper bound of the data from Equation 3.
We obtain the Young’s modulus (E) via
E (Pa) = vp2rc (1 + n)(1 – 2n)/(1 – n), (5)
where vp is in meters/second, and use a third-order fit to the data to parameter-ize the crustal Young’s modulus (Ec) as a function of depth via:
Ec (Pa) = 3.6 × 10¹⁰ – 6.5 × 10⁶ × z – 322 × z 2 – 0.005 × z 3. (6)
In the absence of relationships between static (on time scales and ampli-tudes of observed geodetic ground deformation spanning years to millennia) and dynamic (on time scales and amplitudes of seismic deformation) me-chanical properties for the Andean crust, we employ the seismically derived dynamic values. The static Young’s modulus may be a factor of a few lower than the dynamic modulus (Gudmundsson, 1983). Use of dynamic properties will therefore yield conservative values for pressure transients toward the upper bound of what may be required to explain the data.
APMB. The laterally extensive main body of the APMB has its top at z = –19.5 km (based on magnetotelluric data; Comeau et al., 2016), a radius of 100 km (based on seismic images; Ward et al., 2014), and a thickness of 10–20 km (Ward et al. 2014; Comeau et al., 2016). The density of the APMB at 1243 K and 500 MPa is calculated as 2630 kg/m3, accounting for 25 vol% (Ward et al., 2014) of andesitic melt containing 9 wt% of water (density = 2110 kg/m3) within a solid crystal matrix of density 2800 kg/m3. The density of hydrous melts at these conditions is calculated using the parameterization of Ochs and Lange (1999); the solid matrix density corresponds to a quartz gabbro calculated after
Figure 5. Illustration of the initial two- dimensional axisymmetric finite element model composed of four domains: (1) the Uturuncu edifice (summit at z = 0 km), (2) the crust (–1.5 km < z < –35 km), (3) the column, and (4) the Altiplano-Puna magma body (APMB). Imposed boundary condi-tions are (1) the upper surface is free to de-form and (2) roller boundaries are applied to the bottom and right. The base of the model has an inward boundary heat flux Q. A fixed temperature TAPMB is imposed on the APMB boundaries. The vertical col-umn has a depth-dependent temperature profile (see Fig. 4). Boundary pressure (dP) loads are applied on the column and APMB. Model parameters are given in Table 2. InSAR—interferometric synthetic aperture radar; r—symmetry axis.
Research Paper
7Gottsmann et al. | Mush reorganization at UturuncuGEOSPHERE | Volume 13 | Number 4
Hacker and Abers (2004). The mechanical properties of the APMB domain are summarized in Table 2.
Column. The initial shape and size of the vertical column are determined by the gravity and magnetotelluric data (del Potro et al., 2013a; Comeau et al., 2015). As initial conditions (Figs. 5 and 7) we invoke a cylindrical column with a 6 km radius (a value consistent with the crustal resistivity and density contrast images) that is rooted in the APMB and extends to a depth of z = –6 km (i.e.,
sea level). The top of the column matches the upper bound of reported seismic brittle-ductile transition depth of between 4.5 and 10 km below the Altiplano (Jay et al., 2012; Keyson and West, 2013; see Fig. 6 and following discussion of thermal boundary conditions). The final shape, orientation, and size of the column and APMB are explored in an iterative forward-modeling approach to fit the observed ground deformation data. We attribute a density of 2580 kg/m3 to the column based on an average density contrast of –120 kg/m3 (del
A
B
BDTZsea level
sea level
z (k
m)
z (k
m)
Figure 6. (A) Crustal density derived from data presented in Ward et al. (2014). (B) Young’s modulus derived from data presented in Ward et al. (2014). Broken lines represent mean average values and shaded areas bracket upper and lower 1σ error bounds. The dotted lines in A mark the calculated densities for the grand mean Andean crustal composition by Lucassen et al. (2001). LC1 is based on an initial 1 K/MPa geotherm between 0.4 and 0.7 GPa followed by a geotherm of 0.16 K/MPa; LC2 is based on a 0.5 K/MPa between 0.8 and 1 GPa. Mineralogy em-ployed to calculate the density data: quartz 31.6 vol%; plagioclase 35.6 vol%; sanidine 17.6 vol%; garnet 3.1 vol%; see Lucassen et al. (2001) for details. The broken lines labeled KR and KC correspond to two sections through the subsurface density model beneath the Altiplano as reported in Kösters (1999). Red bold lines in A and B are third-order fits used for the param-eterization of the mechanical properties of the crust. See text for details and fit param eters and Figure 5 for identification of the crustal domains in the finite ele-ment model. The brittle-ductile transition zone (BDTZ) beneath Uturuncu (Jay et al., 2012; Keyson and West, 2013) is shown for reference. Depth, z, is given in kilometers below the summit of Uturuncu.
Research Paper
8Gottsmann et al. | Mush reorganization at UturuncuGEOSPHERE | Volume 13 | Number 4
Potro et al., 2013a) with the crustal density according to Equation 5 between z = –6 and z = –19.5 km. As we show herein, due to thermal constraints and geophysical observations the column is unlikely to contain partial melt except in its deepest part, where the temperature is thought to be above the water-satu rated dacite solidus (~933 K). Comeau et al. (2016) invoked the presence of saline magmatic fluids in the upper parts of the column at depths of approxi-mately sea level to explain its electrical resistivity of 3–7 Ω·m (Fig. 4). Various
volumetric combinations of country rock, magma, fluids, and pore space are consistent with the resistivity and bulk density observations (for further dis-cussion see Comeau et al., 2016; del Potro et al., 2013a). Only the deduced bulk density of the column significantly influences model results via the calcula-tion of lithostatic stresses and resultant stress differentials. The combination of different material fractions for given bulk density has little influence on the model outputs.
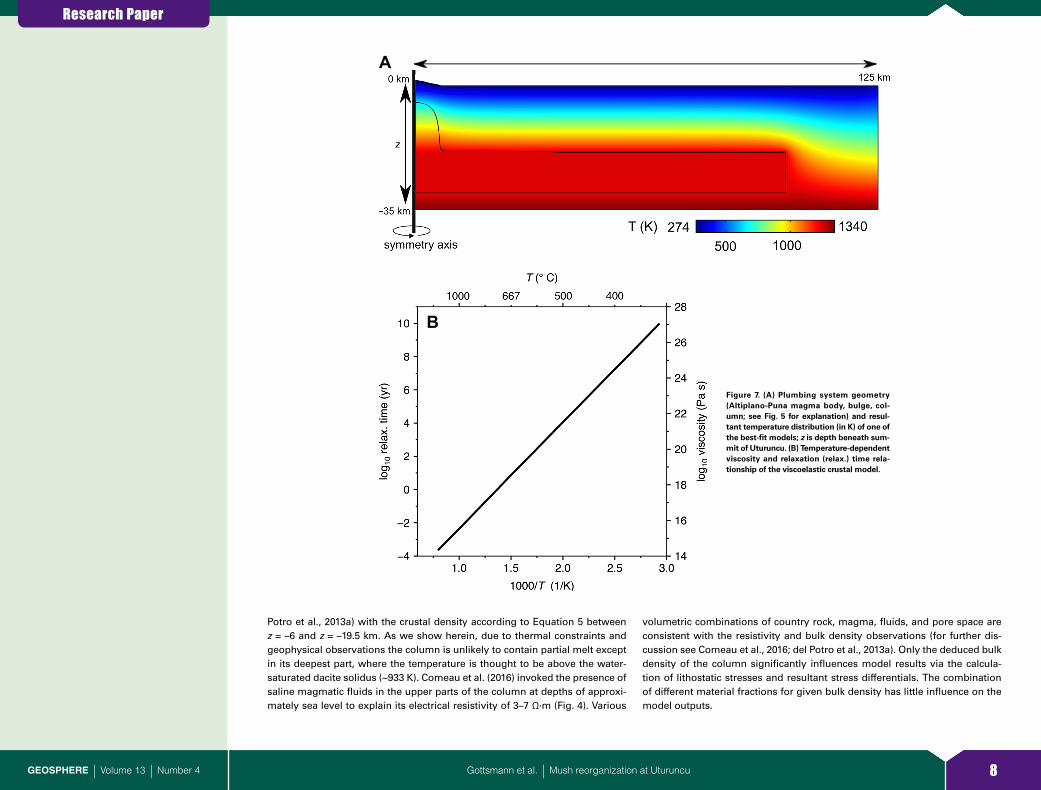
A
B
Figure 7. (A) Plumbing system geometry (Alti plano-Puna magma body, bulge, col-umn; see Fig. 5 for explanation) and resul-tant temperature distribution (in K) of one of the best-fit models; z is depth beneath sum-mit of Uturuncu. (B) Temperature-dependent viscosity and relaxation (relax.) time rela-tionship of the viscoelastic crustal model.
Research Paper
9Gottsmann et al. | Mush reorganization at UturuncuGEOSPHERE | Volume 13 | Number 4
Body Load
The models account for lithostatic stresses and gravitational loading, which is invoked by a body load applied to all model domains. In order to balance the gravitational forces, we invoke initial stress conditions on all modeling domains using the cyclic stress loading–compensation sequence (Gottsmann and Odbert, 2014). All domains are consequently free of any significant residual stresses and strains prior to applying the boundary conditions. The residual deformations in all domains at the end of this sequence are negligible and ~10–10 m.
Heat Transfer
Initial and Boundary Conditions
The following thermal boundary conditions are invoked. The surface is set to 275 K and the lower boundary at z = –35 km has an inward heat flux of 0.09 W/m2. Ignoring radiogenic heat production and assuming constant thermal
conductivity, a reference geotherm of 30 K/km is thus obtained (Jaupart and Mareschal, 2009). This reference geotherm is maintained in the model only along the right-side boundary, because the temperature distribution in most of the modeling domain it is strongly influenced by the magmatic plumbing system (APMB and column). We invoke a temperature of 1243 K for the APMB, corresponding to the liquidus temperature of andesite inclusions at Uturuncu as determined by petrological observations and experiments (Sparks et al., 2008; Laumonier et al., 2017). This temperature is consistent with the supposi-tion that the APMB comprises wet andesite melt in a solid matrix, overlain by a partially molten layer containing dacite melt (see Fig. 4). While other deeper storage regions from which andesite has been sourced may exist beneath Uturuncu, our assumption is consistent with the available petrological, geo-chemical, and geophysical constraints (Michelfelder et al., 2014; Muir et al., 2015; Laumonier et al., 2017). The top of the column at z = –6 km marks the upper bound of the BDTZ, for which we set a temperature of T = 387 °C (660 K) (Priestley et al., 2008). This depth corresponds to the upper bound of experi-mentally determined confining pressures of 100 ± 50 MPa of pre-eruptive
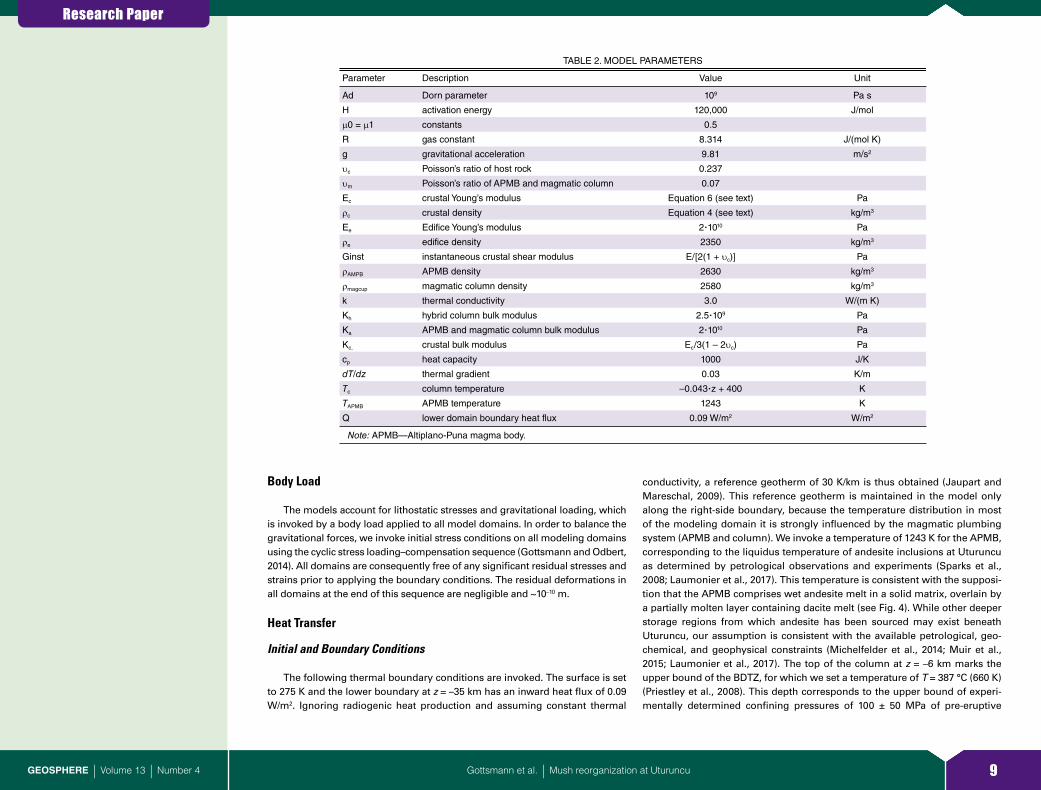
TABLE 2. MODEL PARAMETERS
Parameter Description Value Unit
Ad Dorn parameter 109 Pa s
H activation energy 120,000 J/mol
µ0 = µ1 constants 0.5
R gas constant 8.314 J/(mol K)
g gravitational acceleration 9.81 m/s2
υc Poisson’s ratio of host rock 0.237
υm Poisson’s ratio of APMB and magmatic column 0.07
Ec crustal Young’s modulus Equation 6 (see text) Pa
ρc crustal density Equation 4 (see text) kg/m3
Ee Edifice Young’s modulus 2∙1010 Pa
ρe edifice density 2350 kg/m3
Ginst instantaneous crustal shear modulus E/[2(1 + υc)] Pa
ρAMPB APMB density 2630 kg/m3
ρmagcup magmatic column density 2580 kg/m3
k thermal conductivity 3.0 W/(m K)
Kh hybrid column bulk modulus 2.5∙109 Pa
Ka APMB and magmatic column bulk modulus 2∙1010 Pa
Kc, crustal bulk modulus Ec/3(1 – 2υc) Pa
cp heat capacity 1000 J/K
dT/dz thermal gradient 0.03 K/m
Tc column temperature –0.043∙z + 400 K
TAPMB APMB temperature 1243 K
Q lower domain boundary heat flux 0.09 W/m2 W/m2
Note: APMB—Altiplano-Puna magma body.
Research Paper
10Gottsmann et al. | Mush reorganization at UturuncuGEOSPHERE | Volume 13 | Number 4
magma storage conditions for Uturuncu dacites (Muir et al., 2014b). However, the temperature is considerably lower than the pre-eruptive storage tempera-ture of the last erupted dacites of Uturuncu at 870 °C (1143 K; Muir et al., 2014a) due to secular cooling of the shallow magmatic reservoir over the past 250 k.y. (Fig. 4).
To prescribe thermal boundary conditions to the entire subvolcanic plumb-ing system at Uturuncu, we reconcile the petrological temperature and pres-sure data shown in Figure 4 by a linear geotherm of 43 K/km between sea level and the top of the APMB. The resultant temperature distribution across all modeling domains is shown in Figure 7A.
Viscoelasticity
The deduced thermal structure beneath the APVC implies that the mechani-cal response of the middle and upper crust at low strain rates is time depen-dent. Here we adopt viscoelastic mechanical behavior using a generalized Maxwell model (for details see Del Negro et al., 2009; Hickey and Gottsmann, 2014). This parameterization consists of one elastic branch, where the mechan-ical response of the medium is governed by its shear modulus,
G = G0 × m0, (7)
and one viscoelastic branch with a characteristic relaxation time
t0 = h/(G0m1). (8)
G0 is E /2(1 + n), h is the viscosity and m1 = m0 = 0.5 are fractional components of the shear modulus; h is parameterized by the Arrhenius approximation
h = Ae(H/RT), (9)
where A is a constant, H is the activation energy, R is the gas constant, and T is the temperature in K (see Table 2). Figure 7B shows the derived viscosity and relaxation time versus temperature relationship for the crustal rheology.
DEFORMATION DATA
InSAR Tracks and Representative Profiles of Deformation
Independent analyses of all available stripmap C-band InSAR data for Uturuncu from the ERS-1/2 and Envisat satellites, spanning May 1992 to Jan-uary 2011, were presented in Fialko and Pearse (2012) and Henderson and Pritchard (2013). However, there are differences in the data analyzed. Both papers analyzed tracks 282, 10 (both beam 2 for Envisat), and 89 (beam 6 from Envisat only), but Fialko and Pearse (2012) included ScanSAR (scanning syn-thetic aperture radar) mode Envisat data for track 89, giving additional obser-vations, and Henderson and Pritchard (2013) also included track 3 (beam 2 for Envisat). Models here are compared against stacked InSAR data from these two studies using all four tracks: two ascending tracks (89 and 3), and two descend ing tracks (282 and 10). This data set provides maps of average sur-
face ground velocities at ~700 × 700 m2 resolution with estimated uncertainties of ± 0.4 cm/yr (Henderson and Pritchard, 2013). Each velocity measurement is in the radar LOS, which is sensitive predominantly to vertical, but also hori-zontal, ground motions. The uplift zone and surrounding moat of subsidence extend ~80–100 km from the center of deformation (Fig. 2).
Axisymmetric finite element models produce a single profile of displace-ment with Uz (vertical) and Ur (radial) components, which can be compared to any profile extracted from InSAR data by projecting the model output into the radar LOS. The projection is determined by satellite heading and incidence angles (Table 3), which change by <1° and 10°, respectively, within a given InSAR track. For a given azimuth, b, from the center of deformation, model output is compared to LOS according to:
ULOS = a × Uz + b × Ur × cosb + c × Ur × sinb, (10)
where the coefficients a, b, and c map vertical, east-west, and north-south dis-placement components, respectively, into the radar LOS (e.g., Wright et al., 2004). Because of the north-south orbits of InSAR satellites, north-south motions are not well mapped to LOS: for example, <10% of north-south dis-placement vectors are mapped into the LOS for Envisat beam 2. East-west displace ments are mapped more efficiently (30%–40% for beam 2), but a purely east-west transect does not include the full footprint of surface deformation. We therefore average InSAR measurements both radially and azimuthally from the center of deformation in order to extract representative profiles of the entire west and east sides of deformation. We then treat our model output as being along an east-west profile such that
ULOS = a × Uz + b × Ur. (11)
Vertical and Radial Components from InSAR Inversion
With the four independent viewing geometries from InSAR data, we solve for vertical, east-west, and north-south components of deformation to com-pare with model output. However, given the insensitivity to north-south dis-placements, we use profiles from an east-west swath (10 km north and south of the center of deformation) to solve for vertical and radial deformation com-ponents. Our derivation of the radial and vertical components is achieved with different combinations of InSAR data, such that results include a range of permissible profiles. Therefore, our model output is compared against these bounds rather than a single specific profile.
Temporal Deformation Constraints from Geodetic Data
Fialko and Pearse (2012) and Henderson and Pritchard (2013) interpreted time series of InSAR data as reflecting a linear rate of uplift ~1 cm/yr between 1992 and 2011 (Appendix Fig. A2 in Appendix 1). However, continuous GPS data confirm a much reduced uplift (Appendix Fig. A1 in Appendix 1) between 2010 and 2015.
Research Paper
11Gottsmann et al. | Mush reorganization at UturuncuGEOSPHERE | Volume 13 | Number 4
The linear rates determined by InSAR are averages, and may be tem porally aliased because of the infrequent observations. Short-term changes in the defor ma tion rate could have been missed. All of the InSAR tracks have periods without observations spanning 1–2 yr, and the scatter of cumulative deforma-tion about the best-fitting rate may reflect true displacements or simply noise (Appendix Fig. A2 in Appendix 1). The stacked profiles in Figure 2 present ad-ditional evidence for a variable rate of deformation. Independently processed ascending data for track 89 (Henderson and Pritchard, 2013; Fialko and Pearse, 2012) span the same time range, and match very well. However, the uplift rate determined from descending data from track 282 (Fig. 3) changes significantly for three separate time ranges. The red profile, extracted from a single inter-ferogram of ERS data from 12 August 1995 to 31 July 2005, has a much higher rate of defor ma tion (1.1 ± 0.1 cm/yr) compared to that in more recent Envisat data in the same viewing geometry (0.7 ± 0.1 cm/yr, 2003–2011) or the average 1995–2011 rate (0.8 ± 0.1 cm/yr).
In summary, we seek models that produce an average uplift rate of ~1 cm/yr (but that varies depending on the satellite track) over two decades. However, the models are allowed to have significant variation about this trend on annual time scales. With this in mind, plausible models should be capable of produc-ing significant changes in uplift rate over several years, including a significant decline in uplift rate after 2010.
DATA MODELING
Time-Dependent Pressure Histories
To match the observations that uplift rates in the center of the deformation may vary on annual time scales about an average rate of 1.05 ± 0.1 cm/yr be-tween 1992 and 2011 and 0.24 ± 0.19 cm/yr between 2011 and 2015, we devise a nonlinear source pressurization term over time. This term introduces piece-meal increments of a dimensionless pressure factor a (shown in Fig. 8A) with smoothed onsets using a continuous first derivative function of a with respect to time, t (i.e., ∂/∂t). In combination with an initial boundary pressure load ap-plied to the respective source domains the term then produces a scaled and stepped pressurization history. The pressure factor versus time history (Pvt1)
A
B
Figure 8. Invoked pressure factor versus time (P vt ) histories. The pressure factor scales initial pressure loads on the reservoir boundaries as a function of time. (A) P vt1 that represents the history of the best-fit pressure loads in Figure 10 and the best-fit model in Fig 14. (B) Exploratory histories P vt2 and P vt3 for reservoir depressurization.
TABLE 3. AVERAGE VIEWING GEOMETRY OF FOUR INTERFEROMETRIC SYNTHETIC APERTURE RADAR TRACKS, AND COEFFICIENTS MAPPING CARTESIAN MODEL OUTPUT TO RADAR LINE OF SIGHT ACCORDING TO TEXT EQUATION 10
Track Beam θ (incidence) α (heading) a (z2los) b (ew2los) c (ns2los)
282 2 22.8 –167.7 –0.92 –0.38 0.08
10 2 20.2 –167.5 –0.94 –0.34 0.07
3 2 20 –13.6 –0.94 0.33 0.08
89 6 41.1 –13 –0.75 0.64 0.15
Research Paper
12Gottsmann et al. | Mush reorganization at UturuncuGEOSPHERE | Volume 13 | Number 4
shown in Figure 8A includes 4 pressure pulses over 20 yr and reflects the ap-plied history of the best-fit model.
Considering that there is no long-term (>100 yr) record of residual uplift from the Uturuncu deformation pattern (Perkins et al., 2016), we also test whether uplift is reversible in our model; i.e.; whether the ground uplift trig-ger by pressurization can be reversed by an equal amount of depressuriza-tion. In the absence of observational constraints to determine a depressur-ization history, we simulate depressurization for a period of 30 yr after the end of pressurization (at t = 20 yr) by a either a stepwise depressurization using a pressure factor parameterization (Pvt2) or a linear depressurization (Pvt3; Fig. 8B).
Model Fitness
To test model fitness we collapse LOS annual ground velocity data from 8 profiles of descending tracks 10 and 282 (Figs. 2 and 3) across the deforma-tion anomaly into the axisymmetric modeling domain using a manual iterative process. Ascending orbital LOS data are not used initially for goodness-of-fit tests because they are noisier, but are compared with the final model predic-tions, and so serve as an independent test. Similarly, we compare the model predictions to the radial and vertical velocities at the end of the iterative pro-cess. We extrapolate the annual descending velocity data linearly over a 20 yr time frame to obtain a data set that covers the time frame of available satellite geodetic data. This way we can test for time dependence in surface strain par-titioning by inelastic responses of the crust.
PARAMETER SPACE EXPLORATION AND RESULTS
Geometry of Magmatic Plumbing System
Single Pressure Source—A Cylindrical Vertical Column
The initial numerical model invoked the pressurization of a single rec-tangular-shaped column (creating a flat-topped cylinder by rotation about its long axis; Figs. 5, 7A, and 9A) by a finite pressure load. This model re-produced the amplitude of observed ground uplift but did not reproduce the observed peripheral ground subsidence. While some subsidence occurred as a result of time-dependent viscous response of the crust to accommodate the stresses induced by the pressurization, the amplitude of this subsidence was only ~2% of the maximum uplift. This result contrasts with the observed LOS subsidence amplitude of 6%–20% of the maximum LOS uplift. Thus pres-sure transients within a single and rootless column beneath Uturuncu (i.e., not attached or mechanically coupled to a deeper body) cannot explain the observed ground deformation pattern. We hence abandon further exploration of a rootless column.
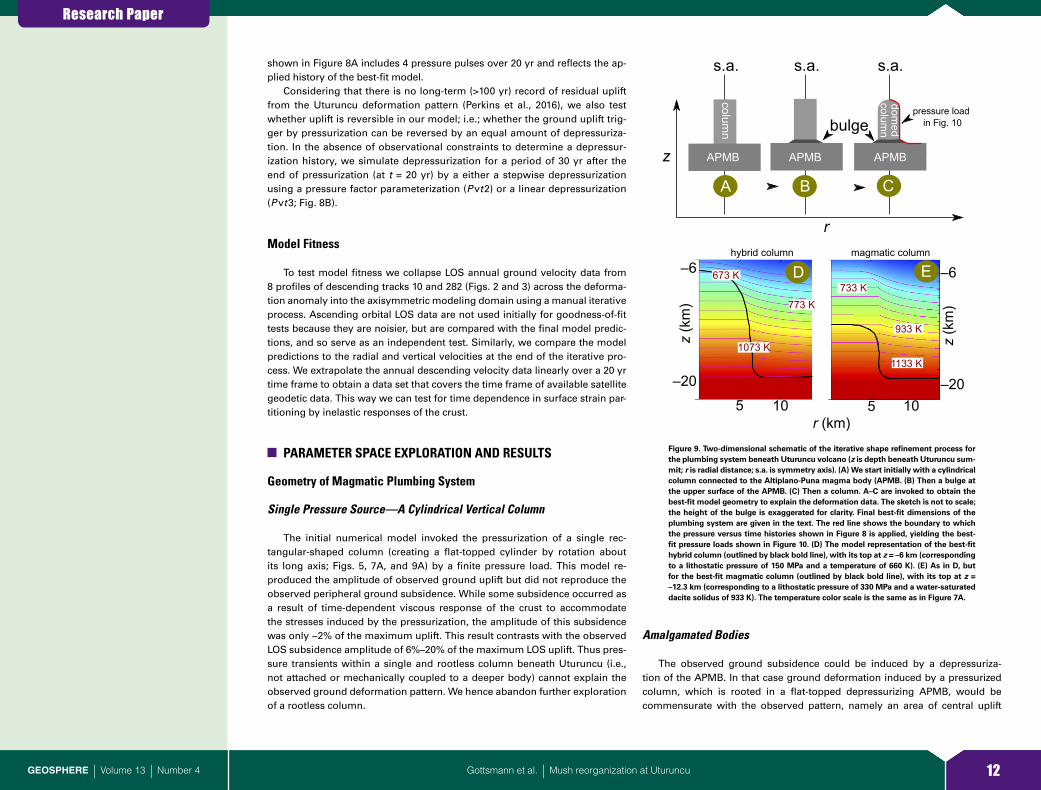
Amalgamated Bodies
The observed ground subsidence could be induced by a depressuriza-tion of the APMB. In that case ground deformation induced by a pressurized column, which is rooted in a flat-topped depressurizing APMB, would be commensurate with the observed pattern, namely an area of central uplift
s.a. s.a.
APMB APMB APMB
s.a.
column bulge
domed
column
A B C
pressure load in Fig. 10
r
z
5 10
–6
–20
r (km)
z (k
m)
673 K
1073 K
5 5
773 K
933 K
733 K
1133 K
10
D E
–20
–6
z (k
m)
hybrid column magmatic column
Figure 9. Two-dimensional schematic of the iterative shape refinement process for the plumbing system beneath Uturuncu volcano (z is depth beneath Uturuncu sum-mit; r is radial distance; s.a. is symmetry axis). (A) We start initially with a cylindrical column connected to the Altiplano-Puna magma body (APMB. (B) Then a bulge at the upper surface of the APMB. (C) Then a column. A–C are invoked to obtain the best-fit model geometry to explain the deformation data. The sketch is not to scale; the height of the bulge is exaggerated for clarity. Final best-fit dimensions of the plumbing system are given in the text. The red line shows the boundary to which the pressure versus time histories shown in Figure 8 is applied, yielding the best-fit pressure loads shown in Figure 10. (D) The model representation of the best-fit hybrid column (outlined by black bold line), with its top at z = –6 km (corresponding to a lithostatic pressure of 150 MPa and a temperature of 660 K). (E) As in D, but for the best-fit magmatic column (outlined by black bold line), with its top at z = –12.3 km (corresponding to a lithostatic pressure of 330 MPa and a water-saturated dacite solidus of 933 K). The temperature color scale is the same as in Figure 7A.
Research Paper
13Gottsmann et al. | Mush reorganization at UturuncuGEOSPHERE | Volume 13 | Number 4
surrounded by a moat of subsidence. The predicted transition from uplift to subsidence occurs at a distance of ~6 km from the center of uplift and matches approximately the radial dimension of the column. However, it is crucial that the observed moat of subsidence is located at a distance of ~40–45 km from the center of uplift.
Although pressurization of a column with a radius of 40–45 km coupled with a depressurization of the APMB might explain the observations, we have discounted this scenario for lack of any geophysical evidence of a large shal-low body with a diameter of ≥80 km immediately beneath Uturuncu.
In keeping with the dimensions of the anomalous potential field ver-tical structure (6–12 km radius, 8–12 km vertical extent above the mean APMB depth), we then explored the scenario of a conically shaped APMB, with its cusp directly beneath the base of the column, in generating strains that can explain the observed distance between the center of uplift and the moat of subsidence. We found that although a depressurizing conical APMB achieves some subsidence, neither its footprint nor its amplitude matches the observations.
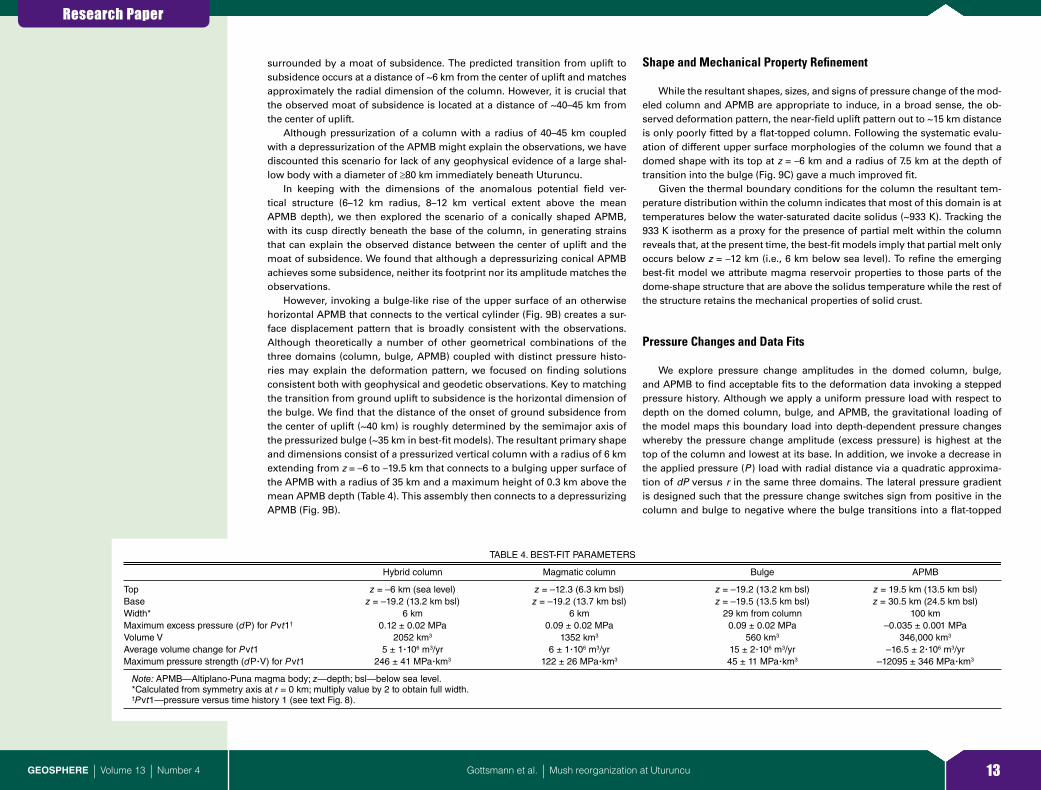
However, invoking a bulge-like rise of the upper surface of an otherwise horizontal APMB that connects to the vertical cylinder (Fig. 9B) creates a sur-face displacement pattern that is broadly consistent with the observations. Although theoretically a number of other geometrical combinations of the three domains (column, bulge, APMB) coupled with distinct pressure histo-ries may explain the deformation pattern, we focused on finding solutions consistent both with geophysical and geodetic observations. Key to matching the transition from ground uplift to subsidence is the horizontal dimension of the bulge. We find that the distance of the onset of ground subsidence from the center of uplift (~40 km) is roughly determined by the semimajor axis of the pressurized bulge (~35 km in best-fit models). The resultant primary shape and dimensions consist of a pressurized vertical column with a radius of 6 km extending from z = –6 to –19.5 km that connects to a bulging upper surface of the APMB with a radius of 35 km and a maximum height of 0.3 km above the mean APMB depth (Table 4). This assembly then connects to a depressurizing APMB (Fig. 9B).
Shape and Mechanical Property Refinement
While the resultant shapes, sizes, and signs of pressure change of the mod-eled column and APMB are appropriate to induce, in a broad sense, the ob-served deformation pattern, the near-field uplift pattern out to ~15 km distance is only poorly fitted by a flat-topped column. Following the systematic evalu-ation of different upper surface morphologies of the column we found that a domed shape with its top at z = –6 km and a radius of 7.5 km at the depth of transition into the bulge (Fig. 9C) gave a much improved fit.
Given the thermal boundary conditions for the column the resultant tem-perature distribution within the column indicates that most of this domain is at temperatures below the water-saturated dacite solidus (~933 K). Tracking the 933 K isotherm as a proxy for the presence of partial melt within the column reveals that, at the present time, the best-fit models imply that partial melt only occurs below z = –12 km (i.e., 6 km below sea level). To refine the emerging best-fit model we attribute magma reservoir properties to those parts of the dome-shape structure that are above the solidus temperature while the rest of the structure retains the mechanical properties of solid crust.
Pressure Changes and Data Fits
We explore pressure change amplitudes in the domed column, bulge, and APMB to find acceptable fits to the deformation data invoking a stepped pressure history. Although we apply a uniform pressure load with respect to depth on the domed column, bulge, and APMB, the gravitational loading of the model maps this boundary load into depth-dependent pressure changes whereby the pressure change amplitude (excess pressure) is highest at the top of the column and lowest at its base. In addition, we invoke a decrease in the applied pressure (P ) load with radial distance via a quadratic approxima-tion of dP versus r in the same three domains. The lateral pressure gradient is designed such that the pressure change switches sign from positive in the column and bulge to negative where the bulge transitions into a flat-topped
TABLE 4. BEST-FIT PARAMETERS
Hybrid column Magmatic column Bulge APMB
Top z = –6 km (sea level) z = –12.3 (6.3 km bsl) z = –19.2 (13.2 km bsl) z = 19.5 km (13.5 km bsl)Base z = –19.2 (13.2 km bsl) z = –19.2 (13.7 km bsl) z = –19.5 (13.5 km bsl) z = 30.5 km (24.5 km bsl)Width* 6 km 6 km 29 km from column 100 kmMaximum excess pressure (dP) for Pvt1† 0.12 ± 0.02 MPa 0.09 ± 0.02 MPa 0.09 ± 0.02 MPa –0.035 ± 0.001 MPaVolume V 2052 km3 1352 km3 560 km3 346,000 km3
Average volume change for Pvt1 5 ± 1∙106 m3/yr 6 ± 1∙106 m3/yr 15 ± 2∙106 m3/yr –16.5 ± 2∙106 m3/yrMaximum pressure strength (dP∙V) for Pvt1 246 ± 41 MPa∙km3 122 ± 26 MPa∙km3 45 ± 11 MPa∙km3 –12095 ± 346 MPa∙km3
Note: APMB—Altiplano-Puna magma body; z—depth; bsl—below sea level.*Calculated from symmetry axis at r = 0 km; multiply value by 2 to obtain full width.†Pvt1—pressure versus time history 1 (see text Fig. 8).

Research Paper
14Gottsmann et al. | Mush reorganization at UturuncuGEOSPHERE | Volume 13 | Number 4
surrounding APMB. Effectively, this procedure simulates a vertical and lat-eral pressure gradient within the plumbing system along which material flow would be possible. As a result the column and bulge undergo net pressuriza-tion with respect to lithostatic pressure, while the surrounding APMB under-goes net depressurization.
In addition to the pressurized bulge and depressurized APMB, we find that the deformation data can be reproduced at equal qualities of fit by two end-member models. (1) A pressurized domed column whose vertical extent is defined by the potential field studies with its top extending to the BDTZ at z = –6 km represents a hybrid structure (hereafter termed hybrid column; Fig. 9D) composed of a suprasolidus, crystal-rich magma reservoir in its lower part and an anomalously hot, but subsolidus, body in its central and upper parts. (2) A pressurized domed column whose top is defined by the solidus isotherm at z = –12 km is a magmatic column that largely represents an igneous mush (Fig. 9E) and may denote the uppermost limit of the APMB according to the seismic data of Ward et al. (2014).
The resultant initial pressure change boundary conditions (in Pa) for the entire plumbing system (AMPB, bulge, APMB, and magmatic or hybrid col-umns) is derived by a residual minimization procedure between modeled and observed ground deformation to give
dP = 95,000 – 4.3 × r + 4.5 × 10⁻⁵ × r 2 (12)
for the case of a magmatic column and
dP = 88,800 – 4.2 × r + 4.1 × 10⁻⁵ × r 2 (13)
for the case of a hybrid column for 0 < r < 70000 m. These initial conditions are then modulated by the time-dependent best-fit pressure factor function (Pvt1; Fig. 8) to yield the best-fit time-dependent boundary pressure loads shown in Figure 10. The resultant initial elastic pressure increments then map into sur-face strains via the time-dependent crustal rheology.
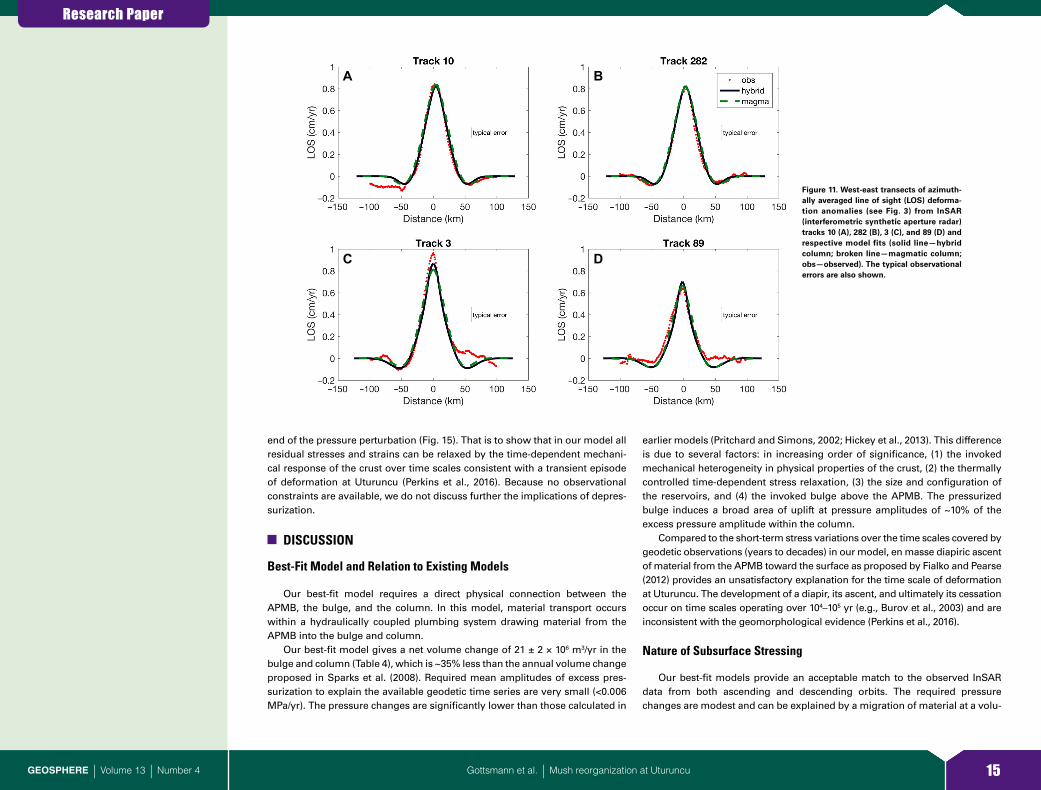
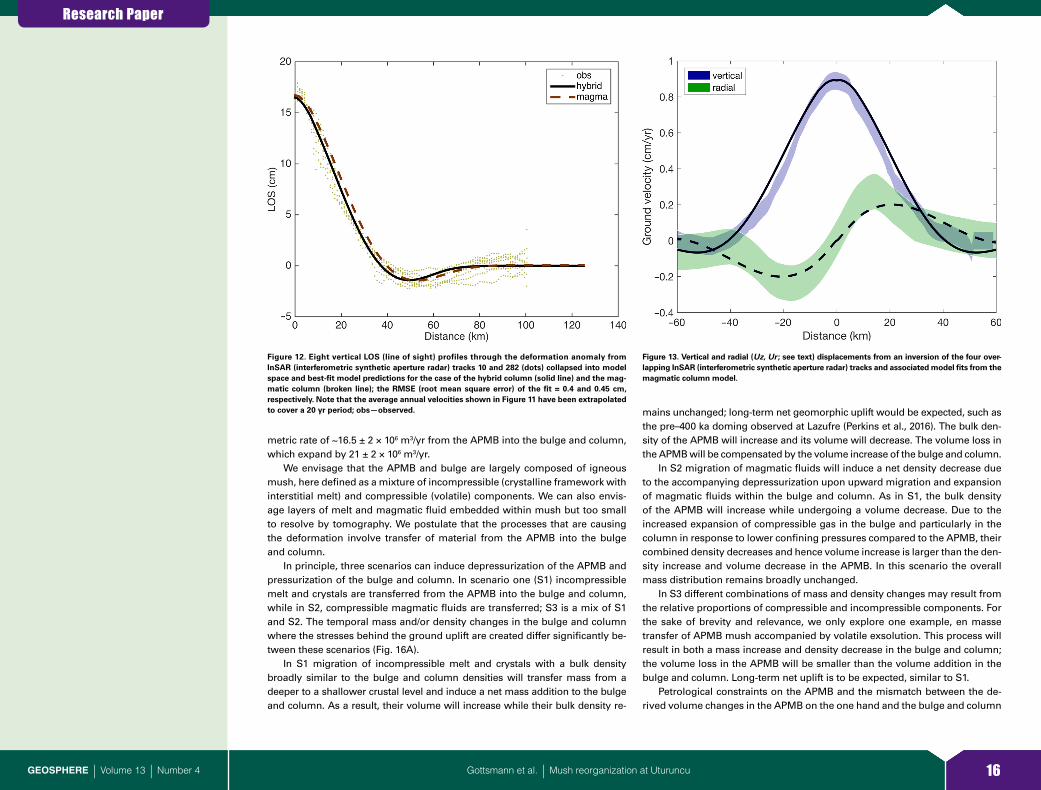
Figure 11 displays the overall fit of the LOS deformation prediction from the models to all InSAR data within a 2D axisymmetric representation of LOS defor ma tion as a function of distance from the maximum uplift. Figure 12 shows the resultant model fits along west-east profiles of the four different InSAR tracks. Decomposing the observed annual LOS data into vertical and radial displacement velocities yields a quasi-symmetric pattern of deformation about the area of maximum uplift (Fig. 13). By mirroring the vertical and hori-zontal components of the predicted deformation field from the best-fit models along an east-west profile we can demonstrate that our models achieve an acceptable match to the observed data within the observational uncertainties (Fig. 13). In the best-fit scenarios the bulge, magmatic column, or hybrid col-umn undergo the following volume increases, respectively: 15 ± 2 × 10⁶ m3/yr, 6 ± 1 × 10⁶ m3/yr, and 5 ± 1 × 10⁶ m3/yr (Table 4). The uncertainties are derived from least-square fits to volume changes derived from model predictions com-pared to the observed ground deformation data.
Deformation History—Pressurization
Trimonthly snapshots of the simulated maximum ground deformation show a nonlinear evolution over the 20 yr modeling window (Fig. 14). This reflects the response of the ground surface to both initial elastic stressing and subsequent time-dependent stress relaxation. The parameterization of the re-laxation time described in Equation 8 coupled with the applied pressure loads shown in Figure 10 provides a time-dependent deformation history that, by linear fitting, is broadly consistent with the observed mean annual surface veloc ity of 1 cm/yr (Appendix Fig. A2 in Appendix 1).
Deformation History—Depressurization
Invoking the depressurization-time histories (Pvt2 and Pvt3), whereby the reservoir pressure gradually diminishes with time, we find that for both histo-ries the net ground deformation approaches zero within a few years after the
A
B
Figure 10. Best-fit pressure loads as a function of radial distance r invoked on the plumbing system over time, t, from t = 0 yr to t = 20 yr using parameterization of Equations 12 and 13. (A) The parameterization for the hybrid column. (B) The param-eterization for the magmatic column.
Research Paper
15Gottsmann et al. | Mush reorganization at UturuncuGEOSPHERE | Volume 13 | Number 4
end of the pressure perturbation (Fig. 15). That is to show that in our model all residual stresses and strains can be relaxed by the time-dependent mechani-cal response of the crust over time scales consistent with a transient episode of deformation at Uturuncu (Perkins et al., 2016). Because no observational constraints are available, we do not discuss further the implications of depres-surization.
DISCUSSION
Best-Fit Model and Relation to Existing Models
Our best-fit model requires a direct physical connection between the APMB, the bulge, and the column. In this model, material transport occurs within a hydraulically coupled plumbing system drawing material from the APMB into the bulge and column.
Our best-fit model gives a net volume change of 21 ± 2 × 10⁶ m3/yr in the bulge and column (Table 4), which is ~35% less than the annual volume change proposed in Sparks et al. (2008). Required mean amplitudes of excess pres-surization to explain the available geodetic time series are very small (<0.006 MPa/yr). The pressure changes are significantly lower than those calculated in
earlier models (Pritchard and Simons, 2002; Hickey et al., 2013). This difference is due to several factors: in increasing order of significance, (1) the invoked mechanical heterogeneity in physical properties of the crust, (2) the thermally controlled time-dependent stress relaxation, (3) the size and configuration of the reservoirs, and (4) the invoked bulge above the APMB. The pressurized bulge induces a broad area of uplift at pressure amplitudes of ~10% of the excess pressure amplitude within the column.
Compared to the short-term stress variations over the time scales covered by geodetic observations (years to decades) in our model, en masse diapiric ascent of material from the APMB toward the surface as proposed by Fialko and Pearse (2012) provides an unsatisfactory explanation for the time scale of deformation at Uturuncu. The development of a diapir, its ascent, and ultimately its cessation occur on time scales operating over 104–105 yr (e.g., Burov et al., 2003) and are inconsistent with the geomorphological evidence (Perkins et al., 2016).
Nature of Subsurface Stressing
Our best-fit models provide an acceptable match to the observed InSAR data from both ascending and descending orbits. The required pressure changes are modest and can be explained by a migration of material at a volu-
A B
C D
Figure 11. West-east transects of azimuth-ally averaged line of sight (LOS) deforma-tion anomalies (see Fig. 3) from InSAR (interferometric synthetic aperture radar) tracks 10 (A), 282 (B), 3 (C), and 89 (D) and respective model fits (solid line—hybrid column; broken line—magmatic column; obs—observed). The typical observational errors are also shown.
Research Paper
16Gottsmann et al. | Mush reorganization at UturuncuGEOSPHERE | Volume 13 | Number 4
metric rate of ~16.5 ± 2 × 10⁶ m3/yr from the APMB into the bulge and column, which expand by 21 ± 2 × 10⁶ m3/yr.
We envisage that the APMB and bulge are largely composed of igneous mush, here defined as a mixture of incompressible (crystalline framework with interstitial melt) and compressible (volatile) components. We can also envis-age layers of melt and magmatic fluid embedded within mush but too small to resolve by tomography. We postulate that the processes that are causing the deformation involve transfer of material from the APMB into the bulge and column.
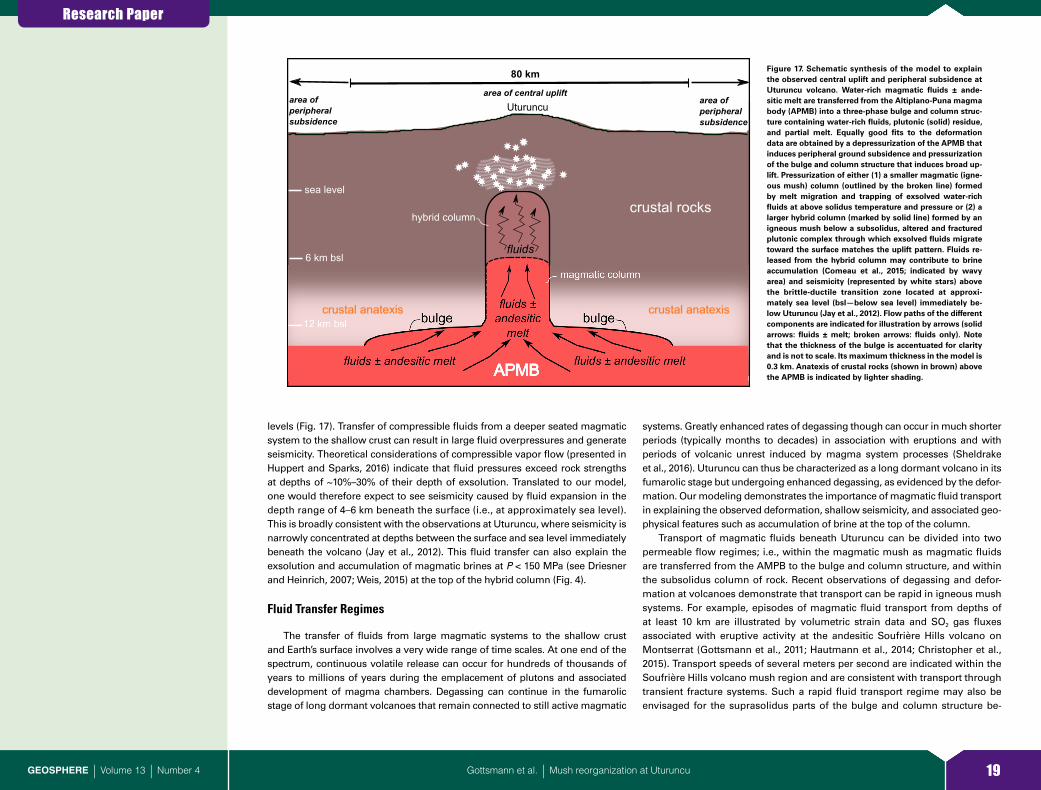
In principle, three scenarios can induce depressurization of the APMB and pressurization of the bulge and column. In scenario one (S1) incompressible melt and crystals are transferred from the APMB into the bulge and column, while in S2, compressible magmatic fluids are transferred; S3 is a mix of S1 and S2. The temporal mass and/or density changes in the bulge and column where the stresses behind the ground uplift are created differ significantly be-tween these scenarios (Fig. 16A).
In S1 migration of incompressible melt and crystals with a bulk density broadly similar to the bulge and column densities will transfer mass from a deeper to a shallower crustal level and induce a net mass addition to the bulge and column. As a result, their volume will increase while their bulk density re-
mains unchanged; long-term net geomorphic uplift would be expected, such as the pre–400 ka doming observed at Lazufre (Perkins et al., 2016). The bulk den-sity of the APMB will increase and its volume will decrease. The volume loss in the APMB will be compensated by the volume increase of the bulge and column.
In S2 migration of magmatic fluids will induce a net density decrease due to the accompanying depressurization upon upward migration and expansion of magmatic fluids within the bulge and column. As in S1, the bulk density of the APMB will increase while undergoing a volume decrease. Due to the increased expansion of compressible gas in the bulge and particularly in the column in response to lower confining pressures compared to the APMB, their combined density decreases and hence volume increase is larger than the den-sity increase and volume decrease in the APMB. In this scenario the overall mass distribution remains broadly unchanged.
In S3 different combinations of mass and density changes may result from the relative proportions of compressible and incompressible components. For the sake of brevity and relevance, we only explore one example, en masse transfer of APMB mush accompanied by volatile exsolution. This process will result in both a mass increase and density decrease in the bulge and column; the volume loss in the APMB will be smaller than the volume addition in the bulge and column. Long-term net uplift is to be expected, similar to S1.
Petrological constraints on the APMB and the mismatch between the de-rived volume changes in the APMB on the one hand and the bulge and column
Figure 12. Eight vertical LOS (line of sight) profiles through the deformation anomaly from InSAR (interferometric synthetic aperture radar) tracks 10 and 282 (dots) collapsed into model space and best-fit model predictions for the case of the hybrid column (solid line) and the mag-matic column (broken line); the RMSE (root mean square error) of the fit = 0.4 and 0.45 cm, respectively. Note that the average annual velocities shown in Figure 11 have been extrapolated to cover a 20 yr period; obs—observed.
Figure 13. Vertical and radial (Uz, Ur ; see text) displacements from an inversion of the four over-lapping InSAR (interferometric synthetic aperture radar) tracks and associated model fits from the magmatic column model.
Research Paper
17Gottsmann et al. | Mush reorganization at UturuncuGEOSPHERE | Volume 13 | Number 4
on the other require a compressible component in the material transfer (i.e., either S2 or S3).
Gravity-height gradient data can help discriminate between these two remaining scenarios. Time-lapse microgravimetric data obtained across the deformation anomaly (see Appendix 2 and Appendix Fig. B1) between 2010 and 2013 do not show any significant changes in gravity beyond the free-air gradient effect (Fig. 16B). This indicates that fundamentally, the overall mass distribution below the anomaly remains the same (within the error of the mea-surements); however, a density decrease must be invoked (Appendix Fig. B2). This broadly matches the conditions proposed in S2 and points toward surface deformation caused predominantly by water-rich magmatic fluid migration in the subsurface (Fig. 17). The modeled volume increase in the (hybrid or mag-matic) column and the bulge amounts to ~21 × 106 m3/yr. With a total volume of 2600 km3 for the hybrid column and bulge (or 1900 km3 for the magmatic column and bulge), this annual volume change amounts to ~0.001% of their combined volumes. Most (~75%) of this volume addition occurs in the bulge that translates into the wide footprint of the uplifted area (~70 km in diameter).
However, the largest excess pressure is in the upper part of the column at con-fining pressures of ~150 MPa for the case of the hybrid column and ~330 MPa for the case of the magmatic column.
Magmatic Column
The requisite volume increase (and density decrease) can be satisfied with a transfer of low-density material (silicate melt and/or H2O-rich fluid) from the APMB into the bulge and column (Fig. 17). Two kinds of silicate melt could ema nate from the APMB: dacite of the type erupted predominantly at Uturuncu and thought to form in response to crustal melting and hybridization atop the APMB, or andesite of the variety recorded as inclusions in Uturuncu dacites and proposed by Laumonier et al. (2017) to be the dominant melt com-position within the APMB. The key difference between the two kinds of melt is in their dissolved H2O content, which in turn determines the depth at which they would exsolve a water-rich magmatic volatile phase. Uturuncu dacites are water undersaturated, containing ≤4 wt% H2O (Muir et al., 2014b) and would not exsolve H2O until ~100 MPa confining pressure. Conversely, the andesite
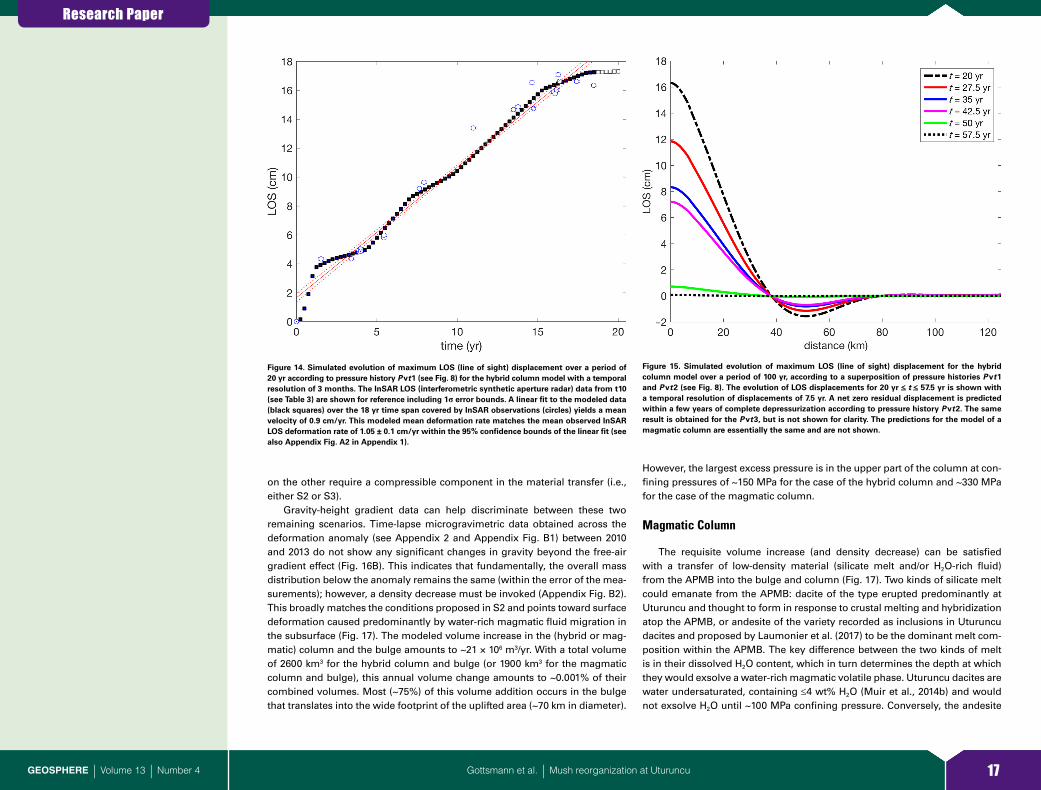
Figure 14. Simulated evolution of maximum LOS (line of sight) displacement over a period of 20 yr according to pressure history Pvt1 (see Fig. 8) for the hybrid column model with a temporal resolution of 3 months. The InSAR LOS (interferometric synthetic aperture radar) data from t10 (see Table 3) are shown for reference including 1σ error bounds. A linear fit to the modeled data (black squares) over the 18 yr time span covered by InSAR observations (circles) yields a mean velocity of 0.9 cm/yr. This modeled mean deformation rate matches the mean observed InSAR LOS deformation rate of 1.05 ± 0.1 cm/yr within the 95% confidence bounds of the linear fit (see also Appendix Fig. A2 in Appendix 1).
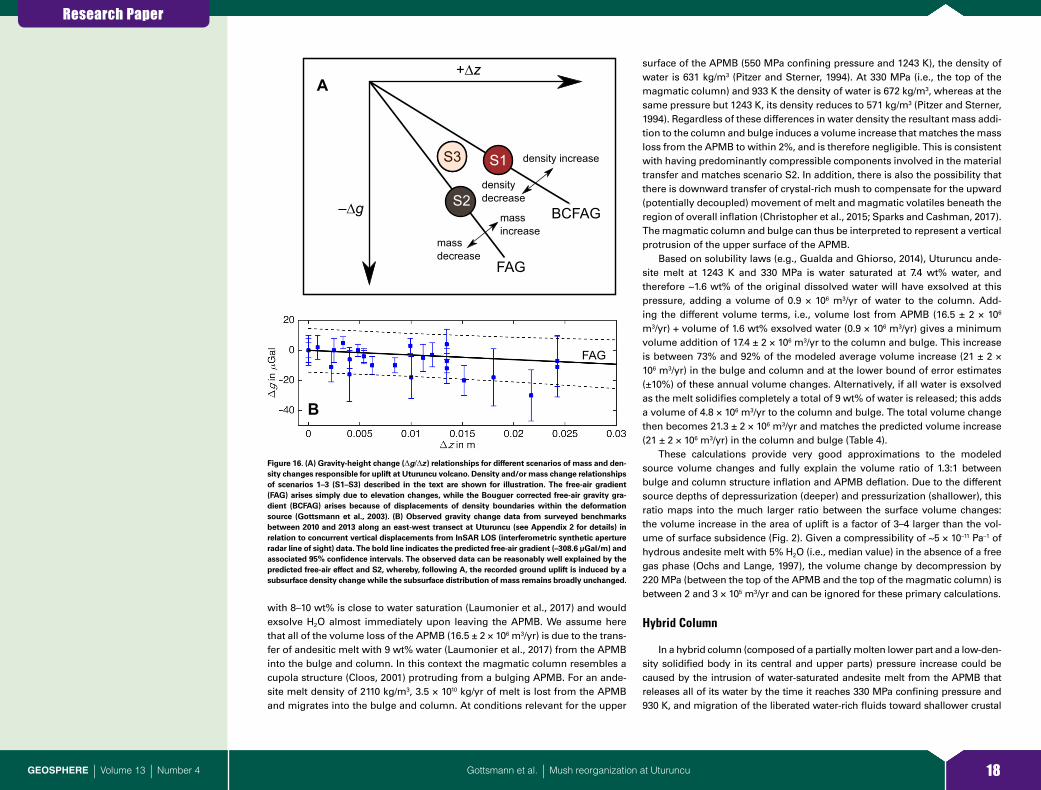
Figure 15. Simulated evolution of maximum LOS (line of sight) displacement for the hybrid column model over a period of 100 yr, according to a superposition of pressure histories P vt1 and P vt2 (see Fig. 8). The evolution of LOS displacements for 20 yr ≤ t ≤ 57.5 yr is shown with a temporal resolution of displacements of 7.5 yr. A net zero residual displacement is predicted within a few years of complete depressurization according to pressure history P vt2. The same result is obtained for the P vt3, but is not shown for clarity. The predictions for the model of a magmatic column are essentially the same and are not shown.
Research Paper
18Gottsmann et al. | Mush reorganization at UturuncuGEOSPHERE | Volume 13 | Number 4
with 8–10 wt% is close to water saturation (Laumonier et al., 2017) and would exsolve H2O almost immediately upon leaving the APMB. We assume here that all of the volume loss of the APMB (16.5 ± 2 × 10⁶ m3/yr) is due to the trans-fer of andesitic melt with 9 wt% water (Laumonier et al., 2017) from the APMB into the bulge and column. In this context the magmatic column resembles a cupola structure (Cloos, 2001) protruding from a bulging APMB. For an ande-site melt density of 2110 kg/m3, 3.5 × 10¹⁰ kg/yr of melt is lost from the APMB and migrates into the bulge and column. At conditions relevant for the upper
surface of the APMB (550 MPa confining pressure and 1243 K), the density of water is 631 kg/m3 (Pitzer and Sterner, 1994). At 330 MPa (i.e., the top of the magmatic column) and 933 K the density of water is 672 kg/m3, whereas at the same pressure but 1243 K, its density reduces to 571 kg/m3 (Pitzer and Sterner, 1994). Regardless of these differences in water density the resultant mass addi-tion to the column and bulge induces a volume increase that matches the mass loss from the APMB to within 2%, and is therefore negligible. This is consistent with having predominantly compressible components involved in the material transfer and matches scenario S2. In addition, there is also the possibility that there is downward transfer of crystal-rich mush to compensate for the upward (potentially decoupled) movement of melt and magmatic volatiles beneath the region of overall inflation (Christopher et al., 2015; Sparks and Cashman, 2017). The magmatic column and bulge can thus be interpreted to represent a vertical protrusion of the upper surface of the APMB.
Based on solubility laws (e.g., Gualda and Ghiorso, 2014), Uturuncu ande-site melt at 1243 K and 330 MPa is water saturated at 7.4 wt% water, and therefore ~1.6 wt% of the original dissolved water will have exsolved at this pressure, adding a volume of 0.9 × 10⁶ m3/yr of water to the column. Add-ing the different volume terms, i.e., volume lost from APMB (16.5 ± 2 × 10⁶ m3/yr) + volume of 1.6 wt% exsolved water (0.9 × 10⁶ m3/yr) gives a mini mum volume addition of 17.4 ± 2 × 10⁶ m3/yr to the column and bulge. This increase is between 73% and 92% of the modeled average volume increase (21 ± 2 × 10⁶ m3/yr) in the bulge and column and at the lower bound of error estimates (±10%) of these annual volume changes. Alternatively, if all water is exsolved as the melt solidifies completely a total of 9 wt% of water is released; this adds a volume of 4.8 × 10⁶ m3/yr to the column and bulge. The total volume change then becomes 21.3 ± 2 × 10⁶ m3/yr and matches the predicted volume increase (21 ± 2 × 10⁶ m3/yr) in the column and bulge (Table 4).
These calculations provide very good approximations to the modeled source volume changes and fully explain the volume ratio of 1.3:1 between bulge and column structure inflation and APMB deflation. Due to the different source depths of depressurization (deeper) and pressurization (shallower), this ratio maps into the much larger ratio between the surface volume changes: the volume increase in the area of uplift is a factor of 3–4 larger than the vol-ume of surface subsidence (Fig. 2). Given a compressibility of ~5 × 10–11 Pa–1 of hydrous andesite melt with 5% H2O (i.e., median value) in the absence of a free gas phase (Ochs and Lange, 1997), the volume change by decompression by 220 MPa (between the top of the APMB and the top of the magmatic column) is between 2 and 3 × 10⁵ m3/yr and can be ignored for these primary calculations.
Hybrid Column
In a hybrid column (composed of a partially molten lower part and a low-den-sity solidified body in its central and upper parts) pressure increase could be caused by the intrusion of water-saturated andesite melt from the APMB that releases all of its water by the time it reaches 330 MPa confining pressure and 930 K, and migration of the liberated water-rich fluids toward shallower crustal
+∆z
FAG
BCFAG
massdecrease
massincrease
densitydecrease
density increase
–∆g
FAG
B
A
S1
S2
S3S3
Figure 16. (A) Gravity-height change (∆g/∆z) relationships for different scenarios of mass and den-sity changes responsible for uplift at Uturuncu volcano. Density and/or mass change relationships of scenarios 1–3 (S1–S3) described in the text are shown for illustration. The free-air gradient (FAG) arises simply due to elevation changes, while the Bouguer corrected free-air gravity gra-dient (BCFAG) arises because of displacements of density boundaries within the deformation source (Gottsmann et al., 2003). (B) Observed gravity change data from surveyed benchmarks between 2010 and 2013 along an east-west transect at Uturuncu (see Appendix 2 for details) in relation to concurrent vertical displacements from InSAR LOS (interferometric synthetic aperture radar line of sight) data. The bold line indicates the predicted free-air gradient (–308.6 µGal/m) and associated 95% confidence intervals. The observed data can be reasonably well explained by the predicted free-air effect and S2, whereby, following A, the recorded ground uplift is induced by a subsurface density change while the subsurface distribution of mass remains broadly unchanged.
Research Paper
19Gottsmann et al. | Mush reorganization at UturuncuGEOSPHERE | Volume 13 | Number 4
levels (Fig. 17). Transfer of compressible fluids from a deeper seated magmatic system to the shallow crust can result in large fluid overpressures and generate seismicity. Theoretical considerations of compressible vapor flow (presented in Huppert and Sparks, 2016) indicate that fluid pressures exceed rock strengths at depths of ~10%–30% of their depth of exsolution. Translated to our model, one would therefore expect to see seismicity caused by fluid expansion in the depth range of 4–6 km beneath the surface (i.e., at approximately sea level). This is broadly consistent with the observations at Uturuncu, where seismicity is narrowly concentrated at depths between the surface and sea level immediately beneath the volcano (Jay et al., 2012). This fluid transfer can also explain the exso lu tion and accumulation of magmatic brines at P < 150 MPa (see Driesner and Heinrich, 2007; Weis, 2015) at the top of the hybrid column (Fig. 4).
Fluid Transfer Regimes
The transfer of fluids from large magmatic systems to the shallow crust and Earth’s surface involves a very wide range of time scales. At one end of the spectrum, continuous volatile release can occur for hundreds of thousands of years to millions of years during the emplacement of plutons and associated development of magma chambers. Degassing can continue in the fumarolic stage of long dormant volcanoes that remain connected to still active magmatic
systems. Greatly enhanced rates of degassing though can occur in much shorter periods (typically months to decades) in association with eruptions and with periods of volcanic unrest induced by magma system processes (Sheldrake et al., 2016). Uturuncu can thus be characterized as a long dormant volcano in its fumarolic stage but undergoing enhanced degassing, as evidenced by the defor-mation. Our modeling demonstrates the importance of magmatic fluid transport in explaining the observed deformation, shallow seismicity, and associated geo-physi cal features such as accumulation of brine at the top of the column.
Transport of magmatic fluids beneath Uturuncu can be divided into two permeable flow regimes; i.e., within the magmatic mush as magmatic fluids are transferred from the AMPB to the bulge and column structure, and within the subsolidus column of rock. Recent observations of degassing and defor-mation at volcanoes demonstrate that transport can be rapid in igneous mush systems. For example, episodes of magmatic fluid transport from depths of at least 10 km are illustrated by volumetric strain data and SO2 gas fluxes associated with eruptive activity at the andesitic Soufrière Hills volcano on Montserrat (Gottsmann et al., 2011; Hautmann et al., 2014; Christopher et al., 2015). Transport speeds of several meters per second are indicated within the Soufrière Hills volcano mush region and are consistent with transport through transient fracture systems. Such a rapid fluid transport regime may also be envisaged for the suprasolidus parts of the bulge and column structure be-
Figure 17. Schematic synthesis of the model to explain the observed central uplift and peripheral subsidence at Uturuncu volcano. Water-rich magmatic fluids ± ande-sitic melt are transferred from the Altiplano-Puna magma body (APMB) into a three-phase bulge and column struc-ture containing water-rich fluids, plutonic (solid) residue, and partial melt. Equally good fits to the deformation data are obtained by a depressurization of the APMB that induces peripheral ground subsidence and pressurization of the bulge and column structure that induces broad up-lift. Pressurization of either (1) a smaller magmatic (igne-ous mush) column (outlined by the broken line) formed by melt migration and trapping of exsolved water-rich fluids at above solidus temperature and pressure or (2) a larger hybrid column (marked by solid line) formed by an igneous mush below a subsolidus, altered and fractured plutonic complex through which exsolved fluids migrate toward the surface matches the uplift pattern. Fluids re-leased from the hybrid column may contribute to brine accumulation (Comeau et al., 2015; indicated by wavy area) and seismicity (represented by white stars) above the brittle-ductile transition zone located at approxi-mately sea level (bsl—below sea level) immediately be-low Uturuncu (Jay et al., 2012). Flow paths of the different components are indicated for illustration by arrows (solid arrows: fluids ± melt; broken arrows: fluids only). Note that the thickness of the bulge is accentuated for clarity and is not to scale. Its maximum thickness in the model is 0.3 km. Anatexis of crustal rocks (shown in brown) above the APMB is indicated by lighter shading.
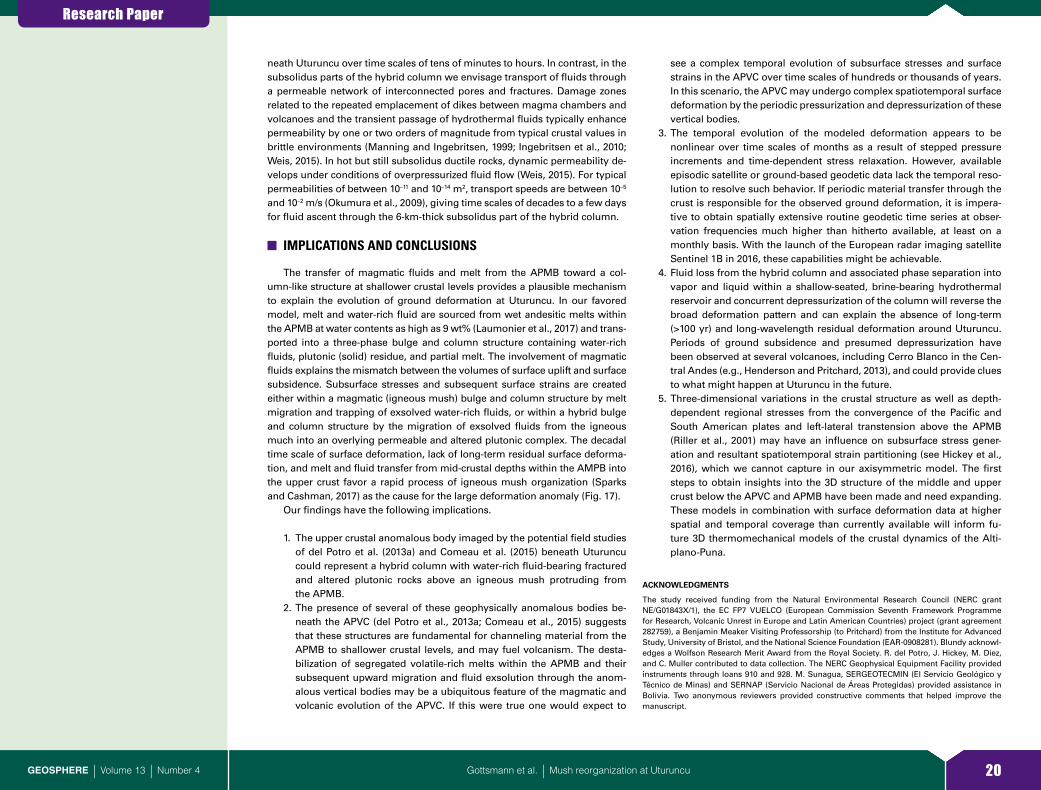
Research Paper
20Gottsmann et al. | Mush reorganization at UturuncuGEOSPHERE | Volume 13 | Number 4
neath Uturuncu over time scales of tens of minutes to hours. In contrast, in the subsolidus parts of the hybrid column we envisage transport of fluids through a permeable network of interconnected pores and fractures. Damage zones related to the repeated emplacement of dikes between magma chambers and volcanoes and the transient passage of hydrothermal fluids typically enhance permeability by one or two orders of magnitude from typical crustal values in brittle environments (Manning and Ingebritsen, 1999; Ingebritsen et al., 2010; Weis, 2015). In hot but still subsolidus ductile rocks, dynamic permeability de-velops under conditions of overpressurized fluid flow (Weis, 2015). For typical permeabilities of between 10–11 and 10–14 m2, transport speeds are between 10–5 and 10–2 m/s (Okumura et al., 2009), giving time scales of decades to a few days for fluid ascent through the 6-km-thick subsolidus part of the hybrid column.
IMPLICATIONS AND CONCLUSIONS
The transfer of magmatic fluids and melt from the APMB toward a col-umn-like structure at shallower crustal levels provides a plausible mechanism to explain the evolution of ground deformation at Uturuncu. In our favored model, melt and water-rich fluid are sourced from wet andesitic melts within the APMB at water contents as high as 9 wt% (Laumonier et al., 2017) and trans-ported into a three-phase bulge and column structure containing water- rich fluids, plutonic (solid) residue, and partial melt. The involvement of magmatic fluids explains the mismatch between the volumes of surface uplift and surface subsidence. Subsurface stresses and subsequent surface strains are created either within a magmatic (igneous mush) bulge and column structure by melt migration and trapping of exsolved water-rich fluids, or within a hybrid bulge and column structure by the migration of exsolved fluids from the igneous much into an overlying permeable and altered plutonic complex. The decadal time scale of surface deformation, lack of long-term residual surface deforma-tion, and melt and fluid transfer from mid-crustal depths within the AMPB into the upper crust favor a rapid process of igneous mush organization (Sparks and Cashman, 2017) as the cause for the large deformation anomaly (Fig. 17).
Our findings have the following implications.
1. The upper crustal anomalous body imaged by the potential field studies of del Potro et al. (2013a) and Comeau et al. (2015) beneath Uturuncu could represent a hybrid column with water-rich fluid-bearing fractured and altered plutonic rocks above an igneous mush protruding from the APMB.
2. The presence of several of these geophysically anomalous bodies be-neath the APVC (del Potro et al., 2013a; Comeau et al., 2015) suggests that these structures are fundamental for channeling material from the APMB to shallower crustal levels, and may fuel volcanism. The desta-bilization of segregated volatile-rich melts within the APMB and their subsequent upward migration and fluid exsolution through the anom-alous vertical bodies may be a ubiquitous feature of the magmatic and volcanic evolution of the APVC. If this were true one would expect to
see a complex temporal evolution of subsurface stresses and surface strains in the APVC over time scales of hundreds or thousands of years. In this scenario, the APVC may undergo complex spatiotemporal surface deformation by the periodic pressurization and depressurization of these vertical bodies.
3. The temporal evolution of the modeled deformation appears to be nonlinear over time scales of months as a result of stepped pressure increments and time-dependent stress relaxation. However, available episodic satellite or ground-based geodetic data lack the temporal reso-lu tion to resolve such behavior. If periodic material transfer through the crust is responsible for the observed ground deformation, it is impera-tive to obtain spatially extensive routine geodetic time series at obser-vation frequencies much higher than hitherto available, at least on a monthly basis. With the launch of the European radar imaging satellite Sentinel 1B in 2016, these capabilities might be achievable.
4. Fluid loss from the hybrid column and associated phase separation into vapor and liquid within a shallow-seated, brine-bearing hydrothermal reservoir and concurrent depressurization of the column will reverse the broad deformation pattern and can explain the absence of long-term (>100 yr) and long-wavelength residual deformation around Uturuncu. Periods of ground subsidence and presumed depressurization have been observed at several volcanoes, including Cerro Blanco in the Cen-tral Andes (e.g., Henderson and Pritchard, 2013), and could provide clues to what might happen at Uturuncu in the future.
5. Three-dimensional variations in the crustal structure as well as depth- dependent regional stresses from the convergence of the Pacific and South American plates and left-lateral transtension above the APMB (Riller et al., 2001) may have an influence on subsurface stress gener-ation and resultant spatiotemporal strain partitioning (see Hickey et al., 2016), which we cannot capture in our axisymmetric model. The first steps to obtain insights into the 3D structure of the middle and upper crust below the APVC and APMB have been made and need expanding. These models in combination with surface deformation data at higher spatial and temporal coverage than currently available will inform fu-ture 3D thermomechanical models of the crustal dynamics of the Alti-plano-Puna.
ACKNOWLEDGMENTS
The study received funding from the Natural Environmental Research Council (NERC grant NE/G01843X/1), the EC FP7 VUELCO (European Commission Seventh Framework Programme for Research, Volcanic Unrest in Europe and Latin American Countries) project (grant agreement 282759), a Benjamin Meaker Visiting Professorship (to Pritchard) from the Institute for Advanced Study, University of Bristol, and the National Science Foundation (EAR-0908281). Blundy acknowl-edges a Wolfson Research Merit Award from the Royal Society. R. del Potro, J. Hickey, M. Diez, and C. Muller contributed to data collection. The NERC Geophysical Equipment Facility provided instruments through loans 910 and 928. M. Sunagua, SERGEOTECMIN (El Servicio Geológico y Técnico de Minas) and SERNAP (Servicio Nacional de Áreas Protegidas) provided assistance in Bolivia. Two anonymous reviewers provided constructive comments that helped improve the manuscript.
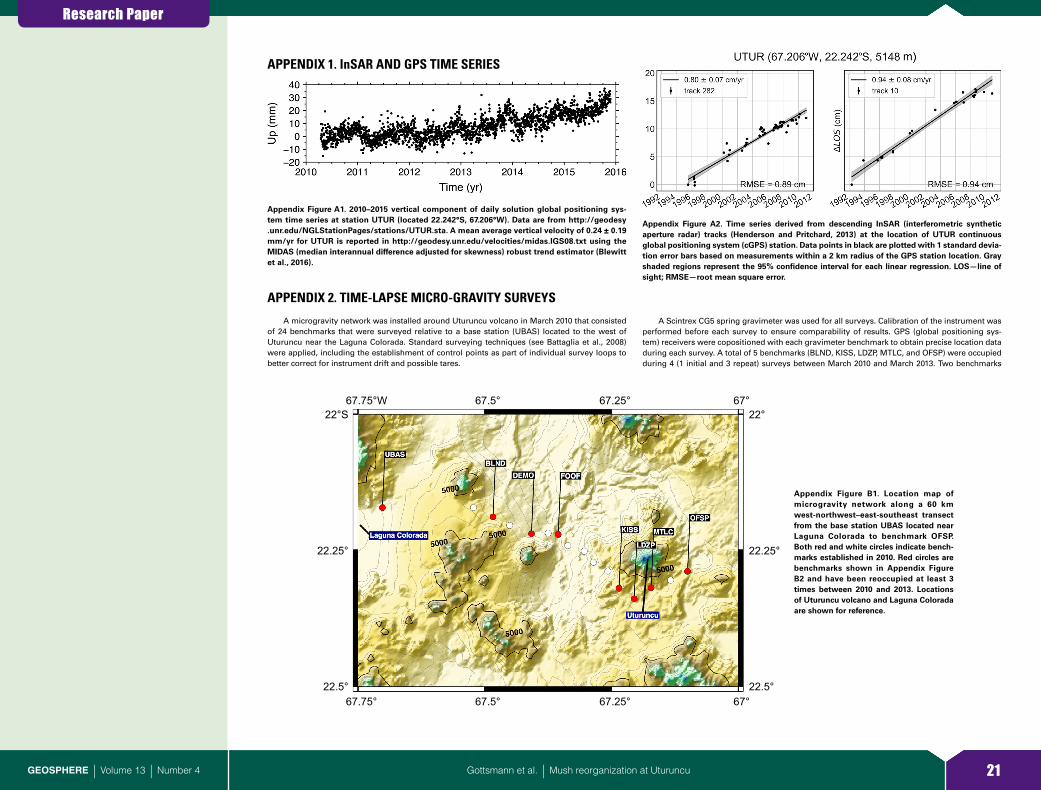
Research Paper
21Gottsmann et al. | Mush reorganization at UturuncuGEOSPHERE | Volume 13 | Number 4
APPENDIX 1. InSAR AND GPS TIME SERIES
APPENDIX 2. TIME-LAPSE MICRO-GRAVITY SURVEYS
A microgravity network was installed around Uturuncu volcano in March 2010 that consisted of 24 benchmarks that were surveyed relative to a base station (UBAS) located to the west of Uturuncu near the Laguna Colorada. Standard surveying techniques (see Battaglia et al., 2008) were applied, including the establishment of control points as part of individual survey loops to better correct for instrument drift and possible tares.
A Scintrex CG5 spring gravimeter was used for all surveys. Calibration of the instrument was performed before each survey to ensure comparability of results. GPS (global positioning sys-tem) receivers were copositioned with each gravimeter benchmark to obtain precise location data during each survey. A total of 5 benchmarks (BLND, KISS, LDZP, MTLC, and OFSP) were occupied during 4 (1 initial and 3 repeat) surveys between March 2010 and March 2013. Two benchmarks
Appendix Figure A1. 2010–2015 vertical component of daily solution global positioning sys-tem time series at station UTUR (located 22.242°S, 67.206°W). Data are from http:// geodesy .unr .edu /NGLStationPages /stations /UTUR .sta. A mean average vertical velocity of 0.24 ± 0.19 mm/yr for UTUR is reported in http:// geodesy .unr .edu /velocities /midas .IGS08 .txt using the MIDAS (median interannual difference adjusted for skewness) robust trend estimator (Blewitt et al., 2016).
Appendix Figure A2. Time series derived from descending InSAR (interferometric synthetic aper ture radar) tracks (Henderson and Pritchard, 2013) at the location of UTUR continuous global positioning system (cGPS) station. Data points in black are plotted with 1 standard devia-tion error bars based on measurements within a 2 km radius of the GPS station location. Gray shaded regions represent the 95% confidence interval for each linear regression. LOS—line of sight; RMSE—root mean square error.
67.75°W22°S
22.25°
22.5°
22°
22.25°
22.5°
67.5° 67.25° 67°
67.75° 67.5° 67.25° 67°
Appendix Figure B1. Location map of microgravity network along a 60 km west-northwest–east-southeast transect from the base station UBAS located near Laguna Colorada to benchmark OFSP. Both red and white circles indicate bench-marks established in 2010. Red circles are benchmarks shown in Appendix Figure B2 and have been reoccupied at least 3 times between 2010 and 2013. Locations of Uturuncu volcano and Laguna Colorada are shown for reference.
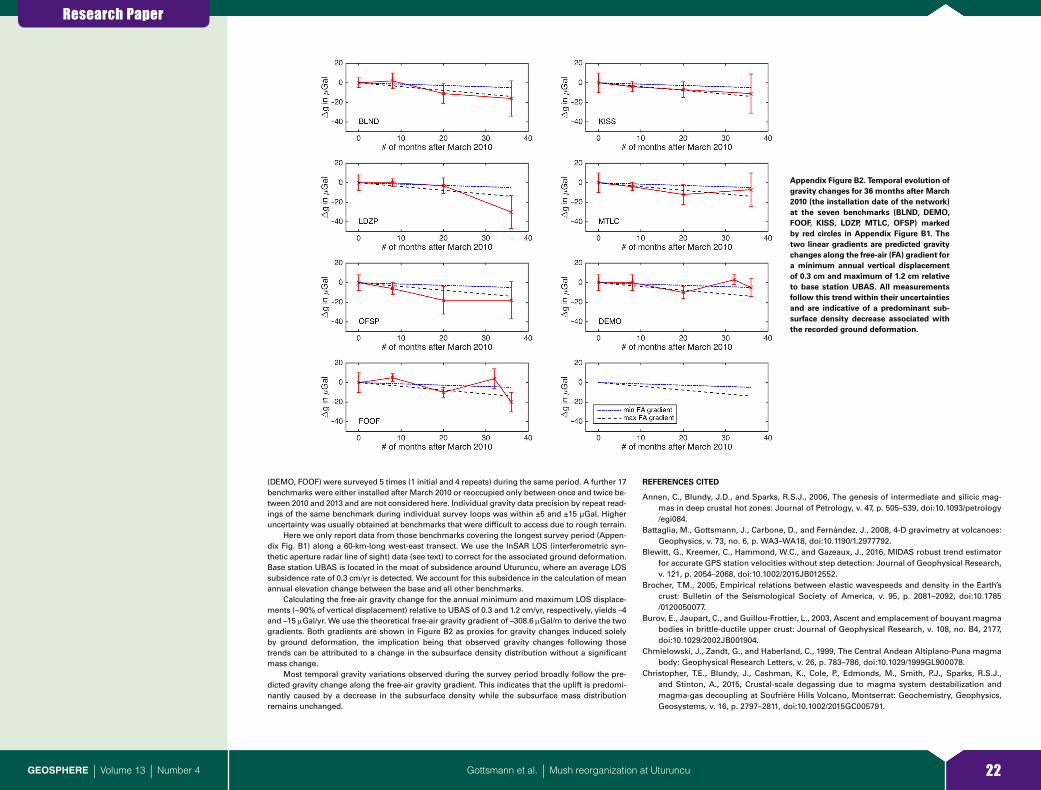
Research Paper
22Gottsmann et al. | Mush reorganization at UturuncuGEOSPHERE | Volume 13 | Number 4
(DEMO, FOOF) were surveyed 5 times (1 initial and 4 repeats) during the same period. A further 17 benchmarks were either installed after March 2010 or reoccupied only between once and twice be-tween 2010 and 2013 and are not considered here. Individual gravity data precision by repeat read-ings of the same benchmark during individual survey loops was within ±5 and ±15 µGal. Higher uncertainty was usually obtained at benchmarks that were difficult to access due to rough terrain.
Here we only report data from those benchmarks covering the longest survey period (Appen-dix Fig. B1) along a 60-km-long west-east transect. We use the InSAR LOS (interferometric syn-thetic aperture radar line of sight) data (see text) to correct for the associated ground deformation. Base station UBAS is located in the moat of subsidence around Uturuncu, where an average LOS subsidence rate of 0.3 cm/yr is detected. We account for this subsidence in the calculation of mean annual elevation change between the base and all other benchmarks.
Calculating the free-air gravity change for the annual minimum and maximum LOS displace-ments (~90% of vertical displacement) relative to UBAS of 0.3 and 1.2 cm/yr, respectively, yields –4 and –15 mGal/yr. We use the theoretical free-air gravity gradient of –308.6 mGal/m to derive the two gradients. Both gradients are shown in Figure B2 as proxies for gravity changes induced solely by ground deformation, the implication being that observed gravity changes following those trends can be attributed to a change in the subsurface density distribution without a significant mass change.
Most temporal gravity variations observed during the survey period broadly follow the pre-dicted gravity change along the free-air gravity gradient. This indicates that the uplift is predomi-nantly caused by a decrease in the subsurface density while the subsurface mass distribution remains unchanged.
REFERENCES CITED
Annen, C., Blundy, J.D., and Sparks, R.S.J., 2006, The genesis of intermediate and silicic mag-mas in deep crustal hot zones: Journal of Petrology, v. 47, p. 505–539, doi: 10 .1093 /petrology /egi084 .
Battaglia, M., Gottsmann, J., Carbone, D., and Fernández, J., 2008, 4-D gravimetry at volcanoes: Geophysics, v. 73, no. 6, p. WA3–WA18, doi: 10 .1190 /1 .2977792 .
Blewitt, G., Kreemer, C., Hammond, W.C., and Gazeaux, J., 2016, MIDAS robust trend estimator for accurate GPS station velocities without step detection: Journal of Geophysical Research, v. 121, p. 2054–2068, doi: 10 .1002 /2015JB012552 .
Brocher, T.M., 2005, Empirical relations between elastic wavespeeds and density in the Earth’s crust: Bulletin of the Seismological Society of America, v. 95, p. 2081–2092, doi: 10 .1785 /0120050077 .
Burov, E., Jaupart, C., and Guillou-Frottier, L., 2003, Ascent and emplacement of bouyant magma bodies in brittle-ductile upper crust: Journal of Geophysical Research, v. 108, no. B4, 2177, doi: 10 .1029 /2002JB001904 .
Chmielowski, J., Zandt, G., and Haberland, C., 1999, The Central Andean Altiplano-Puna magma body: Geophysical Research Letters, v. 26, p. 783–786, doi: 10 .1029 /1999GL900078 .
Christopher, T.E., Blundy, J., Cashman, K., Cole, P., Edmonds, M., Smith, P.J., Sparks, R.S.J., and Stinton, A., 2015, Crustal-scale degassing due to magma system destabilization and magma-gas decoupling at Soufrière Hills Volcano, Montserrat: Geochemistry, Geophysics, Geosystems, v. 16, p. 2797–2811, doi: 10 .1002 /2015GC005791 .
Appendix Figure B2. Temporal evolution of gravity changes for 36 months after March 2010 (the installation date of the network) at the seven benchmarks (BLND, DEMO, FOOF, KISS, LDZP, MTLC, OFSP) marked by red circles in Appendix Figure B1. The two linear gradients are predicted gravity changes along the free-air (FA) gradient for a minimum annual vertical displacement of 0.3 cm and maximum of 1.2 cm relative to base station UBAS. All measurements follow this trend within their uncertainties and are indicative of a predominant sub-surface density decrease associated with the recorded ground deformation.
Research Paper
23Gottsmann et al. | Mush reorganization at UturuncuGEOSPHERE | Volume 13 | Number 4
Cloos, M., 2001, Bubbling magma chambers, cupolas, and porphyry copper deposits: Interna-tional Geology Review, v. 43, p. 285–311, doi: 10 .1080 /00206810109465015 .
Comeau, M.J., Unsworth, M.J., Ticona, F., and Sunagua, M., 2015, Magnetotelluric images of magma distribution beneath Volcan Uturuncu, Bolivia: Implications for magma dynamics: Geology, v. 43, p. 243–246, doi: 10 .1130 /G36258 .1 .
Comeau, M.J., Unsworth, M.J., and Cordell, D., 2016, New constraints on the magma distribution and composition beneath Volcán Uturuncu and the southern Bolivian Altiplano from mag-netotelluric data: Geosphere, v. 12, p. 1391–1421, doi: 10 .1130 /GES01277 .1 .
de Silva, S.L., 1989, Altiplano-Puna volcanic complex of the central Andes: Geology, v. 17, p. 1102–1106, doi: 10 .1130 /0091 -7613 (1989)017 <1102: APVCOT>2 .3 .CO;2 .
de Silva, S.L., and Gosnold, W.D., 2007, Episodic construction of batholiths: Insights from the spatiotemporal development of an ignimbrite flare-up: Journal of Volcanology and Geother-mal Research, v. 167, p. 320–335, doi: 10 .1016 /j .jvolgeores .2007 .07 .015 .
Del Negro, C., Currenti, G., and Scandura, D., 2009, Temperature-dependent viscoelastic modeling of ground deformation: Application to Etna volcano during the 1993–1997 inflation period: Physics of the Earth and Planetary Interiors, v. 172, p. 299–309, doi: 10 .1016 /j .pepi .2008 .10 .019 .
del Potro, R., Díez, M., Blundy, J., Gottsmann, J., and Camacho, A., 2013a, Diapiric ascent of silicic magma beneath the Bolivian Altiplano: Geophysical Research Letters, v. 40, p. 2044–2048, doi: 10 .1002 /grl .50493 .
del Potro, R., Diez, M., Muller, C., Perkins, J.P., Finnegan, N.J., and Gottsmann, J., 2013b, Long-lived large-scale ground deformation caused by a buoyantly rising magma reservoir: Amer-ican Geophysical Union, fall meeting, abs. V51E-2742.
Driesner, T., and Heinrich, C.A., 2007, The system H2O-NaCl. Part I: Correlation formulae for phase relations in temperature-pressure-composition space from 0 to 1000°C, 0 to 5000bar, and 0 to 1 XNaCl: Geochimica et Cosmochimca Acta, v. 71, p. 4880–4901, doi: 10 .1016 /j .gca .2006 .01 .033 .
Fialko, Y., and Pearse, J., 2012, Sombrero uplift above the Altiplano-Puna magma body: Evidence of a ballooning mid-crustal diapir: Science, v. 338, p. 250–252, doi: 10 .1126 /science .1226358 .
Gottsmann, J., and Odbert, H.M., 2014, The effects of thermo-mechanical heterogeneities in island- arc crust on time-dependent pre-eruptive stresses and the failure of an andesitic reservoir: Journal of Geophysical Research, v. 119, p. 4880–4901, doi: 10 .1002 /2014JB011079 .
Gottsmann, J., Berrino, G., Rymer, H., and Williams-Jones, G., 2003, Hazard assessment during caldera unrest at the Campi Flegrei, Italy: A contribution from gravity-height gradients: Earth and Planetary Science Letters, v. 211, p. 295–309, doi: 10 .1016 /S0012 -821X (03)00225 -5 .
Gottsmann, J., De Angelis, S., Fournier, N., Van Camp, M., Sacks, S., Linde, A., and Ripepe, M., 2011, On the geophysical fingerprint of Vulcanian explosions: Earth and Planetary Science Letters, v. 306, p. 98–104, doi: 10 .1016 /j .epsl .2011 .03 .035 .
Gualda, G.A.R., and Ghiorso, M.S., 2014, Phase-equilibrium geobarometers for silicic rocks based on rhyolite-MELTS. Part 1: Principles, procedures, and evaluation of the method: Con-tributions to Mineralogy and Petrology, v. 168, 1033, doi: 10 .1007 /s00410 -014 -1033 -3 .
Gudmundsson, A., 1983, Stress estimates from the length/width ratios of fractures: Journal of Structural Geology, v. 5, p. 623–626, doi: 10 .1016 /0191 -8141 (83)90075 -5 .
Hacker, B.R., and Abers, G.A., 2004, Subduction Factory 3: An Excel worksheet and macro for calculating the densities, seismic wave speeds, and H2O contents of minerals and rocks at pressure and temperature: Geochemistry, Geophysics, Geosystems, v. 5, Q01005, doi: 10 .1029 /2003GC000614 .
Hautmann, S., Witham, F., Christopher, T., Cole, P., Linde, A.T., Sacks, I.S., and Sparks, R.S.J., 2014, Strain field analysis on Montserrat (West Indies) as tool for assessing permeable flow paths in the magmatic system of Soufrière Hills Volcano: Geochemistry, Geophysics, Geo-systems, v. 15, p. 676–690, doi: 10 .1002 /2013GC005087 .
Hawkesworth, C.J., and Kemp, A.I., 2006, Evolution of the continental crust: Nature, v. 443, p. 811–817, doi: 10 .1038 /nature05191 .
Henderson, S.T., and Pritchard, M.E., 2013, Decadal volcanic deformation in the Central Andes Volcanic Zone revealed by InSAR time series: Geochemistry, Geophysics, Geosystems, v. 14, p. 1358–1374, doi: 10 .1002 /ggge .20074 .
Hickey, J., and Gottsmann, J., 2014, Benchmarking and developing numerical finite element models of volcanic deformation: Journal of Volcanology and Geothermal Research, v. 280, p. 126–130, doi: 10 .1016 /j .jvolgeores .2014 .05 .011 .
Hickey, J., Gottsmann, J., and del Potro, R., 2013, The large-scale surface uplift in the Alti plano-Puna region of Bolivia; a parametric study of source characteristics and crustal rheology using finite element analysis: Geochemistry, Geophysics, Geosystems, v. 14, p. 540–555, doi: 10 .1002 /ggge .20057 .
Hickey, J., Gottsmann, J., Nakamichi, H., and Iguchi, M., 2016, Thermomechanical controls on magma supply and volcanic deformation: application to Aira caldera, Japan: Scientific Re-ports, v. 6, 32691, doi: 10 .1038 /srep32691 .
Huppert, H.E., and Sparks, R.S., 2016, Compressible vapour flow in conduits and fractures: Jour-nal of Fluid Mechanics, v. 802, p. 750–759, doi: 10 .1017 /jfm .2016 .298 .
Ingebritsen, S.E., Geiger, S., Hurwitz, S., and Driesner, T., 2010, Numerical simulation of magmatic hydrothermal systems: Reviews of Geophysics, v. 48, RG1002, doi: 10 .1029 /2009RG000287 .
Jaupart, C., and Mareschal, J.-C., 2009, Heat flow and thermal structure of the lithosphere, in Watts, A.B., ed., Crust and Lithosphere Dynamics: Treatise on Geophysics 6: Amsterdam, Elsevier, p. 218–251.
Jay, J.A., Pritchard, M.E., West, M.E., Christensen, D., Haney, M., Minaya, E., Sunagua, M., McNutt, S.R., and Zabala, M., 2012, Shallow seismicity, triggered seismicity, and ambient noise tomography at the long-dormant Uturuncu Volcano, Bolivia: Bulletin of Volcanology, v. 74, p. 817–837, doi: 10 .1007 /s00445 -011 -0568 -7 .
Keyson, L., and West, M.E., 2013, Earthquake sources near Uturuncu Volcano: American Geo-physical Union, fall meeting, abs. V13B-2603.
Kösters, M., 1999, 3D-Dichtemodellierung des Kontinentalrandes sowie quantitative Unter-suchungen zur Isostasie und Rigidität der Zentralen Anden (20°–26°S) [Ph.D. thesis]: Ber-lin, Freie Universität Berlin, 181 p., Berliner Geowissenschaftliche Abhandlungen, Reihe B, Heft 32.
Laumonier, M., Gaillard, F., Muir, D., Blundy, J., and Unsworth, M., 2017, Giant magmatic water reservoirs at mid-crustal depth inferred from electrical conductivity and the growth of the continental crust: Earth and Planetary Science Letters, v. 457, p. 173–180, doi: 10 .1016 /j .epsl .2016 .10 .023 .
Lucassen, F., Becchio, R., Harmon, R., Kasemann, S., Franz, G., Trumbull, R., Wilke, H.-G., Romer, R.L., and Dulski, P., 2001, Composition and density model of the continental crust at an ac-tive continental margin—The Central Andes between 21° and 27°S: Tectonophysics, v. 341, p. 195–223, doi: 10 .1016 /S0040 -1951 (01)00188 -3 .
Manning, C.E., and Ingebritsen, S.E., 1999, Permeability of the continental crust: Implications of geothermal data and metamorphic systems: Reviews of Geophysics, v. 37, p. 127–150, doi: 10 .1029 /1998RG900002 .
Michelfelder, G., Feeley, T., and Wilder, A., 2014, The volcanic evolution of Cerro Uturuncu: A high-K, composite volcano in the back-arc of the Central Andes of SW Bolivia: International Journal of Geosciences, v. 5, p. 1263–1281, doi: 10 .4236 /ijg .2014 .511105 .
Muir, D., Barfod, D., Blundy, J., Rust, A., Sparks, R., and Clarke, K., 2015, The temporal record of magmatism at Cerro Uturuncu, Bolivian Altiplano, in Caricchi, L., and Blundy, J.D., eds., Chemical, Physical and Temporal Evolution of Magmatic Systems: Geological Society of London Special Publication 422, p. 57–83, doi: 10 .1144 /SP422 .1 .
Muir, D.D., Blundy, J.D., Hutchinson, M.C., and Rust, A.C., 2014a, Petrological imaging of an active pluton beneath Cerro Uturuncu, Bolivia: Contributions to Mineralogy and Petrology, v. 167, 980, doi: 10 .1007 /s00410 -014 -0980 -z .
Muir, D.D., Blundy, J.D., Rust, A.C., and Hickey, J., 2014b, Experimental constraints on dacite pre-eruptive magma storage conditions beneath Uturuncu Volcano: Journal of Petrology, v. 55, p. 749–767, doi: 10 .1093 /petrology /egu005 .
Ochs, F.A., and Lange, R.A., 1997, The partial molar volume, thermal expansivity, and compressi bility of H2O in NaAlSi3O8 liquid: New measurements and an internally consis-tent model: Contributions to Mineralogy and Petrology, v. 129, p. 155–165, doi: 10 .1007 /s004100050329 .
Ochs, F.A., and Lange, R., 1999, The density of hydrous magmatic liquids: Science, v. 283, p. 1314–1317, doi: 10 .1126 /science .283 .5406 .1314 .
Okumura, S., Nakamura, M., Takeuchi, S., Tsuchiyama, A., Nakano, T., and Uesugi, K., 2009, Magma deformation may induce non-explosive volcanism via degassing through bubble networks: Earth and Planetary Science Letters, v. 281, p. 267–274, doi: 10 .1016 /j .epsl .2009 .02 .036 .
Patchett, P.J., Kouvo, O., Hedge, C.E., and Tatsumoto, M., 1982, Evolution of continental-crust and mantle heterogeneity: Evidence from Hf isotopes: Contributions to Mineralogy and Petrol-ogy, v. 78, p. 279–297, doi: 10 .1007 /BF00398923 .
Perkins, J.P., Finnegan, N.J., Henderson, S.T., and Rittenour, T.M., 2016, Topographic constraints on magma accumulation below the actively uplifting Uturuncu and Lazufre volcanic centers in the Central Andes: Geosphere, v. 12, p. 1078–1096, doi: 10 .1130 /GES01278 .1 .
Research Paper
24Gottsmann et al. | Mush reorganization at UturuncuGEOSPHERE | Volume 13 | Number 4
Pitzer, K.S., and Sterner, S.M., 1994, Equations of state valid continuously from zero to extreme pressures for H2O and CO2: Journal of Chemical Physics, v. 101, p. 3111–3116, doi: 10 .1063 /1 .467624 .
Priestley, K., Jackson, J., and McKenzie, D., 2008, Lithospheric structure and deep earthquakes beneath India, the Himalaya and southern Tibet: Geophysical Journal International, v. 172, p. 345–362, doi: 10 .1111 /j .1365 -246X .2007 .03636 .x .
Pritchard, M.E., and Simons, M., 2002, A satellite geodetic survey of largescale deformation of volcanic centres in the central Andes: Nature, v. 418, p. 167–171, doi: 10 .1038 /nature00872 .
Riller, U., Petrinovic, I., Ramelow, J., Greskowiak, J., Strecker, M., and Oncken, O., 2001, Late Cenozoic tectonism, caldera and plateau formation in the central Andes: Earth and Planetary Science Letters, v. 188, p. 299–311, doi: 10 .1016 /S0012 -821X (01)00333 -8 .
Salisbury, M.J., Jicha, B.R., de Silva, S.L., Singer, B.S., Jimenez, N.C., and Ort, M.H., 2011, 40Ar/39Ar chronostratigraphy of Altiplano-Puna volcanic complex ignimbrites reveals the de-velopment of a major magmatic province: Geological Society of America Bulletin, v. 123, p. 821–840, doi: 10 .1130 /B30280 .1 .
Schilling, F.R., et al., 2006, Partial melting in the Central Andean crust: A review of geophysical, petrophysical, and petrologic evidence, in Oncken, O., et al., eds., The Andes—Active Sub-duction Orogeny: Frontiers in Earth Sciences: Berlin, Springer, p. 459–474, doi: 10 .1007 /978 -3 -540 -48684 -8_22 .
Sheldrake, T.E., Sparks, R.S.J., Cashman, K.V., Wadge, G., and Aspinall, W.P., 2016, Similarities and differences in the historical records of lava dome-building volcanoes: Implications
for understanding magmatic processes and eruption forecasting: Earth-Science Reviews, v. 160, p. 240–263, doi: 10 .1016 /j .earscirev .2016 .07 .013 .
Sparks, R.S.J., and Cashman, K.V., 2017, Dynamic magma systems: Implications for forecasting volcanic activity: Elements, v. 13, no. 1, p. 35-40, doi: 10 .2113 /gselements .2113 .2111 .2135 .
Sparks, R.S.J., Folkes, C.B., Humphreys, M.C.S., Barfod, D.N., Clavero, J., Sunagua, M.C., McNutt, S.R., and Pritchard, M.E., 2008, Uturuncu volcano, Bolivia: Volcanic unrest due to mid-crustal magma intrusion: American Journal of Science, v. 308, p. 727–769, doi: 10 .2475 /06 .2008 .01 .
Ward, K.M., Zandt, G., Beck, S.L., Christensen, D.H., and McFarlin, H., 2014, Seismic imaging of the magmatic underpinnings beneath the Altiplano-Puna volcanic complex from the joint inversion of surface wave dispersion and receiver functions: Earth and Planetary Science Letters, v. 404, p. 43–53, doi: 10 .1016 /j .epsl .2014 .07 .022 .
Weis, P., 2015, The dynamic interplay between saline fluid flow and rock permeability in mag-matic- hydrothermal systems: Geofluids, v. 15, p. 350–371, doi: 10 .1111 /gfl .12100 .
Wright, T.J., Parsons, B.E., and Lu, Z., 2004, Toward mapping surface deformation in three dimen-sions using InSAR: Geophysical Research Letters, v. 31, L01607, doi: 10 .1029 /2003GL018827 .
Zandt, G., Velasco, A.A., and Beck, S.L., 1994, Composition and thickness of the southern Alti-plano crust, Bolivia: Geology, v. 22, p. 1003–1006, doi: 10 .1130 /0091 -7613 (1994)022 <1003: CATOTS>2 .3 .CO;2 .
Zandt, G., Leidig, M., Chmielowski, J., Baumont, D., and Yuan, X., 2003, Seismic detection and characterization of the Altiplano-Puna magma body, Central Andes: Pure and Applied Geo-physics, v. 160, p. 789–807, doi: 10 .1007 /PL00012557 .