governance and agricultural production … and agricultural production efficiency: a cross-country...
TRANSCRIPT

Governance and AgriculturalProduction Efficiency:A Cross-Country Aggregate FrontierAnalysis
Mon-Chi Lio and Jin-Li Hu1
(Original submitted July 2007, revision received March 2008, accepted April2008.)
Abstract
This study uses a stochastic frontier approach to investigate the relationshipbetween six governance indicators and agricultural efficiency. We find thatimprovements in rule of law, control of corruption and government effectivenessenhance agricultural productivity significantly if each indicator enters the ineffi-ciency equation independently. When all six indicators are included in the equa-tion, we find that an improvement in rule of law raises agricultural efficiencysignificantly, but increases in voice and accountability and political stabilityappear to significantly reduce agricultural efficiency. Grouping the six indicatorsinto three dimensions, we find that an improvement in ‘respect for institutionalframework’ raises agricultural efficiency significantly, but an enhancement in‘selection of authority’ reduces agricultural efficiency significantly. Our resultsimply that poorer countries can enhance their agricultural efficiency substantiallyby strengthening the state and citizens’ respect for institutional framework. How-ever, our results show that greater democracy is associated with lower agricul-tural efficiency. This finding is consistent with interest group capture andpolitical failure arguments of the political economy literature.
Keywords: Agricultural efficiency and productivity; governance; stochastic fron-tier analysis.
JEL classifications: O13, O47, Q19.
1Mon-Chi Lio is based in the Department of Political Economy, National Sun Yat-sen Uni-
versity, 70 Lien-hai Rd., Kaohsiung 804, Taiwan. E-mail: [email protected] for corre-spondence. Jin-Li Hu is based in the Institute of Business and Management, National ChiaoTung University, Taiwan. Thanks are due to two anonymous reviewers and to the editors for
helpful comments on earlier drafts. The authors would also like to thank Tzu-Pu Chang andseminar participants at National Taiwan University for their helpful comments. Partial finan-cial support from Taiwan’s National Science Council (NSC 95-2415-H-110-002 and NSC-95-2415-H-009-001) is gratefully acknowledged. The usual disclaimer applies.
Journal of Agricultural Economics, Vol. 60, No. 1, 2009, 40–61doi: 10.1111/j.1477-9552.2008.00172.x
� 2008 The Authors. Journal compilation � 2008 The Agricultural Economics Society.

1. Introduction
The recent past has seen much research devoted to explaining why farmers in poorcountries do not produce as much as their counterparts in rich countries. It is naturalto ask whether agricultural production in poor countries is efficient. One mainstream of thought, represented by Schultz (1964), argues that farmers in poor coun-tries are ‘poor but efficient’; they allocate available resources rationally, but cannotachieve high levels of productivity, because they have a shortage of local-specificmodern agricultural technologies. Therefore, in order to improve the agriculturalperformance of developing countries, more effort should be made to enhance thecapacity of agricultural research institutions, the capacity of technology-supplyindustries, and the schooling and extension education of rural people (Ruttan, 2002).In recent years, researchers have recognised that, even though a country has the
potential to develop and use modern technologies, its economic performance maystill be disappointing if its institutions are insufficient or inappropriate. As Olson(1996) suggests, many poor countries just waste money and resources because theydo not have the necessary institutional framework to realise fully the gains fromspecialisation and trade. In other words, individual rationality does not guaranteethat a society produces efficiently. Individual rational behaviour may still lead tosocially inefficient outcomes because of institutional failure.This is evident in the case of agricultural production. An obvious example is that
war and local conflict destroy law enforcement and the effectiveness of the govern-ment, thus discouraging and even preventing local agricultural production, leadingin extreme conditions to mass starvation (e.g. Somalia in the 1990s). If the protec-tion of property rights and the enforcement of contracts are weak, then it is unlikelythat significant private investments in agriculture will take place. A secure title toland is necessary for people to have confidence in making long-term investmentscrucial to improving productivity. As has been dramatically illustrated in China andVietnam in recent years, providing farmers with secure land rights and strongopportunities for farm labour to do something else have led to remarkable agricul-tural development (Duncan and Pollard, 2002).Regarding the development and utilisation of modern agricultural production
methods characterised by the use of many highly specialised inputs, such as machin-ery and chemical fertilisers, a sufficiently large exchange network supporting a sig-nificant division of labour is required to provide enough specialists to invent,develop and maintain these specialised inputs (Stigler, 1951). For such a complexnetwork of exchanges, traditions, culture and social pressure alone are insufficientto enforce adherence to agreements. Contract law and the system of justice consti-tute the infrastructure of a democratic society. Parties to a contract must eachbelieve that they can obtain equal treatment under laws that are fair to all sides.Without such an institutional environment, modern agricultural production meth-ods that employ many specialised inputs would be too expensive to adopt becauseof high transaction costs.It is therefore reasonable to hypothesise that governance, providing the necessary
institutions for effective development, will significantly influence a country’s agricul-tural production efficiency. For instance, Hayami and Ruttan (1985) suggest that inagriculture poor institutions and policies impede both the adoption of appropriatetechnology and the outcome of organisational innovation. In the recently publishedWorld Development Report 2008, World Bank (2007) argues that governance is
41Governance and Agricultural Production Efficiency
� 2008 The Authors. Journal compilation � 2008 The Agricultural Economics Society.
essential to agricultural development, and ongoing processes of democratisation,civil society participation, public sector management reforms, and corruption con-trol hold great potential for improving agricultural performance.In this study, we employ the stochastic frontier approach to examine the relation-
ships between governance and agricultural productivity (value-added) at thenational (country) level. This approach has been widely adopted by researchers tostudy the determinants of inter-farm efficiency differences (e.g. Liu and Zhuang,2000). It has also recently been employed by a number of researchers, such asAdkins et al. (2002) and Meon and Weill (2005), to estimate the relationshipsbetween macroeconomic performance and institutional variables. In this paper,technical inefficiencies in agricultural production, as measured by the deviationsfrom an agricultural value-added frontier, are functions of certain governance vari-ables such as rule of law, control of corruption, or government effectiveness.The rest of this paper is organised as follows: section 2 introduces the methodol-
ogy and discusses our empirical model. Section 3 presents the data sources and vari-able definitions. Section 4 reports and discusses our empirical findings. Section 5concludes the paper.
2. The Model
This study follows the one-stage model suggested by Battese and Coelli (1995) tosimultaneously estimate the stochastic frontier production function and the equationof inefficiency by the maximum likelihood estimation. Our model deals with a paneldataset, with N countries and T periods. We assume a Cobb–Douglas productionfunction (widely used in the literature) expressed as follows:
lnðOutputitÞ ¼ b0 þ b1 lnðLabouritÞ þ b2 lnðLanditÞ þ b3 lnðLivestkitÞþ b4 lnðFertitÞ þ b5 lnðTractoritÞ þ b6Eduit þ b7 lnðLandqualitÞþ b8 lnðPrecipitÞ þ b9 lnðPrecipsditÞ þ b10Tempit þ b11Tropicalit
þ b12Landlockit þ ðVit � UitÞ; i ¼ 1; . . . ;N; t ¼ 1; . . . ;T;
ð1Þ
where Outputit is the agricultural total output (agricultural GDP) of country i inperiod t and b is a vector of unknown parameters to be estimated. This stochasticfrontier function characterises the transformation from the major agricultural inputs(such as labour, land and capital) into the agricultural value added, while control-ling the individual country’s geographical and climatic differences.Five essential agricultural inputs are included in the agricultural production,
including agricultural labour (Labour), areas of agricultural land (Land), livestock(Livestk), fertiliser (Fert), and machinery (Tractor). In addition, seven control vari-ables are considered. Edu is the general education level, proxied by the combinedprimary, secondary and tertiary enrolment ratio. Previous studies of the aggregateagricultural production function usually find positive (but frequently insignificant)coefficients for the general education variable (Bravo-Ortega and Lederman, 2004).The second control variable, Landqual, is the land quality, measured by the per-centage of total land being permanent cropland, which is a basic land quality index(Masters and Weibe, 2000; Weibe, 2003). The expectation is that better land qualityshould increase agriculture productivity.To control for climate conditions, three variables are employed: annual precipita-
tion (Precip); standard deviation of annual precipitation (Precipsd), accounting for
42 Mon-Chi Lio and Jin-Li Hu
� 2008 The Authors. Journal compilation � 2008 The Agricultural Economics Society.

rainfall variability; daily mean temperature (Temp). To control for geographic char-acteristics, two dummy variables are included. The first is Landlock, 1 if a countryis landlocked, as this property appears to have substantial negative impacts on acountry’s development (Faye et al., 2004). The second is Tropical, 1 for a tropicalcountry. Although the reasons are still under debate, it has been frequentlyobserved that tropical economies show weaker agricultural performance (Sachs,2001).The variable Vit in equation (1) is a random disturbance term which is assumed
to be independently and identically Nð0; r2V Þ distributed and independent of Uit. Uit
is the relative inefficiency effect term as a non-negative term with a variance r2U .
The variance of the error component term Vit ) Uit is r2 with r2 ¼ r2U þ r2
V .2
The inefficiency term Uit in equation (1) can be specified as:
Uit ¼ dZit þ eit ; ð2Þ
where d is a vector of unknown parameters to be estimated; Zit is a vector ofexplanatory variables; and �it is a random variable following a half-normal distribu-tion as usually assumed. Therefore, the technical inefficiency of the ith country attime t is
TEit ¼ expð�UitÞ: ð3Þ
The software Frontier 4.1 provided by Coelli (1996) is used in this study to per-form the maximum likelihood estimation of the stochastic frontier model. Saueret al. (2006) point out that for the consistently reliable application of the stochasticfrontier approach, certain necessary conditions should be met (e.g. monotonic con-vexity of the frontier). As the aggregate function employed in this study uses valueadded instead of real output (because of data availability), these conditions are notlikely to be met. Our specification of the agricultural ‘aggregate production func-tion’ can only be regarded as an approximation of the underlying production rela-tionships. However, using value added in the estimation of aggregate agriculturalproduction relations is a common practice in the existing literature (e.g. Hayamiand Ruttan, 1985; Fulginiti and Perrin, 1993). Agricultural value added is alsoadopted by Kudaligama and Yanagida (2000), who employ the stochastic frontierapproach to estimate inter-country agricultural production functions. Despite theflaws of inexactness and possible theoretical inconsistency, the present specificationis likely to reflect differing country performances, albeit the theoretical coherence issubject to challenge and debate. Value added by agriculture does reflect something,particularly when explained by the land, labour and capital seeking to earn a livingfrom this value added. It is reasonable to suppose that this particular characterisa-tion of the differences between national agricultural value added does reflectgenuine underlying differences between countries’ economic performance, and that
2 In the OLS regression there is only one random variable in the error term Vit which followsthe normal distribution. However, in the stochastic frontier there is a composite error termUit – Vit where Uit is the inefficiency level. As a result, the OLS regression will seriously mis-
estimate the production frontier by mixing up the inefficiency term and statistical noise inone residual term. The term c measures the proportion of the variance in the error caused byinefficiency. If c is significantly different from zero, then the stochastic frontier model shouldbe applied instead of the OLS regression.
43Governance and Agricultural Production Efficiency
� 2008 The Authors. Journal compilation � 2008 The Agricultural Economics Society.

exploration of the apparent associations between these differences and their gover-nance scores is potentially revealing.
2.1. Modelling inefficiency
Equation (2) models technical inefficiencies as functions of several exogenous deter-minants which explain differences in agricultural efficiency between countries. Thedeterminants used in this study are governance variables taken from the six gover-nance indicators developed by Kaufmann et al. (2006), which proxy the governanceinfrastructure for a broad sample of 199 countries for 1996, 1998, 2000 and 2002.3
The six governance indicators characterise governance in three dimensions. Fol-lowing Meon and Weill (2005), we call the first governance dimension ‘respect forinstitutional framework’, which is the respect of citizens and the state for the insti-tutions governing economic and social interactions. This dimension consists of twoaspects: ‘rule of law’ and ‘control of corruption’. ‘Rule of law’ measures the extentto which agents have confidence in and abide by the rules of society, and in particu-lar the quality of contract enforcement, the police and the courts, as well as thelikelihood of crime and violence. In other words, ‘rule of law’ measures the successof a society in developing an environment in which fair and predictable rules formthe basis for economic and social interactions, and importantly, the extent to whichproperty rights are protected. ‘Control of corruption’ measures the extent to whichpublic power is exercised for private gain, including both petty and grand forms ofcorruption, as well as ‘capture’ of the state by elites and private interests. The pres-ence of corruption is often a manifestation of a lack of respect on the part of boththe corrupter and the corrupted for the rules that govern their interactions (Kauf-mann et al., 2004, 2006).The second dimension – ‘government action’ – is the capacity of the government
to formulate and implement sound policies effectively. This dimension also has twoaspects: ‘government effectiveness’ and ‘regulatory quality’. ‘Government effective-ness’ measures the quality of public services, the quality of the civil service and thedegree of its independence from political pressures, the quality of policy formulationand implementation, and the credibility of the government’s commitment to suchpolicies. The main focus of this index is on inputs required for the government tobe able to produce and implement good policies and deliver public goods. ‘Regula-tory quality’ measures the ability of the government to formulate and implementsound policies and regulations that permit and promote private sector development.It includes measures of the incidence of market-unfriendly policies such as pricecontrols or inadequate bank supervision, as well as perceptions of the burdens
3 In brief, Kaufmann et al.’s (2006) methodology identifies many individual sources of dataon perceptions of governance that can be assigned to six broad categories. An unobserved
components model is then used to construct aggregate indicators from these individual mea-sures. These aggregate indicators are weighted averages of the underlying data, with weightsreflecting the precision of the individual data sources. The data sources consist of surveyed
firms and individuals, as well as the assessments of commercial risk rating agencies, non-gov-ernmental organisations, and a number of multilateral aid agencies. The data rely on a totalof 276 individual variables measuring different dimensions of governance. These are takenfrom 31 different sources, produced by 25 different organisations (Kaufmann et al., 2006).
44 Mon-Chi Lio and Jin-Li Hu
� 2008 The Authors. Journal compilation � 2008 The Agricultural Economics Society.

imposed by excessive regulation in areas such as foreign trade and business develop-ment (Kaufmann et al., 2004, 2006).The third dimension – ‘selection of authority’ – is concerned with the process by
which governments are selected, monitored and replaced. This dimension also hastwo aspects: ‘voice and accountability’ and ‘political stability’. ‘Voice and account-ability’ refers to the extent to which a country’s citizens are able to participate inselecting their government, as well as freedom of expression, freedom of associationand free media. It includes a number of indicators measuring various aspects of thepolitical process, civil liberties and political rights. ‘Political stability’ is related tothe perception of the likelihood that the government in power will be destabilisedor overthrown by possibly unconstitutional and ⁄or violent means. This index cap-tures the idea that the quality of governance in a country is compromised by thelikelihood of wrenching changes in government, which not only has a direct effecton the continuity of policies, but also at a deeper level undermines the ability of allcitizens to peacefully select and replace those in power (Kaufmann et al., 2004,2006).Governance may affect agricultural efficiency through several possible channels.
First, bad governance can act as a tax on productive activities, which leads not onlyto accumulation of less productive resources, but also to less intensive use of thoseresources, resulting in lower efficiency (Meon and Weill, 2005). An obvious exampleis that corruption can be seen as the levying of unpredictable taxes, which are harm-ful to production performance (Campos et al., 1999). Another example is that manygovernments with poor regulatory quality tend to engage in industrial protectionismand implement macroeconomic policies, levying heavy indirect taxes on agriculture.Krueger et al. (1991), in characterising policy mixes for 18 countries from 1960 to1983, find that the indirect tax on agriculture arising from market-unfriendly macro-economic policies can be three times the direct tax, which is likely to severely dis-courage production.Second, bad governance, especially corruption, encourages transfer activities and
diverts efforts from productive activities, and thus can result in low agricultural effi-ciency. In a country with a weak rule of law, widespread theft will force individualsto allocate more efforts to the protection of property. In a society where corruptionis prevalent, many resources will be diverted to rent-seeking instead of productiveactivities. Land administration agency is often one of the most corrupt governmentagencies, and agricultural projects, such as those for irrigation, are often prone tocorruption, which can blunt agricultural development (World Bank, 2007).Third, governance matters as agricultural production efficiency is affected by the
quantities and quality of public goods and services such as roads, irrigation systems,communications infrastructure, schooling, and agricultural research and extensionprograms. A high ‘government effectiveness’ implies that these public goods andservices are provided more effectively. Political instability may influence the charac-teristics of public investments as rulers in strong nations tend to invest in publicgoods to enhance long-term growth, while rulers in weak nations tend to redistrib-ute resources as bribes to potential contenders because the lack of broad popularsupport and the inability to hold on to power indefinitely shorten the rulers’ timehorizons (Moe, 1990).Fourth, governance may have an impact on agricultural efficiency by affecting
political outcomes. Political outcomes, which influence agrarian relations and deter-mine agricultural taxation, subsidisation and the provision of public goods, can
45Governance and Agricultural Production Efficiency
� 2008 The Authors. Journal compilation � 2008 The Agricultural Economics Society.

result from political bargaining between interest groups. Better ‘voice and account-ability’ may improve transparency and decentralisation of political, fiscal andadministrative power, which may change incentive structures for political participa-tion and the ability of previously powerless agrarian groups to participate. Thismay create conditions for bargaining which can be more conducive to agriculturalproduction (World Bank, 2007).However, there are counter arguments asserting that bad performance in some
aspects of governance may be compatible with high economic efficiency, and thatgood performance in some aspects of governance may be associated with low effi-ciency. A well-known example is the ‘grease the wheels hypothesis’ which arguesthat corruption may raise efficiency in a country plagued with a very slow andineffective bureaucracy (Huntington, 1968). Another instance is where permissiveintellectual property rights may facilitate and speed up technology transfers (Meonand Weill, 2005). It can also be contended that political stability may not always bebeneficial to efficiency, because many efficiency-enhancing economic reforms becomepossible only when the regimes face serious crisis (Binswanger and Deininger, 1997).Moreover, it is frequently noted in the literature that empirical work does not
provide unambiguous evidence supporting the hypothesis that democracy is associ-ated with better economic performance (Brunetti, 1997). It is possible that greaterdemocracy can reduce agricultural efficiency. The most obvious reason is that,instead of competing with each other in the market, producers in a democratic soci-ety may find that an alternative route to prosperity is to persuade the governmentto act in producers’ rather than consumers’ interests (Harvey, 2004), and greaterpolitical participation and organisation can lead to political capture of the policyagenda which is in favour of the producers but efficiency-reducing (Rausser, 1982;World Bank, 2007).Harvey (2004) identifies three major conditions that can strengthen the political
pressure for government intervention and protection of the agricultural sector. First,by Engel’s law, agriculture is inevitably subject to relative decline during economicprogress, which will increase the political pressure for protection (de Gorter andTsur, 1991). Second, the agricultural sector is usually coherent with electoral con-stituency sympathies, and agricultural products are considered to be fundamental tosurvival and prosperity. As a result, government support for the agricultural sectoris frequently politically attractive during the development process. This conditioncan been illustrated by the cases of post-war Europe and Japan, in which recentmemories of food insecurity bred domestic policies aimed at food self-sufficiencyand security. Third, the atomistic characteristic of the agricultural sector suggeststhat producers may find that there are more benefits to gain from political persua-sion relative to market competition. As producers are more concentrated than con-sumers because of specialisation, producers’ individual gains from marketprotection will outweigh individual consumer and taxpayer losses. Therefore, basedon the logic of collective action (Olson, 1965), producers have an incentive to putmore effort into persuading the political system of protection than consumers andtaxpayers can be expected to spend on opposing such protection (Harvey, 2004).Adkins et al. (2002) use the production frontier approach to investigate the effects
of three institutional variables – namely, economic freedom, political rights and civilliberties – on macroeconomic efficiency for 76 countries for 1975, 1980 and 1985.They find that economic freedom is significantly associated with technical efficiency.However, the effects of political rights and civil liberties on efficiency are
46 Mon-Chi Lio and Jin-Li Hu
� 2008 The Authors. Journal compilation � 2008 The Agricultural Economics Society.

insignificant, and for different model specifications the coefficients of both variablesrange from negative (efficiency-improving) to positive (efficiency-reducing). Meonand Weill (2005) also utilise the stochastic frontier method to test the relationshipbetween governance, measured by the six governance indicators used here, and mac-roeconomic technical efficiency on a sample of 62 countries. Their results show that,when entering the inefficiency model individually, each governance indicator is posi-tively and significantly associated with efficiency. However, if all six indicators enterthe inefficiency model and are tested against each other, then only ‘governmenteffectiveness’ appears significantly efficiency-enhancing. ‘Political stability’, ‘regula-tory quality’ and ‘control of corruption’ appear to be associated with inefficiency,though insignificantly. Therefore, although it seems reasonable to hypothesise thatgood governance is efficiency-improving for agricultural production, there are stillreasons to be cautious as to the a priori relationship between governance and agri-cultural efficiency.To test the relationship between governance and agricultural efficiency empiri-
cally, we specify agricultural inefficiency for country i in period t as follows:
Uit ¼ d0 þ d1Governanceit þ eit ; ð4Þ
where ‘Governance’ is the relevant variable of governance. The effect of a country’sgovernance on agricultural performance is characterised by this inefficiency equation.
3. Data Sources and Variable Definitions
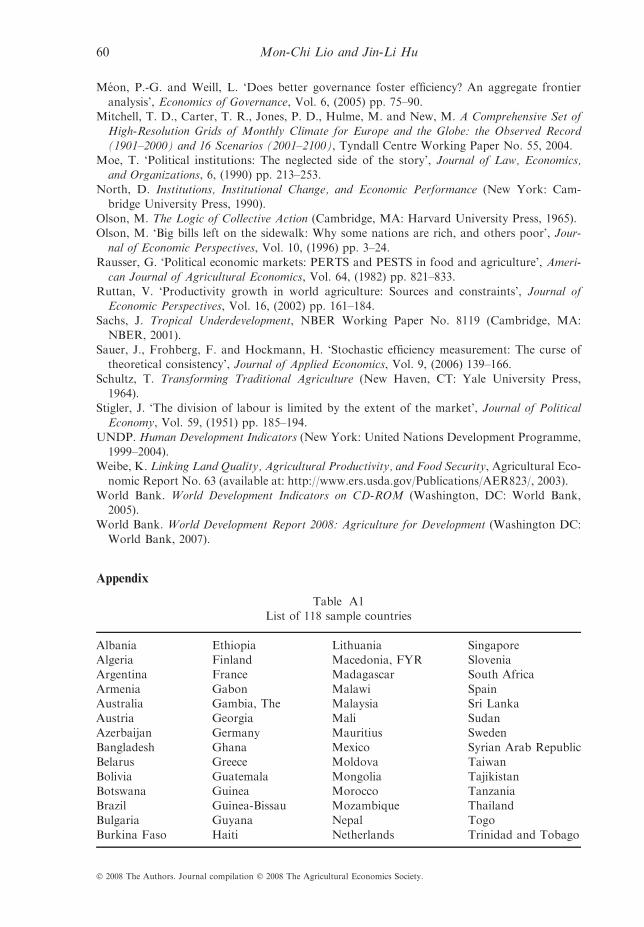
We use a sample of 118 countries with data for the years of 1996, 1998, 2000 and2002. The list of sample countries is provided in Table A1. Two main datasets areemployed. The first incorporates figures from the World Bank’s World DevelopmentIndicators (2005) on agricultural total output and also from the FAOSTAT (2005)on agricultural inputs. The agricultural total output is measured by agriculturalvalue added in constant 2000 international dollars (PPP). For the estimation of theaggregate agricultural value-added function, five agricultural inputs are used, includ-ing labour, land, livestock, fertilisers and machinery. The definitions of these inputsare as follows. Labour is measured as the economically active population in theagricultural sector (in thousands of participants). Land is measured as thousands ofhectares of arable land and permanent cropland. Livestock is measured as thou-sands of cow-equivalent livestock units, following Hayami and Ruttan (1970).Fertiliser is measured by the sum of the nitrogen, potash and phosphate content ofvarious fertilisers consumed, measured in metric tons. Machinery is measured bythe number of agricultural tractors.For the control variables, general education level (Edu) is measured by the com-
bined primary, secondary, and tertiary enrolment ratio, provided by Human Devel-opment Report (UNDP, 1999–2004). Land quality (Landqual) is measured by thepercentage of total land being permanent cropland, obtained from World Develop-ment Indicators (2005). The climate variables, including Precip, Precipsd and Temp,are obtained from Mitchell et al. (2004).The second main dataset is from Kaufmann et al. (2006), which provides aggre-
gate indicators for six aspects of governance, including measures for the rule of law(Rulelaw), control of corruption (Concorr), government effectiveness (Goveff), regu-latory quality (Reguqual), voice and accountability (Voiacc), and political stability(Polstab). The six governance indicators are measured in indices ranging from about
47Governance and Agricultural Production Efficiency
� 2008 The Authors. Journal compilation � 2008 The Agricultural Economics Society.

Table 1
Definitions and sources of main variables
Variables Definitions Sources
Agricultural output and essential inputsOutput Agricultural total output (PPP), measured by
agricultural value-added in constant 2000international dollars
World Bank (2005)
Labour Agricultural labour force, measured bythousands of participants in an economicallyactive population in agriculture
FAOSTAT (2005)
Land Arable land and permanent cropland, inthousands of hectares
FAOSTAT (2005)
Livestk Thousands of cow-equivalent livestock units
as calculated by Hayami and Ruttan (1970)
FAOSTAT (2005)
Fert Sum of nitrogen, potash, and phosphatecontent of various fertilisers consumed,measured in metric tons
FAOSTAT (2005)
Tractor Number of agricultural tractors FAOSTAT (2005)
Governance variablesRulelaw Index for the ‘rule of law’ Kaufmann et al. (2006)Concorr Index for the ‘control of corruption’ Kaufmann et al. (2006)Goveff Index for the ‘government effectiveness’ Kaufmann et al. (2006)
Reguqual Index for the ‘regulatory quality’ Kaufmann et al. (2006)Voiacc Index for the ‘voice and accountability’ Kaufmann et al. (2006)Polstab Index for the ‘political stability’ Kaufmann et al. (2006)
Respinst Respect for institutional framework,measured by the mean value of Rulelawand Concorr
Kaufmann et al. (2006)
Govact Government action, measured by the meanvalue of Goveff and Reguqual
Kaufmann et al. (2006)
Selauth Selection of the authority, measured by themean value of Voiacc and Polstab
Kaufmann et al. (2006)
Econfree Economic freedom index Gartzke et al. (2005)Polright Political rights index, rescaled so that 7 is
the highest political rights rating and 1
is the lowest political rights rating
Freedom House (2008)
Control variables
Edu Education index, measured by the combinedprimary, secondary and tertiary grossenrolment ratio
UNDP (1999–2004)
Landlock Dummy variable, landlocked countries = 1 CIA (2005)Landqual Land quality, measured by percentage of
total land being permanent croplandWorld Bank (2005)
Precip Annual precipitation, in millimetres, averaged
over 1961–1990
Mitchell et al. (2004)
Precipsd Standard deviation of annual precipitationover 1961–1990, in millimetres
Mitchell et al. (2004)
48 Mon-Chi Lio and Jin-Li Hu
� 2008 The Authors. Journal compilation � 2008 The Agricultural Economics Society.
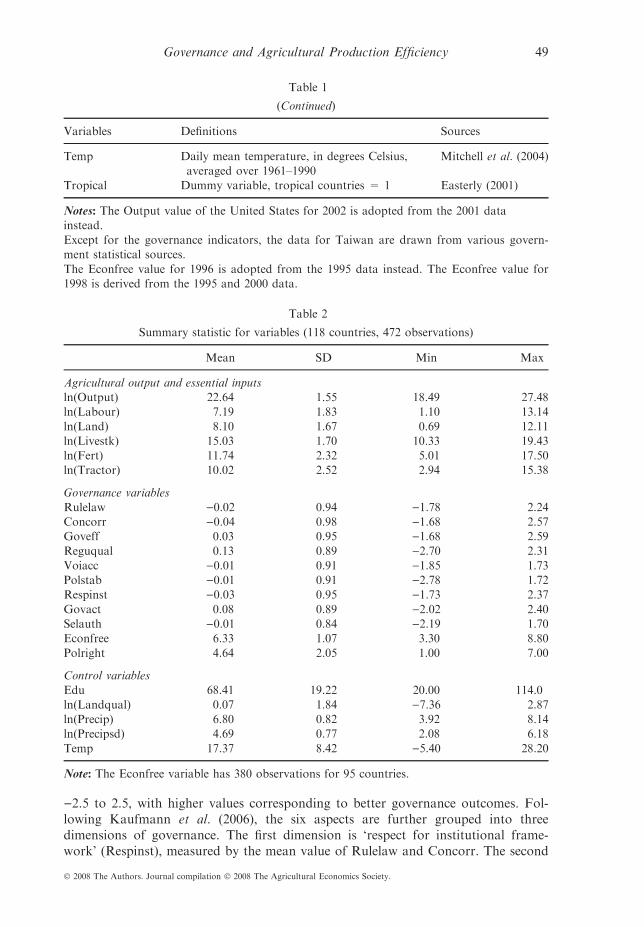
)2.5 to 2.5, with higher values corresponding to better governance outcomes. Fol-lowing Kaufmann et al. (2006), the six aspects are further grouped into threedimensions of governance. The first dimension is ‘respect for institutional frame-work’ (Respinst), measured by the mean value of Rulelaw and Concorr. The second
Table 1
(Continued)
Variables Definitions Sources
Temp Daily mean temperature, in degrees Celsius,averaged over 1961–1990
Mitchell et al. (2004)
Tropical Dummy variable, tropical countries = 1 Easterly (2001)
Notes: The Output value of the United States for 2002 is adopted from the 2001 datainstead.Except for the governance indicators, the data for Taiwan are drawn from various govern-ment statistical sources.
The Econfree value for 1996 is adopted from the 1995 data instead. The Econfree value for1998 is derived from the 1995 and 2000 data.
Table 2
Summary statistic for variables (118 countries, 472 observations)
Mean SD Min Max
Agricultural output and essential inputsln(Output) 22.64 1.55 18.49 27.48ln(Labour) 7.19 1.83 1.10 13.14
ln(Land) 8.10 1.67 0.69 12.11ln(Livestk) 15.03 1.70 10.33 19.43ln(Fert) 11.74 2.32 5.01 17.50ln(Tractor) 10.02 2.52 2.94 15.38
Governance variables
Rulelaw )0.02 0.94 )1.78 2.24Concorr )0.04 0.98 )1.68 2.57Goveff 0.03 0.95 )1.68 2.59Reguqual 0.13 0.89 )2.70 2.31
Voiacc )0.01 0.91 )1.85 1.73Polstab )0.01 0.91 )2.78 1.72Respinst )0.03 0.95 )1.73 2.37
Govact 0.08 0.89 )2.02 2.40Selauth )0.01 0.84 )2.19 1.70Econfree 6.33 1.07 3.30 8.80
Polright 4.64 2.05 1.00 7.00
Control variables
Edu 68.41 19.22 20.00 114.0ln(Landqual) 0.07 1.84 )7.36 2.87ln(Precip) 6.80 0.82 3.92 8.14ln(Precipsd) 4.69 0.77 2.08 6.18
Temp 17.37 8.42 )5.40 28.20
Note: The Econfree variable has 380 observations for 95 countries.
49Governance and Agricultural Production Efficiency
� 2008 The Authors. Journal compilation � 2008 The Agricultural Economics Society.

dimension is ‘government action’ (Govact), measured by the mean value of Goveffand Reguqual. The third dimension ‘selection of the authority’ (Selauth) is mea-sured by the mean value of Voiacc and Polstab.Two additional governance-related variables are also employed in this study. The
first is the economic freedom index (Econfree) provided by the Economic Freedomof the World (EFW) project (Gartzke et al., 2005). The other variable is the Politi-cal Rights index (Polright) from the Freedom in the World dataset provided by Free-dom House (2008). We re-scale Polright such that 7 is the highest political rightsrating and 1 is the lowest political rights rating. We use these indices as alternativereflections of aspects of governance to the Kaufmann et al. (2006) data, to test therobustness of the apparent relationships between governance and productivity.Table 1 summarises definitions and sources of the main variables used in this study.Table 2 presents the descriptive statistics for each variable.
4. Results
Tables 3–5 display the results of models (1)–(6), which include each of the six basicgovernance indicators as the determinant of inefficiency. Table 3 shows the results
Table 3
Maximum likelihood estimates of the agricultural production frontier and determinantsof technical inefficiency – results for the ‘respect for institutional framework’ variables:
Rulelaw and Concorr
Variable
Model (1) Rulelaw Model (2) Concorr
Coefficient t-Ratio Coefficient t-Ratio
Production functionConstant 15.06*** 44.87 15.07*** 44.79ln(Labour) 0.34*** 13.14 0.34*** 13.17
ln(Land) 0.09*** 2.84 0.09*** 2.84ln(Livestk) 0.12*** 4.42 0.11*** 4.18ln(Fert) 0.21*** 11.52 0.21*** 11.60
ln(Tractor) 0.05** 2.22 0.05** 2.51Edu 0.00 0.94 0.00 1.00ln(Landqual) 0.09*** 6.06 0.09*** 5.97
ln(Precip) 0.27*** 3.93 0.27*** 4.00ln(Precipsd) )0.39*** )4.88 )0.39*** )4.92Temp 0.01** 2.26 0.01** 2.40Tropical )0.25*** )2.57 )0.25*** )2.62Landlock )0.24*** )3.98 )0.23*** )3.93
Inefficiency functionConstant 0.01 0.02 )0.12 )0.24Governance variable )0.22** )2.32 )0.24** )2.19r2 0.42*** 2.72 0.46*** 2.66
c 0.87*** 14.98 0.88*** 16.37Log-likelihood )267.05 )267.09
Notes: Asterisks indicate significance at 10% (*); 5% (**) and 1% (***).
Number of countries = 118.Number of observations = 472.
50 Mon-Chi Lio and Jin-Li Hu
� 2008 The Authors. Journal compilation � 2008 The Agricultural Economics Society.

for Rulelaw and Concorr, the governance aspects of ‘respect for institutional frame-work’. Table 4 contains the results for Goveff and Reguqual, which are aspects of‘government action’. The results for Voiacc and Polstab, aspects of ‘selection ofauthority’, are shown in Table 5.Note that all the c parameters in these tables are significant, implying that the
variance caused by inefficiency is significantly larger than zero and hence stochasticfrontiers are appropriate. The coefficients of the agricultural inputs and controlvariables in the function are fairly stable across different models used here. Tables 3–5 show that the coefficients of five essential agricultural inputs, Labour, Land,Livestk, Fert and Tractor, all exhibit expected signs with high statistical signifi-cance. Moreover, the magnitudes of the coefficients are similar to those reported inthe literature using agricultural value added as the agricultural total output (e.g.Fulginiti and Perrin, 1993; Kudaligama and Yanagida, 2000).The coefficients of Edu are positive but insignificant, consistent with findings in
the literature. As expected, the coefficients of Landqual, the land quality variable,are positive and significant. For the climate variables, the coefficients of Precip andTemp are positive and significant. The coefficients of Precipsd are negative and sig-nificant. The coefficients of Landlock and Tropical are negative and significant,
Table 4
Maximum likelihood estimates of the agricultural production frontier and determinants of
technical inefficiency – results for the ‘government action’ variables: Goveff and Reguqual
Variable
Model (3) Goveff Model (4) Reguqual
Coefficient t-Ratio Coefficient t-Ratio
Production functionConstant 15.05*** 44.27 14.81*** 41.60
ln(Labour) 0.34*** 13.12 0.33*** 12.23ln(Land) 0.09*** 2.90 0.10*** 3.20ln(Livestk) 0.12*** 4.33 0.12*** 4.37
ln(Fert) 0.21*** 11.60 0.21*** 11.26ln(Tractor) 0.05** 2.33 0.05** 2.18Edu 0.00 0.99 0.00 1.48ln(Landqual) 0.09*** 5.93 0.09*** 5.88
ln(Precip) 0.27*** 3.93 0.30*** 4.31ln(Precipsd) )0.38*** )4.85 )0.40*** )5.04Temp 0.01** 2.42 0.01*** 2.59
Tropical )0.26*** )2.67 )0.30*** )3.07Landlock )0.23*** )3.87 )0.25*** )4.28
Inefficiency functionConstant )0.08 )0.17 )0.55 )0.51Governance variable )0.23** )2.23 )0.05 )0.52r2 0.46*** 2.64 0.61 1.62c 0.87*** 15.57 0.88*** 12.86Log-likelihood )267.33 )271.06
Notes: Asterisks indicate significance at 10% (*); 5% (**), and 1% (***).Number of countries = 118.Number of observations = 472.
51Governance and Agricultural Production Efficiency
� 2008 The Authors. Journal compilation � 2008 The Agricultural Economics Society.
indicating that being landlocked or in the tropics have negative impacts on a coun-try’s agricultural value added. These results are also consistent with findings in theliterature.For the governance variables, it is found that different dimensions of governance
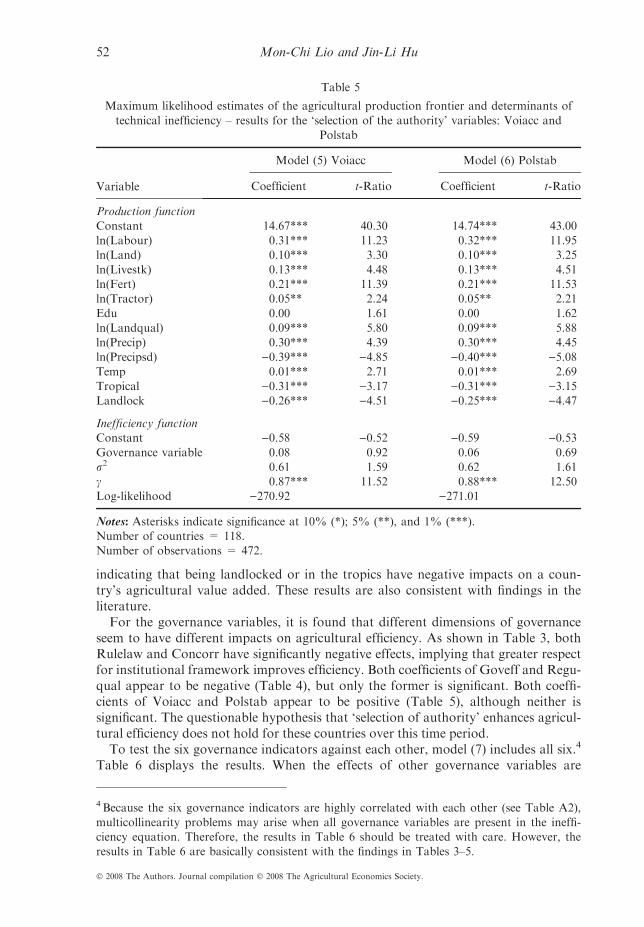
seem to have different impacts on agricultural efficiency. As shown in Table 3, bothRulelaw and Concorr have significantly negative effects, implying that greater respectfor institutional framework improves efficiency. Both coefficients of Goveff and Regu-qual appear to be negative (Table 4), but only the former is significant. Both coeffi-cients of Voiacc and Polstab appear to be positive (Table 5), although neither issignificant. The questionable hypothesis that ‘selection of authority’ enhances agricul-tural efficiency does not hold for these countries over this time period.To test the six governance indicators against each other, model (7) includes all six.4
Table 6 displays the results. When the effects of other governance variables are
Table 5
Maximum likelihood estimates of the agricultural production frontier and determinants of
technical inefficiency – results for the ‘selection of the authority’ variables: Voiacc andPolstab
Variable
Model (5) Voiacc Model (6) Polstab
Coefficient t-Ratio Coefficient t-Ratio
Production function
Constant 14.67*** 40.30 14.74*** 43.00ln(Labour) 0.31*** 11.23 0.32*** 11.95ln(Land) 0.10*** 3.30 0.10*** 3.25
ln(Livestk) 0.13*** 4.48 0.13*** 4.51ln(Fert) 0.21*** 11.39 0.21*** 11.53ln(Tractor) 0.05** 2.24 0.05** 2.21Edu 0.00 1.61 0.00 1.62
ln(Landqual) 0.09*** 5.80 0.09*** 5.88ln(Precip) 0.30*** 4.39 0.30*** 4.45ln(Precipsd) )0.39*** )4.85 )0.40*** )5.08Temp 0.01*** 2.71 0.01*** 2.69Tropical )0.31*** )3.17 )0.31*** )3.15Landlock )0.26*** )4.51 )0.25*** )4.47
Inefficiency functionConstant )0.58 )0.52 )0.59 )0.53Governance variable 0.08 0.92 0.06 0.69r2 0.61 1.59 0.62 1.61c 0.87*** 11.52 0.88*** 12.50Log-likelihood )270.92 )271.01
Notes: Asterisks indicate significance at 10% (*); 5% (**), and 1% (***).Number of countries = 118.Number of observations = 472.
4 Because the six governance indicators are highly correlated with each other (see Table A2),multicollinearity problems may arise when all governance variables are present in the ineffi-ciency equation. Therefore, the results in Table 6 should be treated with care. However, theresults in Table 6 are basically consistent with the findings in Tables 3–5.
52 Mon-Chi Lio and Jin-Li Hu
� 2008 The Authors. Journal compilation � 2008 The Agricultural Economics Society.

controlled, Rulelaw, Concorr and Goveff appear to improve efficiency (negative coef-ficiants), though only Rulelaw is significant. Reguqual, Voiacc and Polstab all appearto promote inefficiency (positive coefficients). In particular, better ‘voice and account-ability’ and ‘political stability’ both seem significant in reducing agricultural effi-ciency, which is consistent with the interest group capture and political failurearguments of the political economy literature (especially among developed countries).To examine the robustness of the empirical findings in Tables 3 and 6, in
models (8)–(11) we employed governance-related indicators from sources otherthan Kaufmann et al. (2006) in the inefficiency function. The first is the eco-nomic freedom index (Econfree) from Gartzke et al. (2005), which measures thedegree to which the policies and institutions of countries are supportive of eco-nomic freedom.Table 7 shows the results of models (8) and (9). In model (8) we use Econfree as
the governance variable in the inefficiency equation. In model (9) we include six
Table 6
Estimates of the agricultural production frontier and determinants of
technical inefficiency – results for six governance indicators
Variable
Model (7)
Coefficient t-Ratio
Production functionConstant 14.74*** 43.08
ln(Labour) 0.30*** 10.75ln(Land) 0.12*** 3.71ln(Livestk) 0.14*** 4.83
ln(Fert) 0.20*** 10.90ln(Tractor) 0.05** 2.43Edu 0.00 0.81ln(Landqual) 0.09*** 6.16
ln(Precip) 0.26*** 3.96ln(Precipsd) )0.32*** )4.23Temp 0.01** 2.00
Tropical )0.20** )2.15Landlock )0.22*** )3.61
Inefficiency functionConstant 0.22 0.85Rulelaw )0.40** )1.96Concorr )0.02 )0.12Goveff )0.24 )1.32Reguqual 0.16 1.23Voiacc 0.26** 2.04
Polstab 0.22** 1.99r2 0.32*** 3.34c 0.82*** 10.80
Log-likelihood )252.38
Notes: Asterisks indicate significance at 10% (*); 5% (**), and 1% (***).Number of countries = 118.
Number of observations = 472.
53Governance and Agricultural Production Efficiency
� 2008 The Authors. Journal compilation � 2008 The Agricultural Economics Society.
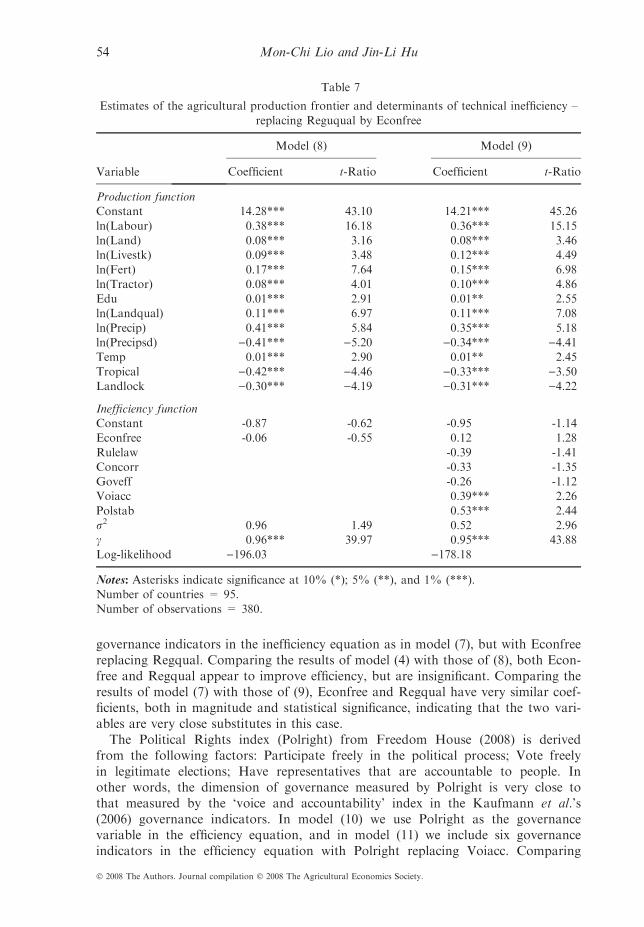
governance indicators in the inefficiency equation as in model (7), but with Econfreereplacing Regqual. Comparing the results of model (4) with those of (8), both Econ-free and Regqual appear to improve efficiency, but are insignificant. Comparing theresults of model (7) with those of (9), Econfree and Regqual have very similar coef-ficients, both in magnitude and statistical significance, indicating that the two vari-ables are very close substitutes in this case.The Political Rights index (Polright) from Freedom House (2008) is derived
from the following factors: Participate freely in the political process; Vote freelyin legitimate elections; Have representatives that are accountable to people. Inother words, the dimension of governance measured by Polright is very close tothat measured by the ‘voice and accountability’ index in the Kaufmann et al.’s(2006) governance indicators. In model (10) we use Polright as the governancevariable in the efficiency equation, and in model (11) we include six governanceindicators in the efficiency equation with Polright replacing Voiacc. Comparing
Table 7
Estimates of the agricultural production frontier and determinants of technical inefficiency –
replacing Reguqual by Econfree
Variable
Model (8) Model (9)
Coefficient t-Ratio Coefficient t-Ratio
Production functionConstant 14.28*** 43.10 14.21*** 45.26
ln(Labour) 0.38*** 16.18 0.36*** 15.15ln(Land) 0.08*** 3.16 0.08*** 3.46ln(Livestk) 0.09*** 3.48 0.12*** 4.49
ln(Fert) 0.17*** 7.64 0.15*** 6.98ln(Tractor) 0.08*** 4.01 0.10*** 4.86Edu 0.01*** 2.91 0.01** 2.55ln(Landqual) 0.11*** 6.97 0.11*** 7.08
ln(Precip) 0.41*** 5.84 0.35*** 5.18ln(Precipsd) )0.41*** )5.20 )0.34*** )4.41Temp 0.01*** 2.90 0.01** 2.45
Tropical )0.42*** )4.46 )0.33*** )3.50Landlock )0.30*** )4.19 )0.31*** )4.22
Inefficiency functionConstant -0.87 -0.62 -0.95 -1.14Econfree -0.06 -0.55 0.12 1.28
Rulelaw -0.39 -1.41Concorr -0.33 -1.35Goveff -0.26 -1.12Voiacc 0.39*** 2.26
Polstab 0.53*** 2.44r2 0.96 1.49 0.52 2.96c 0.96*** 39.97 0.95*** 43.88
Log-likelihood )196.03 )178.18
Notes: Asterisks indicate significance at 10% (*); 5% (**), and 1% (***).Number of countries = 95.
Number of observations = 380.
54 Mon-Chi Lio and Jin-Li Hu
� 2008 The Authors. Journal compilation � 2008 The Agricultural Economics Society.

the results of model (5) with (10), Polright and Voiacc are both positive. Com-paring the results of model (7) with those of (11), both Polright and Voiacc arepositive and significant. Again, Polright and Voiacc appear to be close substi-tutes in explaining agricultural inefficiency (Table 8).5
Utilising the classification system of Kaufmann et al. (2006), we group the gover-nance indicators into three dimensions of governance – ‘respect for institutionalframework’ (Respinst), ‘government action’ (Govact) and ‘selection of the authority’
Table 8
Estimates of the agricultural production frontier and determinants of technical inefficiency –
replacing Voiacc by Polright
Variable
Model (10) Model (11)
Coefficient t-Ratio Coefficient t-Ratio
Production functionConstant 14.55*** 39.29 14.78*** 42.57
ln(Labour) 0.31*** 10.83 0.31*** 11.01ln(Land) 0.11*** 3.43 0.12*** 3.61ln(Livestk) 0.13*** 4.74 0.13*** 4.71
ln(Fert) 0.21*** 11.33 0.20*** 11.01ln(Tractor) 0.05** 2.28 0.05** 2.24Edu 0.00 1.56 0.00 0.77ln(Landqual) 0.09*** 5.80 0.09*** 6.23
ln(Precip) 0.30*** 4.54 0.27*** 3.98ln(Precipsd) )0.38*** )4.71 )0.34*** )4.30Temp 0.01*** 2.64 0.01** 1.97
Tropical )0.32*** )3.29 )0.21** )2.19Landlock )0.26*** )4.62 )0.22*** )3.62
Inefficiency functionConstant )0.73 )0.74 )0.10 )0.28Polright 0.07 1.64 0.07* 1.92
Rulelaw )0.38** )2.01Concorr )0.01 )0.04Goveff )0.21 )1.23Reguqual 0.19 1.51
Polstab 0.25** 2.22r2 0.53 1.83* 0.32*** 3.29c 0.86 10.59*** 0.82*** 10.84
Log-likelihood )270.06 )253.50
Notes: Asterisks indicate significance at 10% (*); 5% (**), and 1% (***).Number of countries = 118.
Number of observations = 472.
5 Freedom House provides another freedom index, the Civil Liberties index, which is alsovery close to the ‘voice and accountability’ indicator provided by Kaufmann et al. (2006).We had performed tests which used this index to replace Voiacc in the inefficiency function.The results showed that this index generates estimation results very similar to that of Voiacc.
55Governance and Agricultural Production Efficiency
� 2008 The Authors. Journal compilation � 2008 The Agricultural Economics Society.

(Selauth).6 These three governance variables were then used to estimate the ineffi-ciency equation. Table 9 reports the results.The first three columns of Table 9 display the estimates of models (12)–(15). In
models (12)–(14) we use three dimensions of governance independently in the ineffi-ciency equation. In model (12), Respinst is significantly negative at the 5% level.Model (13) finds that Govact significantly reduces inefficiency at the 10% level, sug-gesting that improving these two dimensions of governance can increase agriculturalefficiency. In model (14) the estimated coefficient of Selauth in the inefficiency equa-tion is positive though insignificant.Model (15) includes all three dimensions of governance together. Table 9 shows
the result in the last column. The results indicate that Respinst significantly
Table 9
Estimates of the agricultural production frontier and determinants of technical inefficiency –
results for three governance aspects
Variable
Model (12) Model (13) Model (14) Model (15)
Coefficient t-Ratio Coefficient t-Ratio Coefficient t-Ratio Coefficient t-Ratio
Production functionConstant 15.08*** 44.89 14.95*** 42.52 14.70*** 41.64 14.85*** 45.38
ln(Labour) 0.34*** 13.13 0.33*** 12.67 0.32*** 11.51 0.32*** 11.83ln(Land) 0.09*** 2.77 0.09*** 2.93 0.10*** 3.27 0.11*** 3.69ln(Livestk) 0.12*** 4.29 0.12*** 4.25 0.13*** 4.50 0.12*** 4.49
ln(Fert) 0.21*** 11.61 0.21*** 11.71 0.21*** 11.52 0.20*** 11.17ln(Tractor) 0.05** 2.38 0.05** 2.24 0.05** 2.23 0.06*** 2.79Edu 0.00 0.93 0.00 1.25 0.00 1.63 0.00 0.89ln(Landqual) 0.09*** 6.02 0.09*** 5.82 0.09*** 5.83 0.09*** 6.07
ln(Precip) 0.27*** 3.95 0.28*** 4.11 0.30*** 4.42 0.26*** 3.98ln(Precipsd) )0.39*** )4.90 )0.40*** )5.00 )0.40*** )4.97 )0.34*** )4.41Temp 0.01** 2.32 0.01** 2.49 0.01*** 2.71 0.01** 2.10
Tropical )0.25** )2.57 )0.28*** )2.89 )0.31*** )3.16 )0.21** )2.23Landlock )0.23*** )3.96 )0.24*** )4.06 )0.26*** )4.54 )0.21*** )3.43
Inefficiency functionConstant )0.04 )0.08 )0.26 )0.38 )0.57 )0.52 0.12 0.40Respinst )0.24** )2.32 )0.61** )2.51Govact )0.17* )1.69 0.04 0.22Selauth 0.08 0.86 0.54*** 2.65r2 0.44*** 2.71 0.52** 2.08 0.61 1.61 0.36*** 3.22c 0.87*** 15.78 0.87*** 14.31 0.88*** 11.99 0.84*** 13.47
Log-likelihood )266.87 )269.72 )270.94 )255.27
Notes: Asterisks indicate significance at 10% (*); 5% (**), and 1% (***).Number of countries = 118.
Number of observations = 472.
6 There are other methods, such as principal components analysis or factor analysis, which
could be used to reduce the number of governance variables. However, these approaches arelikely to reveal one component or factor because of the high correlation between the six gov-ernance indicators. Therefore, we divided the six governance indicators into three aspectsaccording to Kaufmann et al.’s (2006) theoretical concepts.
56 Mon-Chi Lio and Jin-Li Hu
� 2008 The Authors. Journal compilation � 2008 The Agricultural Economics Society.

improves efficiency, while Govact seems not to, though insignificant. On the otherhand, Selauth significantly reduces efficiency according to this specification, echoingthe previous results based on the twin aspects of this dimension of governance.Table 10 reports the differences in the average agricultural efficiency score
between different groups of countries. The average agricultural efficiency score forall countries over the 1996–2002 period is 64.7. High-income countries have thehighest average agricultural efficiency score, 76.4, which is 14.3 points higher thanthe average efficiency score of low-income countries (62.1) and 11.8 points higherthan the average efficiency score of lower middle-income countries (64.6).These results suggest that there is still much scope to improve the agricultural
efficiency of poor countries, especially by improving the ‘respect for institutionalframework’ in these countries. However, we also find that upper middle-incomecountries have the lowest average agricultural efficiency score, 57.7, which is 7.0points lower than the average score of all countries and 18.7 points lower than theaverage score of the high-income countries (76.4). A possible explanation of thisresult is that in some of the upper middle-income countries the speed of improve-ment in ‘selection of authority’ is much faster than that in ‘respect for institutionalframework’ as the latter aspect of governance usually needs more time to develop,and this imbalanced development of the two dimensions of governance is associatedwith negative impacts on agricultural efficiency.7
5. Conclusion
Applying the stochastic frontier approach to a sample of 118 countries for 1996, 1998,2000 and 2002, we investigate how differences in governance variables may explaincross-country differences in agricultural efficiency. The governance variables used inthis study include the six governance indicators developed by Kaufmann et al. (2006).
Table 10
The differences in the agricultural efficiency scores based on model (15): countries classified
by income level
Agricultural efficiency scores (%)
1996 1998 2000 2002 Average
High income (N = 22) 77.27 76.20 76.97 75.19 76.41Upper middle income (N = 24) 59.48 58.27 54.69 58.18 57.66
Lower middle income (N = 38) 64.95 64.92 64.08 64.61 64.64Low income (N = 34) 61.94 61.80 62.25 62.55 62.13All countries (N = 118) 65.27 64.77 64.05 64.68 64.69
7Over the 1996–2002 period, the average scores of ‘respect for institutional framework’ for
high-income, upper middle-income, lower middle-income and low-income countries are 1.57,0.18, )0.50 and )0.67, respectively. The average scores of ‘selection of authority’ for high-income, upper middle-income, lower middle-income and low-income countries are 1.10, 0.40,
)0.40 and )0.60, respectively. The difference in the average scores of ‘selection of authority’between upper middle-income and low-income countries is 1.00, which is higher than the dif-ference in the average scores of ‘respect for institutional framework’ between upper middle-income and low-income countries (0.84).
57Governance and Agricultural Production Efficiency
� 2008 The Authors. Journal compilation � 2008 The Agricultural Economics Society.

Our results indicate that the hypothesis of ‘better governance fosters efficiency’ maybe only partly true for agricultural production, because different dimensions andaspects of governance appear to have different impacts on agricultural efficiency.Our results are consistent with findings in the related literature. For example,
Adkins et al. (2002) do not find significant impacts of political rights and civil liber-ties on efficiency. Furthermore, for some model specifications the two variablesappear to be efficiency-reducing. Meon and Weill (2005) also present a significantlypositive coefficient for the ‘political stability’ variable when all six governanceindicators are present in the inefficiency equation.Several policy implications can be drawn from this study. The first is obvious: to
enhance agricultural efficiency, one of the most important things for a governmentto do is to provide an environment where property rights are secure and the gainsfrom investments and efforts are well protected. The political institutions need toencourage people to engage in production instead of transfer activities. Govern-ments should refrain from arbitrary actions and unpredictable policies which maymake people hesitant to undertake long-term investments.The last several decades have seen many international efforts devoted to enhanc-
ing the agricultural performance of developing countries. Substantial effort hasfocused on improving the quality of government action. However, our results sug-gest that, if the institutional framework has provided farmers the necessary incen-tive to use their resources efficiently, then the quality of government action plays arather insignificant role in improving agricultural efficiency. Therefore, in order toimprove agricultural efficiency in many developing countries, in addition to helpingtheir governments to be more active, more emphasis should be put on encouragingthese governments to fulfil what North (1990) calls the role of the ‘impartial thirdparty’, reduce rent-seeking activities and strengthen citizens’ faith in the rule of law.As regards the role of democracy in determining agricultural efficiency, one
should be cautious in drawing out policy implications from our empirical results.Our results do not imply that autocracy is better than democracy in fostering agri-cultural efficiency. The reason is that democracy may help improve other dimen-sions of governance such as the rule of law and corruption control, which areimportant for farmers to produce efficiently. However, our results do imply thatdemocracy itself may generate some negative effects, causing agricultural production(value added) to become less efficient. This finding is consistent with arguments inthe political economy literature that highly democratic and participatory systemsallow producers to capture the political system and to engineer distorting policies intheir favour, at the expense of efficiency (de Gorter and Tsur, 1991). In this case, asHarvey (2004) points out, the key to improving agricultural efficiency will lie inhow to overcome the difficulties in reconciling economic efficiency and politicalacceptability in democratic systems.
References
Adkins, L. C., Moomaw, R. L. and Savvides, A. ‘Institutions, freedom, and technical effi-ciency’, Southern Economic Journal, Vol. 69, (2002) pp. 92–108.
Battese, G. E. and Coelli, T. J. ‘A model for technical inefficiency effects in a stochastic pro-
duction frontier for panel data’, Empirical Economics, Vol. 20, (1995) pp. 325–332.Binswanger, H. and Deininger, K. ‘Explaining agricultural and agrarian policies in develop-ing countries’, Journal of Economic Literature, 35, (1997) pp. 1958–2005.
58 Mon-Chi Lio and Jin-Li Hu
� 2008 The Authors. Journal compilation � 2008 The Agricultural Economics Society.
Bravo-Ortega, C. and Lederman, D. ‘Agricultural productivity and its determinants: Revisit-
ing international experiences’, Estudios de Economıa, Vol. 31, (2004) pp. 133–163.Brunetti, A. ‘Political variables in cross-country growth analysis’, Journal of EconomicSurveys, Vol. 11, (1997) pp. 163–190.
Campos, J. E., Lien, D. and Pradhan, S. ‘The impact of corruption on investment: Predict-ability matters’, World Development, Vol. 27, (1999) pp. 1059–1067.
CIA. World Factbook (Washington, DC: Central Intelligence Agency, 2005).
Coelli, T. J. A Guide to Frontier 4.1: A Computer Program for Stochastic Production and CostFunction Estimation, Working Paper 96 ⁄ 07 (Armidale: Centre for Efficiency and Productiv-ity Analysis, University of New England, 1996 ).
Duncan, R. and Pollard, S. ‘A conceptual framework for designing a country poverty reduc-
tion strategy’, in C. Edmonds and S. Medina (eds). Defining an Agenda for Poverty Reduc-tion: Proceedings of the First Asia and Pacific Forum on Poverty, Vol. 1 (Manila: AsianDevelopment Bank, 2002, pp. 91–107).
Easterly, W. R. (2001). ‘Global Development Network Growth Database’ (World Bank; avail-able at: http://econ.worldbank.org/WBSITE/EXTERNAL/EXTDEC/EXTRESEARCH/0,contentMDK:20701055�pagePK:64214825�piPK:64214943�theSitePK:469382,00.html#4).
FAOSTAT (2005). Food and Agriculture Organization Statistical Databases (available at:http://faostat.fao.org/site/291/default.aspx).
Faye, M. L., McArthur, J. W., Sachs, J. D. and Snow, T. ‘The challenges facing landlockeddeveloping countries’, Journal of Human Development, 5, (2004) pp. 31–68.
Freedom House (2008), Freedom in the World (available at: http://www.freedomhouse.org).Fulginiti, L. E. and Perrin, R. K. ‘Prices and productivity in agriculture’, Review of Econom-ics and Statistics, Vol. 75, (1993) pp. 471–482.
Gartzke, E., Gwartney, D. J. and Lawson, R. A. Economic Freedom of the World: 2005Annual Report (Vancouver: The Fraser Institute, 2005; available at: http://www.freetheworld.com).
de Gorter, H. and Tsur, Y. ‘Explaining price policy bias in agriculture: The calculus of sup-port-maximising politicians’, American Journal of Agricultural Economics, Vol. 73, (1991)pp. 1244–1254.
Harvey, D. R. ‘Policy dependency and reform: Economic gains versus political pains’, Agri-
cultural Economics, Vol. 31, (2004) pp. 265–275.Hayami, Y. and Ruttan, V. ‘Agricultural productivity differences among countries’, AmericanEconomic Review, Vol. 60, (1970) pp. 895–911.
Hayami, Y. and Ruttan, V. Agricultural Development: An International Perspective (Balti-more, MD: Johns Hopkins University Press, 1985).
Huntington, S. P. Political Order in Changing Societies (New Haven, CT: Yale University
Press, 1968).Kaufmann, D., Kraay, A. and Mastruzzi, M. ‘Governance matters III: Governance indicatorsfor 1996, 1998, 2000, and 2002’, World Bank Economic Review. Vol. 18 (2004) pp. 253–287.
Kaufmann, D., Kraay, A. and Mastruzzi, M. Governance Matters V: Aggregate and Indi-
vidual Governance Indicators for 1996–2005, Working Paper (Washington, DC: WorldBank, 2006).
Krueger, A., Schiff, M. and Valdes, A. Political Economy of Agricultural Pricing Policy (Bal-
timore, MD: Johns Hopkins University Press, 1991).Kudaligama, V. P. and Yanagida, J. F. ‘A comparison of intercountry agricultural produc-tion function: A frontier function approach’. Journal of Economic Development, Vol. 25,
(2000) pp. 57–74.Liu, Z. and Zhuang, J. ‘Determinants of technical efficiency in post-collective Chinese agri-culture: Evidence from farm-level data’. Journal of Comparative Economics, Vol. 28, (2000)pp. 545–564.
Masters, W. A. and Weibe, K. D. Climate and Agricultural Productivity, Working Paper(Center for International Development, Harvard University, Cambridge, MA, 2000).
59Governance and Agricultural Production Efficiency
� 2008 The Authors. Journal compilation � 2008 The Agricultural Economics Society.
Meon, P.-G. and Weill, L. ‘Does better governance foster efficiency? An aggregate frontier
analysis’, Economics of Governance, Vol. 6, (2005) pp. 75–90.Mitchell, T. D., Carter, T. R., Jones, P. D., Hulme, M. and New, M. A Comprehensive Set ofHigh-Resolution Grids of Monthly Climate for Europe and the Globe: the Observed Record
(1901–2000) and 16 Scenarios (2001–2100), Tyndall Centre Working Paper No. 55, 2004.Moe, T. ‘Political institutions: The neglected side of the story’, Journal of Law, Economics,and Organizations, 6, (1990) pp. 213–253.
North, D. Institutions, Institutional Change, and Economic Performance (New York: Cam-bridge University Press, 1990).
Olson, M. The Logic of Collective Action (Cambridge, MA: Harvard University Press, 1965).Olson, M. ‘Big bills left on the sidewalk: Why some nations are rich, and others poor’, Jour-
nal of Economic Perspectives, Vol. 10, (1996) pp. 3–24.Rausser, G. ‘Political economic markets: PERTS and PESTS in food and agriculture’, Ameri-can Journal of Agricultural Economics, Vol. 64, (1982) pp. 821–833.
Ruttan, V. ‘Productivity growth in world agriculture: Sources and constraints’, Journal ofEconomic Perspectives, Vol. 16, (2002) pp. 161–184.
Sachs, J. Tropical Underdevelopment, NBER Working Paper No. 8119 (Cambridge, MA:
NBER, 2001).Sauer, J., Frohberg, F. and Hockmann, H. ‘Stochastic efficiency measurement: The curse oftheoretical consistency’, Journal of Applied Economics, Vol. 9, (2006) 139–166.
Schultz, T. Transforming Traditional Agriculture (New Haven, CT: Yale University Press,
1964).Stigler, J. ‘The division of labour is limited by the extent of the market’, Journal of PoliticalEconomy, Vol. 59, (1951) pp. 185–194.
UNDP. Human Development Indicators (New York: United Nations Development Programme,1999–2004).
Weibe, K. Linking Land Quality, Agricultural Productivity, and Food Security, Agricultural Eco-
nomic Report No. 63 (available at: http://www.ers.usda.gov/Publications/AER823/, 2003).World Bank. World Development Indicators on CD-ROM (Washington, DC: World Bank,2005).
World Bank. World Development Report 2008: Agriculture for Development (Washington DC:
World Bank, 2007).
Appendix
Table A1List of 118 sample countries
Albania Ethiopia Lithuania SingaporeAlgeria Finland Macedonia, FYR SloveniaArgentina France Madagascar South Africa
Armenia Gabon Malawi SpainAustralia Gambia, The Malaysia Sri LankaAustria Georgia Mali Sudan
Azerbaijan Germany Mauritius SwedenBangladesh Ghana Mexico Syrian Arab RepublicBelarus Greece Moldova Taiwan
Bolivia Guatemala Mongolia TajikistanBotswana Guinea Morocco TanzaniaBrazil Guinea-Bissau Mozambique ThailandBulgaria Guyana Nepal Togo
Burkina Faso Haiti Netherlands Trinidad and Tobago
60 Mon-Chi Lio and Jin-Li Hu
� 2008 The Authors. Journal compilation � 2008 The Agricultural Economics Society.
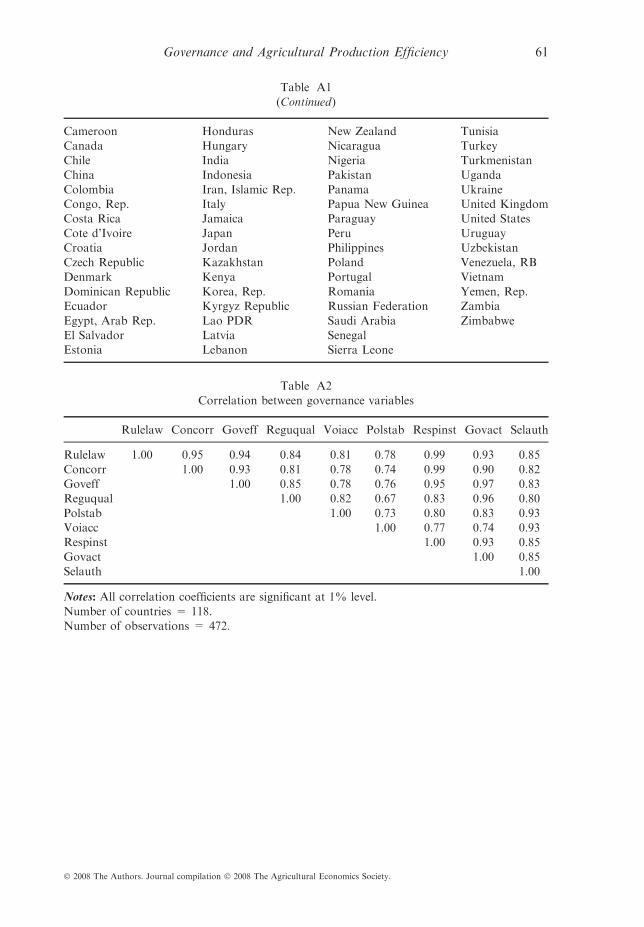
Table A1
(Continued)
Cameroon Honduras New Zealand TunisiaCanada Hungary Nicaragua TurkeyChile India Nigeria Turkmenistan
China Indonesia Pakistan UgandaColombia Iran, Islamic Rep. Panama UkraineCongo, Rep. Italy Papua New Guinea United KingdomCosta Rica Jamaica Paraguay United States
Cote d’Ivoire Japan Peru UruguayCroatia Jordan Philippines UzbekistanCzech Republic Kazakhstan Poland Venezuela, RB
Denmark Kenya Portugal VietnamDominican Republic Korea, Rep. Romania Yemen, Rep.Ecuador Kyrgyz Republic Russian Federation Zambia
Egypt, Arab Rep. Lao PDR Saudi Arabia ZimbabweEl Salvador Latvia SenegalEstonia Lebanon Sierra Leone
Table A2
Correlation between governance variables
Rulelaw Concorr Goveff Reguqual Voiacc Polstab Respinst Govact Selauth
Rulelaw 1.00 0.95 0.94 0.84 0.81 0.78 0.99 0.93 0.85
Concorr 1.00 0.93 0.81 0.78 0.74 0.99 0.90 0.82Goveff 1.00 0.85 0.78 0.76 0.95 0.97 0.83Reguqual 1.00 0.82 0.67 0.83 0.96 0.80
Polstab 1.00 0.73 0.80 0.83 0.93Voiacc 1.00 0.77 0.74 0.93Respinst 1.00 0.93 0.85
Govact 1.00 0.85Selauth 1.00
Notes: All correlation coefficients are significant at 1% level.
Number of countries = 118.Number of observations = 472.
61Governance and Agricultural Production Efficiency
� 2008 The Authors. Journal compilation � 2008 The Agricultural Economics Society.