governance & audited financia statements 2017 · pt xl axiata tbk ‡ (indonesia) pt one...
TRANSCRIPT

Go
ve
rna
nce
& A
ud
ited
Fin
an
cial S
tate
me
nts 2
017
Ind
on
es
ia -
Lin
to B
aro
Governance
Group Corporate Structure 02
Profile of Directors 04
Board Remuneration 08
Directors' Training List 2017 09
Profile of Group Senior Leadership Team 11
Profile of Operating Companies Management Team 16
Significant Milestones 19
Awards 21
Statement on Risk Management and Internal Control 24
Board Audit Committee Report 33
Commitment to Customer Privacy and Data Protection 35
Additional Compliance Information 36
01
Directors’ Responsibility Statement 40
Audited Financial Statements for the financial year ended 31 December 2017 41
Audited Financial Statements 02
Other Information
Shareholding Statistics 166
List of Top Ten Properties 169
Net Book Value of Land & Buildings 170
Glossary 171
03
Contents
Suite of Reports
Axiata’s 2017 Annual Report Suite is made up of the following:
IAR Integrated Annual Report 2017
SNCR
Sustainability & National Contribution Report 2017
GAFS
Governance & Audited Financial Statements 2017
Ma
lay
sia
- K
eb
ay
a S
on
gk
et
Ind
on
es
ia -
Lin
to B
aro
Ne
pa
l -
Gu
ny
o C
ho
loz

Go
ve
rna
nce
& A
ud
ited
Fin
an
cial S
tate
me
nts 2
017
Go
ve
rna
nce
& C
om
plia
nce
Info
rma
tion
1
Sri
La
nk
a -
Sa
ree

Governance & Audited Financial Statements 2017Governance & Compliance Information
2
AXIATA GROUP BERHAD
Celcom Axiata Berhad(Malaysia)
Celcom Resources Berhad (Malaysia)
Celcom Networks Sdn Bhd (Malaysia)
Escape Axiata Sdn Bhd (Malaysia)
Celcom Mobile Sdn Bhd (Malaysia)
Celcom Properties Sdn Bhd (Malaysia)
Xpand Investments (Labuan) Limited(Labuan)
Suvitech Co., Ltd(Thailand)
Celcom eCommerce Sdn Bhd (Malaysia)
Axiata Global Services Pte Ltd(Singapore)
Celcom Retail Holding Sdn Bhd(Malaysia)
Celcom Retail Sdn Bhd(Malaysia)
On Site Services Sdn Bhd(Malaysia)
Celcom Timur (Sabah) Sdn Bhd(Malaysia)
80.00%
Digital Milestone Sdn Bhd #(Malaysia)
51.00%
PLDT Malaysia Sdn Bhd(Malaysia)
49.00%
Tune Talk Sdn Bhd(Malaysia)
35.00%
Merchantrade Asia Sdn Bhd(Malaysia)
20.00%
Sacofa Sdn Bhd(Malaysia)
15.12%
65.00%
Axiata SPV1 (Labuan) Limited (Labuan)
Axiata SPV2Berhad(Malaysia)
Axiata ManagementServices Sdn Bhd(Malaysia)
Axiata Foundation
Axiata SPV4 Sdn Bhd(Malaysia)
Axiata Investments (UK) Limited(United Kingdom)
ReynoldsHoldings Limited(St. Kitts & Nevis)
Ncell Private Limited(Nepal)
Axiata BusinessServices Sdn Bhd(Malaysia) 80.00%
Axiata Investments 1 (India) Limited(Mauritius)
Idea CellularLimited ‡(India)
16.33%
Axiata Digital Innovation Fund Sdn Bhd(Malaysia)
62.19%
Axiata Investments2 (India) Limited(Mauritius)
5.67%
Axiata Investments(Singapore) Limited(Labuan)
M1 Limited ‡(Singapore)
28.69%
Group Corporate Structure*
WSO2.Telco (Private) Limited(Sri Lanka)
*Legend:
Depicting active subsidiaries, associates and affiliates
Key Operating Companies
Wholly-owned Subsidiaries
Non wholly-owned Subsidiaries
Associates/Affiliates
Listed Companies
Company Limited by Guarantee
Members Voluntary Winding-up pursuant to section 254(1)(b) of the Companies Act, 1965/Section 439 of the Companies Act 2016
Note:
The complete list of subsidiaries, associates and joint ventures and their respective principal activities, country of incorporation and the Group’s effective interest are shown in notes 40 to 42 to the financial statements on pages 148 to 154 of this Governance & Audited Financial Statements 2017.
&
*
&
49.00%
10.66%

Governance & Audited Financial Statements 2017Governance & Compliance Information
3
Colombo Trust Finance PLC(Sri Lanka)‡
Headstart (Private) Limited(Sri Lanka) ‡
Digital Health (Private) Limited(Sri Lanka) ‡ Dialog Television
(Private) Limited(Sri Lanka)
PT XL Axiata Tbk ‡(Indonesia)
PT One Indonesia Synergy Tbk(Indonesia)
edotco Malaysia Sdn Bhd(Malaysia)
edotco Holdings (Labuan) Limited(Labuan)
edotco Investments (Labuan) Limited(Labuan)
edotco Bangladesh Co. Ltd(Bangladesh)
Edotco Towers (Bangladesh) Limited (Pakistan)
Edotco Pakistan (Private) Limited (Pakistan)
Tanzanite Tower (Private) Limited(Pakistan)
edotco Services Lanka (Private) Limited(Sri Lanka)
edotco InvestmentsSingapore Pte. Ltd.(Singapore)
Asian Towers Holdings Pte. Limited(Singapore)
edotco Myanmar Limited(Myanmar)
edotco GroupSdn Bhd(Malaysia)
Axiata Investments(Labuan) Limited(Labuan)
Dialog Axiata PLC (Sri Lanka)‡
83.32%
Robi Axiata Limited (Bangladesh)
68.69%
Firstsource-Dialog Solutions (Private) Limited(Sri Lanka)
26.00%
Dialog Axiata Digital Innovation Fund (Private) Limited(Sri Lanka)
25.00%
66.36%
50.00%
87.50%
63.00%
78.15%
Axiata Investments(Cambodia) Limited(Labuan)
Axiata (Cambodia) Holdings LimitedAdknowledge Asia
Pacific Pte Ltd (Singapore)
Adknowledge Asia Philippines Inc.(Philippines)
82.48%
80.00%
80.00%
99.99%
Smart Axiata Co., Ltd(Cambodia)
Edotco(Cambodia) Co., Ltd(Cambodia)
49.00%
99.03%
Digital Commerce Lanka (Private) Limited(Sri Lanka)
Digital Holdings Lanka (Private) Limited(Sri Lanka)
98.87%
50.59%
70.00%
Axiata Investments(Indonesia) Sdn Bhd(Malaysia)
Axiata DigitalServices Sdn Bhd(Malaysia)
AD Video Sdn Bhd(Malaysia)
VM Digital (Thailand) Co., Ltd (Thailand)
Axiata Digital Bangladesh (Private) Limited (Bangladesh)
Axiata Digital Advertising Sdn Bhd(Malaysia)
Komli AsiaHolding Pte Ltd(Singapore)
PT Axiata Digital Analytics Indonesia(Indonesia)
PT Axiata Digital Services Indonesia(Indonesia)
Adknowledge Asia Hong Kong Limited (Hong Kong)
Adknowledge Asia Singapore Pte Ltd(Singapore)
Adknowledge Asia Malaysia Sdn Bhd (Malaysia)
Adknowledge Asia (Thailand) Co Ltd (Thailand)
Komli NetworkPhilippines Inc(Philippines)
PT Adknowledge Asia Indonesia (Indonesia)
WSO2.Telco, Inc(USA)
Merchantrade Digital Services Sdn Bhd (Malaysia)
70.00%
99.00%
99.85%
Axiata Digital eCode Sdn Bhd (Malaysia)
Apigate Sdn Bhd (Malaysia)
Axiata Investments (Mauritius) Limited (Mauritius)
Localcube Commerce Private Limited (India)
Localcube Commerce Asia Sdn Bhd(Malaysia)
Milvik AB (Sweden)
PT Localcube Commerce Indonesia (Indonesia)
Celcom Planet Sdn Bhd (Malaysia)
Unlockd Media Pty Ltd(Australia)
Etobee Holding Pte Ltd(Indonesia)
29.66%
10.63%
99.95%
49.00%
10.05%
20.31%
51.00%
Multinet Pakistan (Private) Limited (Pakistan) 89.00%
80%
20.00%31.00%
Group Corporate Structure
SADIF LP(Labuan)
99.00%
26.66%
Dialog Broadband Networks (Private) Limited(Sri Lanka)
Dialog Business Services (Private) Limited(Sri Lanka)
Dialog Device Trading (Private) Limited
25%
20%
1.00%
0.97%
Governance & Audited Financial Statements 2017Governance & Compliance Information
4
Nationality / Age / Gender: Malaysian / 59 / Male
Date of Appointment:3 March 2008
Length of Service:10 years
Date of Last Re-election:25 May 2016
Membership of Board Committees: • Axiata Digital Business Investment and
Oversight Board Committee
Qualifications:• MBA, Portland State University, USA• Bachelor of Science in Business Administration
(Minor in Mathematics), California State University, USA
Working Experience: Jamaludin is Managing Director/President & Group Chief Executive Officer of Axiata Group Berhad, which he joined in March 2008. He has worked for about 36 years in the ICT industry – 16 years in IT and 20 years in telecommunications.
Jamaludin started his career as a lecturer in Quantitative Methods at California State University, USA in 1980.
He then spent 12 years in IBM (1981-1993), the first five years as Systems Engineer and then in various positions in Sales, Marketing and Management. In 1993, he was appointed Chief Executive Officer of Digital Equipment Malaysia (the Malaysian branch of Digital Equipment, then the second largest IT company worldwide).
Four years later, in 1997, Jamaludin joined Maxis Communications Berhad, and was appointed Chief Executive Officer in 1998. In 2006, he was re-designated Group Chief Executive Officer. He retired from Maxis in 2007. In 2008, he joined Axiata as the Managing Director/President & Group Chief Executive Officer.
Directorships of Public Companies:Axiata GroupListed• PT XL Axiata Tbk. • M1 Limited • Dialog Axiata PLC (Alternate Director)
Non-listed • Celcom Axiata Berhad (Chairman) • Axiata Foundation
OthersListed• Nil
Non-listed• GSMA Mobile For Development Foundation
Other Information:Jamaludin earned the accolade of Malaysia’s ‘CEO of the Year 2000’ by American Express & Business Times and was inducted into the Hall of Fame for ‘Services to the Mobile Telecommunications Industry’ by Asian Mobile News in 2004. He was also named ‘Asian Mobile Operator CEO of the Year’ by Asian Mobile News Awards 2007 and ‘Telecommunications CEO of the Year’ by Telecom Asia Awards 2010 and Frost & Sullivan Asia Pacific ICT Awards 2010. In 2014, he was named CEO of the Year at the MSWG-Asean Corporate Governance Transparency Index Awards. He was also the recipient of the 2015 GSMA Chairman’s Award which is the GSMA’s most prestigious award and recognises outstanding personal contribution to the growth and development of mobile communications around the world.
Nationality / Age / Gender: Malaysian / 72 / Male
Date of Appointment:24 March 2008
Length of Service:10 years
Date of Last Re-appointment:26 May 2017
Membership of Board Committees:• Board Nomination and Remuneration
Committee (Chairman)
Qualifications:• Degree in Economics, La Trobe University,
Australia
Working Experience: Ghazzali has made his career as a diplomat since 1971 and became the Ambassador of Malaysia to USA in March 1999. Prior to his appointment to Washington, D.C., he served as Deputy Secretary-General at the Ministry of Foreign Affairs, Malaysia. Over the years, his overseas appointments have included postings to Austria, Germany, Hong Kong, Thailand, UK, Zimbabwe and the Permanent Mission of Malaysia to the United Nations in New York, USA. His last position before his retirement in September 2010 was as Ambassador-at-large of the Ministry of Foreign Affairs, Malaysia to which he was appointed in 2006.
Directorships of Public Companies:Axiata GroupListed• Nil
Non-listed• Robi Axiata Limited (Chairman) • Axiata Foundation (Chairman)
OthersListed• Nil
Non-listed• Nil
Nationality / Age / Gender: Malaysian / 57 / Male
Date of Appointment:3 March 2008
Length of Service:10 years
Date of Last Re-election:20 May 2015
Membership of Board Committees: • Nil
Qualifications:• British Chevening Scholar• Masters of Philosophy in Development Studies,
Darwin College, Cambridge University, UK• Fellow of the Association of Chartered Certified
Accountants, UK• Chartered Financial Analyst• Diploma in Islamic Studies, International Islamic
University, Malaysia
Working Experience:Formerly, Azman was the Managing Director and co-founder of BinaFikir Sdn Bhd, Director and Head of Country Research at Salomon Smith Barney Malaysia and Director and Head of Research at Union Bank of Switzerland in Malaysia. He previously served in various capacities with Malaysia’s largest utility company, Tenaga Nasional Berhad. From June 2004 to date, Azman holds the position of Managing Director of Khazanah, the strategic investment fund of the Government of Malaysia.
Directorships of Public Companies:Axiata GroupListed• Nil
Non-listed• Nil
OthersListed• Nil
Non-listed• Iskandar Investment Berhad (Chairman) • Yayasan Khazanah • Yayasan Hasanah
Other Information:Azman holds various board membership including Khazanah Research Institute and serves on various public service bodies including the National Science Council, the Capital Market Advisory Group for Securities Commission Malaysia and the National Export Council. Azman is also a member of the Stewardship Board of the shaping the Future of Economic Progress System Initiative at the World Economic Forum and a member of the Asia Business Council. In 2017, he was named Chairman of the year at the MSWG-ASEAN Corporate Governance Recognition Awards.
TAN SRI DATUK WIRA AZMAN HJ. MOKHTARChairman Non-Independent Non-Executive Director (Representative of Khazanah Nasional Berhad ("Khazanah"))
TAN SRI JAMALUDIN IBRAHIMManaging Director/President & Group Chief Executive Officer
TAN SRI GHAZZALI SHEIKH ABDUL KHALIDIndependent Non-Executive Director
Profile of Directors
Governance & Audited Financial Statements 2017Governance & Compliance Information
5
Profile of Directors
Nationality / Age / Gender: Malaysian / 72 / Male
Date of Appointment:24 March 2008
Length of Service:10 years
Date of Last Re-appointment:26 May 2017
Membership of Board Committees:• Board Audit Committee• Board Nomination and Remuneration
Committee • Board Annual Report Committee
Qualifications:• Barrister-at-Law, Middle Temple, London, UK• Degrees in Law and International Law,
University of Cambridge, UK
Working Experience: Azzat is a lawyer by profession and is a partner of the law firm of Azzat & Izzat. Prior to being admitted as advocate and solicitor of the High Court of Malaya in 1979, he served as an administrative and diplomatic officer with the Ministry of Foreign Affairs, Malaysia from 1970 to 1979. Between 1 March 1993 to 21 March 1999, he served as a member of the Securities Commission Malaysia.
Directorships of Public Companies:Axiata GroupListed• Dialog Axiata PLC (Chairman)
Non-listed• Celcom Resources Berhad
OthersListed• Boustead Holdings Berhad• Boustead Heavy Industries Corporation Berhad• KPJ Healthcare Berhad
Non-listed• Malaysian Directors Academy
DATUK AZZAT KAMALUDINSenior Independent Non-Executive Director
Nationality / Age / Gender: Malaysian / 55 / Male
Date of Appointment:24 November 2016
Length of Service:1 year 4 months
Date of Last Re-election:26 May 2017
Membership of Board Committees:• Axiata Digital Business Investment and
Oversight Board Committee (Chairman)
Qualifications:• Bachelor of Commerce Degree (First Class
Honours in Finance), University of New South Wales, Australia
• Fellow of Chartered Public Accountants (CPA) Australia
• Member of the Malaysian Institute of Accountants (MIA)
Working Experience: Izzaddin is currently the Group Managing Director/Chief Executive Officer of UEM Group Berhad, a postion he held since 2009. Izzaddin has over 20 years of experience in the fields of investment banking, financial and general management having served in various senior positions at Malaysian International Merchant Bankers Berhad, Malaysian Resources Corporation Berhad and Southern Bank Berhad. Before his current position, he was the Chief Financial Officer/Senior Vice President (Group Finance) of Tenaga Nasional Berhad, a position he held from September 2004 to June 2009.
Directorships of Public Companies:Axiata GroupListed• Nil
Non-listed• Nil
OthersListed• UEM Sunrise Berhad• UEM Edgenta Berhad
Non-listed• UEM Group Berhad• PLUS Malaysia Berhad• PLUS Expressway International Berhad• Projek Lebuhraya Usahasama Berhad• Cement Industries of Malaysia Berhad• OPUS Group Berhad• UEM Builders Berhad• UEM Suria Berhad• Yayasan UEM• Yayasan Putra Business School
Nationality / Age / Gender: Malaysian / 62 / Female
Date of Appointment:21 March 2017
Length of Service:1 year
Date of Last Re-election:26 May 2017
Membership of Board Committees:• Board Nomination and Remuneration
Committee• Board Risk Management Committee
Qualifications:• Bachelor of Law with Honours, University
Malaya • Masters of Law and PhD in Law, University of
London
Working Experience: Dr Nik Ramlah retired as Deputy Chief Executive of Securities Commission Malaysia (“SC”) in March 2016, having served the organisation for 23 years. She has extensive experience in policy and regulatory reform, capital market regulation, corporate governance and Islamic finance. Prior to joining the SC, Dr Nik Ramlah was an Associate Professor at the Faculty of Law, University of Malaya.
Dr Nik Ramlah is a member of the Board of Directors of Perbadanan Insurans Deposit Malaysia, the Securities Industry Development Corporation and Amanah Saham Nasional Berhad. She is a member of the Financial Services Professional Board and a member of the Professional Development Panel (Senate) of INCEIF, the global university for Islamic finance and an Adjunct Professor at the Faculty of Law, University Teknologi MARA.
Directorships of Public Companies:Axiata GroupListed• Nil
Non-listed• Nil
OthersListed• United Malacca Berhad
Non-listed• Securities Industry Development Corporation• Amanah Saham Nasional Berhad
DATO’ MOHD IZZADDIN IDRISNon-Independent Non-Executive Director
DATO DR NIK RAMLAH NIK MAHMOODIndependent Non-Executive Director
Governance & Audited Financial Statements 2017Governance & Compliance Information
6
Profile of Directors
Nationality / Age / Gender: British / 59 / Male
Date of Appointment:11 December 2017
Length of Service:3 months
Date of Last Re-election:N/A
Membership of Board Committees:• Board Audit Committee• Board Risk Management Committee• Axiata Digital Business Investment and
Oversight Board Committee
Qualifications:• First Class Honours Degree (BA) in Physics,
Oriel College, University of Oxford• D.Phil. in Theoretical Nuclear Physics, Oriel and
Wolfson Colleges, University of Oxford• Master of Arts in Physics, Oriel College,
University of Oxford
Working Experience: Dr Dean is an independent advisor to several start-ups and larger companies. He retired as Senior Partner from The Boston Consulting Group (BCG) at the end of 2013 after 28 years, where he contributed significantly to the firm’s most innovative thinking in areas of Internet economy, cloud computing and personal data. He has executed projects in over 25 countries and served multinational clients in Europe, the US, Africa, India, China, South East Asia and Japan. For several years Dr Dean led BCG's Global Technology & Communications Practice, during which time he helped create a leading position in Asia. He has extensive experience in serving leading telecommunication, Internet and technology companies, in particular on strategic, corporate development and other top management issues.
Dr Dean has also contributed to projects at The World Economic Forum, and participated in multiple World Economic Forum events. He is a member of the Forum’s Global Future Council on the Digital Economy and Society. He is an active writer with “TMT Value Creators Report” and “The Connected World” just two of his notable publications.
Directorships of Public Companies:Axiata GroupListed• PT XL Axiata Tbk.
Non-listed• Nil
OthersListed• Nil
Non-listed• Nil
Nationality / Age / Gender: Malaysian / 65 / Male
Date of Appointment:23 April 2008
Length of Service:10 years
Date of Last Re-election:20 May 2015
Membership of Board Committee:• Board Audit Committee (Chairman)• Board Risk Management Committee (Chairman)• Axiata Digital Business Investment and
Oversight Board Committee• Board Annual Report Committee (Chairman)
Qualifications:• Bachelor of Commerce, Canterbury University,
New Zealand• Member of the Malaysian Institute of
Accountants• Member of the New Zealand Institute of
Chartered Accountants
Working Experience: David has over 35 years professional experience in finance and leading financial organisations in various locations in Australia, Brunei, China, Malaysia, New Zealand, Netherlands and UK. David retired from Shell Malaysia in August 2011 after serving the Shell Group for about 30 years. His major assignments include the Finance Director for Shell Malaysia, Finance Director for Shell China, Global Controller for the Exploration & Production Division of Royal Dutch Shell, and Vice-President Finance for Shell International Exploration and Production B.V., the Netherlands.
Directorships of Public Companies:Axiata Group Listed• Nil
Non-listed• Celcom Axiata Berhad (Chairman of Board
Audit Committee)
Others Listed• KKB Engineering Berhad
Non-listed• Malaysia Airlines Berhad
Other Information:Member of Investment Panel of Employees Provident Fund Board
DAVID LAU NAI PEKIndependent Non-Executive Director
DR DAVID ROBERT DEANIndependent Non-Executive Director
Nationality / Age / Gender: Indonesian / 52 / Male
Date of Appointment:25 February 2015
Length of Service:3 years
Date of Last Re-election:26 May 2017
Membership of Board Committees:• Nil
Qualifications:• PhD in Economics and Master of Economic
Development, Australian National University, Australia
• Bachelor of Economics, University of Indonesia, Indonesia
Working Experience: Dr Muhamad Chatib, was the Indonesia’s former Minister of Finance from May 2013 to October 2014. Previously, he was the Chairman of Investment Coordinating Board of Indonesia from June 2012 to October 2013. Prior to that, from 2010 to 2012, he served as the Vice Chairman of the National Economic Committee of the President of Indonesia. He is currently the Chairman of Indonesia Infrastructure Finance, a private national company providing infrastructure financing and advisory services, and also Chairman of the Advisory Board of Mandiri Institute. Dr Muhamad Chatib was a member of the Asia Pacific Regional Advisory Group of the International Monetary Fund (IMF). From 2010 to 2012, he was a member of the High Level Trade Experts Group, co-chaired by Jagdish Bhagwati and Peter Sutherland. In 2010, he co-founded CReco Research Institute, a Jakarta based economic consulting firm. Dr Muhamad Chatib has from 1995 until present lectures at the Department of Economics, University Indonesia.
He has acted as a consultant for the World Bank, the Asian Development Bank (ADB), the USAID, AUSAID, OECD and UNCTAD. He is the author of a number of papers in international academic journals and actively writes for various leading newspapers and magazines in Indonesia.
Directorships of Public Companies:Axiata GroupListed• PT XL Axiata Tbk.
Non-listed• Nil
OthersListed• PT Astra International Tbk.• PT Indika Energy Tbk.
Non-listed• Nil
DR MUHAMAD CHATIB BASRIIndependent Non-Executive Director

Governance & Audited Financial Statements 2017Governance & Compliance Information
7
Profile of Directors
Nationality / Age / Gender: Malaysian / 48 / Male
Date of Appointment:12 January 2018
Length of Service:3 months
Date of Last Re-election:N/A
Membership of Board Committees:• Axiata Digital Business Investment and
Oversight Board Committee
Qualifications:• First Class Degree in Economics, University of
Cambridge• Member of the Malaysian Institute of
Accountants (MIA)• Member of Institute of Chartered Accountants
in England and Wales• Associate of the Association of Corporate
Treasurers, United Kingdom
Working Experience: Tengku Azmil joined Khazanah as an Executive Director of Investments in October 2011. His main role is overseeing new investments and divestments in sectors within his portfolio.
Prior to joining Khazanah, he was the Managing Director/Chief Executive Officer of Malaysia Airlines Berhad. He joined Malaysia Airlines Berhad as Executive Director/Chief Financial Officer in August 2005 after having served as a Non-Executive Board Director since August 2004. Before that, he was the Chief Financial Officer and then Managing Director/Chief Executive Officer of Penerbangan Malaysia Berhad. He was also with PricewaterhouseCoopers in their London and Hong Kong offices where he was in the Audit and Business Advisory Services division, specialising in financial services.
Directorships of Public Companies:Axiata GroupListed• Nil
Non-listed• Nil
OthersListed• Nil
Non-listed• Malaysian Global Innovation & Creativity Centre
Berhad
TENGKU DATO’ SRI AZMIL ZAHRUDDIN RAJA ABDUL AZIZNon-Independent Non-Executive Director(Representative of Khazanah)
Notes:None of the Directors have:• Any family relationship with any Director and/or major shareholder of Axiata.• Any conflict of interest with Axiata.• Any conviction for offences within the past five years and particulars of any public
sanctions or penalties imposed on them by any regulatory bodies during the financial year ended 31 December 2017 (other than traffic offences).
• Information on Directors' attendance at Board meetings held during the financial year is disclosed on page 76 of the Integrated Annual Report 2017.

Governance & Audited Financial Statements 2017Governance & Compliance Information
8
Breakdown of the aggregated remuneration of NEDs of Axiata into appropriate components including remuneration for services rendered by them to Axiata Group FY17 is set out below:-
Axiata Subsidiaries Total
Name of DirectorFees
(RM’000)
Meeting Allowancesa
(RM’000)
Monetary Value of Benefits-in-
Kind(RM’000)
Fees(RM’000)
Meeting Allowances
(RM’000) (RM’000)
Tan Sri Datuk Wira Azman Hj. Mokhtara 360 42 101 0 0 503
Tan Sri Ghazzali Sheikh Abdul Khalidb 269 45 40 258 14 626
Datuk Azzat Kamaludinc 283 52 53 146 46 580
Dato’ Mohd Izzaddin Idrisd, i 240 28 60 0 5 333
David Lau Nai Peke 289 64 76 206 42 677
Bella Ann Almeidaj 104 14 120 0 0 238
Dato Dr Nik Ramlah Nik Mahmoodg, k 187 20 34 26 1 268
Dr David Robert Deanf, l 14 2 4 270 23 313
Dr Muhamad Chatib Basrif 240 24 44 387 21 716
Kenneth Shena, h 283 51 75 175 12 596
Total (RM’000) 2,269 342 607 1,468 164 4,850
Board Remuneration
Executive DirectorBreakdown of the aggregated remuneration of Tan Sri Jamaludin Ibrahim for FY17 into appropriate components is set out below:-
(RM’000)
a. Salaries, Allowances and Bonus 3,573
b. Benefits (Contribution to EPF, ESOS and RSA Expenses and Monetary Value of Benefits-in-Kind) 2,897
a Fees and Meeting Allowances paid directly to Khazanahb Fees and Meeting Allowances from subsidiaries – Robi and Ncellc Fees and Meeting Allowances from subsidiaries – Celcom, Dialog and edotcod 50% of Fees and Meeting Allowances paid directly to UEM Groupe Fees and Meeting Allowances from subsidiaries – Celcom, Smart and edotcof Fees and Meeting Allowances from subsidiary – XLg Fees and Meeting Allowances from subsidiary – edotcoh Fees and Meeting Allowances from subsidiary – XL and edotcoi Meeting Allowances from subsidiary – Axiata Digitalj Resigned on 25 May 2017k Appointed on 21 March 2017l. Appointed on 11 December 2017

Governance & Audited Financial Statements 2017Governance & Compliance Information
9
Directors’ Training List 2017
Director List of Training/Conference/Seminar/Workshop Attended/Participated in 2017
Tan Sri Datuk Wira Azman Hj. Mokhtar
• World Economic Forum, Davos, Switzerland – 20 to 23 January 2017• Global Transformation Forum by Pemandu, Kuala Lumpur – 22 to 23 March 2017• CEO @Faculty Programme- 4th Managing the Future Conference B8 - The Making of a Sovereign Development Fund, UKM, Bangi
– 21 April 2017• Keynote address by Tan Sri Managing Director ("TMD"), SII Global West Government Funds Rountable – Portrait of a Sovereign
Wealth Fund as a Sovereign Venture Fund, London – 5 May 2017• Guest Speaker at the MIA 50th Anniversary Commemorative Lecture, Kuala Lumpur – 22 May 2017• CEO @Faculty Series “Khazanah as Macro Manager, GLC as Micro Manager", UNITEN – 2 June 2017• Panelist at ICGN - Plenary 1: "Redifining Capitalism for a Sustainable Global Economy" by MSWG & Kumpulan Wang Persaraan
(Diperbankan), Shangri-la Hotel Kuala Lumpur – 11 July 2017• Axiata Mid-Year Strategy Retreat "Outside-in view of Axiata Group in a Digital World – the good, bad and ugly” by Guest Speaker,
E&O Hotel, Penang – 4 August 2017• Axiata Mid-Year Strategy Retreat "Business Unusual – The World in Disruption” by Guest Speaker, E&O Hotel, Penang –
4 August 2017• CEO@Faculty Series, Multimedia University, Malacca – 14 August 2017• Cambridge Society for Social and Economic Development Inaugural 2017/2018 Lecture – 19 October 2017• Innovation & Entrepreneurship with TMD, Indah Water Konsortium – 30 October 2017• Investment Corporation of Dubai (ICD) Global Investment Forum – 16 November 2017• ASEAN Dinner Talk – An Investment Practitioners Perspective, Sunway Resort Hotel & Spa – 7 December 2017
Tan Sri Jamaludin Ibrahim
• Cyber Security Forum by Axiata Internal Audit Division – 2 May 2017• Axiata Mid-Year Strategy Retreat "Outside-in view of Axiata Group in a Digital World – the good, bad and ugly” by Guest Speaker,
E&O Hotel, Penang – 4 August 2017• Axiata Mid-Year Strategy Retreat "Business Unusual – The World in Disruption” by Guest Speaker, E&O Hotel, Penang –
4 August 2017• Khazanah Megatrends Forum by Khazanah Nasional Berhad ("Khazanah") – 2 to 3 October 2017• Axiata Year-end Retreat “Data for The People” by Guest Speaker – 12 December 2017
Tan Sri Ghazzali Sheikh Abdul Khalid
• Bank Negara Malaysia ("BNM") Governor's Address on The Malaysian Economy & Panel Discussion by Securities Commission – 24 March 2017
• International Corporate Governance Network (“ICGN”) Annual Conference 2017 by MSWG & KWAP, Shangri-la Hotel Kuala Lumpur – 11 to 13 July 2017
• Axiata Mid-Year Strategy Retreat "Outside-in view of Axiata Group in a Digital World – the good, bad and ugly” by Guest Speaker, E&O Hotel, Penang – 4 August 2017
• Axiata Mid-Year Strategy Retreat "Business Unusual – The World in Disruption” by Guest Speaker, E&O Hotel, Penang – 4 August 2017
• International Directors Summit 2017 (IDS 2017) by MINDA, Kuala Lumpur – 21 to 22 August 2017• Axiata Year-end Retreat “Data for The People” by Guest Speaker – 12 December 2017
Datuk Azzat Kamaludin • Sustainability Forum For Directors/CEOs-The Velocity of Global Change & Sustainability - The New Business Model by ACCA, Sime Darby Convention Centre, Kuala Lumpur – 10 January 2017
• Axiata Mid-Year Strategy Retreat "Outside-in view of Axiata Group in a Digital World – the good, bad and ugly” by Guest Speaker, E&O Hotel, Penang – 4 August 2017
• Axiata Mid-Year Strategy Retreat "Business Unusual – The World in Disruption” by Guest Speaker, E&O Hotel, Penang – 4 August 2017
Dato’ Mohd Izzaddin Idris
• Project Enterprise: Culture Change Offsite by UEM Group Berhad, Avillion Hotel Port Dickson – 15 to 17 January 2017• UEM Edgenta Board Strategy Retreat, The Saujana Hotel Kuala Lumpur – 13 to 14 February 2017• UEM Leadership Team Forum: Driving our Business, UEM Learning Centre (ULC), Petaling Jaya – 16 February 2017• CIMB Leadership Series (Speaker) by CIMB, Putrajaya Marriot Hotel – 18 February 2017• Group Induction Programme (Speaker) by UEM Group Berhad, UEM Learning Centre (ULC), Petaling Jaya – 22 February 2017• CEO@Faculty Programme for UKM (Speaker) – 23 February 2017• Skrine Clients Seminar (Speaker) by SKRINE, Intercontinental Hotel Kuala Lumpur – 2 March 2017• SSM: Highlights of the Companies Act 2016, UEM Learning Centre (ULC), Petaling Jaya – 8 March 2017• HR Strategy Retreat by UEM Group Berhad, Thistle Hotel Port Dickson – 10 to 11 March 2017• CIMA Board Retreat by Cement Industries of Malaysia Berhad (CIMA), The Saujana Hotel Kuala Lumpur – 27 March 2017• MARA: Emerging Leader Development Programme (ELDP) (Speaker), Kinrara Resort Puchong – 6 April 2017• UEM Group Lectures Series by Mr Peter Bellew, Group CEO Malaysia Airlines, Mercu UEM Kuala Lumpur – 12 April 2017• Iskandar Malaysia CEO Forum by Khazanah – 13 April 2017• Securities Commission Malaysia: World Bank Conference – Islamic Finance & Public Private Partnership for Instructure
Development (Speaker) – 8 May 2017• Business Leadership Forum UEM Group, UEM Learning Centre (ULC), Petaling Jaya – 7 July 2017• UEM Group Lecture Series by Datuk Shahril Ridza Ridzuan, CEO of Employees Provident Fund (EPF) – 11 July 2017• Axiata Mid-Year Strategy Retreat "Outside-in view of Axiata Group in a Digital World – the good, bad and ugly” by
Guest Speaker, E&O Hotel, Penang – 4 August 2017• Axiata Mid-Year Strategy Retreat "Business Unusual – The World in Disruption” by Guest Speaker, E&O Hotel, Penang –
4 August 2017• UEM Edgenta: Board Retreat 2017, The Danna Langkawi – 25 to 26 September 2017• Khazanah Megatrends Forum by Khazanah Nasional Berhad – 2 to 3 October 2017• Trending Innovation, Disruption and Entrepreneurship (“TIDE”) Event – 4 October 2017• 10th Iskandar Malaysia CEO Forum by Khazanah – 9 October 2017
Governance & Audited Financial Statements 2017Governance & Compliance Information
10
Directors’ Training List 2017
Director List of Training/Conference/Seminar/Workshop Attended/Participated in 2017
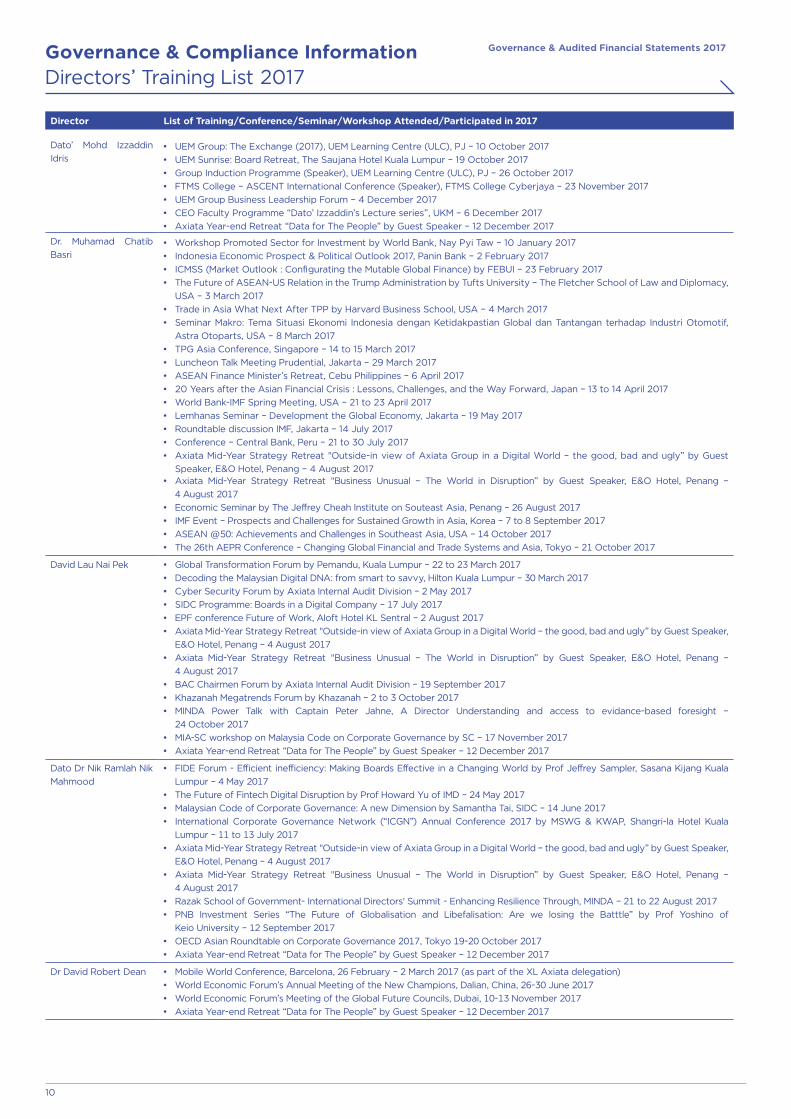
Dato’ Mohd Izzaddin Idris
• UEM Group: The Exchange (2017), UEM Learning Centre (ULC), PJ – 10 October 2017• UEM Sunrise: Board Retreat, The Saujana Hotel Kuala Lumpur – 19 October 2017• Group Induction Programme (Speaker), UEM Learning Centre (ULC), PJ – 26 October 2017• FTMS College – ASCENT International Conference (Speaker), FTMS College Cyberjaya – 23 November 2017• UEM Group Business Leadership Forum – 4 December 2017• CEO Faculty Programme “Dato’ Izzaddin’s Lecture series”, UKM – 6 December 2017• Axiata Year-end Retreat “Data for The People” by Guest Speaker – 12 December 2017
Dr. Muhamad Chatib Basri
• Workshop Promoted Sector for Investment by World Bank, Nay Pyi Taw – 10 January 2017• Indonesia Economic Prospect & Political Outlook 2017, Panin Bank – 2 February 2017• ICMSS (Market Outlook : Configurating the Mutable Global Finance) by FEBUI – 23 February 2017• The Future of ASEAN-US Relation in the Trump Administration by Tufts University – The Fletcher School of Law and Diplomacy,
USA – 3 March 2017• Trade in Asia What Next After TPP by Harvard Business School, USA – 4 March 2017• Seminar Makro: Tema Situasi Ekonomi Indonesia dengan Ketidakpastian Global dan Tantangan terhadap Industri Otomotif,
Astra Otoparts, USA – 8 March 2017• TPG Asia Conference, Singapore – 14 to 15 March 2017• Luncheon Talk Meeting Prudential, Jakarta – 29 March 2017• ASEAN Finance Minister’s Retreat, Cebu Philippines – 6 April 2017• 20 Years after the Asian Financial Crisis : Lessons, Challenges, and the Way Forward, Japan – 13 to 14 April 2017• World Bank-IMF Spring Meeting, USA – 21 to 23 April 2017• Lemhanas Seminar – Development the Global Economy, Jakarta – 19 May 2017• Roundtable discussion IMF, Jakarta – 14 July 2017• Conference – Central Bank, Peru – 21 to 30 July 2017• Axiata Mid-Year Strategy Retreat "Outside-in view of Axiata Group in a Digital World – the good, bad and ugly” by Guest
Speaker, E&O Hotel, Penang – 4 August 2017• Axiata Mid-Year Strategy Retreat "Business Unusual – The World in Disruption” by Guest Speaker, E&O Hotel, Penang –
4 August 2017• Economic Seminar by The Jeffrey Cheah Institute on Souteast Asia, Penang – 26 August 2017• IMF Event – Prospects and Challenges for Sustained Growth in Asia, Korea – 7 to 8 September 2017• ASEAN @50: Achievements and Challenges in Southeast Asia, USA – 14 October 2017• The 26th AEPR Conference – Changing Global Financial and Trade Systems and Asia, Tokyo – 21 October 2017
David Lau Nai Pek • Global Transformation Forum by Pemandu, Kuala Lumpur – 22 to 23 March 2017• Decoding the Malaysian Digital DNA: from smart to savvy, Hilton Kuala Lumpur – 30 March 2017• Cyber Security Forum by Axiata Internal Audit Division – 2 May 2017• SIDC Programme: Boards in a Digital Company – 17 July 2017• EPF conference Future of Work, Aloft Hotel KL Sentral – 2 August 2017• Axiata Mid-Year Strategy Retreat "Outside-in view of Axiata Group in a Digital World – the good, bad and ugly” by Guest Speaker,
E&O Hotel, Penang – 4 August 2017• Axiata Mid-Year Strategy Retreat "Business Unusual – The World in Disruption” by Guest Speaker, E&O Hotel, Penang –
4 August 2017• BAC Chairmen Forum by Axiata Internal Audit Division – 19 September 2017• Khazanah Megatrends Forum by Khazanah – 2 to 3 October 2017• MINDA Power Talk with Captain Peter Jahne, A Director Understanding and access to evidance-based foresight –
24 October 2017• MIA-SC workshop on Malaysia Code on Corporate Governance by SC – 17 November 2017• Axiata Year-end Retreat “Data for The People” by Guest Speaker – 12 December 2017
Dato Dr Nik Ramlah Nik Mahmood
• FIDE Forum - Efficient inefficiency: Making Boards Effective in a Changing World by Prof Jeffrey Sampler, Sasana Kijang Kuala Lumpur – 4 May 2017
• The Future of Fintech Digital Disruption by Prof Howard Yu of IMD – 24 May 2017• Malaysian Code of Corporate Governance: A new Dimension by Samantha Tai, SIDC – 14 June 2017• International Corporate Governance Network (“ICGN”) Annual Conference 2017 by MSWG & KWAP, Shangri-la Hotel Kuala
Lumpur – 11 to 13 July 2017• Axiata Mid-Year Strategy Retreat "Outside-in view of Axiata Group in a Digital World – the good, bad and ugly” by Guest Speaker,
E&O Hotel, Penang – 4 August 2017• Axiata Mid-Year Strategy Retreat "Business Unusual – The World in Disruption” by Guest Speaker, E&O Hotel, Penang –
4 August 2017• Razak School of Government- International Directors' Summit - Enhancing Resilience Through, MINDA – 21 to 22 August 2017• PNB Investment Series “The Future of Globalisation and Libefalisation: Are we losing the Batttle” by Prof Yoshino of
Keio University – 12 September 2017• OECD Asian Roundtable on Corporate Governance 2017, Tokyo 19-20 October 2017• Axiata Year-end Retreat “Data for The People” by Guest Speaker – 12 December 2017
Dr David Robert Dean • Mobile World Conference, Barcelona, 26 February – 2 March 2017 (as part of the XL Axiata delegation)• World Economic Forum’s Annual Meeting of the New Champions, Dalian, China, 26-30 June 2017• World Economic Forum’s Meeting of the Global Future Councils, Dubai, 10-13 November 2017• Axiata Year-end Retreat “Data for The People” by Guest Speaker – 12 December 2017

Governance & Audited Financial Statements 2017Governance & Compliance Information
11
Profile of Group Senior Leadership Team
Please refer to page 4 Nationality / Age / Gender: Sri Lankan / 49 / Male
Date of Appointment to Executive Position: 1 January 2017
Length of Service at Axiata:24 years
Department/Portfolio:South Asia Region
Academic/Professional Qualification(s): • Degree in Electrical and Electronic Engineering,
University of Cambridge• MBA, University of Warwick, UK • PhD in Digital Mobile Communications,
University of Bristol• Chartered Engineer and Fellow of the Institute
of Engineering Technology UK
Working Experience: In line with Axiata’s regional expansion in the South Asia region, Hans was appointed as Corporate Executive Vice President & Regional Chief Executve Officer, South Asia Operations in January 2016. Up to the end of 2016, Hans also functioned as the Group CEO of Dialog Axiata PLC ("Dialog"), Sri Lanka. He joined Dialog’s founding management team in 1994, and took on the role of CEO in 1997. From 2012 till 2014, Hans was also the founding CEO of Axiata Digital Services Sdn Bhd.
Directorships of Public Companies:Axiata GroupListed• Dialog Axiata PLC
Non-listed• Robi Axiata Limited
OthersListed• John Keells Holdings PLC
Non-listed• Nil
Nationality / Age / Gender: Indian / 53 / Male
Date of Appointment to Executive Position: 3 April 2017
Length of Service at Axiata:1 year
Department/Portfolio:• Strategic Finance, Financial Planning & Analysis• Investor Relation • Treasury & Corporate Finance • Tax• Accounts Operation • Financial System
Academic/Professional Qualification(s): • Bachelor in Commerce and Qualified Chartered
Accountant India• Accountancy and Audit Training in
PricewaterhouseCoopers PLT
Working Experience: Vivek was most recently the Executive Vice President and Group Chief Marketing Officer of Telenor Group Inc. Prior to this he has held positions as CFO and subsequently CEO of Telenor India, CEO of Grameenphone (Bangladesh) and COO and CFO of Tata AIA Life Insurance.
Directorships of Public Companies:Axiata GroupListed• PT XL Axiata Tbk.
Non-listed• Robi Axiata Limited
OthersListed• Nil
Non-listed• Nil
TAN SRI JAMALUDIN IBRAHIMManaging Director/President & Group Chief Executive Officer
DR HANS WIJAYASURIYACorporate Executive Vice President & Regional Chief Executive Officer, South Asia Operations
VIVEK SOOD Group Chief Financial Officer
Notes:None of the Directors have:• Any family relationship with any Director and/or major shareholder of Axiata.• Any conflict of interest with Axiata.• Any conviction for offences within the past five years and particulars of any public
sanctions or penalties imposed on them by any regulatory bodies during the financial year ended 31 December 2017 (other than traffic offences).
Governance & Audited Financial Statements 2017Governance & Compliance Information
12
Profile of Group Senior Leadership Team
Nationality / Age / Gender: Malaysian / 58 / Female
Date of Appointment to Executive Position: 18 May 2011
Length of Service at Axiata:10 years
Department/Portfolio:• Organisational Development • Talent Management• Learning & Development • Corporate Responsibility Academic/Professional Qualification(s): • Bachelor of Science (Honours) in Biochemistry
and Pharmacology, University of Aston, Birmingham, UK
Working Experience: Badrunnisa has had over 30 years of working experience. Her career has predominantly been with Shell in Malaysia with the first half focusing on IT software application and the second half in Human Resources, where her last stint was in a global position reporting to Shell Group HR. Before Axiata, she was with Telekom Malaysia Berhad where she was General Manager, Leadership & Talent Management, Group HR. She was also the Head of Group Human Resources in Axiata before the function was split to allow her to focus on Talent Management across the Group.
Directorships of Public Companies:Axiata GroupListed• Nil
Non-listed• Nil
OthersListed• Nil
Non-listed• Nil
DATIN SRI BADRUNNISA MOHD YASIN KHANGroup Chief Talent Officer
Nationality / Age / Gender: Malaysian / 50 / Male
Date of Appointment to Executive Position: 1 March 2013
Length of Service at Axiata:5 years
Department/Portfolio:• Group Programme Office• GCEO Office Support• Government Relations• Corporate Communications & Sustainability • Regulatory Affairs Academic/Professional Qualification(s): • Bachelor of Science in Mechanical Engineering,
University of Rochester New York, USA• Masters in Communication Management
(MBA in Telecommunications), University of Strathclyde, Glasgow, Scotland
Working Experience: Idham has over 20 years experience in telecommunications and IT industry in the region. Prior to his role in Axiata, Idham served as Chief Operating Officer of Packet One Networks in Malaysia, Head of Strategy and Corporate Affairs for Axis Communications in Indonesia and in various senior management positions for Maxis in Malaysia. He started his career as an engineer for Carl Zeiss in Princeton, New Jersey, USA, before venturing into ICT with IBM.
Directorships of Public Companies:Axiata GroupListed• Nil
Non-listed• Celcom Axiata Berhad
OthersListed• Nil
Non-listed• Nil
MOHAMAD IDHAM NAWAWIGroup Chief Corporate Officer
Nationality / Age / Gender: Malaysian / 47 / Female
Date of Appointment to Executive Position: 1 May 2015
Length of Service at Axiata:5 years
Department/Portfolio:• Internal Audit• Compliance and Investigation
Academic/Professional Qualification(s): • BSc (Hons) Accountancy, University of East
Anglia UK• Fellow member of the Association of
Chartered Certified Accountants (ACCA) UK
Working Experience: Prior to Axiata, she held the position of Corporate Controller at Celcom Axiata Berhad ("Celcom")where she had been the project sponsor for GST and Business Continuity Plan implementations. Before joining Celcom, Nik Nazifah was with Shell Malaysia for over 15 years, including a three year assignment at Shell Headquarters in The Hague, Netherlands. Her earlier years were spent in external audit where she gained exposure to a variety of industries, ranging from Financial Institutions to Government linked companies.
Directorships of Public Companies:Axiata GroupListed• Nil
Non-listed• Nil
OthersListed• Nil
Non-listed• Nil
NIK NAZIFAH NIK AHMADGroup Chief Internal Auditor

Governance & Audited Financial Statements 2017Governance & Compliance Information
13
Profile of Group Senior Leadership Team
Nationality / Age / Gender: Singaporean / 62 / Male
Date of Appointment to Executive Position: 1 June 2011
Length of Service at Axiata:6 years
Department/Portfolio:• Human Resources • Organisational Development • Facility Management Academic/Professional Qualification(s): • Bachelor’s Degree in Civil Engineering from the
National University of Singapore
Working Experience: Darke has had over 30 years experience both in Malaysia and in the South Asia region, having held several senior positions in multinational companies and large local companies. These include Managing Director of South East Asia and India of Apple Inc, Managing Director (Singapore) of Digital Equipment Corporation (now part of Hewlett-Packard) and Managing Director of Enterprise Business of Maxis Communications at Malaysia. Prior to joining Axiata in 2011, he was a director of a leadership development and management consulting company.
Directorships of Public Companies:Axiata GroupListed• Nil
Non-listed• Nil
OthersListed• Nil
Non-listed• Nil
DARKE M SANIGroup Chief Human Resources Officer
Nationality / Age / Gender: Australian / 41 / Male
Date of Appointment to Executive Position: 1 March 2016
Length of Service at Axiata: 2 years
Department/Portfolio:• Group Corporate Strategy• Marketing & Brand Development • Strategic Projects • Product Innovation & Partnerships
Academic/Professional Qualification(s): • Bachelor of Engineering in Telecommunications
(Honours) and a Graduate Diploma in engineering Management (Dip. Eng. Prac., Honours), University of Technology Sydney, Australia
• Member, Australian Institute of Company Directors (MAICD)
Working Experience: Dominic has over 23 years experience in the telecoms, media and technology sectors having held executive roles with global telecom operators including Vodafone, Orange and British Telecom as well as for leading strategic advisory firms. Prior to joining Axiata, Dominic was the Group Managing Director of AEC Advisory, a regional strategic and corporate advisory firm headquartered in Singapore. Preceding this, he has held several senior corporate advisory roles as a global equity Partner of Value Partners Management Consulting, as Regional Director APAC for BT Global Services consulting group, as a Director of KPMG Australia and a Director with KPMG Consulting in SE Asia in charge of Telecom & Media advisory.
Directorships of Public Companies:Axiata GroupListed• Dialog Axiata PLC
Non-listed• Nil
OthersListed• Nil
Non-listed• Nil
DOMINIC P ARENAGroup Chief Strategy & Marketing Officer
Nationality / Age / Gender: Malaysian / 52 / Female
Date of Appointment to Executive Position: 1 April 2008
Length of Service at Axiata:15 years
Department/Portfolio:• Company Secretarial
Academic/Professional Qualification(s): • LLB (Hons) Bachelor of Laws, International
Islamic University, Malaysia• Advocate and Solicitor of the High Court of
Malaya and Licensed Company Secretary
Working Experience: Suryani, a qualified Advocate and Solicitor of the High Court of Malaya and licenced Company Secretary, spent the early years of her career in legal practice. She subsequently joined the corporate sector doing both legal and company secretarial work and was appointed Head of Legal and Secretarial, Celcom in 2002. Suryani joined Axiata upon its listing in 2008 and until June 2011 retained her leadership role as Head of Legal in Celcom.
Directorships of Public Companies:Axiata GroupListed• Nil
Non-listed• Nil
OthersListed• Nil
Non-listed• Nil
SURYANI HUSSEINGroup Company Secretary

Governance & Audited Financial Statements 2017Governance & Compliance Information
14
Profile of Group Senior Leadership Team
Nationality / Age / Gender: Indian / 47 / Male
Date of Appointment to Executive Position: 2 November 2012
Length of Service at Axiata:5 years
Department/Portfolio:• IT Strategy & Architecture • Axiata Procurement Centre • Radio Access Network
Academic/Professional Qualification(s): • Bachelor Degree in Electronics & Electrical
Communications from India
Working Experience: Amandeep has over 25 years of experience in the telecommunications sector encompassing mobile, fixed and long distance networks. During his professional career, he has held various portfolios to lead the technology function spanning across multiple countries in Asia and Africa. He brings hands on experience in strategising and managing state-of-the-art telecommunication networks including 2G/3G/4G LTE/IT and Systems. He has handled complex, multi-country and large scale technology transformations in the past. Amandeep also brings a rich wealth of experience in the towerco business. Prior to Axiata, his last assignment was with Bharti Airtel for more than nine years, working out of the company's offices in India and Africa.
Directorships of Public Companies:Axiata GroupListed• Nil
Non-listed• Nil
OthersListed• Nil
Non-listed• Nil
AMANDEEP SINGHGroup Chief Technology Officer
Nationality / Age / Gender: Malaysian / 46 / Male
Date of Appointment to Executive Position: 1 July 2011
Length of Service at Axiata:6 years
Department/Portfolio:• Corporate Development Academic/Professional Qualification(s): • Bachelor Degree in Business Administration
(Hons), majoring in Finance, Investment and Banking, University of Wisconsin-Madison, USA
Working Experience: Annis has close to 17 years’ experience in the banking industry with extensive knowledge and experience in the areas of financial advisory, structured finance, acquisition finance and project finance. He started his career at Citibank Berhad and later joined Macquarie Malaysia and RHB Sakura Merchant Bankers Bhd. His last position before joining Axiata was Chief Officer & Head of Investment Banking in Kuwait Finance House (Malaysia) Berhad (KFHMB).
Directorships of Public Companies:Axiata GroupListed• Nil
Non-listed• Nil
OthersListed• Nil
Non-listed• Nil
ANNIS SHEIKH MOHAMEDGroup Chief Corporate Development Officer
Nationality / Age / Gender: Malaysian / 45 / Male
Date of Appointment to Executive Position: 1 October 2004
Length of Service at Axiata:14 years
Department/Portfolio:• Corporate Counsel • Risk Management • Enterprise Risk Management
Academic/Professional Qualification(s): • Bachelor of Commerce and Bachelor of Law,
University of Adelaide, Australia • Advocate and Solicitor of the High Court of
Malaya and as a solicitor in New South Wales, Australia
• Masters of Law, University of New South Wales, Australia
Working Experience: Gim joined TM International Berhad (now Axiata) in 2004. Prior to joining Axiata, he was working as a lawyer in Malaysia and Australia. His areas of practice were predominantly in the fields of mergers and acquisitions, equity capital markets and corporate finance. Gim’s last post before joining Axiata, was with Malaysia’s largest law firm, Zaid Ibrahim & Co..
Directorships of Public Companies:Axiata GroupListed• Nil
Non-listed• Nil
OthersListed• Nil
Non-listed• Nil
TAN GIM BOONGroup General Counsel and Risk Officer
Governance & Audited Financial Statements 2017Governance & Compliance Information
15
Profile of Group Senior Leadership Team
Nationality / Age / Gender: Malaysian / 61 / Male
Date of Appointment to Executive Position: 1 November 2016
Length of Service at Axiata:10 years
Department/Portfolio:• External statutory reporting for Bursa Malaysia
and Registrar of Companies• Internal management reporting• Corporate policy and governance• Financial system support• Taxation
Academic/Professional Qualification(s): • Chartered Accountant of Malaysian Institute of
Accountants• Fellow Member of The Association of
Chartered Certified Accountants, United Kingdom
• Graduate of The Institute of Chartered Secretaries and Administrators, United Kingdom
Working Experience: Yap has over 36 years of working experience, of which more than 24 years were in the IT industry and 10 years in telecommunications. His previous roles within Axiata Group includes Chief Financial Officer of Robi Axiata Limited from 2014 to 2016, Chief Financial Officer of Dialog in 2010, Acting Chief Financial Officer of Axiata from November 2010 to May 2011 and from January 2017 to April 2017. He was Group Financial Controller of Axiata, a position he held since October 2008. While in IT industry, he was the Controller of IBM Asia Pacific Accounting Center which provide accounting shared services covering the countries within Asia Pacific region of ASEAN, South Asia, Greter China, Japan, Korea and Australia/New Zealand. He was the recipient of several awards from accounting professional bodies and an IBM patent of an IT application.
Directorships of Public Companies:Axiata GroupListed• Nil
Non-listed• Nil
OthersListed• Nil
Non-listed• Nil
YAP WAI YIPGroup Financial Controller
Nationality / Age / Gender: Sri Lankan / 50 / Male
Date of Appointment to Executive Position: 1 August 2017
Length of Service at Axiata:7 years
Department/Portfolio:• Information Technology
Academic/Professional Qualification(s): • B.Eng from Kings College London• MBA from Regis University Denver, CO. USA
Working Experience: Anthony has been with Axiata Group of companies since 2010 as the Group Chief Information Officer (CIO) and Chief Digital Services Officer of Dialog Axiata. Since his appointment as Group CIO, he still continues his role as CIO of Dialog. Prior to joining Dialog, Anthony was the Head of the North America Systems Integration Business for Nokia Siemens Networks. He holds several European and United States Patents in the area of Charging and Speech Recognition technology.
Directorships of Public Companies:Axiata GroupListed• Nil
Non-listed• Nil
OthersListed• Nil
Non-listed• Nil
ANTHONY RODRIGO Group Chief Information Officer
Notes:Years of Service at Axiata refers to tenure within Axiata and its group of companies.

Governance & Audited Financial Statements 2017Governance & Compliance Information
16
Nationality / Age / Gender:Sri Lankan / 53 / Male Date of Appointment to Executive Position: 1 July 2017
Length of Service at Axiata:1 year
Academic/Professional Qualifications:• Master of Business Administration (MBA).
University of Chicago, Booth School of Business, Illinois, USA
• Masters of Science in Computer Systems Engineering. Syracuse University, New York, USA
• Bachelor of Science in Computer Systems Engineering, Syracuse University, New York, USA
Working Experience: Suren has 25 years of experience in the telecommunications industry in globally renowned telcos, namely, Singapore Telecommunications Ltd. (Singapore), Sri Lanka Telecom’s Mobitel, Maxis Berhad (Malaysia) and Maxis Communications Berhad (Aircel Limited in India). Prior to joining Ncell, Suren functioned as Strategic Projects Director in Axiata, focusing on key group initiatives across its South Asian operations in Bangladesh, Nepal, Sri Lanka and Pakistan.
Directorships of Public Companies:Axiata GroupListed• Nil
Non-listed• Nil
OthersListed• Nil
Non-listed• Nil
SUREN J. AMARASEKERAManaging Director Ncell Private Limited
Profile of Operating Companies’ Management Team
Nationality / Age / Gender: German / 66 / Male
Date of Appointment to Executive Position: 1 September 2016
Length of Service at Axiata:5 years
Academic/Professional Qualification(s): • Master Degree in Mathematics and Economic
Science, University of Cologne, Germany • Executive Program and General Manager
Program at the Fuqua School of Business at Duke University, Durham, North Carolina
Working Experience: Michael Kuehner was appointed as the Chief Executive Officer and Executive Director of Celcom Axiata Berhad ("Celcom") in 2016. He was previously the CEO of Robi Axiata Limited ("Robi"), and has held key roles in Nokia and Siemens in Asia Pacific including India, Japan & Malaysia.
Michael has close to three decades of global leadership experience in telecommunications and technology industries. As an accomplished leader, he delivers organizational stability with his strategic vision and thought leadership to achieve growth in demanding multicultural environments.
Directorships of Public Companies:Axiata GroupListed• Nil
Non-listed• Celcom Axiata Berhad• Robi Axiata Limited
OthersListed• Nil
Non-listed• Nil
MICHAEL KUEHNER Chief Executive Officer & Executive Director Celcom Axiata Berhad
Nationality / Age / Gender:Sri Lankan / 42 / Male
Date of Appointment to Executive Position: 1 January 2017
Length of Service at Axiata:18 years
Academic/Professional Qualification(s): • Bachelor of Science (First Class Honours) in
Accountancy and Financial Management from the University of Jayewardenepura, Sri Lanka
• MBA, University of Western Sydney, Australia• Alumnus of Harvard Business School• Fellow Chartered Management Accountant
(FCMA), UK
Working Experience: Supun is the Group CEO of Dialog Axiata PLC ("Dialog"), with effect from January 2017. Before returning to Dialog, Supun was the CEO and Managing Director of Robi from 2014 to 2016. Prior to joining Robi, Supun served as the Group Chief Strategy Officer (GSCO) of Axiata. At Axiata, he also served as the Head of Network Transformation Strategic Business Unit under which he led the Group Technology, Carrier Collaboration and Axiata Intelligence Unit. Prior to his assignment to Axiata in 2013, Supun was the Group Chief Operating Officer (GCOO) of Dialog. He started his career in Telecommunications at Dialog in 1999 and held multiple roles such as Head of Strategy and CEO of the Mobile Business.
Directorships of Public Companies:Axiata GroupListed• Dialog Axiata PLC
Non-listed• Nil
OthersListed• Nil
Non-listed• Nil
SUPUN WEERASINGHEDirector/Group Chief Executive Dialog Axiata PLC
Notes:None of the operating companies' management team have:-• Any family relationship with any Director and/or major shareholder of Axiata.• Any conflict of interest with Axiata.• Any conviction for offences within the past five years and particulars of any public
sanctions or penalties imposed on them by any regulatory bodies during the financial year ended 31 Dcember 2017 (other than traffic offences).
• Celcom, Ncell and Dialog are principle subsidiaries as defined under the Main LR specifically subsidiaries which each accounts for 25% or more of the profit after tax on total assets employed by Axiata based on the latest published audited consolidated financial statements.

Governance & Audited Financial Statements 2017Governance & Compliance Information
17
Profile of Operating Companies’ Management Team
Nationality/ Age/ Gender:German / 40 / Male
Date of Appointment to Executive Position: 19 February 2013
Length of Service at Axiata:5 years
Academic/Professional Qualification(s): • Siemens AG “Stammhauslehre”, Siemens
Zweigniederlassung Leipzig, Germany • “IHK Industrial Business Administration”
Working Experience: Thomas has gained vast experience in the telecommunications industry during his tenure in key management positions with Siemens AG’s Communication Division and Nokia Siemens Networks. Thomas was also a member of the Supervisory Board of Azerfon in Azerbaijan. Since mid-2008, he has been CEO of Smart Mobile, which he grew from greenfield, number eight position in the market to number three position, including through the acquisition of Star-Cell in 2011 and the merger with Hello Axiata in 2013. Since then, Thomas has been instrumental in Smart’s leadership in Cambodia.
THOMAS HUNDTChief Executive Officer Smart Axiata Co., Ltd.
Nationality / Age / Gender: Indonesian / 49 / Female
Date of Appointment to Executive Position: 1 April 2015
Length of Service at Axiata:21 years
Academic/Professional Qualification(s): • Bandung Institute of Technology majoring in
Telecommunications • Harvard Advance Management Program,
Harvard Business School
Working Experience: Prior to her appointment as President Director of PT XL Axiata Tbk. ("XL"), she was Axiata’s Group Chief Marketing and Operations Officer. She also served as the Director and Chief Digital Services Officer from March 2013 and Director of Network Services in 2007. She joined XL in 1996 and started her career as a Radio Network Design Engineer and held numerous key positions in Network and Engineering Department. Her last position was Senior Vice President of Network Planning & Development prior to her appointment as President Director.
DIAN SISWARINI President Director PT XL Axiata Tbk.
Nationality / Age / Gender: Bangladeshi / 51 / Male
Date of Appointment to Executive Position: 1 November 2016
Length of Service at Axiata:7 years
Academic/Professional Qualification(s): • Bachelor of Honours and Masters in
Accounting, University of Dhaka, Bangladesh • Fellow member of Institute of Cost and
Management Accountant of Bangladesh (ICMAB), FCMA & CGMA of Chartered Institute of Management Accountants (CIMA, UK)
• Alumnus, Harvard Business School
Working Experience: Mahtab joined Robi in 2010 as CFO, the position which he held till 2014. He held the position of Chief Operating Officer (COO) of Robi from April 2014 to March 2016. Prior to joining Robi, Mahtab spent 17 years of his career with Unilever where he held various business and finance leadership positions including the post of Finance Director in various operating companies like Unilever Pakistan, Unilever Arabia and Unilever Bangladesh.
MAHTAB UDDIN AHMEDManaging Director/Chief Executive Officer Robi Axiata Limited
Nationality / Age / Gender: Malaysian / 47 / Male
Date of Appointment to Executive Position: 1 January 2015
Length of Service at Axiata:6 years
Academic/Professional Qualification(s): • BA (Engineering) and MEng, University of
Cambridge, UK• MBA from INSEAD, France
Working Experience: Khairil was appointed as Chief Executive Officer of Axiata Digital Services Sdn Bhd in January 2015. He first joined Axiata in 2012 and served as Group Chief Marketing and Operations Officer. Prior to Axiata, Khairil was a Partner at Bain & Company, Inc., a leading global management consultancy. He was with Bain for more than 15 years. Prior to joining Bain, Khairil was an operations consultant at Coopers & Lybrand, Management Consulting Services. He was also founder and operations manager of P-Shift Consulting (Southeast Asia) from 1996 till 1997, and manufacturing consultant with PERA Consulting in London and Kuala Lumpur from 1995 till 1996.
MOHD KHAIRIL ABDULLAH Chief Executive Officer Axiata Digital Services Sdn Bhd
Nationality / Age / Gender: Malaysian / 51 / Male
Date of Appointment to Executive Position: 1 January 2018
Length of Service at Axiata:2 years
Academic/Professional Qualification(s): • Bachelor of Commerce, University of
Newcastle, Australia
Working Experience: Asri has 27 years of experience in various management, consulting and entrepreneur engagements in the IT and telecom industries. He is a former Country President for Motorola Malaysia, a position he held from 2006 till 2008. He was also a strategic partner with Provident Capital Partners, an established South Asia private equity company. Besides Motorola, Asri has also worked with other multinational corporations (MNCs) such as Nokia.
ASRI HASSAN SABRI Chief Executive OfficerAxiata Business Services Sdn Bhd/Xpand
Nationality / Age / Gender: Malaysian / 51 / Male
Date of Appointment to Executive Position: 26 August 2014
Length of Service at Axiata:9 years
Academic/Professional Qualification(s): • Degree in Natural Sciences, University of
Cambridge, UK• MBA from INSEAD, France
Working Experience: Suresh Sidhu has been Chief Executive Officer of edotco since July 2014 where he and his team have overseen the transformation that has produced one of the fastest growing tower companies in the world in terms of towers and tenancies, with growth from new build as well as M & A. Prior to his role in Axiata, Suresh served as Chief Corporate and Operations Officer of Celcom, and has held senior roles at Axiata and Dialog in the Axiata Group. In addition, his previous work experience includes roles with Maxis, the Boston Consulting Group and Sime Darby Berhad.
SURESH SIDHU Chief Executive Officer edotco Group Sdn Bhd

Governance & Audited Financial Statements 2017Governance & Compliance Information
18
Profile of Operating Companies’ Management Team
Nationality / Age / Gender: Indian / 56 / Male
Date of Appointment to Executive Position: 1 April 2011
Academic/Professional Qualification(s): • Alumnus of Birla Institute of Technology and
the Indian Institute of Management, Bangalore
Working Experience: Himanshu has been the Managing Director of Idea Cellular Limited ("Idea") since April 2011. He has engineered Idea’s fast paced growth making it amongst the top three players and the fastest growing mobile operator in India. Himanshu is a veteran in the Indian telecom industry, contributing to the evolution of the industry, over the last two decades. He has been actively involved in the industry from its early days when India was a two player mobile market to the present times of hyper competition with a dozen global mobile operators competing for the world’s second largest telecom market.
HIMANSHU KAPANIA Managing Director Idea Cellular Limited
Nationality / Age / Gender: Singaporean / 63 / Female
Date of Appointment to Executive Position: 22 April 2009
Academic/Professional Qualification(s): • Master of Business Administration degree in
Investment and Finance (Distinction), University of Hull in the UK
• Fellow of the Association of Chartered Certified Accountants (UK)
Working Experience: Karen was the Acting CEO of M1 Limited ("M1") from 1 February 2009 to 22 April 2009, having joined M1 as CFO in August 1995. She was a key member of the senior management team responsible for the planning, development and launch of M1’s commercial operations. Prior to joining M1, Karen held various senior financial positions in large public listed companies, including Singapore Press Holdings Limited and City Developments Limited. She has over 30 years of experience in general and financial management.
KAREN KOOI Chief Executive Officer M1 Limited
Notes:Years of Service at Axiata refers to tenure within Axiata and its group of companies.
Governance & Audited Financial Statements 2017Governance & Compliance Information
19
9 January 2017 Axiata Digital Services Sdn Bhd ("ADS") completed the incorporation
of Axiata Digital Ecode Sdn. Bhd. (“ADE”) to carry out the business of researching and developing internet services and mobile applications.
18 January 2017
edotco Group Sdn Bhd (“edotco”) and Axiata entered into the following agreements:-
• Share Subscription Agreement between edotco and Innovation Network Corporation of Japan (“INCJ”) on the subscription by INCJ of up to 546,539,249 ordinary Shares of RM1.00 each in edotco (“edotco Shares”) at a cash consideration of up to USD400.00 million (equivalent to RM1,778.20 million); and
• Share Purchase Agreement between Axiata and Mount Bintang Ventures Sdn. Bhd. (“MBVSB”), a wholly-owned subsidiary of Khazanah Nasional Berhad ("Khazanah") for the purchase by MBVSB of 273,269,624 edotco Shares at a purchase consideration of USD200.00 million (equivalent to RM899.10 million).
27 January 2017 Completion of private placements of edotco shares equivalent to
USD300.00 million and USD200.00 million to INCJ and Khazanah. Shareholders' Agreement between edotco, Axiata, INCJ and Khazanah to govern the parties relationship in edotco became effective.
20 March 2017 The Board of Directors of Idea Cellular Limited Ltd approved the scheme
of amalgamation of Idea and Vodafone India Limited and its wholly-owned subsidiary, Vodafone Mobile Services Limited with Idea (Proposed Merger).
18 April 2017 edotco entered into a Share Subscription Agreement with Kumpulan
Wang Persaraan (Diperbadankan) (“KWAP”) for the subscription by KWAP of 136,634,812 ordinary Shares in edotco (“edotco Shares”) at a cash consideration of USD100.00 million (equivalent to RM440.95 million).
28 April 2017 The private placement of edotco Shares to KWAP was completed.
15 May 2017 Axiata Business Services Sdn Bhd (“ABS”), a wholly-owned subsidiary of
Axiata, entered into a Share Sale and Purchase Agreement (“SSPA”) for the acquisition of 65% of the issued share capital of Suvitech Co., Ltd (“SCL”) at a consideration of up to USD11.05 million (equivalent to RM47.91 million) (“Proposed Acquisition of SCL”).
19 May 2017 Axiata and its wholly-owned subsidiary, Axiata Investments (Cambodia)
Limited (“AIC”), entered into a Share Purchase Agreement (“SPA”) with M&Y Asia Telecom Holdings Pte. Ltd. (“MY Asia”) and Mitsui & Co., Ltd. for the disposal by AIC of 226 ordinary shares of USD1.00 each in Axiata (Cambodia) Holdings Limited (formerly known as Glasswool Holdings Limited) (“ACH”), the holding company of Smart Axiata Co., Ltd. ("Smart"), a 82.5% subsidiary of Axiata, representing 10% of the total issued and paid-up share capital of ACH, for a total cash consideration of USD66.0 million (equivalent to approximately RM285.7 million) (“Initial Sale”).
Pursuant to the Initial Sale, AIC also entered into an Amended and Restated Shareholders Agreement (“ARSA”) with MY Asia and Southern Coast Ventures Inc. (“SCV”) to govern their relationship as shareholders of ACH which includes inter-alia, a call option to MY Asia for further 10% stake in ACH.
1 June 2017 The disposal by AIC of 226 ordinary shares in ACH, the holding company
of Smart, was completed.
AIC and MY Asia now respectively holds 82.5% and 10% interest in ACH, with the balance 7.5% held by SCV.
6 June 2017 ABS completed the incorporation of Xpand Investments (Labuan) Limited
(“Xpand Labuan”), a private company limited by shares in the Federal Territory of Labuan.
20 June 2017 Edotco Pakistan (Private) Limited ("edotco PK"), a wholly-owned
subsidiary of edotco, entered into an Agreement for the Subscription, Sale and Purchase of Shares with Tower Share (Private) Limited (“TS PK”) and Tanzanite Tower Private Limited (“TTPL”) for the subscription of 899,900 ordinary shares of Rs.10 each in TTPL and acquisition from TS PK of the entire issued share capital of TTPL for a total cash consideration of USD90.0 million (equivalent to approximately RM385.4 million).
13 July 2017 Adknowledge Asia Pacific Pte Ltd (“APAC”), an 80% owned subsidiary
of Axiata Digital Advertising Sdn Bhd ("ADA") which in turn is a wholly-owned subsidiary of Axiata via ADS, incorporated a new subsidiary, Adknowledge Asia Philippines Inc. (“AAP”), a private company limited by shares, in Philippines. The incorporation of AAP was completed following the receipt by APAC on 12 July 2017 of the Certificate of Incorporation from Securities and Exchange Commission, Republic of Philippines.
3 August 2017 edotco PK completed the acquisition of 100% equity interest in TTPL for a
purchase consideration of USD88.9 million (equivalent to RM381.0 million) after adjustments provided under the terms of the Sale and Purchase Agreement ("SPA").
In accordance with the terms of the SPA, TTPL had on the Completion Date entered into a Share Pledge Agreement (“PA”) with HB Offshore Investments Limited (“HBOIL”), the owner of wi-tribe Pakistan Limited (“wi-tribe”), provider of wireless broadband services in Islamabad, Rawalpindi, Lahore, Karachi, and Faisalabad.
16 August 2017 ABS through its wholly-owned subsidiary, Xpand Labuan, had completed
the Proposed Acquisition of SCL.
30 August 2017 edotco Investments (Labuan) Limited, a wholly-owned subsidiary of
edotco, entered into a Subscription Agreement with Dawood Hercules Corporation Limited for the subscription of shares in edotco PK.
TTPL, a wholly-owned subsidiary of edotco, entered into an Agreement for the Subscription, Sale and Purchase of the Shares in Deodar (Private) Limited (“Deodar”) with Pakistan Mobile Communications Limited (“PMCL”) and Deodar, for the subscription of up to 3,569,990,000 ordinary shares of PKR10 each in Deodar and the subsequent acquisition of the remaining nominal amount of shares in the capital of Deodar from PMCL for a total cash consideration of USD940.0 million (equivalent to approximately RM4,012.90 million).
12 September 2017 Dialog Axiata PLC, a 83.32% subsidiary of Axiata, acquired by way of
stock trade crossing on Colombo Stock Exchange, a total of 37,374,598 ordinary shares of Colombo Trust Finance PLC from Cargills Bank Limited.
13 September 2017 ADS completed the incorporation of Merchantrade Digital Services
Sdn. Bhd. a private company limited by shares, to be used as the designated vehicle for the joint venture between ADS and Merchantrade Asia Sdn Bhd to carry out the business of digital financial services and solution provider.
2017 Significant Milestones
Governance & Audited Financial Statements 2017Governance & Compliance Information
20
9 October 2017 Smart entered into following agreements:-
i) Convertible Loan Agreement with Sabay Digital Plus Co., Ltd (“SDP”) under which Smart will make available a loan facility of USD1.5 million to SDP which is convertible to ordinary shares in SDP (“SDP Shares”); and
ii) Call Option Agreement with SDP and Sabay Digital Group Pte. Ltd. (“SDG”) for the acquisition of additional SDP Shares from SDG as follows:-
(a) Such number of SDP Shares resulting with the aggregate number of SDP Shares held by Smart is equivalent to 30% of the issued and paid-up capital of SDP; and
(b) All or part of the remaining issued and paid-up capital of SDP from SDG at a price to be agreed by the parties.
11 October 2017 ADS completed the incorporation of Axiata Digital Bangladesh (Private)
Limited (“ADB”), a private company limited by shares, in Bangladesh, to carry out an online ticketing business in Bangladesh.
26 October 2017 ADA completed the incorporation of a new subsidiary, PT Axiata Digital
Analytics Indonesia (“PTADAI”), a limited liability company in Indonesia, to carry out business of digital advertising and consumer analytics of ADS in Indonesia.
17 November 2017 ADS completed the incorporation of a new subsidiary, PT Axiata Digital
Services Indonesia (“PTADSI”), a limited liability company in Indonesia, to carry out the business of digital financial services of ADS in Indonesia.
12 December 2017 ADS completed the incorporation of APIgate Sdn. Bhd. (“APIgate”) to
carry out the business of developing Application Programming Interface ("API") and offering API services via API hub and portals software and mobile application.
18 December 2017 Celcom Axiata Berhad, a wholly-owned subsidiary of Axiata, had
completed the incorporation of On Site Services Sdn Bhd, to carry out the business of engineering and design, installation, testing and commissioning, network audit and optimisation for the telecommunication services industry and provision of telecommunication equipment and accessories.
2017 Significant Milestones

Governance & Audited Financial Statements 2017Governance & Compliance Information
21
Awards
2017
Axiata Group Berhad
MSWG-ASEAN Corporate Governance Recognition Awards 2017 Chairman Of The Year Award – Tan Sri Datuk Wira Azman Hj. Mokhtar Excellence Award For CG Disclosure Merit Award For Board Diversity
PwC Malaysia Building Trust Awards 2017 Runner Up
Global Responsible Business Leadership Awards 2017 Masterclass Best Sustainability Report
ACCA Malaysia Sustainability Reporting Awards (MASRA) 2017 2nd Runner Up
Australasian Reporting Awards 2017 Silver Standard – 2015 Annual Report
CSR Malaysia Awards 2017 CSR Company of the Year
Celcom Axiata
Frost & Sullivan Malaysia Excellence Awards 2017 M2M Service Provider of the Year Award
MyClear Malaysia e-Payments Excellence Awards Top Financial Process Exchange (FPX) Merchants Award
Appies Malaysia 2017 Gold Winner – Consumer Services
Star Rating Award 2016 by Malaysian Communications and Multimedia Commission
Best Consumer Satisfaction (Best Cellular Service Provider – Mobile Network Operator category)
2017 Malaysia’s 100 Leading Graduate Employers Awards 2017 Most Popular Graduate Employer of the Year – Telecommunication
2017 CIMB - Principal Malaysia Top Private Retirement Scheme Partner Awards
Best Corporate PRS Employer
XL Axiata
The 9th IICD Corporate Governance Conference & Award 2017 The Best Equitable of Shareholders Top 50 of The Biggest Market Capitalisation Public Listed Companies
Telecom Asia Award 2017 Best Community Telecom Project for XL Xmart Village 3.0
Indonesia Most Innovative Business Award 2017 Telecommunication Category
Outstanding Corporate Innovator (OCI) Indonesia Award 2017 Top 10 Corporate Innovators for XL Innovative programmes – XmartVillage
and Xmart City
Indonesia Most Admired Companies (IMACO) Award 2017
Selular Award 2017 Best Youth Development Programme for CSR programme – XL Future
Leaders Excellence in Media – GM Corporate Communication of XL Axiata Tri
Wahyuningsih.
Satyalancana Pembangunan for Post & Telecommunication XL Axiata’s President Director Dian Siswarini Chief Service Management Officer of XL Axiata Yessie D. Yosetya
Indonesia Prestige Brand Award 2017 Brand Used Most Often for XL – Mobile Phone Operator category Brand Used Most Often for AXIS on Internet Service Provider - Mobile
Phone category
Corporate Social Responsibility Awards 2017 Ranked #1 – Telecommunication Category
Annual Global CSR Summit & Awards and The Global Good Governance Awards 2017
Gold Award – XL Future Leaders Program (Category – Excellence in Literacy and Education programme for companies with a market capitalisation of more than USD1 billion)
The 2nd PR INDONESIA Awards (PRIA) 2017 The Best Media Relations for National Private Company Gold Award for Public Relations Department of Private Company
PR Indonesia 2017 Best Communicators 2017 – XL Axiata’s President Director Dian Siswarini
Indonesia Corporate PR Award 2017 The Most Popular Company
Dialog Axiata
SLIM-Nielsen PEOPLES Awards 2017 Telecom Service Provider of the Year Internet Service Provider of the Year
Corporate Accountability 2017 Ranked #1 – Corporate Accountability by the Association of Chartered
Certified Accountants (ACCA)
Business Today Top 30 Ranked #5
LMD Magazine 2017 Sri Lanka’s Most Connected Brand Ranked #3 as Sri Lanka’s Most Respected Entities 2017
Interbrand Most Valued Brand Awards 2017 Ranked #3
Asian Customer Engagement Forum 2017 Gold – Best Employee Engagement Program of the Year Gold – Best Change Management Program of the Year
Board of Investment (BOI) Sri Lanka Excellence Award – Outstanding Contribution towards the Economic
Transformation of Sri Lanka
Robi Axiata
GSMA Glomo Award 2017, Mobile World Congress 2017 Best Mobile Innovation for Education and Learning
Asia Pacific ICT Alliance (APICTA) Award e-learning category – Robi 10 Minute School
World HRD Congress Bangladesh Best Employer Award
Silver Play button from YouTube Robi 10 Minute School

Governance & Audited Financial Statements 2017Governance & Compliance Information
22
Smart Axiata
Frost & Sullivan Asia Pacific Best Practices Awards Cambodia Mobile Service Provider of the Year 2017
Global Banking and Finance Review Best Telecommunications Company Cambodia 2017 Best Corporate Social Responsibility (CSR) Company Cambodia 2017
IDG ASEAN Awards Cambodia’s Best 4G LTE Provider 2017
Ncell Axiata
Frost & Sullivan Asia Pacific Best Practices Awards Nepal Mobile Service Provider of the Year 2017
Telecom Asia Awards 2017 Most Innovative Telecom Project in Asia Pacific
edotco
Frost & Sullivan Asia Pacific Best Practices Awards Asia Pacific Telecoms Tower Company of the Year 2017
Axiata Digital
IDC Digital Transformation Awards Digital Disruptor of the Year Award – BIMA
Wall Street Journal and Met Life Financial Inclusion Award People’s Choice Award – BIMA
Fintech Finals 2017 Best Mature Stage Start Up – BIMA
FT1000: High Growth Companies Asia Pacific Ranked #196 – StoreKing
Mob-Ex Awards Gold for Best Campaign for Brand Awareness – AdkA Gold for Best Campaign Mobile Launch/Re-Launch – Boost
Malaysia PR Awards Silver for Consumer Launch category: The Year End Outlook Survey
Campaign – 11 Street
Idea
ET Telecom Award 2017 Best Enterprise Mobility Service Provider for Logistics Tracking Solution
Voice & Data Telecom Leadership Awards 2017 Internet & Broadband Services Marketing Network Security VAS & Apps Business Process Innovation
Asia’s Best Companies in 2017 by Finance Asia Best CFO Ranked #2 – Best CEO category Ranked #4 – Companies that are Most Committed to Corporate
Governance Ranked #4 – Companies that are Best at CSR Ranked #7 – Companies that are Best at Investor Relations
Best Companies to Work For in 2017 Ranked among Top 25 in a survey by Business Today
Golden Peacock Award Best Corporate Social Responsibility
Awards
M1
Excellent Service Awards 2017 (EXSA) 16 Stars, 48 Gold, 106 Silver
Contact Centre Association of Singapore Awards 2017 Best Contact Centre Team Leader Best Customer Professional of the Year
Patron of the Arts Award 2017 by National Arts Council
PAST AWARDS2016 Axiata
GSMA Mobile Asia Awards 2016 Outstanding Contribution to the Asian Mobile Industry Award – Axiata
Regional CEO for South Asia Dr Hans Wijayasuriya
MSWG Malaysia-ASEAN Corporate Governance Awards 2016 Ranked #3 in Excellence Award for Top Corporate Governance (CG) and
Performance (Overall Category) Excellence Award for Long-term Value Creation Excellence Award for Environmental, Social and Governance (ESG)
Practices Ranked #3 in Merit Award for Corporate Governance (CG) Disclosures
MSWG Malaysia-ASEAN Corporate Governance Transparency Index 2016
Ranked #3 among Top 100 Companies with Good Disclosures Ranked #3 among Top 100 Companies for Overall Corporate Governance
(CG) and Performance
ACCA Malaysia Sustainability Reporting Awards (MaSRA) 2016 Commendation Award for Innovation
Asia Pacific Procurement Leaders Award Best Procurement Transformation 2016
Bank Negara Malaysia Emas Status for Second Issuance of Sukuk
2015 Axiata
MSWG-ASEAN Corporate Governance Index 2015 Awards Excellence Award for Environmental, Social and Governance (ESG)
Practices Top 10 Corporate Governance Disclosure Merit Recognition Award Exemplary AGM Conduct & Minutes
ACCA Malaysia Sustainability Reporting Awards (MaSRA) 2015 Best Sustainability Report
Asia Pacific Procurement Leaders Award Best Procurement Transformation 2015
FinanceAsia Best Managed Company Poll 2016 #2 Best Managed Company in Malaysia #3 Most Committed to Corporate Governance in Malaysia #3 Best at Investor Relations in Malaysia #4 Best at Corporate Social Responsibility in Malaysia #1 Best CFO in Malaysia
Bank Negara Malaysia Emas Status for Issuance of Sukuk

Governance & Audited Financial Statements 2017Governance & Compliance Information
23
2014 Axiata
2015 GSMA Mobile World Congress Chairman's Award Dato’ Sri Jamaludin Ibrahim, President and Group CEO
Frost & Sullivan Asia Pacific ICT Awards Best Telecom Group 2014
Malaysian-ASEAN Corporate Governance Index 2014 Awards Top 5 Corporate Governance – Overall Recognition Exemplary Environmental, Social and Governance (ESG) Practices CEO of the Year, Dato' Sri Jamaludin Ibrahim
The Edge Billion Ringgit Club 2014 Malaysia's Outstanding CEO 2014, Dato Sri Jamaludin Ibrahim Best CR Initiative, 3rd Place
ACCA Malaysia Sustainability Reporting Awards (MaSRA) 2014 Best Sustainability Report, Runner-up
National Annual Corporate Reports Awards (NACRA) 2014 Best Designed Annual Report, Silver Award
Kancil Awards 2014 Film Craft Cinematography, Bronze Kancil
2013
Axiata
Frost & Sullivan Asia Pacific ICT Awards Best Telecom Group 2013
TMT Finance Asia TMT Leadership Award for Asia 2014 – Dato’ Sri Jamaludin Ibrahim
Malaysian Business Awards ASEAN Conglomerate & CEO of the Year Award – Dato’ Sri Jamaludin
Ibrahim
The Asset Triple A Best Corporate Sukuk Best Islamic Deal, Malaysia
Islamic Finance News Cross Border Deal of the Year 2012
KLIFFE Most Outstanding Islamic Product
Malaysia-ASEAN Corporate Governance Index 2013 Awards Top 3 Corporate Governance Transparency Award Top 5 Overall Corporate Governance Award Best Conduct of Annual General Meeting Award Industry Excellence Award – Telecommunications
Malaysian Institute of Accountants (MIA) NACRA Merit Award
International Legal Alliance Summit Silver Award Best Asian and South Pacific Legal
2012
Axiata
Frost & Sullivan Asia Pacific ICT Awards Best Telecom Group 2012
Boston Consulting Group 2012 BCG Southeast Asia Challengers
Asian Strategy & Leadership Institute (ASLI) Asian Corporate Giants 2012 Listing – Top 10
Bank Negara Malaysia Emas Status for Issuance of Sukuk
Finance Asia Best Islamic Finance Deal 2012
Euromoney Islamic Finance Most Innovative Deal 2012
Alpha Southeast Asia The Best Deal of the Year 2012 in Southeast Asia
IFM (Industry Fund Management) Cross Border Deal of the Year 2012
2011Axiata
Asia Pacific Brands Foundation (APBF) BrandLaureate CEO of the Year 2010-2011
Forbes Asia’s Fab 50
Frost & Sullivan Asia Pacific ICT Award 2011 Best Telecommunications Group of the Year
Malaysian Corporate Governance Index Awards 2011 Best Conduct of AGM Distinction Award
Telecom Asia Awards 2011 Best Regional Mobile Group
2010Axiata
Frost & Sullivan Asia Pacific ICT Awards 2010 Best Telecom Group of the Year CEO of the Year: Service Provider
Telecom Asia Awards 2010 Telecom CEO of the Year Best Regional Mobile Group
2009Axiata
Frost & Sullivan Asia Pacific ICT Award Best Telecom Group of the Year 2009
National Annual Corporate Report Awards (NACRA) 2009 Gold Award in the Best Designed Annual Report category
Malaysian Corporate Governance Index 2009 Merit Award
Alpha South East Asia Annual Deal Awards 2009 Best Secondary Deal of the Year 2009 in Southeast Asia
Awards
Governance & Audited Financial Statements 2017Governance & Compliance Information
24
Statement on Risk Management and Internal Control
Pursuant to Paragraph 15.26 (b) of the Main Listing Requirements (LR) of Bursa Malaysia Securities Berhad (Bursa Securities), the Board of Directors of listed issuers is required to include in their annual report, a ‘statement about the state of risk management and internal controls of the listed issuer as a group’. Accordingly, the Board is pleased to provide the following statement that was prepared in accordance with the ‘Statement of Risk Management and Internal Control: Guidelines for Directors of Listed Issuers’ as endorsed by Bursa Securities, which outlines the nature and scope of risk management and internal control of the Group during the financial year under review.
Board’s Responsibility
The Board is responsible and accountable for maintaining sound processes of risk management and internal control practices to safeguard shareholders’ investments and the Group’s assets, by constantly keeping abreast with the latest developments and best practices in terms of risk and governance. Such processes cover not only financial control but also operational and compliance controls. In view of the limitations inherent in any process, the risk management and internal control processes and procedures put in place can only manage risks within tolerable levels, rather than eliminate the risk of failure to achieve the Group’s business objectives.
The Board is assisted by the Board Audit Committee (BAC) in evaluating the adequacy of risk management and internal control framework. The BAC, via the Axiata Group Risk Management Committee (GRMC), has put in place a systematic risk management framework and process to identify, evaluate and monitor principal risks; and implement appropriate internal control processes and procedures to manage these risks across the Group, excluding Associate Companies and joint ventures which are not within the Group’s control.
1. Axiata Enterprise Risk Management Framework
The Group adopts the Axiata Enterprise Risk Management (ERM) Framework as a standardised approach for timely identification, reporting and management of principal risks and ensures implementation, tracking and review of effectiveness of mitigation actions for the risks identified. Where appropriate, the framework is embedded into the day-to-day business activities and management decision making framework of the Group. The framework, benchmarked against ISO31000:2009, is adopted by all risk management teams across the subsidiaries. It stresses the importance of balancing between risk and reward in making strategic business decisions, a tool in managing both existing and potential risks with the objective of protecting key stakeholders’ interests, and compliance with statutory and legal requirements.
2. Risk Governance Structure
A robust and effective risk management system is critical for the Group to achieve continued profitability and sustainable growth in shareholders’ value in today’s hypercompetitive market. The Group is committed towards continuous improvement of risk management processes and ensures that the processes remain relevant to the operating environment. The GRMC, which consists of all the members of Axiata Group Senior Leadership Team (SLT) and chaired by the Axiata Group BAC Chairman plays a key role in driving Axiata’s ERM Framework by having an oversight function on overall risks undertaken by the Group in delivering its business plan vis-à-vis the Group’s risk appetite. The Group Risk Management Department (GRMD) assists the Board and GRMC in discharging their risk management responsibilities and ensure systematic implementation and monitoring of the effectiveness of risk management culture and processes across the Group. The committee meets on a quarterly basis to review existing, new and evolving risks and where necessary, evaluate effectiveness of mitigation plans and improve existing risk practises, where necessary. In 2017, the Malaysian Code on Corporate Governance (MCCG) introduced “Step Up” practices (MCCG Step Up 9.3) whereby a Board Risk Management Committee comprising a majority of independent directors to oversee the company’s risk management framework and policies. Following this, on February 2018 the Board Risk Management
Committee was formed to replace the Group Risk Management Committee. The following depicts the key parties within the Group’s Risk Governance Structure and their principal risk management roles and responsibilities:
Board of Directors
• Maintaining a sound system of risk management & internal controls
• Approves risk management policy and framework, governance structure and sets the risk appetite
• Receives, deliberate and endorses BAC reports on risk governance and internal controls
Board Audit Committee
• Assist the Board in evaluating the adequacy of risk management & internal control framework
• Reviews and endorses the Group Risk Profile• Receives and reviews reports from the Risk Committee and
recommend them to the Board for approval
Group Risk Management Committee (up to the end 2017)
• Assist in identifying principal risks at Group level and providing assurance that the ERM is implemented group-wide
• Review and recommend frameworks and policies specifically to address enterprise risk inherent in all business operations
• Promote cross-functional sharing of risk information• Monitor compliance to ERM Framework, regulatory
requirements and status of action plans for both Group and subsidiaries
• Coordinate and promote risk management culture and implementation
Board Risk Management Committee (effective 2018)
• Roles as per Group Risk Management Committee• The Cyber Security Steering Committee (CSSC) reports to the
Board Risk Management Committee
Group Risk Management Department
• Establish, formulate, recommend and manage sound and best practice ERM program for Axiata Group
• Inculcate risk awareness within the Group• Assist Axiata OpCos and Business Units in establishing their
internal risk policy and structures, including business continuity programme for the Group
• Identification and consolidation of risk matters• Secretariat for the GRMC and with effect from 2018 Board
Risk Management Committee• Consolidated risk reports from Axiata OpCos and Business
Units for the GRMC’s review• Encourages & recommend the adoption of mitigation actions
where appropriate
Risk Focals at Axiata CC and OpCos
• Primarily responsible for managing risks on a day-to-day basis• Promoting risk awareness within their operations and
introduce risk management objectives into their business and operations
• Coordinate with Axiata Group Risk Management Department on Implementation of risk management policy and practices
Governance & Audited Financial Statements 2017Governance & Compliance Information
25
The implementation of risk management activities encompasses both corporate and subsidiary (at Operating Company or “OpCo”) levels where OpCos have similar risk structures within their jurisdiction. While the Group recognises the autonomy of the local jurisdictions within each region, GRM strives to ensure a consistent and standardised approach in the risk governance process. To ensure the operationalisation of risk management processes and clear accountability at the OpCo level, risk committees comprising of their Chief Executive Officer (CEO) as Chair, and selected senior management members are set up in each OpCo. At the same time, a risk focal person (“Risk Champion”) is appointed to provide timely risk updates and act as the key liaison with GRMD. Events which may materially impact the Group’s financial position and reputation will be escalated to the GRMD for appropriate action. At the same time, the Risk Champion would provide recommendation on the adoption of appropriate mitigation steps and provide quarterly updates to their respective OpCo BAC on the action taken. To further strengthen accountability at the management level, the CEO or Chief Financial Officer (CFO) of each OpCo is required to present their risk profile at the GRMC on a rotational basis. This structure provides the Group with the necessary detailed knowledge from OpCos, thus allowing the Board to have a comprehensive view of principal risks and mitigation activities across the board and ensure accountability by OpCos in managing their risks. As and when new OpCos are established, GRMD will work closely with the new management team in the set-up of the risk function.
The Group faces many risks and uncertainties which we mitigate and manage through various risk management strategies, actions and controls. These risks vary widely with some threatening our business model, future performance and financial standing of the business. There may be risks that are beyond the Group’s control, or presently unknown or currently assessed as insignificant, which may later prove to be material. Nonetheless, we aim to mitigate the exposures through appropriate risk management strategies and internal controls as much as possible.
Principally, the Group’s key risk factors are categorised into the following twelve categories:
• Financial Risk• Market Risk• Regulatory Risk• Cyber Risk• Digital Risk• Operational Risk• Geo Political Risk• Strategic Risk• Investment Risk• People Risk• Technology Risk• Governance and Integrity Risk
A write-up of the key risks faced by the Group are listed in Appendix 1 of this statement.
The following key internal control structures are in place to assist the Board to maintain a proper internal control system.
Key Internal Control Structures of the Group
1.0 Control Environment
The control environment sets the tone for the Group by providing fundamental discipline and structure. Key elements of the Group’s internal control systems include:
Statement on Risk Management and Internal Control
1.1 Integrity and Ethical Values
• Code of Conduct and Practice
The Senior Management and Board set the tone at the top for corporate behaviour and corporate governance. All employees of the Group shall adhere to the policies and guidelines as set out in the Code of Conduct of the Group which sets out the principles to guide employees in carrying out their duties and responsibilities to the highest standards of personal and corporate integrity when dealing within the Group and with external parties. The Group’s Code of Conduct covers areas such as compliance with respect to local laws and regulations, integrity, conduct in the workplace, business conduct, protection of the Group’s assets, confidentiality, conflict of interest and anti-competition practices. In 2017, various initiatives including ongoing enforcement of the Gift Policy, consequence management on violation of integrity and values and Group Recognition Event to inculcate and encourage the appropriate behaviours continued.
• Guidelines on Misconduct and Discipline
Guidelines are in place for handling misconduct and disciplinary matters. These guidelines govern the actions to be taken in managing the misconduct of employees who breach the Code of Conduct and Practice or do not comply with the expressed and implied terms and conditions of employment. The Code of Conduct and Practice has also been extended to contractors and suppliers of the subsidiaries.
1.2 Board Committees
(a) Board
Clear roles of the Board are stated under the Corporate Governance Overview section of this Integrated Annual Report.
(b) Board Committees
To promote corporate governance and transparency, in addition to the Board, the Group has the BAC, Board Nomination Committee (BNC) and Board Remuneration Committee (BRC), collectively known as ‘Board Committees’ in place. With effect from 2018 the Board Risk Management Committee was introduced. These Board Committees have been established to assist the Board in overseeing internal control, risk management, Board effectiveness, and nomination and remuneration of the Group’s key positions and directors. The responsibilities and authority of the Board and Board Committees are governed by a clearly defined Terms of Reference (Tor).
(c) BAC
The primary function of the BAC is to assist the Board in fulfilling its statutory and fiduciary responsibilities. The BAC will review the financial statements and financial reporting process, the system of internal controls, management of enterprise risk, the audit process and the process for monitoring compliance with law and regulations including Bursa Securities requirements and the company’s Code of Conduct.
It has direct access to the internal and external auditors and full discretion to invite any Director to attend its meetings. Further details of the BAC are stated under the BAC Report section of this Integrated Annual Report.

Governance & Audited Financial Statements 2017Governance & Compliance Information
26
Statement on Risk Management and Internal Control
(d) BRMC
In February 2018 the Board Risk Management Committee was established.
The Cyber Security Steering Committee (“CSSC”) which previously in 2017 reported to the BAC now reports to the BRMC. The CSSC accelerated the implementation of cybersecurity initiatives, by establishing an Information Security Programme across all OpCos to strengthen the resilience against cyber threats.
(e) BNC
Please refer to the Corporate Governance Overview section of this Integrated Annual Report.
(f) BRC
Please refer to the Corporate Governance Overview section of this Integrated Annual Report.
1.3 Senior Leadership Team (SLT)
The SLT is committed to the identification, monitoring and management of risks associated with its business activities. The GCEO and Management are ultimately responsible to the Board for the Group’s system of internal control and risk management. Each business unit is responsible and accountable for implementing procedures and controls to manage risks within its business.
1.4 Organisation Structure
• Clear Organisation Structure
The Group has an appropriate organisational structure led by functional SLT members who have clear roles of responsibility and lines of reporting. The proper segregation of duties promotes ownership and accountability for risk taking and defines lines of accountability and delegated authority for planning, executing, controlling and monitoring of business operations. Competent and professional individuals have been selected as part of our SLT to ensure we manage our business well and to deliver business results. Regular reviews of the organisational structure are held to address the changes in the business environment as well as to keep abreast of current and future trending of new technologies, products and services.
• Corporate Centre
The Corporate Centre plays an advisory role to add value to the subsidiaries at varying engagement levels. The broad roles of the Corporate Centre are as follows:
1. Supporting role to Axiata Board Representatives at OpCos and OpCos’ management; and
2. Supporting role to OpCos’ Functional Heads. Besides engaging in regular communication between the
OpCos and the Group functions, the Corporate Centre also gives appropriate inputs and steers the Group on best practices through sharing of the Group’s guidelines and strategies to minimise risk exposure and to increase the efficiency and effectiveness of business operations. The Corporate Centre is also responsible for key processes and functions including strategic planning, mergers and acquisitions, joint development projects, capital raising and allocation, leadership, talent development, group accounts and reporting, procurement, treasury, technology including cybersecurity and network.
The Corporate Centre is also involved in leading Group initiatives to address current and future challenges of the Group.
1.5 Assignment of Authority and Responsibility (Finance)
• Policies and Procedures
Documented policies and procedures are now in place for all major aspects of the Group’s business and these are regularly reviewed and updated to ensure that they remain effective and continue to support the organisation’s business activities at all times as the organisation continues to grow.
These policies and procedures are supported by clearly defined delegation of authorities for amongst others, spending on operating and capital expenditures, authority to enter into contracts and commitments, business plans and budget, and procurement of goods and services.
• Limits of Authority (LoA)
The Board has approved a clearly defined and documented LoA to govern the business and standard day-to-day operations. The LoA are reviewed and updated regularly with the intent to ensure continuous improvements, to reflect changing risks and to resolve operational deficiencies. It establishes a sound framework of authority and accountability within the Group, including segregation of duties which facilitates timely, effective and quality decision making at the appropriate levels in the Group’s hierarchy. The approved updated LoA is timely disseminated to all stakeholders to ensure seamless application and execution.
Axiata’s LoA document clearly sets out the matters reserved for the Board’s consideration and decision making, the authority delegated to the President and GCEO and other SLT members, including the limits to which the President and GCEO can execute the authority, and provides guidance on the division of responsibilities between the Board and Management.
1.6 Commitment to Competency
• Competency Framework The Group appoints employees of the necessary
competencies to ensure that the personnel driving key operations are sufficiently skilled and exert the required qualities of professional integrity in their conduct.
• Performance Management
The Group is committed to attract and retain competent, dedicated and loyal employees. Programmes and initiatives have been established to ensure that the Group’s human capital is equipped with the qualities and skills to drive the Group to become a world class company through ongoing emphasis on performance management and employee development.
The Group has in place a Key Performance Indicators (KPI) performance measurement process as prescribed under the Government-Linked Company Transformation (GLCT) programme to link performance and compensation in order to create a high performance work culture. This process also seeks to provide clarity, transparency and consistency in planning, reviewing, evaluating and aligning employees’ actions and behaviours to that of the Group’s vision and mission.

Governance & Audited Financial Statements 2017Governance & Compliance Information
27
• Training and Development Framework
It is the Group’s policy to train employees at all levels so that they would be able to perform well in their present jobs and also to develop employees who are considered to have the potential to perform duties with wider responsibilities so that they may be ready to assume them when needed.
In 2017, trainings were focused on building digital culture, mindset and capabilities, starting from top management all the way to every employee across the Group. This includes providing a platform “The Digital Jam” which allowed employees to explore the use of digital technology to solve their existing business problems, making them more confident in using new technologies”. This is in line with enabling the organisation to move towards its vision of becoming a digital champion.
Programmes are also implemented to ensure that employees receive continuous training in various areas of work such as knowledge, health and safety, technical training, leadership and new product development.
• Talent Development and Succession Planning
There is a Group Talent Management Framework in place to identify and develop a group talent pipeline within the organisation as a supply for future leadership demands. In this respect, the Group has met its target of identifying C-suite potentials that provides a cover ratio of 2:1, from within the organisation and has been intensifying its efforts in making these talent ready to succeed the current top management across the Group. This is done via structured leadership development programmes, mentoring and coaching, regular leadership readiness assessments, as well as cross-functional and cross-country assignments.
This leadership talent pipeline is also regularly reviewed via the Group Talent Council and assessed as potential successors for key positions in the Group, via internal and external benchmarks.
Succession plans and the robustness of the talent pipeline are regularly reviewed by the Board. The talent pipeline includes fresh graduates and middle management levels so as to ensure a continuous supply of talent. As of 31 December 2017, twelve (12) internal successors have been placed at top positions across the Group.
2.0 Risk Assessment
Axiata’s risk management process is guided and principally aligned to ISO31000:2009 where risk is managed to ensure the achievement and implementation of strategic objectives. The Group conducts a top-down review of enterprise level risks as part of the annual strategic planning process to ensure that the risk implications of any changes in and implementation of our business strategy are identified, assessed and documented. This is supplemented by quarterly risk reviews. Investment proposals on the other hand is assessed separately by the due diligence team with feedback provided by GRMD and subsequently presented to the Board for an appropriate decision. The outcome of these reviews is the identification of risks which is then assessed in terms of likelihood and magnitude of impact and development of specific action plans.
Axiata’s Risk Assessment Process is depicted in the following diagram: Process for Managing Risk
The risk identification process, which is done on an ongoing basis entails scanning all key factors within Axiata’s business context from an ‘outside-in’ perspective, i.e. from macro-environment (external) to industry and internal risks. Risks are generally classified into distinct categories, i.e. strategic, financial, operational and compliance, representing the challenges to the Group’s business operations, as depicted below:
Risk information and treatment plans are captured and updated into a risk register which is maintained by the respective OpCos and the Group. The information is then consolidated to provide an enterprise overview of material risks faced by the Group and the associated risk mitigation plans, which is tracked and reviewed from time to time.
• Control Self-Assessment (CSA) CSA is an effective process used by the Group for improving
business internal controls and processes. It allows employees of the Group to identify the risks involved in achieving the business objectives, to evaluate the adequacy and effectiveness of the controls in place and activities designed to manage those risks. CSA was performed on selected areas in XL and Ncell in 2017.
Str
ateg
ic
Operational
Financial
Co
mp
lianc
e
InternalStrategy,
Governance, Financial, People,
OperationsSubs
titu
tes
I
ndustry
Competitors
Vendors Customers
S
upp
ly C
hain
Technology
Environment
RegulatoryEconomy
Social
Geo Political
Macro Environment
Statement on Risk Management and Internal Control
Establish Context
Risk Identification
Risk Analysis
Risk Evaluation
Risk Treatment
Re
cord
ing
, Mo
nito
ring
&
Rev
iew
Co
mm
un
ica
tio
n &
C
on
sult
ati
on

Governance & Audited Financial Statements 2017Governance & Compliance Information
28
3.0 Control Activities
Control activities are the policies, procedures and practices that ensure management objectives are achieved and risk mitigation strategies are carried out. Key activities within the Group are as follows:
3.1 Policies and Procedures
• Financial and Operational Policies and Procedures
The Group currently maintains two policies, i.e. LoA and Group Policies encompassing both the Group and OpCo levels, which sets the framework for the development of the respective procedures covering financials and controls. The documented procedures include management accounting, financial reporting, procurement, information systems security, compliance, risk management and business continuity management.
Internal control is embedded into these policies to ensure consistent application throughout the Group. This serves as a preventive control mechanism whilst allowing the Group to promptly identify and respond to any significant control failures.
• Budgeting Process
A comprehensive annual budgeting process is in place to evaluate the feasibility and viability of the Group’s businesses and to ensure that the Group’s OpCos business plans are in line with the Group’s future strategic plans. Annual budgets are prepared by the OpCos and deliberated with their respective Boards. They are then presented and discussed during the Axiata Board Retreat for approval before the commencement of a new financial year.
Upon approval of the budget, the Group’s performance is periodically monitored and measured against the approved budget and ongoing business forecast, which is cleared by the President and GCEO and supported by the SLT. The Group’s performance is also reported to the BAC and the Board. Reporting systems which highlight significant variances against the plan are in place to track and monitor performance. The results are reviewed on a quarterly basis by the Board to enable them to gauge the Group’s overall performance, compared to the approved budget and prior periods, and to take remedial action where necessary. Similar performance reviews at OpCos Board level take place on a monthly or quarterly basis.
• Whistleblower Policy and Procedures
The Group has a Whistleblower Policy which enables employees to raise matters in an independent and unbiased manner. As part of this Whistleblower Policy and procedures, there is an anonymous ethics and fraud e-mail, under the administration of the Group Chief Internal Auditor (GCIA), as a mechanism for internal and external parties to channel their complaints or to provide information in confidence on fraud, corruption, dishonest practices or other similar matters by employees of the Group. The objective of such an arrangement is to encourage the reporting of such matters in good faith, with the confidence that employees or any parties making such reports will be treated fairly, their identity remains anonymous and are protected from reprisal.
• Insurance and Physical Safeguard
The Group maintains an insurance programme to ensure that its assets and businesses are sufficiently covered against any damage that will result in material losses. This includes a cyber risk insurance taken up for the Group. At the same time, we also ensure that our major assets are physically safeguarded and review the adequacy and type of insurance cover at regular intervals to ensure alignment against the Group’s risk exposure and appetite.
Statement on Risk Management and Internal Control
3.2 Security (Application and IT Network)
• Business Continuity Management
The Board is committed to safeguard the interest of our stakeholders by ensuring the ability of business operations to continue during a crisis and to have speedier recovery from a crisis through the implementation of Business Continuity Management (BCM) across the Group. The BCM programme provides a framework for the Group in building organisational resilience in the face of a crisis. The programme created is sufficiently robust to cover any changes that may arise due to technological evolution or organisational changes.
The Group BCM framework, aligned against international standards of ISO 22301 Business Continuity Management have been formalised and standardised across the Corporate Headquarters and selected OpCos. At the same time, our versatile framework allows for customisation in accordance to each OpCo’s requirements and operating environment. Business recovery plans have been documented for mission critical processes, tested and rehearsed regularly to ensure effective coordination, familiarity and awareness among employees. The Group Risk Management department, which is led by the Group Chief Risk Officer, is responsible in ensuring effective implementation, coordination and standardisation of business continuity efforts across the Group.
• Information Technology (IT)
IT modernization and digital enablement for superior customer experience is identified as one of the Group’s key strategies. All OpCos have been focusing in line with this strategy undertaking various initiatives which include the ground work for building the Digital IT Stack, application rationalization, increased use of enhancing Application Programme Interfaces (APIs), modernising Business Support Systems (BSS) and Operations Support Systems (OSS) in order to meet evolving business requirements and achieve competitive positioning. Cybersecurity is an essential and underlying part of our digital strategy and risk mitigation. In 2016, the Cyber Security Operations Center (CSOC) was established across the majority of OpCos to improve incident monitoring capability. In addition, relentless focus continues on strengthening cybersecurity resilience through various initiatives, for example, periodic Cyber Security Posture Assessment (CSPA) etc. With business continuity being another critical area, continued focus and investments are being ensured in disaster recovery for key IT systems.
3.3 Regulatory and Compliance
• Group Regulatory Affairs (GRA)
The approach used is to pro-actively shape the landscape (external environment) at each OpCo market thus enabling proper and effective management of regulatory issues confronting the OpCos. The regulatory issues are those identified and monitored via regular reviews of the Group’s risk matrix and managed as part of the Enterprise Risk Management process.
This approach encompasses:
1. Regulatory Strategy:
a. Constant monitoring of regulatory developments and identification of regulatory issues for each OpCo based on issues of highest strategic, financial and/or reputational impact;
b. Periodic review of national OpCo annual regulatory strategies which addresses these issues. This would translate into an advocacy plan engaging regulators and other authorities through formal and informal submissions and where appropriate, joint advocacy with international partners such as GSMA; and

Governance & Audited Financial Statements 2017Governance & Compliance Information
29
c. Development of Group-wide positions on key issues such as regulations for the digital economy such as e-SIM, digital identity (eKYC), digital financial services regulations, digital privacy, availability of new spectrum bands, taxation, industry sustainability, Over-the-Top (OTT) regulations, Same-service-same-rules (SSSR) and 5G policy.
2. Stakeholder Engagement:
a. Engagement plan covering key government and political stakeholders in each OpCo market including key agencies such as the National Regulatory Agencies with effective messages based on the regulatory strategy;
b. Regularly working with National Regulatory Agencies on Knowledge Exchange Programmes and other capacity building events to promote common digital and financial inclusion objectives; and
c. Engagement plan covering international and regional regulatory bodies, inter-governmental agencies and trade bodies with effective messages based on the regulatory strategy.
3. Regulatory Compliance Framework:
a. Forms an essential part of the Corporate Governance Framework of the Group and states the principles and the tone by which regulatory compliance is to be approached and implemented;
b. Objectives of the Regulatory Compliance Framework:i. Set baseline expectation in relation to regulatory
compliance;ii. Place Axiata and OpCos in the best position to comply
with regulatory obligations;iii. Manage exposure to unacceptable compliance risk; andiv. Avoid surprises on regulatory compliance and action
from regulatory authorities.
In addition, GRA constantly embarks on ensuring a group-wide baseline of best practice regulatory skills and knowledge, through the development of industry collaterals, position papers and regular capacity building programmes.
The Group Regulatory Policy outlined in the Group Policy document provides guidance and establishes internal policies and procedures that attempt to manage the risk and impact of adverse regulatory decisions.
Underpinning the Group Regulatory Policy is the understanding that the Group shall comply with all applicable laws and regulations, regulatory obligations and governmental policies in the jurisdictions in which it operates, and that regulatory advice should be obtained in an efficient and cost effective manner as and when required.
It should be noted that the regulatory risks faced by Axiata in most markets are typical of those faced by telecommunications operators in emerging markets, where regulatory frameworks may be incomplete, there may be insufficient consultation with stakeholders, or political influence may materially affect the operations of mobile markets. Current regulatory risks which affect Axiata in multiple national communications markets include but not limited to: spectrum refarming, availability of new spectrum and associated acquisition costs, timely renewal of key operating licenses and spectrum allocations, levels of sector-specific taxation, quality of service, subscriber registration, competition, level playing field challenges from OTT providers, network security, digital services regulations, universal service obligations and periodic review of legal and regulatory frameworks.
Statement on Risk Management and Internal Control
4.0 Information and Communications
Information and communications support all other control components by communicating control responsibilities to employees and by providing information in a form and time frame that allows employees to carry out their duties. The key activities within the Group are as follows:
4.1 Corporate Communications and Sustainability
General Guidelines and Roles As the public face of a company where media is concerned, the
Corporate Communications and Sustainability function is dedicated to maintaining and building a strong and positive image of the Group across its operating footprint in Asia and to be regarded by its target audiences as a regional thought-leader in the global telecommunications and digital industry. The department also serves to safeguard and protect the Group’s corporate reputation and take on the role as the custodian of the Group’s sustainability initiatives and nation building efforts. This is conducted through various platforms to include:
a. Producing compliant, open and transparent reports and communication materials based on Bursa Malaysia’s Listing Requirements, and where possible, to go beyond requirements
b. Positioning, sharing of information and messaging with media by way of business interviews, media activities and news conferences
c. Effective use of mainstream and digital communication channels to ensure public access and engagement
d. Leveraging on the company’s spokespersons to shape the public, investors and stakeholders’ view and perception of the organisation in an accurate and coherent manner
e. Proactively engaging and sharing company news, information and update with employees across the Group
f. Being responsible for the governance and management of materiality impacting environmental, social and governance issues as aligned with the Group’s sustainability framework
g. Managing crisis from a communications’ perspective and across all strategic touch-points
In the face of rising complexity of the regional business environment and unpredictable geopolitics in most of our markets, Corporate Communications and Sustainability is guided to ensure that communications and engagements across the Group and within each local operation, and influencers inside and outside of Malaysia are effectively managed and meets the diverse needs of the organisation. Among the key efforts required under external communications include:
a. Preparing and publishing the company’s performance and financial reports such as the Integrated Annual Report, Sustainability & National Contribution Report, Governance & Audited Financial Statement Report and other various communication materials
b. Helping spokespersons prepare for media interviews and developing messages that will be used to deliver to investors and shareholders
c. Managing the corporate website and social media tools and platforms in terms of content creation, promotion and data analytics
d. Creating platforms and communication channels to allow for engagement with stakeholders to include managing financial and corporate development announcements as well as mitigating reputational issues that may have a negative impact on corporate image
In the Group’s efforts to transform to become the new generation digital company, digital and online communication tools and platforms are the mainstay of connecting with the public as well as employees in a seamless and purposeful manner. The use of social media to engage and share information with the diverse communities within the region and to engage and keep employees informed of activities and corporate developments have become more important and relevant.

Governance & Audited Financial Statements 2017Governance & Compliance Information
30
Statement on Risk Management and Internal Control
4.2 Media and Public Relations
The engagement of the media fraternity which also includes building positive relations with business journalists, senior writers and editors and ensuring timely and accurate messages are shared and positioned, is an important and strategic role of Corporate Communications. Amongst others, the media relations function include writing and distributing news releases, overseeing all planning work required for staging news conferences and media interviews, responding to media inquiries, preparing the company’s spokespersons to speak and engage with media and generally, ensuring the transparent and quality representation and position of the company’s interests and plans. The role also requires proactively and reactively managing issues and address any misinformation and misrepresentation that may in any way, impact the Group’s reputation.
Monitoring and tracking of and reporting on print, social, online and digital media to include blogs, is becoming increasingly critical to ensure a firm and realistic grasp of what the public, media and social influencers are saying, and devising communication strategies to improve perception and address inaccuracies or public queries.
The Board also recognises the need for more dialogue with investors and analysts, details of investor relations activities are listed within the Corporate Governance Overview section of this Integrated Annual Report.
4.3 Crisis Communications
Incidences or events that can seriously threaten a company’s reputation such as extensive network failure, threat to cybersecurity or insider trading, will require the function of Corporate Communications to lead in managing the crisis from a communications perspective, namely advising senior executives on messaging, managing media inquiries, preparing engagement platforms such as interviews and briefings, and ensuring employees are kept duly informed. A crisis may entail Corporate Communications to collaborate with the relevant internal content and stakeholder owners to work with regulators, political officials, emergency response personnel and communications teams from other organisations when developing crisis messages. We are guided by the Axiata Group Crisis Communications Manual and Framework that was developed to address common crisis scenarios that affect the industry and business, with crisis simulation exercises and spokespersons training conducted periodically.
4.4 Employee Communications
Group Corporate Communications also functions as employee communications managers, to keep employees within Corporate Centre and across the Group informed and engaged on new developments, activities and announcements. This is achieved through the use of face-to-face engagements such as quarterly Townhall sessions, and facilitation of employee activities. In addition, the team has introduced various digital platforms such as Intranet portals and internal social media as tools for internal communications, in line with Axiata’s digital ambition. This includes Workplace, Intranet portal, e-mail, while leveraging on social media platforms such as the company’s Facebook, LinkedIn and Twitter channels.
4.5 Sustainability and Governance
The Group Sustainability team is responsible for the governance and management of material environmental, social and governance issues aligned within the Group’s Sustainability Framework. Group Sustainability will ensure compliance with the sustainability policy, benchmark against international standards, align with the indicators of the Sustainable Development Goals, update material issues, conduct stakeholder engagement, standardise data collection, implement management systems, and develop communication materials for internal and external stakeholders.
All OpCos should align and localise the Group Sustainability Framework to their local context, and be responsible for collecting related data needed to support Group’s Sustainability Framework. Group Sustainability provides advisory support and capacity building to all OpCos on a needs basis to improve their sustainability performance. OpCos are encouraged to produce their own sustainability report in compliance with the most current Global Reporting Initiative standard.
5.0 Monitoring
Monitoring covers the oversight of internal control by management or other parties outside the process or the application of independent methodologies, such as customised procedures or standard checklists, by employees within a process. Key monitoring activities within the Group are as follows:
5.1 Performance Reporting
• SLT Meetings
The SLT meets monthly and as and when required, to deliberate on business performance, financial and operating risks and issues which include reviewing, resolving and approving all key business strategic measures and policies. Progress, exceptions and variations are also fully discussed and appropriate action taken. In 2017, there were 11 SLT meetings held at Group level. Similar meetings were held regularly at OpCo level.
Significant matters identified during these meetings are highlighted on a timely basis to the Board, which is responsible for setting the business direction and for overseeing the conduct of the Group’s operations. Through these mechanisms, the Board is informed of all major control issues pertaining to internal control, regulatory compliance and risk taking. This ensures that business objectives stay on course.
• Major Control Issues
Quarterly reports on financial and operational control issues are tabled and subsequently reviewed by the BAC.
• Business Control Incident (BCI) Reporting
The Group has in place BCI Reporting aimed at capturing and disseminating the lessons learnt from internal control incidents with the objective of preventing similar incidents from occurring in other OpCos within the Group and to enable monitoring of internal control incidents that have caused significant losses. Sixteen (16) such incident reporting were shared with all OpCos in 2017.
• Headline Performance KPIs
Headline Performance KPIs have been set and agreed upon by the Board as part of the broader KPI framework that the Group has in place, as prescribed under the GLCT programme.
The headline KPIs represent the main corporate performance measurement targets for the year and are announced publicly as a transparent performance management practice.
5.2 Ongoing Monitoring
• Financial and Operational Review
Quarterly financial statements and the Group’s performance are reviewed by the BAC, which subsequently recommends them to the Board for their consideration and approval. Monthly management accounts containing key financial results, operational performance indicators and budget comparisons are also presented to the SLT to enable them to have regular and updated information of the Group’s performance.
Governance & Audited Financial Statements 2017Governance & Compliance Information
31
5.2 Ongoing Monitoring (Continued)
• Internal Audit (IA)
The function of IA is highlighted within the BAC Report section of this Integrated Annual Report.
APPENDIX 1 - Key Risks Faced by the Group
1. Financial Risk
2017 was a volatile year for certain emerging markets currencies such as the Indonesian Rupiah and Malaysian Ringgit against the US dollar. As a global player with presence across 11 countries, the Group is exposed to these volatilities which could adversely affect the Group’s cash flow and financial performance. The Group has borrowings in foreign currencies and is cognisant of the foreign exchange and interest rates exposures. To mitigate this risk, Axiata Treasury Management Centre has been tasked to oversee and control the Group’s treasury and funding matters, develop hedging strategies which are governed strictly by the treasury policies, taking into consideration current and future outlook of the relevant economies and foreign exchange markets with the ultimate objective of preserving the Group’s profitability and sustainability.
2. Market Risk
The Group’s key markets are predominantly emerging markets which are generally characterised as being economically less developed, prone to economic uncertainties and sensitive towards any changes in developed countries. The new Trump administration and volatile price of oil have have had some significant impact on the global economy. The decision by the Federal Reserve to increase interest rates plus proposed introduction of tax cuts resulted in the outflow of investors’ funds from the Group’s footprint. These developments have affected investor sentiment to the telecom sector in emerging markets. Our OpCos continue to be challenged by stiff price competition with little certainty of possible market consolidation in certain markets. In some markets, overall industry revenue suffered a year on year decline. Cognisant of the risk, it is imperative that the Group takes the necessary measures to drive efficiencies and innovations through investments in new technologies, have in place cost efficiencies, establish strategic ties with ‘Over-the-Top’ (OTT) or other digital product developers in order to create products and services that meets evolving customer needs, increase the Group’s share of customers wallets, retain customers and maintain our profit after tax.
3. Regulatory Risk The telecoms sector where the Group operates is subjected to a
broad range of rules and regulations, put in place by various regulatory bodies. The sector is subjected to high tax rates and significant spectrum acquisition costs in auctions. This is in addition to multiple levies such as service taxes, excise duties and VAT amongst others. In some countries, the Group is faced with prolonged tax litigations often due to lack of judicial precedent while others are challenged with a systematic increase in taxes and more favourable treatment accorded to the domestic operators. Such policies and regulations could disrupt the Group’s business operations and impair its business returns and long term growth prospects. These rules and regulations may also limit our flexibility to respond to market conditions, competition and new technologies. In responding to such a challenging environment, the Group advocates strict compliance, fair and transparent practices of government policies. We have instituted dedicated personnel and resources to constantly monitor all relevant developments and maintain regular contact and a courteous relationship with the governing authorities. We also constantly enhance our process flows to encourage quick and cost-effective responses to changing regulations. The Group has been at the forefront in engaging regulatory officials
in implementing sustainable regulatory regimes which will lead to a development of healthy regimes for the telecoms sector as well as participate in government consultations and industry association events, to foster collaboration and knowledge sharing for best industry policies and practices.
4. Cyber Risk
2017 was a year which saw a high number of high profile cyber attacks which made global headlines and caused millions of financial losses. The increase connectedness of many everyday goods and services via the Internet (digitisation) has meant it is easier for cyber attacks to occur using telecom infrastructure. Such breaches may result in the loss or compromise of sensitive information or interruption to services. The Group considers this as a heightened risk. As the Group relies heavily on information technology, the Group has to protect the privacy of our customers as well as company confidential information stored within our network and systems infrastructure. A successful cyber attack will undermine customers’ confidence in the Group and may materially impact our businesses and tarnish the Group’s reputation. Such breaches are also costly to rectify and could result in criminal or civil action in addition to regulatory penalties. As security underpins our commitment to protecting our customers with reliable connections and keeping their data safe, the Group’s Cyber Security Steering Committee has been at the forefront of safeguarding the Group by ensuring strict compliance with security policies, procedures, and putting in place technologies and tools to minimise the risk of security breaches. preventive, detective and responsive controls are being implemented to minimise risk of a successful attack.
5. Digital Risk
As telco industry continues to digitise, the relevant laws and regulations may not have caught up with the new lines of businesses that sprung up in the digital economy. The local government within the Group footprint are looking to impose OTT regulation which requires OTT players’ compliance hence creating a level playing field for the telco operators. While such regulations are meant to create a level playing field between the OTT players and telco operators, as the Group embraces digital business, it will be affected as well.
The digitisation of functions and processes means that areas previously not regulated by reference to cyber laws may now be subject to these additional regulation. Given the uncertainties and inconsistencies in the legal and regulatory requirements, it is important for the Group to keep pace with different policy initiatives at both national and international levels and expedite the implementation of relevant action plans to ensure compliance and strengthening of cyber security measures to safeguard data security and integrity.
6. Operational Risk
The Group relies on third party vendors in many aspects of our business. Their non-performance will have an impact on the Group’s operations. The telecoms industry is dominated by a handful of vendors which means loss of supply due to a key vendor suffering business failure may significantly affect our core business and operations. One of Axiata Procurement Centre’s key role is to be on the lookout for ways to manage these risks, monitor the performance of the vendors and develop new relationships to reduce such dependencies.
The Group’s operations and assets span across wide geographical locations and hence are subjected to risks of technical failures, partner failures, human errors, wilful acts and natural disasters. Some within our control while others are not. Repeated failures or service outages could disrupt services, resulting in revenue losses, damage to reputation and eventually loss of customers. In some countries, regulators are now levying stiff monetary penalties for poor quality of service. The IT systems are also crucial in running operations, from providing end-to-end customer services to running internal processes such as billing.
Statement on Risk Management and Internal Control

Governance & Audited Financial Statements 2017Governance & Compliance Information
32
The IT architecture changes regularly due to newer versions, upgrades and security patches. Failure to keep the architecture updated may result in a system crash or security breaches. IT connectivity on the other hand can be erratic or unreliable which affects the delivery of services. Cognisant of the risks, the Group continuously address issues such as network congestions, drop calls, upgrades to network coverage, etc., to ensure better quality network and service delivery. Operating procedures with appropriate incident escalation procedures and adequate disaster recovery plans are in place at each OpCo to ensure seamless business continuity. In addition, the Group maintains a global insurance programme to mitigate business losses.
7. Geo Political Risk
The Group operates in footprints that are affected by political instability, civil unrest and other social tensions. Meanwhile, political systems in a few countries remain fragile, resulting in regime uncertainties and in most cases, risk of arbitrary actions. Such conditions, which are beyond the Group’s control, may cause disruption to the business, undermining market sentiment and investor confidence towards the Group. To mitigate this risk, the Group work closely with the respective OpCo Management, leveraging on their local expertise, knowledge and ability to continually assess the changing political scenario and have in place various measures to ensure a timely response in the event of such occurrences. The Group emphasis on maintaining a neutral government relations and contribute to the socio-economic development of these countries through various CSR initiatives, as highlighted in the annual sustainability report.
8. Strategic Risk
Evolution of the telecoms landscape, through the substitution of services by non-traditional OTT service providers, and entry of new operators, including Mobile Virtual Network Operators (MVNOs) has had a profound impact on the telecoms sector. There is a change in customer expectations away from simple connectivity to customers wanting better experience in Internet connection, network quality and competitive tariff rates. Increasingly, the ability to provide compelling digital content and lifestyle applications such as music and mobile money are equally important for mobile users. The entry of new players has also created pricing pressure eroding the Group’s margin. Keeping pace with changing consumer expectations and competitive pricing has become a challenge across most of the key markets the Group operates in. To mitigate this risk, the Group closely monitors the competitive landscape, explores and makes appropriate investments to upgrade its technology and platform and reviews the relevance of its products and services offerings in order to stay in the game. Prudent cost management keeps our budget lean while maintaining strong strategic alliances with network vendors helps us to keep pace with technology shifts.
9. Investment Risk
Venturing into new growth areas remains as one of the Group’s strategic initiatives to create additional revenue streams such as participating in digital and OTT initiatives and investing into new markets and services that rely on connectivity. The Group recognises the risk and repercussions involved in poor investment decisions and the management of these new initiatives post-acquisition. To manage this risk, we have put in place a Mergers and Acquisition Committee that oversees all acquisitions and divestments and at the same time, maintain a robust due diligence process to evaluate and manage the potential risks involved. Post-acquisition, transition teams are put together to ensure that organisational, cultural and mind-set changes that are required are implemented appropriately.
10. People Risk
People are one of the key pillars of success for the Group as it underpins our ability to implement the Group’s strategy and deliver superior services to our customers. We actively seek out people who are able and motivated to live the Group’s values. Nonetheless, hiring the right employee and loss of key talent remain a challenge, especially in the digital economy. Our Talent Management team is on a constant lookout for suitable employees, whilst developing our people through robust talent development programmes, attractive performance based rewards and providing a safe and healthy work environment. The Group advocates staff empowerment to allow for employees to respond to rapidly changing customer demands and work processes. Employee engagement is also critical for the Group as a failure to motivate and keep employees engaged will reduce overall morale, increase attrition and ultimately affect our business.
11. Technology Risk
The Group constantly strives to be at the forefront of both technology and innovation in all our operating regions. Rapid technological advances may result in premature obsolescence of key technology and equipment before the end of their expected useful life. On the other hand, a lag in development and deployment of new technologies may also result in the Group falling behind its competitors. To remain relevant, it is imperative that the Group constantly reviews and refreshes its technology yet maintain financial prudence. The need to constantly spend on capital expenditure in order to stay relevant to our customers means that our capital expenditure intensity remains high. The Group has recently reviewed and revamped its capital expenditure (CAPEX) governance and business planning process, focusing on prudent cost management and capex productivity, whilst increasing Group’s visibility of these expenditure across all OpCos.
12. Governance and Integrity Risk
The Group is driven by our key values of Uncompromising Integrity and Exceptional Performance (UIEP) to ensure high ethical standards and good corporate governance are maintained. We believe that sound corporate governance is a key success factor when conducting business in a global, highly competitive, regulated and changing market. The Group’s Code of Conduct sets out rules and guidelines on how personnel acting for or on behalf of the Group are expected to conduct business. The Group will continue its focus on maintaining and further developing the strong ethical platform and corporate governance standard to support Axiata’s business integrity and continuing strong performance.
Statement on Risk Management and Internal Control
Governance & Audited Financial Statements 2017Governance & Compliance Information
33
Board Audit Committee Report
Summary of the Board Audit Committee’s Key Activities in 2017
During the Financial Year ended 2017 (FY17), the Board Audit Committee (BAC) discharged its functions and carried out its duties as set out in the Terms of Reference (ToR). Key activities undertaken by the BAC include the following:
Risks and Controls
• The Group’s major business risks and remedial actions were reported and deliberated at the BAC each quarter, a summary of which is reported to the Board.
• Four (4) Group Risk Management Committee meetings were held with the Senior Leadership Team (SLT). The Group’s risks were assessed from various control perspectives that included preventive and detective controls.
• Reviewed the Group gearing status and portfolio rebalancing, hedging and forex currency exposure and cash management of the Group.
• Reviewed the salient terms of the Share Purchase Agreement between Axiata and Khazanah in relation to the fund-raising exercise by edotco to raise up to USD700 million.
• Reviewed the proposed acquisition of Webe Target assets ie roof-top tower portfolio/tenancies.
• Reviewed Axiata Digital Services investment portfolio including the accounting impact by asset/portfolio.
• Reviewed the proposed policy on “put option” in mergers and acquisitions (M&A) deals, and recommended to the Board for approval.
• Reviewed and approved the improvement plan for the fraud and investigation function across the Group.
• A Cyber Security Forum initiated by the Cyber Security Steering Committee (CSSC) was held on 2nd May 2017 attended by Operating Companies (OpCo) BAC Chairmen and Senior Management of Axiata and Opcos to discuss the Cyber Strategy as well as progress of improvement initiatives for 2017. This includes the status of improvement initiatives to address the critical issues highlighted in the security review – Cyber Security Posture Assessment (CSPA).
• Axiata BAC Chairman Forum was conducted on 19 September 2017. The top priorities for 2017 was derived from Axiata 3.0 Strategy focusing on operational turnaround initiatives and cost optimisation, new growth areas, functional superiority and digitisation as well as looking for opportunities to Optimise Portfolios and Stakeholder Management while transforming into a Modern, Agile and a Digital organisation. There was also an update on MFRS 9 – Financial Instruments and its impact on the financial statements.
• The BAC Chairman visited Ncell in Nepal to understand the challenges faced by Ncell’s management in operating in a challenging political environment as well as to provide the BAC’s perspective on governance and controls.
• Reviewed and approved the revised Terms of Reference (TOR) of the BAC due to the Malaysian Code on Corporate Governance (MCCG) in 2017 introducing “Step Up” practices (MCCG Step Up 9.3) whereby a Board Risk Management Committee (BRMC) instead of the BAC, will oversee the company’s risk management framework and policies.
• A total of 110 internal audit reviews were completed across the Group.
Other recurring works include:
• Reviewed and recommended the Statement on Corporate Governance, Statement on Risk Management and Internal Control and BAC Report for the Annual Report to the Board for approval.
• Reviewed the financial results quarterly, half yearly and annually prior to the Board for approval.
• Reviewed the accounting impact and accounting entries arising from merger and acquisition deals and revised accounting policies when required.
• Reviewed the potential impairment exposure of major investments.• Reviewed on a quarterly basis the related party transactions entered
into by Axiata pursuant to the shareholders mandate on Recurrent Related Party Transactions (RRPT) procured at the 25th AGM of the Company held on 26 May 2017 and the reporting of these transactions in the 2017 Annual Report.
• During the financial year ended 31 December 2017, Axiata has granted a total of 5,176,700 shares under the Performance-Based Long Term Incentive Plan (details provided under Notes 14 of the Audited Financial Statements) at the Share Reference Price of RM4.43 for 28 February 2017 Regular Stock Purchase (RSP) grant and RM4.83 for 15 August 2017 RSP grant. The BAC has reviewed the allocation of the above shares granted to eligible employees (as defined in the Bye-Laws of the Performance-Based Employee Share Option and Share Scheme) and noted its compliance with the conditions for the allocation of share options/shares as approved.
• Held two (2) private meetings with the external auditors on 12 February 2017 and 28 August 2017 without the presence of management. The topics that were discussed were the sufficiency and adequacy of information provided to external auditors to perform the audit, cooperation provided by the management and key matters noted from audits.
• Reviewed and approved appointment of external auditors, taking into consideration their competencies, commitments, objectivity and independence.
• Reviewed and approved the annual internal audit plan and budget.• Assessed the quality of internal audit staff, experience, discipline and
length of service.• Reviewed 16 business control incidents and identified cases of control
weaknesses including fraud for sharing of lessons learnt within the Group to avoid similar incidents.
• Acknowledged, reviewed and investigated 22 defalcation cases across the Group.
Composition and Meetings
In 2017, the BAC, met six (6) times on 17 January 2017, 22 February 2017, 19 April 2017, 24 May 2017, 28 August 2017 and 22 November 2017. The composition and the attendance record of BAC members are listed below.
Name of Director
Status of Directorship/Qualifications
No. of Meetings Attended
David Lau Nai Pek (Chairman of BAC)
Independent Non-Executive Director
6 out of 6
Datuk Azzat Kamaludin Senior Independent Non-Executive Director
6 out of 6
Kenneth Shen Non-Independent Non-Executive Director
4 out of 6

Governance & Audited Financial Statements 2017Governance & Compliance Information
34
Board Audit Committee Report
Financial Literacy
The BAC is chaired by David Lau Nai Pek, who has more than 30 years’ experience with the Royal Dutch Shell Group, leading financial organisations in various countries. David is also a member of the Malaysian Institute of Accountants and a member of the New Zealand Institute of Chartered Accountants.
Datuk Azzat Kamaludin has spent many years in the BACs and Boards of major companies in Malaysia and internationally.
Kenneth Shen has more than 25 years’ experience in global investment, corporate finance, and mergers and acquisition gained in New York, Hong Kong, Qatar and Malaysia.
Group Internal Audit
The internal audit function is under the purview of Axiata Group Internal Auditors (AGIA) and headed by the Group Chief Internal Auditor (GCIA), who is independent and reports directly to the BAC.
The internal audit reporting structure within the Group has been organised whereby the audit departments of the OpCos report directly to the BAC of the respective OpCo with a dotted reporting line to the GCIA. AGIA has direct control and supervision over internal audit activities in OpCos that do not have an audit function. The GCIA also acts as the secretary to the BAC and CSSC and attends Opco BAC meetings.
AGIA provides independent, objective assurance on areas of operations reviewed, and makes recommendations to improve and add value to the Group. AGIA identifies, coordinates and conducts global audits that are carried out throughout the Group and also provides standards, policies, guidelines and advice to the OpCos’ audit function to standardise the internal audit activities within the Group.
AGIA adopts a systematic and disciplined approach to evaluate the adequacy and effectiveness of risk management, financial, operational, compliance and governance processes. Structured risk-based and strategic based approaches are adopted in identifying internal audit activities that are aligned with the Group’s strategic plans to ensure that the risks facing the Group are adequately reviewed.
In addition, international standards and best practices are adopted to further enhance the relevancy and effectiveness of the internal audit activities. The areas of coverage include finance, sales, marketing, information and technology, billing, network, corporate governance, human resources, customer service, digital services and procurement. The audit reports of these assignments provide independent and objective assessment of the following:
• the adequacy, effectiveness and efficiency of the internal control systems to manage operations and safeguard the Group’s assets and shareholders’ value; and
• the adequacy and effectiveness of the risk management operations, governance and compliance functions to identify, manage and address potential risks facing the Group
The internal audit reports are issued to management for their comments and to agree on action plans with deadlines to complete the necessary preventive and corrective actions. The reports are tabled at each OpCo’s BAC and the summary of the key findings are presented to the BAC for due deliberation to ensure that management undertakes to carry out the agreed remedial actions. Members of management are invited to the BAC meetings from time to time, especially when major control weaknesses are highlighted by Internal Audit.
Key audits and reviews completed in 2017 were:
• Retail outlets• Axiata Regulatory Compliance Framework • Salary Payment Process• Procure to Pay – Limits of Authority• Personal Data Protection Act compliance• Treasury Management• Managed services effectiveness• Cyber Security Awareness and Accountability
The total cost incurred by AGIA in 2017, inclusive of all OpCos, was RM13.1 million. There are a total of 63 internal auditors across the Group whilst AGIA at Corporate Centre has six approved headcount and operates on a resource sharing basis with other OpCos’ Internal Audit Divisions. All the internal auditors have tertiary qualifications and the level of expertise and professionalism within AGIA at the end of 2017 is as follows:
Expertise Category Percentage of total auditors
Finance 30%
IT/MIS 24%
Network/ Engineering 13%
Marketing 14%
General/Others 19%
Professional Category Percentage of total auditors
Professional Certification
• CPA, ACCA, CA, CIMA 27%
• CIA 6%
• Certified IS Auditor 25%
• Institute of Internal Auditors Membership
14%
• Others 57%
Post Graduate
MBA and Masters 44%

Governance & Audited Financial Statements 2017Governance & Compliance Information
35
Commitment to Customer Privacy and Data Protection
As Axiata embarks on its journey towards becoming a New Generation Digital Champion, we remain committed to respecting and protecting the data and privacy of approximately 350 million customers throughout our regional footprint of 11 countries across Asia, with a high level of cybersecurity
standards.
We are cognisant of the sensitivity of our customers’ information, which includes their personal information and communications, locations and their use of the Internet and digital applications.
As the world becomes increasingly digitalised, with mobile technologies a crucial communications enabler in our lives and businesses emphasis on data privacy and security measures is becoming increasingly more significant. Primary concerns centre on the complexity of advanced technologies, threats from hackers and the potential for human error, all of which can lead to the loss, deletion or misappropriation of information.
We intend to inspire digital trust and confidence in our customers through robust data privacy and security policies, frameworks and management, which will be based on our values of Uncompromising Integrity and Exceptional Performance (UI.EP). Our aim is to enhance our customer experience by ensuring the confidentiality of our customers’ personal and business communications by respecting their choice and preferences, whilst keeping their information secure through various controls.
To maintain the digital confidence of our customers we will be implementing initiatives which will broadly cover a number of areas within the Group. These include how we process and protect personal data; maintain a cross-functional Privacy Team; detect and report non-conformities; and create an organisational and employee culture founded on a clear understanding of the importance of protecting and respecting our customers’ information.
In 2017, we acknowledged privacy and security issues as an important element in our business processes. Understanding the need to maintain a very high level of compliance in this area, we identified a cross-functional privacy taskforce and identified several action items to reinforce our commitment to upholding privacy and security across the Group. Among these actions are to ascertain consumers’ expectations for privacy and security in the markets we operate in, and draft a Group Privacy Framework that will conform to international best practices.
A new Group Privacy Framework will encapsulate Axiata’s beliefs on Data Privacy and Cybersecurity and will have the key overarching objective of encouraging business practices and standards that enable innovation while respecting and protecting privacy through providing meaningful transparency, notice, choice and control for customers over the use of their personal information. These actions were developed and initiated across our Operating Companies (OpCos) and the Group in 2017 and will continue into 2018.
We implemented the Axiata Regulatory Compliance Framework in 2015 as an integral part of our Corporate Governance Framework which provides the Board of Directors oversight of Axiata’s regulatory compliance performance. Its objective is to set baseline expectations in all OpCos in relation to Regulatory Compliance, placing Axiata and our OpCos in the best position of compliance with regards to regulatory obligations. It also assists the Group to manage exposure to unacceptable compliance risks, and ensure compliance with regulatory authorities.
Within each of our OpCos, compliance with national laws and regulations are a vital core of our OpCos’ Data and Privacy Policies. In Malaysia, we have set our commitment to privacy and security based on the Personal Data Protection Act (PDPA) 2010 and the information security standard ISO 27000.
Axiata Group’s implementation and execution of our Group wide data privacy actions and measures will be based on four fundamental pillars: 1. Personal Data Security
To protect our customers from the threat of hackers and potential human error, we will utilise a mix of IT system security and periodic data security audits to secure the personal data of our customers. We will also adopt a formal Data Retention Policy to determine when data is to be deleted, once the data is no longer required for its original purpose.
Where the data processing function is subcontracted to a vendor or supplier for third party processing and/or cross border transfers, we will explain our processes to our customers to ensure they clearly understand our actions and intentions. For third parties with access to Axiata systems or the personal data of our customers, we will ensure that they are contractually bound to maintain Axiata’s data security and privacy protocols, where subcontractors will be expected to provide data security levels which are on par with, if not higher than, Axiata’s standards.
2. Personal Data Privacy
To ensure that our customers are aware of how and why we intend to process their personal data, we will provide all our customers with choice and control over the use of their personal data in accordance to prevailing laws and obligations as described in our operating licenses and approvals.
In creating new value through innovative services for today’s digital-savvy consumer, we will do so by using techniques to process data where it is not possible to identify specific customers; and/or provide notice or ask for our customers’ consent if otherwise. This is essential for the purpose of meeting legitimate business purposes to deliver, provision, maintain or develop new innovative apps and services.
3. Support for Law Enforcement
Mobile telecommunications information is playing an increasingly important role in activities related to national surveillance and support for law enforcement.
As a responsible Group, we will comply with local law enforcement and national security requirements and will respond to requests from authorities as stipulated within laws and regulations.
4. Information Technology (IT)
A key strategy employed by our OpCos is IT modernisation and digital enablement to give rise to a superior customer experience for our 350 million customers throughout Asia. In line within this, all our OpCos across the region are focusing on implementing various related initiatives to meet evolving business requirements and achieving competitive positioning for our Group. These include developing and inducting the Digital IT Stack to digitize business processes, application rationalisation, enhancing the Application Programme Interface (API) strategy, and modernising Business Support Systems (BSS) and Operations Support Systems (OSS).
Cybersecurity is an essential component of our digital strategy and risk mitigation. In 2016, Axiata’s Cyber Security Operations Center (CSOC) was established across the majority of our OpCos to improve incident monitoring capability. In addition, we continue to relentlessly focus on strengthening our cybersecurity resilience through various initiatives such as periodic cybersecurity posture assessments (CSPA). Another critical area is business continuity and we are sustaining our focus and investments to ensure in effective disaster recovery for key IT systems.
Governance & Audited Financial Statements 2017Governance & Compliance Information
36
Additional Compliance Information
1. NON-AUDIT FEES [Disclosed in accordance with Appendix 9C, Part A item 18, Main LR]
The amount of non-audit fees incurred for the services rendered to Axiata and the Group by its external auditors, PricewaterhouseCoopers PLT and its affiliated companies for the FY17 are RM4,795,526 and RM18,771,646 respectively.
Services rendered by PricewaterhouseCoopers PLT are not prohibited by regulatory and other professional requirements, and are based on globally practiced guidelines on auditors independence. PricewaterhouseCoopers PLT was engaged in these services when their expertise and experience of Axiata are important. It is also the Group’s policy to use the auditors in cases where their knowledge of the Group means it is neither efficient nor cost effective to employ another firm of accountants.
2. MATERIAL CONTRACTS INVOLVING DIRECTORS’ / MAJOR SHAREHOLDERS’ INTEREST [Disclosed in accordance with Appendix 9C, Part A item 21, Main LR]
There were no material contracts of Axiata and/or its subsidiaries, involving the interest of the directors, chief executive who is not a director or and major shareholders either subsisting as at 31 December 2017 or entered into since the end of FY16 except the material contracts between Axiata and its major shareholder subsisting as at 31 December 2017 as follows:-
• Share Purchase Agreement between Axiata and Mount Bintang Ventures Sdn Bhd (“MBVSB”), a wholly-owned subsidiary of Khazanah Nasional Berhad ("Khazanah") dated 18 January 2017 for the purchase by MBVSB of 273,269,624 Ordinary shares of RM1.00 each in edotco Group Sdn Bhd ("edotco") at a cash consideration of USD200.0 million (equivalent to RM899.10 million).
• Shareholders Agreement between Axiata, MBVSB, Innovation Network Corporation of Japan and edotco dated 18 January 2017 as amended by the Deed of Accession and Amendment dated 18 April 2017 to govern their relationships as shareholders of edotco.
3. UTILISATION OF PROCEEDS [Disclosed in accordance with Appendix 9C, Part A item 13, Main LR]
(a) The utilisation of proceeds relating to Share Purchase Agreement between Axiata and MBVSB, as stated above, were used to pare down short term debt.
(b) Disposal of 10.00% equity interest in Axiata (Cambodia) Holdings Limited was completed on 1 June 2017 for a total cash consideration of USD66.0
million (RM285.7 million) and the proceeds were utilised to pare down short term debt.
4. PERFORMANCE-BASED EMPLOYEE SHARE OPTION AND SHARE SCHEME AND AXIATA GROUP PERFORMANCE-BASED LONG TERM INCENTIVE PLAN [Disclosed in accordance with Appendix 9C, Part A item 27, Main LR]
(a) PERFORMANCE-BASED EMPLOYEE SHARE OPTION AND SHARE SCHEME
The Performance-Based ESOS was approved by the shareholders of Axiata at an Extraordinary General Meeting held on 24 March 2009 and implemented on 16 April 2009. On 1 June 2011, Axiata’s shareholders had, at the 19th AGM, approved the amendments to the Bye-Laws of the Axiata Share Scheme (Bye-Laws) to include a Restricted Share Plan ("RSP") and the same took effect from 15 July 2011. From thereon, Axiata started to offer Eligible Employees the entitlement to receive Restricted Share Award ("RSA") instead of ESOS Options.
Information on the Axiata Share Scheme as set out in Note 14(a) of the Audited Financial Statements for FY17 is as follows:-
ESOS Options/RSA granted, vested, exercised and outstanding since the implementation of Axiata Share Scheme until FY17:-
• Total Number of ESOS Options/RSA granted: 186,908,000 ESOS Options and 64,148,300 RSA. • The ESOS Options and RSA granted shall be vested only upon the fulfilment of certain performance criteria by Axiata and individuals as at
vesting date. Senior and top management can only vest the RSA at the end of the third year, with potential multiplier effect on the number of shares to be granted.
• Total Number of RSA vested: 35,887,050 RSA. • Total Number of ESOS Options exercised: 143,482,346 ESOS Options.• Total number of ESOS Options/RSA outstanding: 20,987,326 ESOS Options, 23,675,050 RSA.
As provided below, with the exception of Tan Sri Jamaludin Ibrahim ("Tan Sri Jamaludin"), Managing Director/President & Group Chief Executive Officer of Axiata, none of the Directors of Axiata have been granted ESOS Options or RSA:-
Granted Adjusted Exercised/Vested Outstanding
ESOS Options RSA RSA1 ESOS Options RSA ESOS Options RSA2
Tan Sri Jamaludin 4,301,700 1,716,700 489,200 1,146,900 946,500 3,154,800 1,259,400
Note :
1 Adjusted refer to the additional number of shares vested due to multiplier effects or pro-rated shares offered at the time of vesting.2 The number of RSP shares that may vest is 1,259,400 provided that the performance targets for vesting are met. If not met, the amount could be nil
or a portion of the amount. However, if the super stretched individual performance targets and the Group's superior company performance targets at
the point of vesting are met, up to 6,757,000 Axiata Shares may be vested to Tan Sri Jamaludin.
In accordance with the Bye-Laws, not more than 50% of the Company’s new ordinary shares made available under the Axiata Share Scheme shall be allocated,
in aggregate to Eligible Employees who are Executive Directors of the Company or any corporation within the Group or who are Senior Management. For the
FY17, the actual percentage of options/shares granted to them was 23.2% of the total number of options/shares granted.

Governance & Audited Financial Statements 2017Governance & Compliance Information
37
Additional Compliance Information
(b) AXIATA GROUP PERFORMANCE-BASED LONG TERM INCENTIVE PLAN (PBLTIP)
On 25 May 2016, the shareholders of Axiata approved Axiata Group PBLTIP and the plan was implemented on 30 September 2016.
Information on the Axiata Group PBLTIP as set out in Note 14(b) of the Audited Financial Statements for FY17 is as follows:-
PBLTIP granted, vested, exercised and outstanding since the implementation of Axiata Share Scheme until FY17:-
• Total Number of PBLTIP granted: 5,176,700
The PBLTIP granted shall be vested only upon the fulfilment of certain performance criteria by Axiata and individuals as at vesting date with potential multiplier effect
on the number of shares to be granted.
• Total Number of PBLTIP vested: Nil
• Total number of PBLTIP outstanding: 5,125,700
As provided below, with the exception of Tan Sri Jamaludin, none of the Directors of Axiata have been granted PBLTIP:-
Granted Adjusted Vested Outstanding3
Tan Sri Jamaludin 670,100 - - 670,100
Note :
3 The number of PBLTIP shares that may vest is 670,100 provided that the performance targets for vesting are met. If not met, the amount could be nil or a
portion of the amount. However, if the super stretched individual performance targets and the Group's superior company performance targets at the point of
vesting are met, up to 4,020,600 Axiata Shares may be vested to Tan Sri Jamaludin.
5. Recurrent Related Party Transactions of Revenue in Nature (RRPT) [Disclosed in accordance with paragraph 10.09 (1) (b) and paragraph 3.1.5 of Practice Note 12, Main LR]
At the last AGM held on 26 May 2017, Axiata has obtained a general mandate from its shareholders for the Group to enter into RRPT with related parties as set out
in the Circular to Shareholders dated 27 April 2017 (RRPT Mandate). This RRPT Mandate is valid until the conclusion of Axiata’s forthcoming 26th AGM to be held on
23 May 2018 (26th AGM).
Axiata proposes to seek a new RRPT Mandate at its forthcoming 26th AGM (Proposed Shareholders’ Mandate). The Proposed Shareholders’ Mandate, details as
provided in the Circular to Shareholders dated 24 April 2018 sent together with the Annual Report 2017, if approved by the shareholders, would be valid until the
conclusion of Axiata’s next AGM.
Pursuant to paragraph 10.09 (2) (b) and paragraph 3.1.5 of Practice Note 12 of the Main LR, details of RRPT entered into during FY17 under the RRPT Mandate are as
follows:-

Governance & Audited Financial Statements 2017Governance & Compliance Information
38
TransactingCompanies
Transacting Related Parties
Interested Major Shareholder/Director Nature of Transaction
Value of Transactions
RM’000
Axiata Group Berhad and/or its subsidiaries ("Axiata Group")
Telekom Malaysia Berhad and/or its subsidiaries (TM Group)
- Khazanah, - Tan Sri Datuk
Wira Azman Hj Mokhtar
- Tengku Dato’ Sri Azmil Zahruddin Raja Abdul Aziz
REVENUETelecommunication and related services- Interconnect payment from TM Group- Leased-line payment from TM Group- Voice Over Internet Protocol related services revenue from TM Group- Dark fibre and leased line from Celcom Axiata Berhad and/or its
subsidiaries ("Celcom Group") to Fibrecomm Network (M) Sdn Bhd- Leased-line from Celcom Group to Fiberail Sdn Bhd - Transmission revenue on the services by Axiata Group to TM- Site rental payable for telecommunication infrastructure, equipment
and related charges by TM Group to Axiata Group- Domestic Roaming Revenue
16,6851,810
532671
4783,683
20,165
210,750
COSTSTelecommunication and related services- Interconnect cost to TM Group- Voice Over Internet Protocol related services by TM Group to Axiata
Group- Leased-line related costs to TM Group- Provision of data and bandwidth related services by TM Group to
Axiata Group- Internet access and broadband charges by TM Group to Celcom
Group- Provision of contact centre and business process outsourcing services
by VADS Berhad to Axiata Group- Leasing of fibre optic core and provision of bandwidth services from
Fiberail Sdn Bhd to Celcom Group- Purchase of dark fibre, bandwidth, space and facility from Fibrecomm
Network (M) Sdn Bhd by Celcom Group
17,3984,267
7,31639,846
0
23,207
823
1,076
Non-telecommunications Services- Site rental payable for telecommunication infrastructure, equipment
and related charges by Axiata Group to TM Group - Rental of office premises payable monthly by Axiata Group to TM
27,829
15,720
TOTAL 392,255
6. STATUS OF LEGALISATION OF OUTDOOR STRUCTURES [Disclosed in accordance with letter from SC dated 12 February 2014]
Pursuant to the approval from Securities Commission Malaysia (SC) in 2008 in relation to, amongst others, TM Group’s demerger and the listing of Axiata, Axiata is required to obtain the relevant approvals for the transmission towers and rooftop sites (Outdoor Structures) of Celcom Group within two years from the date of the SC’s approval letter (Timing Conditions).
SC had, in 2010 and 2012, granted an extension of time for Axiata to comply with the Timing Conditions until 29 January 2012 and 29 January 2014 respectively.
Following the application submitted by CIMB Investment Bank Berhad, on behalf of Axiata, for further extension of time for the legalisation of the remaining 28 Outdoor Structures, SC had, via their letter dated 12 February 2014, granted an exemption to Axiata from complying with the Timing Conditions, subject to, amongst others, Axiata disclosing the status of the legalisation in its Annual Report until such time the necessary approvals are obtained.
As at 31 March 2018, 20 Outdoor Structures remained to be legalised. Applications for legalisation of 1 site was rejected by the local authority while 7 sites with revised resubmission in progress. Legalisation of the remaining 12 sites were put on hold due to exclusivity issue.
Additional Compliance Information

Go
ve
rna
nce
& A
ud
ited
Fin
an
cial S
tate
me
nts 2
017
Au
dite
d F
ina
ncia
l Sta
tem
en
ts
39
Co
mm
itme
nt to C
ustom
er P
rivacy and
Data P
rote
ction
Ind
on
es
ia -
Da
ro B
aro
Governance & Audited Financial Statements 2017Audited Financial Statements
40
Directors’ Responsibility Statement
The Directors are required by the Companies Act 2016 to prepare financial statements for each financial year which have been made out in accordance with Malaysian Financial Reporting Standards, International Financial Reporting Standards and the requirements of the Companies Act 2016 so as to exhibit a true and fair view of the financial position of the Group and of the Company as of 31 December 2017 and of their financial performance and cash flows for the financial year then ended.
In preparing the financial statements, the Directors have:
• Selected and applied the appropriate and relevant accounting policies on a consistent basis;
• Made judgments and accounting estimates that are reasonable and prudent in the circumstances; and
• Prepared the annual audited financial statements on a going concern basis.
The Directors are responsible to ensure that the Group and the Company keep accounting records which disclose with reasonable accuracy the financial position of the Group and the Company.
The Directors also have the overall responsibilities to take such steps to safeguard the assets of the Group and for the establishment, designation, implementation and maintenance of appropriate accounting and internal control systems for the prevention and detection of fraud and other irregularities relevant to the preparation and fair presentation of financial statements that are free from material misstatement, whether due to fraud or error.
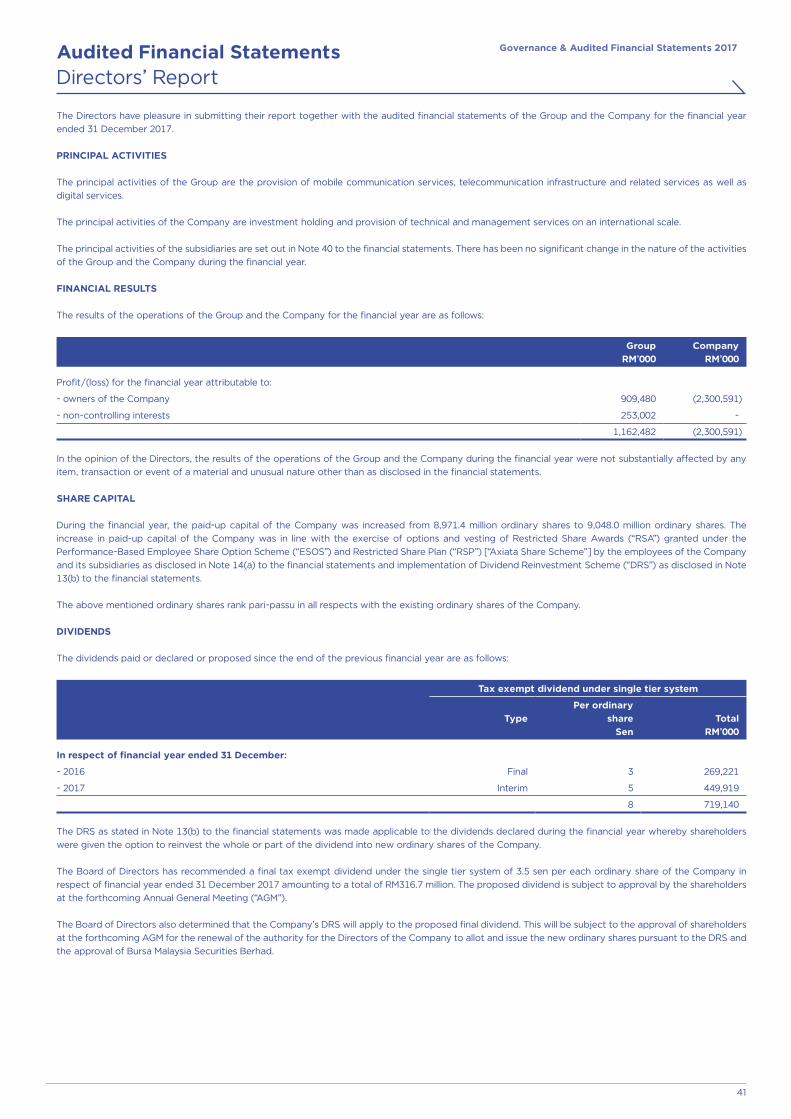
Governance & Audited Financial Statements 2017Audited Financial Statements
41
Directors’ Report
The Directors have pleasure in submitting their report together with the audited financial statements of the Group and the Company for the financial year ended 31 December 2017.
PRINCIPAL ACTIVITIES
The principal activities of the Group are the provision of mobile communication services, telecommunication infrastructure and related services as well as digital services.
The principal activities of the Company are investment holding and provision of technical and management services on an international scale.
The principal activities of the subsidiaries are set out in Note 40 to the financial statements. There has been no significant change in the nature of the activities of the Group and the Company during the financial year.
FINANCIAL RESULTS
The results of the operations of the Group and the Company for the financial year are as follows:
GroupRM’000
CompanyRM’000
Profit/(loss) for the financial year attributable to:
- owners of the Company 909,480 (2,300,591)
- non-controlling interests 253,002 -
1,162,482 (2,300,591)
In the opinion of the Directors, the results of the operations of the Group and the Company during the financial year were not substantially affected by any item, transaction or event of a material and unusual nature other than as disclosed in the financial statements.
SHARE CAPITAL
During the financial year, the paid-up capital of the Company was increased from 8,971.4 million ordinary shares to 9,048.0 million ordinary shares. The increase in paid-up capital of the Company was in line with the exercise of options and vesting of Restricted Share Awards (“RSA”) granted under the Performance-Based Employee Share Option Scheme (“ESOS”) and Restricted Share Plan (“RSP”) [“Axiata Share Scheme”] by the employees of the Company and its subsidiaries as disclosed in Note 14(a) to the financial statements and implementation of Dividend Reinvestment Scheme (“DRS”) as disclosed in Note 13(b) to the financial statements.
The above mentioned ordinary shares rank pari-passu in all respects with the existing ordinary shares of the Company.
DIVIDENDS
The dividends paid or declared or proposed since the end of the previous financial year are as follows:
Tax exempt dividend under single tier system
Type Per ordinary
share Sen
TotalRM’000
In respect of financial year ended 31 December:
- 2016 Final 3 269,221
- 2017 Interim 5 449,919
8 719,140
The DRS as stated in Note 13(b) to the financial statements was made applicable to the dividends declared during the financial year whereby shareholders were given the option to reinvest the whole or part of the dividend into new ordinary shares of the Company.
The Board of Directors has recommended a final tax exempt dividend under the single tier system of 3.5 sen per each ordinary share of the Company in respect of financial year ended 31 December 2017 amounting to a total of RM316.7 million. The proposed dividend is subject to approval by the shareholders at the forthcoming Annual General Meeting (“AGM”).
The Board of Directors also determined that the Company’s DRS will apply to the proposed final dividend. This will be subject to the approval of shareholders at the forthcoming AGM for the renewal of the authority for the Directors of the Company to allot and issue the new ordinary shares pursuant to the DRS and the approval of Bursa Malaysia Securities Berhad.

Governance & Audited Financial Statements 2017Audited Financial Statements
42
Directors’ Report
RESERVES AND PROVISIONS
All material transfers to or from reserves or provisions during the financial year have been disclosed in the financial statements.
AXIATA SHARE SCHEME AND AXIATA GROUP PERFORMANCE BASED LONG TERM INCENTIVE PLAN (“Axiata PBLTIP”)
The Performance-Based ESOS of the Company was approved by its shareholders at an Extraordinary General Meeting (“EGM”) held on 24 March 2009. The Performance Based ESOS was implemented on 16 April 2009.
On 1 June 2011, the Company’s shareholders had, at the Nineteenth (19th) AGM of the Company, approved the amendments to the Bye-Laws of the ESOS to include a RSP. Accordingly, the existing Performance-Based ESOS was renamed as Axiata Share Scheme.
Effective from 15 July 2011, the Company implemented the Axiata Share Scheme and started to offer eligible employees the entitlement to receive RSA under the RSP in the Company on 18 July 2011 instead of ESOS.
On 25 May 2016, shareholders of the Company approved Axiata PBLTIP and the plan was implemented on 30 September 2016.
Details of the Axiata Share Scheme and Axiata PBLTIP are disclosed in Note 14(a) and (b) to the financial statements.
DIRECTORS
The Directors in office during the financial year and during the period from the end of the financial year to the date of the report are:
Tan Sri Datuk Wira Azman Hj. MokhtarTan Sri Jamaludin IbrahimTan Sri Ghazzali Sheikh Abdul KhalidDatuk Azzat KamaludinDavid Lau Nai PekDr Muhamad Chatib BasriDato’ Mohd Izzaddin Idris Dato Dr Nik Ramlah Mahmood Appointed on 21 March 2017Dr David Robert Dean Appointed on 11 December 2017Tengku Dato’ Sri Azmil Zahruddin Raja Abdul Aziz Appointed on 12 January 2018Bella Ann Almeida Resigned on 25 May 2017Kenneth Shen Resigned on 12 January 2018
The names of Directors of subsidiaries are set out in the respective subsidiaries’ statutory accounts and the said information is deemed incorporated herein by such reference and made part thereof. In accordance with Article 93 of the Company’s Article of Association, Tan Sri Datuk Wira Azman Hj. Mokhtar and David Lau Nai Pek retire from the Board at the Twenty-six (26th) AGM and being eligible, offer themselves for re-election.
In accordance with Article 93 of the Company’s Article of Association, Datuk Azzat Kamaludin retires from the Board at the 26th AGM and does not offer himself for re-election.
In accordance with Article 99(ii) of the Company’s Article of Association, Dr David Robert Dean and Tengku Dato’ Sri Azmil Zahruddin Raja Abdul Aziz retire from the Board at the 26th AGM and being eligible, offer themselves for re-election.
DIRECTORS’ INTERESTS
According to the Register of Directors’ Shareholdings required to be kept under Section 59 of the Companies Act 2016, none of the Directors who held office at the end of the financial year held any shares or debentures in the Company or its subsidiaries during the financial year except as follows:
Number of ordinary shares of the Company
As at1.1.2017 Additions* Disposed
As at31.12.2017
Indirect interest
Tan Sri Jamaludin Ibrahim 2,577,025 165,305* - 2,742,3301
1 Shares held under CIMSEC Nominees (Tempatan) Sdn Bhd for CIMB Commerce Trustee Berhad, a trustee of discretionary trust and the beneficiaries of which are members of the family of Tan Sri Jamaludin Ibrahim subject to the terms of such discretionary trust.
* Additions during the financial year arose from:a) Vesting of RSA special grant of 118,800 shares;b) Allotment of 17,207 shares pursuant to DRS on final dividend for the financial year ended 31 December 2016; c) Allotment of 29,298 shares pursuant to DRS on interim dividend for the financial year ended 31 December 2017.

Governance & Audited Financial Statements 2017Audited Financial Statements
43
Directors’ Report
DIRECTORS’ INTERESTS (CONTINUED)
Number of options/shares over ordinary shares of the Company
As at1.1.2017 Granted Adjusted
Exercised/vested
As at31.12.2017
Tan Sri Jamaludin Ibrahim2
Axiata Share Scheme:
- ESOS 3 3,154,800 - - - 3,154,800
- RSA 4 1,219,800 - - - 1,219,800
- RSA (special Grant) 158,400 - - (118,800) 39,600
Axiata PBLTIP:
- RSA 5 - 670,100 - - 670,100
2 At the EGM held on 24 March 2009, the shareholders of the Company approved the grant of options to Tan Sri Jamaludin Ibrahim to subscribe up to 5.5 million new ordinary shares of the Company to be issued under the Performance-Based ESOS for the Executive Directors and eligible employees of the Group.
Further to the above, the shareholders of the Company had at the Nineteenth (19th) AGM held on 1 June 2011, approved the grant of entitlement, allotment and issuance of the remaining 1,198,300 new ordinary shares of the Company to Tan Sri Jamaludin Ibrahim, under the new Axiata Share Scheme as approved at the said EGM.
Subsequently, the shareholders of the Company at the Twenty-first (21st) AGM held on 23 May 2013, approved the grant entitlements, allotment and issuance of up to 3.6 million new ordinary shares of the Company to Tan Sri Jamaludin Ibrahim under the Axiata Share Scheme.
3 3,154,800 options of Axiata Shares pursuant to Performance-Based ESOS.
4 The number of Axiata RSP shares that may vest is 1,219,800 provided that the performance targets for vesting are met. Otherwise, the amount of shares that may vest may be a portion of the full amount or nil. However, if the super stretched individual performance targets and Axiata Group superior company performance targets at the point of vesting are met, up to 6,757,000 ordinary shares of the Company may be vested.
5 The number of Axiata PBLTIP shares that may vest is 670,100 provided that the performance targets for vesting are met. Otherwise, the amount of shares that may vest may be a portion of the full amount or nil. However, if the super stretched individual performance targets and Axiata Group superior company performance targets at the point of vesting are met, up to 4,020,600 ordinary shares of the Company may be vested.
Other than as disclosed above, in accordance with the Register of Directors’ Shareholdings, none of the other Directors in office at the end of the financial year have any direct or indirect interest in any shares and options over ordinary shares in the Company or its related corporations during the financial year.
DIRECTORS’ BENEFITS
Since the end of the previous financial year, no Director has received or become entitled to receive a benefit (except for the Directors’ fees, remuneration and other emoluments as disclosed in Note 7(d) to the financial statements) by reason of a contract made by the Company or by a related corporation with the Director or with a firm of which the Director is a member, or with a company in which the Director has a substantial financial interest.
Neither during nor at the end of the financial year was the company or any of its subsidiaries a party to any arrangements whose object was to enable the Directors to acquire benefits by means of the acquisition of shares in, or debentures of the Company or any other body corporate other than the Axiata Share Scheme and Axiata PBLTIP of the Company, details as disclosed in Notes 14(a) and 14(b) to the financial statements.
DIRECTORS’ REMUNERATION
The Directors’ remuneration of the Company for the financial year ended 31 December 2017 is disclosed in Note 7(d) to the financial statements.
OTHER STATUTORY INFORMATION
Before the financial statements of the Group and the Company were prepared, the Directors took reasonable steps:
(a) to ascertain that proper action had been taken in relation to the writing off of bad debts and the making of provision for doubtful debts and have satisfied themselves that all known bad debts had been written off and that adequate provision had been made for doubtful debts; and
(b) to ensure that any current assets which were unlikely to be realised in the ordinary course of business including values of current assets as shown in the accounting records of the Group and of the Company had been written down to an amount which the current assets might be expected so to realise.
At the date of this report, the Directors are not aware of any circumstances:
(a) which would render the amounts written off for bad debts or the amount of the provision for doubtful debts in the financial statements of the Group and the Company inadequate to any substantial extent; or

Governance & Audited Financial Statements 2017Audited Financial Statements
44
Directors’ Report
OTHER STATUTORY INFORMATION (CONTINUED)
(b) which would render the values attributed to current assets in the financial statements of the Group and the Company misleading; or
(c) which have arisen which render adherence to the existing method of valuation of assets or liabilities of the Group and the Company misleading or inappropriate.
No contingent or other liability of the Group and Company has become enforceable or is likely to become enforceable within the period of twelve (12) months after the end of the financial year which, in the opinion of the Directors, will or may affect the ability of the Group and the Company to meet its obligations when they fall due.
At the date of this report, there does not exist:
(a) any charge on the assets of the Group and the Company which has arisen since the end of the year which secures the liability of any other person; or
(b) any contingent liability of the Group and the Company which has arisen since the end of the year.
At the date of this report, the Directors are not aware of any circumstances not otherwise dealt with in this report or the financial statements of the Group and the Company, which would render any amount stated in the financial statements misleading.
In the opinion of the Directors:
(a) the results of the Group’s and the Company’s operations during the financial year were not substantially affected by any item, transaction or event of a material and unusual nature other than as disclosed in the financial statements; and
(b) there has not arisen in the interval between the end of the financial year and the date of this report any item, transaction or event of a material and unusual nature likely to affect substantially the results of the operations of the Group and the Company for the financial year in which this report is made.
AUDITORS REMUNERATION
The details of auditors’ remuneration is disclosed in Note 7(b) to the financial statements.
INDEMNITY AND INSURANCE FOR DIRECTORS AND OFFICERS
The Company maintains a corporate liability insurance for the Directors and officers of the Group throughout the financial year, which provides appropriate insurance cover for the Directors and officers of the Group. The total amount of insurance premium paid by the Company during the financial year amounted to RM230,000.
AUDITORS
The auditors, PricewaterhouseCoopers PLT (LLP0014401-LCA & AF 1146), have expressed their willingness to accept re-appointment as auditors.
PricewaterhouseCoopers PLT (LLP0014401-LCA & AF 1146) was registered on 2 January 2018 and with effect from that date, PricewaterhouseCoopers (AF 1146), a conventional partnership was converted to a limited liability partnership.
This report was approved by the Board of Directors on 22 February 2018. Signed on behalf of the Board of Directors:
TAN SRI DATUK WIRA AZMAN HJ. MOKHTAR TAN SRI JAMALUDIN IBRAHIMDIRECTOR DIRECTOR
Kuala Lumpur
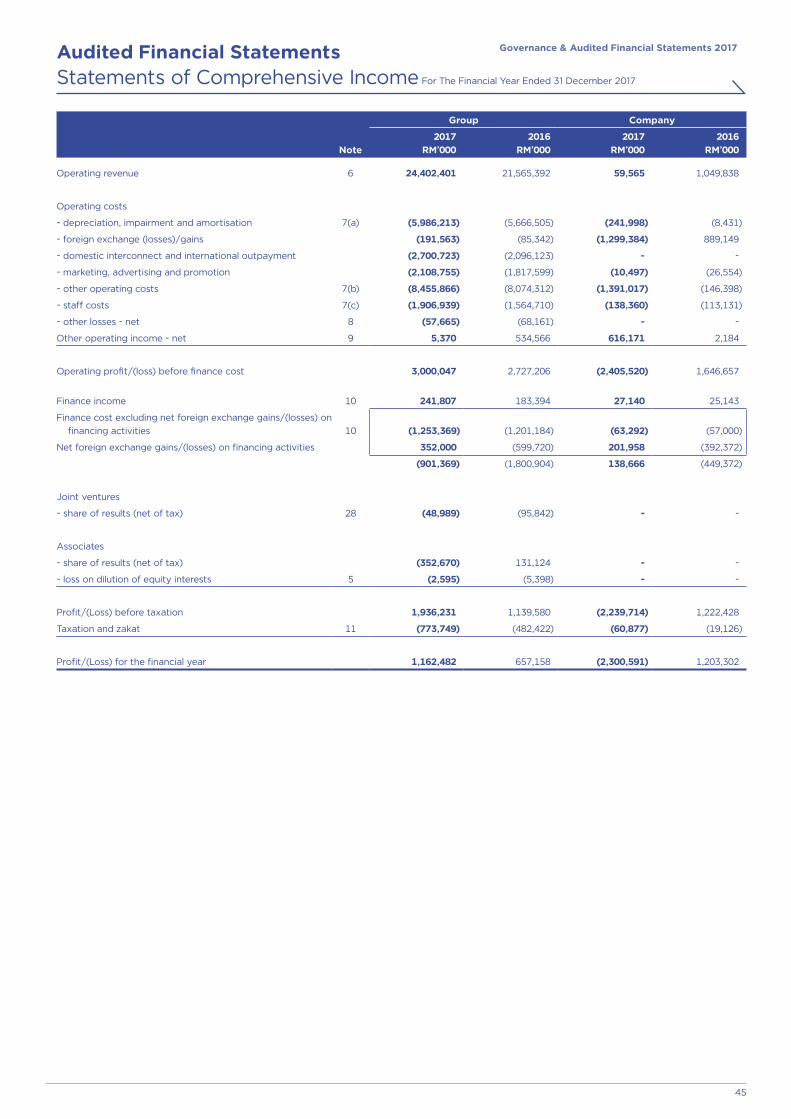
Governance & Audited Financial Statements 2017Audited Financial Statements
45
Statements of Comprehensive Income For The Financial Year Ended 31 December 2017
Group Company
Note2017
RM’0002016
RM’0002017
RM’0002016
RM’000
Operating revenue 6 24,402,401 21,565,392 59,565 1,049,838
Operating costs
- depreciation, impairment and amortisation 7(a) (5,986,213) (5,666,505) (241,998) (8,431)
- foreign exchange (losses)/gains (191,563) (85,342) (1,299,384) 889,149
- domestic interconnect and international outpayment (2,700,723) (2,096,123) - -
- marketing, advertising and promotion (2,108,755) (1,817,599) (10,497) (26,554)
- other operating costs 7(b) (8,455,866) (8,074,312) (1,391,017) (146,398)
- staff costs 7(c) (1,906,939) (1,564,710) (138,360) (113,131)
- other losses - net 8 (57,665) (68,161) - -
Other operating income - net 9 5,370 534,566 616,171 2,184
Operating profit/(loss) before finance cost 3,000,047 2,727,206 (2,405,520) 1,646,657
Finance income 10 241,807 183,394 27,140 25,143
Finance cost excluding net foreign exchange gains/(losses) on financing activities 10 (1,253,369) (1,201,184) (63,292) (57,000)
Net foreign exchange gains/(losses) on financing activities 352,000 (599,720) 201,958 (392,372)
(901,369) (1,800,904) 138,666 (449,372)
Joint ventures
- share of results (net of tax) 28 (48,989) (95,842) - -
Associates
- share of results (net of tax) (352,670) 131,124 - -
- loss on dilution of equity interests 5 (2,595) (5,398) - -
Profit/(Loss) before taxation 1,936,231 1,139,580 (2,239,714) 1,222,428
Taxation and zakat 11 (773,749) (482,422) (60,877) (19,126)
Profit/(Loss) for the financial year 1,162,482 657,158 (2,300,591) 1,203,302

Governance & Audited Financial Statements 2017Audited Financial Statements
46
Statements of Comprehensive Income For The Financial Year Ended 31 December 2017
Group Company
Note2017
RM’0002016
RM’0002017
RM’0002016
RM’000
Other comprehensive (expense)/income:
Items that will not be reclassified to profit or loss:
- actuarial gains on defined benefit plans, net of tax 18,027 14,867 - -
Items that may be reclassified subsequently to profit or loss:
- currency translation differences (2,070,454) 1,708,339 - -
- net cash flow hedge 271 (2,196) - -
- net investment hedge (15,801) (67,555) - -
- available-for-sale reserve (1,358) 32,631 - -
Other comprehensive (expense)/income for the financial year, net of tax (2,069,315) 1,686,086 - -
Total comprehensive (expense)/income for the financial year (906,833) 2,343,244 (2,300,591) 1,203,302
Profit/(Loss) for the financial year attributable to:
- owners of the Company 909,480 504,254 (2,300,591) 1,203,302
- non-controlling interests 253,002 152,904 - -
1,162,482 657,158 (2,300,591) 1,203,302
Total comprehensive (expense)/income for the financial year attributable to:
- owners of the Company (586,819) 1,836,063 (2,300,591) 1,203,302
- non-controlling interests (320,014) 507,181 - -
(906,833) 2,343,244 (2,300,591) 1,203,302
Earnings per share (sen)
- basic 12(a) 10.1 5.7 - -
- diluted 12(b) 10.1 5.7 - -
The above Statements of Comprehensive Income are to be read in conjunction with the notes to the financial statements on pages 53 to 158.

Governance & Audited Financial Statements 2017Audited Financial Statements
47
Statements of Financial Position As At 31 December 2017
Group Company
Note2017
RM’0002016
RM’000Restated
2017RM’000
2016RM’000
CAPITAL AND RESERVES ATTRIBUTABLE TO OWNERS OF THE COMPANY
Share capital 13 13,407,253 8,971,415 13,407,253 8,971,415
Share premium - 4,081,106 - 4,081,106
Reserves 15 11,323,883 10,528,131 4,534,623 7,556,634
Total equity attributable to owners of the Company 24,731,136 23,580,652 17,941,876 20,609,155
Non-controlling interests 5,773,447 5,037,449 - -
Total equity 30,504,583 28,618,101 17,941,876 20,609,155
NON-CURRENT LIABILITIES
Borrowings 16 14,796,319 15,135,472 - -
Derivative financial instruments 18 1,441,161 1,165,857 - -
Deferred income 19 270,915 245,894 - -
Deferred gain on sale and lease back assets 20 817,073 1,053,855 - -
Trade and other payables 21 1,644,197 1,581,353 7,329 5,157
Provision for liabilities 22 468,920 493,954 - -
Deferred taxation 23 1,672,496 2,195,955 - -
Total non-current liabilities 21,111,081 21,872,340 7,329 5,157
51,615,664 50,490,441 17,949,205 20,614,312
NON-CURRENT ASSETS
Intangible assets 24 22,176,286 23,406,105 - -
Property, plant and equipment 25 26,909,970 27,481,605 15,144 17,948
Subsidiaries 26 - - 24,449,626 24,863,295
Associates 27 7,985,974 8,400,152 - -
Joint ventures 28 26,022 109,254 - -
Available-for-sale financial assets 62,030 63,925 - -
Derivative financial instruments 18 143,777 398,318 - -
Long term receivables 29 535,157 117,684 2,000 2,000
Amounts due from subsidiaries 31 - - 88,207 95,982
Deferred taxation 23 270,046 291,633 - -
Total non-current assets 58,109,262 60,268,676 24,554,977 24,979,225

Governance & Audited Financial Statements 2017Audited Financial Statements
48
Statements of Financial Position As At 31 December 2017
Group Company
Note2017
RM’0002016
RM’000 Restated
2017RM’000
2016RM’000
CURRENT ASSETS
Inventories 30 174,279 174,747 - -
Amounts due from subsidiaries 31 - - 67,178 49,311
Trade and other receivables 32 4,496,637 4,775,304 20,280 8,231
Derivative financial instruments 18 53,109 2,735 - -
Financial assets at fair value through profit or loss 64 18 - -
Tax recoverable 41,615 199,111 - -
Deposits, cash and bank balances 33 6,812,868 5,332,414 371,978 732,801
11,578,572 10,484,329 459,436 790,343
Assets classified as held-for-sale 35 223,162 - - -
Total current assets 11,801,734 10,484,329 459,436 790,343
LESS: CURRENT LIABILITIES
Trade and other payables 21 12,616,963 12,282,899 185,779 130,309
Deferred gain on sale and lease back assets 20 126,017 140,817 - -
Borrowings 16 4,387,670 7,124,409 1,689,672 2,968,244
Derivative financial instruments 18 152,621 162,650 - -
Amounts due to subsidiaries 31 - - 5,133,757 2,056,703
Current tax liabilities 754,511 551,789 56,000 -
18,037,782 20,262,564 7,065,208 5,155,256
Liabilities classified as held-for-sale 35 257,550 - - -
Total current liabilities 18,295,332 20,262,564 7,065,208 5,155,256
Net current liabilities (6,493,598) (9,778,235) (6,605,772) (4,364,913)
51,615,664 50,490,441 17,949,205 20,614,312
The above Statements of Financial Position are to be read in conjunction with the notes to the financial statements on pages 53 to 158.
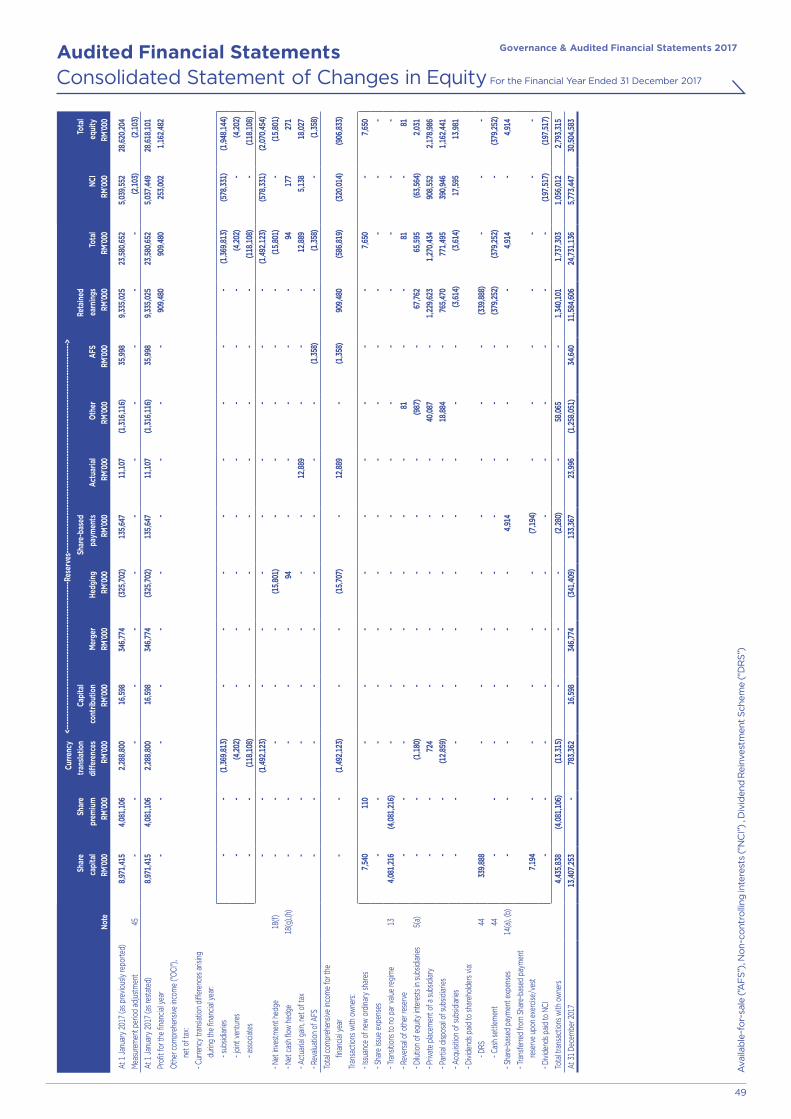
Governance & Audited Financial Statements 2017Audited Financial Statements
49
Shar
eca
pita
lRM
’000
Shar
e p
rem
ium
RM’0
00
Curre
ncy
trans
latio
ndi
ffere
nces
RM’0
00
<---
----
----
----
----
----
----
----
----
----
----
----
----
----
Rese
rves
----
----
----
----
----
----
----
----
----
----
----
----
----
----
----
----
----
----
----
-->
Reta
ined
earn
ings
RM’0
00To
tal
RM’0
00NC
IRM
’000
Tota
l eq
uity
RM’0
00No
te
Capi
tal
cont
ribut
ion
RM’0
00M
erge
rRM
’000
Hedg
ing
RM’0
00
Shar
e-ba
sed
paym
ents
RM’0
00Ac
tuar
ial
RM’0
00Ot
her
RM’0
00AF
SRM
’000
At 1
Janu
ary
2017
(as p
revio
usly
repo
rted)
8,97
1,41
54,
081,
106
2,28
8,80
016
,598
346,
774
(325
,702
)13
5,64
711
,107
(1,3
16,1
16)
35,9
989,
335,
025
23,5
80,6
525,
039,
552
28,6
20,2
04Me
asur
emen
t per
iod
adju
stm
ent
45-
--
--
--
--
--
-(2
,103
)(2
,103
)At
1 Ja
nuar
y 20
17 (a
s res
tate
d)
8,97
1,41
54,
081,
106
2,28
8,80
016
,598
346,
774
(325
,702
)13
5,64
711
,107
(1,3
16,1
16)
35,9
989,
335,
025
23,5
80,6
525,
037,
449
28,6
18,1
01Pr
ofit
for t
he fi
nanc
ial y
ear
--
--
--
--
--
909,
480
909,
480
253,
002
1,16
2,48
2Ot
her c
ompr
ehen
sive
incom
e ("O
CI"),
ne
t of t
ax:
- Cur
renc
y tra
nslat
ion
diffe
renc
es a
rising
du
ring
the
finan
cial y
ear:
- sub
sidiar
ies-
-(1
,369
,813
)-
--
--
--
-(1
,369
,813
)(5
78,3
31)
(1,9
48,1
44)
- joi
nt v
entu
res
--
(4,2
02)
--
--
--
--
(4,2
02)
-(4
,202
)- a
ssoc
iates
--
(118
,108
)-
--
--
--
-(1
18,1
08)
-(1
18,1
08)
--
(1,4
92,1
23)
--
--
--
--
(1,4
92,1
23)
(578
,331
)(2
,070
,454
)- N
et in
vest
men
t hed
ge
18(f)
--
--
-(1
5,80
1)-
--
--
(15,
801)
-(1
5,80
1)- N
et c
ash
flow
hed
ge18
(g),(
h)-
--
--
94-
--
--
9417
727
1- A
ctua
rial g
ain, n
et o
f tax
--
--
--
-12
,889
--
-12
,889
5,13
818
,027
- Rev
aluat
ion
of A
FS-
--
--
--
--
(1,3
58)
-(1
,358
)-
(1,3
58)
Tota
l com
preh
ensiv
e inc
ome
for t
he
finan
cial y
ear
--
(1,4
92,1
23)
--
(15,
707)
-12
,889
-(1
,358
)90
9,48
0(5
86,8
19)
(320
,014
)(9
06,8
33)
Tran
sact
ions
with
ow
ners
:
- Iss
uanc
e of
new
ord
inary
shar
es7,
540
110
--
--
--
--
-7,
650
-7,
650
- Sha
re is
sue
expe
nses
--
--
--
--
--
--
--
- Tra
nsiti
ons t
o no
par
valu
e re
gim
e13
4,08
1,21
6(4
,081
,216
)-
--
--
--
--
--
-- R
ever
sal o
f oth
er re
serv
e-
--
--
--
-81
--
81-
81- D
ilutio
n of
equ
ity in
tere
sts i
n su
bsid
iaries
5(a)
--
(1,1
80)
--
--
-(9
87)
-67
,762
65,5
95(6
3,56
4)2,
031
- Priv
ate
plac
emen
t of a
subs
idiar
y-
-72
4-
--
--
40,0
87-
1,22
9,62
31,
270,
434
908,
552
2,17
8,98
6- P
artia
l disp
osal
of su
bsid
iaries
--
(12,
859)
--
--
-18
,884
-76
5,47
077
1,49
539
0,94
61,
162,
441
- Acq
uisiti
on o
f sub
sidiar
ies-
--
--
--
--
-(3
,614
)(3
,614
)17
,595
13,9
81- D
ivide
nds p
aid to
shar
ehol
ders
via:
- D
RS44
339,
888
--
--
--
--
(339
,888
)-
--
- C
ash
settl
emen
t44
--
--
--
--
--
(379
,252
)(3
79,2
52)
-(3
79,2
52)
- Sha
re-b
ased
pay
men
t exp
ense
s14
(a),
(b)
--
--
--
4,91
4-
--
-4,
914
-4,
914
- Tra
nsfe
rred
from
Sha
re-b
ased
pay
men
t re
serv
e up
on e
xerc
ise/v
est
7,19
4-
--
--
(7,1
94)
--
--
--
-- D
ivide
nds p
aid to
NCI
--
--
--
--
--
--
(197
,517
)(1
97,5
17)
Tota
l tra
nsac
tions
with
ow
ners
4,43
5,83
8(4
,081
,106
)(1
3,31
5)-
--
(2,2
80)
-58
,065
-1,
340,
101
1,73
7,30
31,
056,
012
2,79
3,31
5At
31
Dece
mbe
r 201
713
,407
,253
-78
3,36
216
,598
346,
774
(341
,409
)13
3,36
723
,996
(1,2
58,0
51)
34,6
4011
,584
,606
24,7
31,1
365,
773,
447
30,5
04,5
83
Consolidated Statement of Changes in Equity For the Financial Year Ended 31 December 2017
Ava
ilab
le-f
or-
sale
(“A
FS
”), N
on-
cont
rolli
ng in
tere
sts
(“N
CI”
) , D
ivid
end
Rei
nves
tmen
t S
che
me
(“D
RS
”)
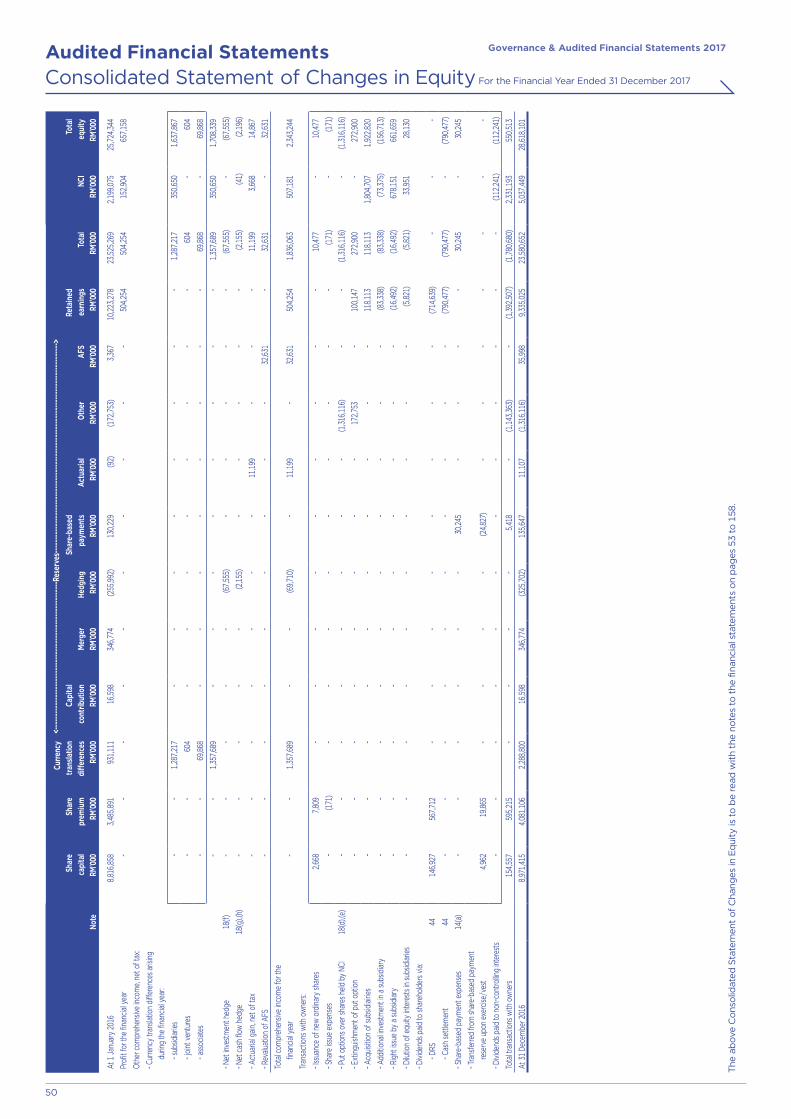
Governance & Audited Financial Statements 2017Audited Financial Statements
50
Shar
eca
pita
lRM
’000
Shar
e p
rem
ium
RM’0
00
Curre
ncy
trans
latio
ndi
ffere
nces
RM’0
00
<---
----
----
----
----
----
----
----
----
----
----
----
----
----
Rese
rves
----
----
----
----
----
----
----
----
----
----
----
----
----
----
----
----
----
----
----
-->
Reta
ined
earn
ings
RM’0
00To
tal
RM’0
00NC
IRM
’000
Tota
l eq
uity
RM’0
00No
te
Capi
tal
cont
ribut
ion
RM’0
00M
erge
rRM
’000
Hedg
ing
RM’0
00
Shar
e-ba
sed
paym
ents
RM’0
00Ac
tuar
ial
RM’0
00Ot
her
RM’0
00AF
SRM
’000
At 1
Janu
ary
2016
8,81
6,85
83,
485,
891
931,
111
16,5
9834
6,77
4(2
55,9
92)
130,
229
(92)
(172
,753
)3,
367
10,2
23,2
7823
,525
,269
2,19
9,07
525
,724
,344
Prof
it fo
r the
fina
ncial
yea
r-
--
--
--
--
-50
4,25
450
4,25
415
2,90
465
7,15
8
Othe
r com
preh
ensiv
e inc
ome,
net o
f tax
:
- Cur
renc
y tra
nslat
ion
diffe
renc
es a
rising
du
ring
the
finan
cial y
ear:
- s
ubsid
iaries
--
1,28
7,21
7-
--
--
--
-1,
287,
217
350,
650
1,63
7,86
7
- j
oint
ven
ture
s -
-60
4-
--
--
--
-60
4-
604
- a
ssoc
iates
--
69,8
68-
--
--
--
-69
,868
-69
,868
--
1,35
7,68
9-
--
--
--
-1,
357,
689
350,
650
1,70
8,33
9
- Net
inve
stm
ent h
edge
18(f)
--
--
-(6
7,55
5)-
--
--
(67,
555)
-(6
7,55
5)
- Net
cas
h flo
w h
edge
18(g
),(h)
--
--
-(2
,155
)-
--
--
(2,1
55)
(41)
(2,1
96)
- Act
uaria
l gain
, net
of t
ax-
--
--
--
11,1
99-
--
11,1
993,
668
14,8
67
- Rev
aluat
ion
of A
FS-
--
--
--
--
32,6
31-
32,6
31-
32,6
31
Tota
l com
preh
ensiv
e inc
ome
for t
he
finan
cial y
ear
--
1,35
7,68
9-
-(6
9,71
0)-
11,1
99-
32,6
3150
4,25
41,
836,
063
507,
181
2,34
3,24
4
Tran
sact
ions
with
ow
ners
:
- Iss
uanc
e of
new
ord
inary
shar
es2,
668
7,80
9-
--
--
--
--
10,4
77-
10,4
77
- Sha
re is
sue
expe
nses
-(1
71)
--
--
--
--
-(1
71)
-(1
71)
- Put
opt
ions
ove
r sha
res h
eld b
y NC
I18
(d),(
e)-
--
--
--
-(1
,316
,116
)-
-(1
,316
,116
)-
(1,3
16,1
16)
- Ext
inguis
hmen
t of p
ut o
ptio
n-
--
--
--
-17
2,75
3-
100,
147
272,
900
-27
2,90
0
- Acq
uisiti
on o
f sub
sidiai
ries
--
--
--
--
--
118,
113
118,
113
1,80
4,70
71,
922,
820
- Add
ition
al inv
estm
ent i
n a
subs
idiar
y-
--
--
--
--
-(8
3,33
8)(8
3,33
8)(7
3,37
5)(1
56,7
13)
- Rig
ht is
sue
by a
subs
idiar
y-
--
--
--
--
-(1
6,49
2)(1
6,49
2)67
8,15
166
1,65
9
- Dilu
tion
of e
quity
inte
rest
s in
subs
idiar
ies-
--
--
--
--
-(5
,821
)(5
,821
)33
,951
28,1
30
- Divi
dend
s paid
to sh
areh
olde
rs v
ia:
- D
RS44
146,
927
567,
712
--
--
--
--
(714
,639
)-
--
- C
ash
settl
emen
t44
--
--
--
--
--
(790
,477
)(7
90,4
77)
-(7
90,4
77)
- Sha
re-b
ased
pay
men
t exp
ense
s14
(a)
--
--
--
30,2
45-
--
-30
,245
-30
,245
- Tra
nsfe
rred
from
shar
e-ba
sed
paym
ent
rese
rve
upon
exe
rcise
/ves
t4,
962
19,8
65-
--
-(2
4,82
7)-
--
--
--
- Divi
dend
s paid
to n
on-c
ontro
lling
inter
ests
--
--
--
--
--
--
(112
,241
)(1
12,2
41)
Tota
l tra
nsac
tions
with
ow
ners
154,
557
595,
215
--
--
5,41
8-
(1,1
43,3
63)
-(1
,392
,507
)(1
,780
,680
)2,
331,
193
550,
513
At 3
1 De
cem
ber 2
016
8,97
1,41
54,
081,
106
2,28
8,80
016
,598
346,
774
(325
,702
)13
5,64
711
,107
(1,3
16,1
16)
35,9
989,
335,
025
23,5
80,6
525,
037,
449
28,6
18,1
01
Consolidated Statement of Changes in Equity For the Financial Year Ended 31 December 2017
The
ab
ove
Co
nso
lidat
ed S
tate
men
t o
f C
hang
es in
Eq
uity
is t
o b
e r
ead
wit
h th
e n
ote
s to
the
fina
ncia
l sta
tem
ents
on
pag
es 5
3 to
158
.

Governance & Audited Financial Statements 2017Audited Financial Statements
51
Company Statement of Changes in Equity For the Financial Year Ended 31 December 2017
Note
Numberof shares
’000
SharecapitalRM’000
Sharepremium
RM’000
Capitalcontribution
reserveRM’000
Share-basedpayments
reserveRM’000
Retained earnings
RM’000Total
RM’000
At 1 January 2017 8,971,415 8,971,415 4,081,106 16,598 135,647 7,404,389 20,609,155
Loss/Total comprehensive expense for the financial year - - - - - (2,300,591) (2,300,591)
Transactions with owners:
- Issuance of new ordinary shares 2,103 7,540 110 - - - 7,650
- Share issue expenses - - - - - - -
- Transition to no par value regime 13 - 4,081,216 (4,081,216) - - - -
- Dividends paid to shareholders via:
- DRS 44 73,046 339,888 - - - (339,888) -
- Cash settlement 44 - - - - - (379,252) (379,252)
- Share-based payment expenses 14(a),(b) - - - - 4,914 - 4,914
- Transferred from Share-based payment reserve upon exercise/vest 1,387 7,194 - - (7,194) - -
Total transactions with owners 76,536 4,435,838 (4,081,106) - (2,280) (719,140) (366,688)
At 31 December 2017 9,047,951 13,407,253 - 16,598 133,367 4,384,658 17,941,876
At 1 January 2016 8,816,858 8,816,858 3,485,891 16,598 130,229 7,706,203 20,155,779
Profit/Total comprehensive income for the financial year - - - - - 1,203,302 1,203,302
Transactions with owners:
- Issuance of new ordinary shares 2,668 2,668 7,809 - - - 10,477
- Share issue expenses - - (171) - - - (171)
- Dividends paid to shareholders via:
- DRS 44 146,927 146,927 567,712 - - (714,639) -
- Cash settlement 44 - - - - - (790,477) (790,477)
- Share-based payment expenses 14(a) - - - - 30,245 - 30,245
- Transferred from Share-based payment reserve upon exercise/vest 4,962 4,962 19,865 - (24,827) - -
Total transactions with owners 154,557 154,557 595,215 - 5,418 (1,505,116) (749,926)
At 31 December 2016 8,971,415 8,971,415 4,081,106 16,598 135,647 7,404,389 20,609,155
The above Company Statements of Changes in Equity are to be read in conjunction with the notes to the financial statements on pages 53 to 158.

Governance & Audited Financial Statements 2017Audited Financial Statements
52
Statements of Cash Flows For the Financial Year Ended 31 December 2017
The above Statements of Cash Flows are to be read in conjunction with the notes to the financial statements on pages 53 to 158.
Group Company
Note2017
RM’0002016
RM’0002017
RM’0002016
RM’000
Cash flows from/(used in) operating activities 34 5,732,951 6,775,101 (202,390) 728,881
Cash flows (used in)/from investing activities 34 (5,166,539) (10,835,217) 1,342,394 (2,385,574)
Cash flows from/(used in) financing activities 34 1,247,666 4,290,912 (1,453,705) 1,796,562
Net increase/(decrease) in cash and cash equivalents 1,814,078 230,796 (313,701) 139,869
Effect of exchange (losses)/gains on cash and cash equivalents (216,189) 98,104 (47,122) 2,458
Net decrease/(increase) in restricted cash and cash equivalents 224,347 (240,143) 269,160 -
Cash and cash equivalents at the beginning of the financial year 4,649,422 4,560,665 463,641 321,314
Cash and cash equivalents at the end of the financial year 33 6,471,658 4,649,422 371,978 463,641
Governance & Audited Financial Statements 2017Audited Financial Statements
53
Notes to the Financial Statements For The Financial Year Ended 31 December 2017
1. GENERAL INFORMATION
The principal activities of the Group are the provision of mobile communication services, telecommunication infrastructure and related services as well as digital services.
The principal activities of the Company are investment holding and provision of technical and management services on an international scale.
The principal activities of the subsidiaries are set out in Note 40 to the financial statements. There has been no significant change in the nature of the activities of the Group and the Company during the financial year.
The address of the registered office of the Company is Level 5, Corporate Headquarters, Axiata Tower, 9 Jalan Stesen Sentral 5, Kuala Lumpur Sentral, 50470 Kuala Lumpur.
The address of the principal place of business of the Company is Corporate Headquarters, Axiata Tower, 9 Jalan Stesen Sentral 5, Kuala Lumpur Sentral, 50470 Kuala Lumpur.
The financial statements have been approved for issuance in accordance with a resolution of the Board of Directors on 22 February 2018.
2. BASIS OF PREPARATION OF THE FINANCIAL STATEMENTS
The financial statements of the Group and the Company have been prepared in accordance with the provisions of the Malaysian Financial Reporting Standards (“MFRS”), International Financial Reporting Standards and the requirements of the Companies Act 2016 in Malaysia.
The financial statements have been prepared under the historical cost convention except as disclosed in the summary of significant accounting policies.
The financial statements are presented in Ringgit Malaysia (“RM”) and all values are rounded to the nearest thousand (RM’000) except when otherwise indicated.
The preparation of financial statements in conformity with MFRS requires the use of certain critical accounting estimates and assumptions that affect the reported amounts of assets and liabilities and the disclosure of contingent assets and liabilities at the date of the financial statements, and the reported amounts of the revenues and expenses during the reported period. It also requires Directors to exercise their judgement in the process of applying the Group’s and the Company’s accounting policies. Although these estimates and judgement are based on the Directors’ best knowledge of current events and actions, actual results may differ.
The areas involving a higher degree of judgement or complexity, or areas where assumptions and estimates are significant to the Group’s and the Company’s financial statements are disclosed in Note 4 to the financial statements.
(a) Standards and amendments to published standards that are applicable to the Group and the Company that are effective
New and amendments to published standards
The following standards and amendments to published standards have been adopted by the Group and the Company for the first time for the financial year beginning on or after 1 January 2017:
• Amendments to MFRS 107 “Statement of Cash Flows” on disclosure initiative introduce an additional disclosure on changes in liabilities arising from financing activities.
• Amendments to MFRS 112 “Income Taxes” on recognition of deferred tax assets for unrealised losses clarify the requirements for recognising deferred tax assets on unrealised losses arising from deductible temporary difference on asset carried at fair value. In addition, in evaluating whether an entity will have sufficient taxable profits in future periods against which deductible temporary differences can be utilised, the amendments require an entity to compare the deductible temporary differences with future taxable profits that excludes tax deductions resulting from the reversal of those temporary differences. The amendments shall be applied retrospectively.
• Annual Improvements to MFRS 2014 – 2016 Cycle: MFRS 12 “Disclosures of Interests in Other Entities”. The amendment clarified that when an entity’s interest in a subsidiary, a joint venture or an associate classified as held for sale in accordance with MFRS 5 “Non-current Assets Held for Sale and Discontinued Operations”, the entity is not required to disclose summarised financial information of these interests. Other disclosure requirements in MFRS 12 remain applicable. These amendments shall be applied retrospectively.
Other than amendments to MFRS 107 which required additional disclosure of changes in liabilities arising from financing activities, the adoption of these amendments did not have any material impact to the financial statements of the Group and the Company in the financial year.
Governance & Audited Financial Statements 2017Audited Financial Statements
54
Notes to the Financial Statements For The Financial Year Ended 31 December 2017
2. BASIS OF PREPARATION OF THE FINANCIAL STATEMENTS (CONTINUED)
(b) Standards and amendments to published standards that are applicable to the Group and the Company but not yet effective
The Group and the Company will apply the new standards and amendments to standards in the following periods.
(i) Financial year beginning on/after 1 January 2018
• MFRS 9 “Financial Instruments” will replace MFRS 139 “Financial Instruments: Recognition and Measurement”. The standard introduces new requirement for classification and measurement, impairment and hedge accounting. The main implications of MFRS 9 for the Group will be as below:
0 MFRS 9 addresses the classification, measurement and recognition, and impairment of financial assets and financial liabilities as well as hedge accounting. It replaces the parts of MFRS 139 that relate to the classification and measurement of financial instruments. MFRS 9 requires financial assets to be classified into two measurement categories: those measured at fair value, and those measured at amortised cost. The determination is made at initial recognition. The classification depends on the entity’s business model for managing its financial instruments and the contractual cash flow characteristics of the instrument. For financial liabilities, the standard retains most of the MFRS 139 requirements. The main change is that, in cases where the fair value option is taken for financial liabilities, the part of a fair value change due to an entity’s own credit risk is recorded in other comprehensive income rather than the income statement, unless this creates an accounting mismatch. MFRS 9 also clarifies the accounting for certain modifications and exchanges of financial liabilities measured at amortised cost.
0 The application of MFRS 9 may have a significant impact for the Group on classification, measurement and recognition of financial assets and financial liabilities compared to current rules. It will have an impact on impairment of trade receivables and contract assets (MFRS 15) as well as on amounts due from related parties – with the application of the expected credit loss model instead of the current incurred loss model. The Group will adopt the standard using the cumulative catch-up transition method and will therefore not restate comparative periods. Hence, the cumulative effect of initially applying the Standard will be recognised as an adjustment to the opening balance of retained earnings as at 1 January 2018 and comparatives will not be restated.
The Group is continuing to analyse the impact of these changes and expects to be in a position to estimate the impact of MFRS 9 in the first quarter of the financial year commencing 1 January 2018.
• MFRS 15 will replace MFRS 118 “Revenue” and MFRS 111 “Construction Contracts” and related interpretations. MFRS 15 establishes a new five-step model that will apply to revenue arising from contracts with customers. The main implications of MFRS 15 for the Group will be as below:
0 MFRS 15 establishes a five-step model related to revenue recognition from contracts with customers. MFRS 15 will require the Group to identify deliverables in contracts with customers that qualify as separate “performance obligations”. The performance obligations identified will depend on the nature of individual customer contracts, but might typically be identified for mobile handsets, other equipment provided to customers and for services provided to customers such as mobile and fixed line communications services. The transaction price receivable from customers must be allocated between the Group’s performance obligations under the contracts on a relative stand-alone selling price basis. Revenue will then be recognised either at a point in time or over time when the respective performance obligations in a contract are delivered to the customer. Stand-alone selling prices will be based on observable sales prices; however, where stand-alone selling prices are not directly observable, estimates of stand-alone selling prices will be required which will maximise the use of observable inputs.
The following areas are the significant areas impacting as a consequence of adopting this standard:
1) Revenue from bundled contracts (multiple-element arrangements):
Some revenue will be recognised earlier, as a larger portion of the total consideration received in a bundled contract will be attributable to the component delivered at contract inception (i.e. typically a subsidised handset). Therefore, this will produce a shift from service revenue (which will decrease) to the benefit of handset revenue. This will result in the recognition of a contract asset on the statement of financial position as more revenue is recognised upfront while the cash will be received along the subscription period. Contract assets (and liabilities) will be reported on a separate line in current assets even if their realisation period is longer than 12 months. This is because they are realised / settled as part of the normal operating cycle of our core business. The total revenue recognised remain unchanged over the contract period.
2) Cost of acquisition of contract:
Under MFRS 15, certain incremental costs incurred in acquiring a contract with a customer will be capitalised on the consolidated statement of financial position as intangibles and amortised over either the average customer retention period or the contract term, depending on the circumstances. This will generally lead to the later recognition of charges for some commissions payable to third party dealers and employees.
3) Contract performance costs:
Certain costs incurred in fulfilling customer contracts (typically, costs of routers and set-top boxes) will be deferred in the statement of financial position. Contract performance cost would be amortised over the contract term. Such deferred costs are likely to relate to the provision of deliverables to customers that do not qualify as performance obligations and for which revenue is not recognised; currently such costs are generally expensed as incurred.

Governance & Audited Financial Statements 2017Audited Financial Statements
55
Notes to the Financial Statements For The Financial Year Ended 31 December 2017
2. BASIS OF PREPARATION OF THE FINANCIAL STATEMENTS (CONTINUED)
(b) Standards and amendments to published standards that are applicable to the Group and the Company but not yet effective (continued)
The Group and the Company will apply the new standards and amendments to standards in the following periods. (continued)
(i) Financial year beginning on/after 1 January 2018 (continued)
• MFRS 15 will replace MFRS 118 “Revenue” and MFRS 111 “Construction Contracts” and related interpretations. MFRS 15 establishes a new five-step model that will apply to revenue arising from contracts with customers. The main implications of MFRS 15 for the Group will be as below: (continued)
0 Transition
The Group has elected to apply the modified retrospective approach for the initial adoption of MFRS 15. In accordance with this transitional method, the Group must apply MFRS 15 retrospectively only for those contracts which have not been fulfilled as of 1 January 2018. The resultant impact of conversion will be recognised in equity as of 1 January 2018, thus having no effect on the profit or loss. Comparative will not be restated.
0 The Group intends to use the following practical expedients, because in the view of the Group, the costs providing the information significantly overweigh the benefits:
■ Group will not adjust the transaction price for the means of a financing component whenever the period between the transfer of a promised good or service to a customer and the associated payment is one year or less; when the period is more than one year the significant financing component will be adjusted, if material;
■ Group will disclose in the Group financial statements the transaction price allocated to unsatisfied performance obligations only for contracts that have an original expected duration of more than one year (e.g. unsatisfied performance obligations for contracts that have an original duration of one year or less will not be disclosed);
■ Group will apply the practical expedient not to disclose the price allocated to unsatisfied performance obligations, if the consideration from a customer directly corresponds to the value to the customer of the entity’s performance to date (i.e. if billing = accounting revenue);
■ Group will apply the practical expedient to recognise the incremental costs of obtaining a contract as an expense when incurred if the amortisation period of the asset that Group otherwise would have recognised is one year or less.
0 The transactions impacted by MFRS 15 are high in volume, value and complexity, therefore the Group is continuing to assess the impact of these and other accounting changes that will arise under MFRS 15 and cannot reasonably estimate the impact; however, the changes highlighted above will have a material impact on the consolidated statement of comprehensive income and consolidated statement of financial position after the Group adopts MFRS 15 on 1 January 2018. The Group expects to be in a position to estimate the impact of MFRS 15 in the first quarter of the year commencing 1 January 2018.
• IC Interpretation 22 “Foreign Currency Transactions and Advance Consideration” applies when an entity recognises a non-monetary asset or non-monetary liability arising from the payment or receipt of advance consideration. MFRS 121 requires an entity to use the exchange rate at the ‘date of the transaction’ to record foreign currency transactions.
IC Interpretation 22 provides guidance how to determine ‘the date of transaction’ when a single payment/receipt is made, as well as for situations where multiple payments/receipts are made. The date of transaction is the date when the payment or receipt of advance consideration gives rise to the non-monetary asset or non-monetary liability when the entity is no longer exposed to foreign exchange risk. If there are multiple payments or receipts in advance, the entity should determine the date of the transaction for each payment or receipt.

Governance & Audited Financial Statements 2017Audited Financial Statements
56
Notes to the Financial Statements For The Financial Year Ended 31 December 2017
2. BASIS OF PREPARATION OF THE FINANCIAL STATEMENTS (CONTINUED)
(b) Standards and amendments to published standards that are applicable to the Group and the Company but not yet effective (continued)
The Group and the Company will apply the new standards and amendments to standards in the following periods: (continued)
(i) Financial year beginning on/after 1 January 2018 (continued)
• Amendment to MFRS 2 “Share-based Payment” on Classification and Measurement of Share-based Payment Transactions. The amendments address the following:
0 Measurement of cash-settled awards
■ The amendment clarifies that the fair value of a cash-settled award is determined on a basis consistent with that used for equity settled awards, where the impact of vesting and non-vesting conditions is considered.
■ Specifically, market performance conditions and non-vesting conditions are reflected in the estimation of fair value of the cash-settled award, whilst non-market performance conditions and service conditions are reflected in the estimate of the number of awards expected to vest. This method differs from the concept of “fair value” in MFRS 13 “Fair Value Measurement”.
0 Classification of share-based payment awards with net settlement feature for withholding tax obligations
■ The amendments introduce an exception to the principles of MFRS 2 when an employer is obliged under the tax law to withhold some of the shares to which an employee is entitled under a share-based payment award and to remit the employee’s tax obligation to the tax authority on behalf of the employee.
■ The amendments require an entity to account for awards with such a feature as equity settled share-based payment instead of dividing the award into 2 components; the tax portion as cash settled and the net amount of shares issued to the employee as equity settled.
0 Modification of cash-settled awards to equity-settled awards
■ The amendments clarify that when an award is modified from cash-settled to equity-settled, the liability for the original award is derecognised, and the modified equity-settled award is recognised in equity to the extent of goods or services received at the modification date.
■ The modified award is measured by reference to the fair value of the equity instruments on the modification date. The resultant difference is recognised in profit or loss.
• Amendments to MFRS 128 “Investments in Associates and Joint Ventures” to allow:
Venture capital organisations, mutual funds, unit trusts and similar entities to elect, on an individual basis, measuring their investments in associates and joint ventures at fair value through profit or loss.
An entity that is not an investment entity to retain the fair value measurement applied by its associates or joint ventures (that are investment entities) when applying equity method.
(ii) Financial year beginning on/after 1 January 2019
• MFRS 16 “Leases” supersedes MFRS 117 “Leases” and the related interpretations.
Under MFRS 16, a lease is a contract (or part of a contract) that conveys the right to control the use of an identified asset for a period of time in exchange for consideration.
MFRS 16 eliminates the classification of leases by the lessee as either finance leases (on balance sheet) or operating leases (off balance sheet). MFRS 16 requires a lessee to recognise a “right-of-use” of the underlying asset and a lease liability reflecting future lease payments for most leases.
The right-of-use asset is depreciated in accordance with the principle in MFRS 116 ‘Property, Plant and Equipment’ and the lease liability is accreted over time with interest expense recognised in the income statement.
For lessors, MFRS 16 retains most of the requirements in MFRS 117. Lessors continue to classify all leases as either operating leases or finance leases and account for them differently.
MFRS 16 will impact the Group’s net assets financial position and results of operations as below:
√ Moderate increase in net assets of the Group with the increase in lease obligations and a similarly increase in rights of use recognised as assets.
√ In future, depreciation and interest expense will be recognised instead of leasing expenses, which will slightly improve EBITDA.
Governance & Audited Financial Statements 2017Audited Financial Statements
57
Notes to the Financial Statements For The Financial Year Ended 31 December 2017
2. BASIS OF PREPARATION OF THE FINANCIAL STATEMENTS (CONTINUED)
(b) Standards and amendments to published standards that are applicable to the Group and the Company but not yet effective (continued)
The Group and the Company will apply the new standards and amendments to standards in the following periods: (continued)
(ii) Financial year beginning on/after 1 January 2019 (continued)
• IC Interpretation 23 “Uncertainty over Income Tax Treatments” provides guidance on how to recognise and measure deferred and current income tax assets and liabilities where there is uncertainty over a tax treatment.
If an entity concludes that it is not probable that the tax treatment will be accepted by the tax authority, the effect of the tax uncertainty should be included in the period when such determination is made. An entity shall measure the effect of uncertainty using the method which best predicts the resolution of the uncertainty.
IC Interpretation 23 will be applied retrospectively.
• Amendments to MFRS 9 allow companies to measure some pre-payable financial assets with negative compensation at amortised cost. Negative compensation arises where the contractual terms permit the borrower to prepay the instrument before its contractual maturity, but the prepayment amount could be less than the unpaid amounts of principal and interest. To qualify for amortised cost measurement, the negative compensation must be reasonable compensation for early termination of the contract, and the asset must be held within a ‘held to collect’ business model.
The amendments will be applied retrospectively.
• Amendments to MFRS 128 clarify that an entity should apply MFRS 9 (including the impairment requirements) to long-term interests in an associate or joint venture, which are in substance form part of the entity’s net investment, for which settlement is neither planned nor likely to occur in the foreseeable future. In addition, such long-term interest are subject to loss allocation and impairment requirements in MFRS 128.
The amendments shall be applied retrospectively.
• Annual Improvements to MFRS 2015 – 2017 Cycle:
√ Amendments to MFRS 3 “Business Combinations” clarify that when a party obtains control of a business that is a joint operation, the acquirer should account the transaction as a business combination achieved in stages. Accordingly it should remeasure its previously held interest in the joint operation (rights to the assets and obligations for the liabilities) at fair value on the acquisition date.
√ Amendments to MFRS 11 “Joint Arrangements” clarify that when a party obtains joint control of a business that is a joint operation, the party should not remeasure its previously held interest in the joint operation.
√ Amendments to MFRS 112 “Income Taxes” clarify that where income tax consequences of dividends on financial instruments classified as equity is recognised (either in profit or loss, other comprehensive income or equity) depends on where the past transactions that generated distributable profits were recognised. Accordingly, the tax consequences are recognised in profit or loss when an entity determines payments on such instruments are distribution of profits (that is, dividends). Tax on dividend should not be recognised in equity merely on the basis that it is related to a distribution to owners.
√ Amendments to MFRS 123 “Borrowing Costs” clarify that if a specific borrowing remains outstanding after the related qualifying asset is ready for its intended use or sale, it becomes part of general borrowings.
Other than as mentioned above, the adoption of standards and amendments to published standards and IC Interpretation are not expected to have a material impact to the financial statements of the Group and the Company.
3. SIGNIFICANT ACCOUNTING POLICIES
The principal accounting policies in the preparation of these financial statements are set out below:
(a) Economic entities in the Group
(i) Subsidiaries
Subsidiaries are all entities (including structured entities) over which the Group has control. The Group controls an entity when the Group is exposed to, or has rights to, variable returns from its involvement with the entity and has the ability to affect those returns through its power to direct the relevant activities of the entity. The existence and effect of potential voting rights that are currently exercisable or convertible are considered only if the rights are substantive when assessing whether the Group controls another entity.
Subsidiaries are fully consolidated from the date on which control is transferred to the Group. They are deconsolidated from the date that control ceases.

Governance & Audited Financial Statements 2017Audited Financial Statements
58
Notes to the Financial Statements For The Financial Year Ended 31 December 2017
3. SIGNIFICANT ACCOUNTING POLICIES (CONTINUED)
The principal accounting policies in the preparation of these financial statements are set out below: (continued)
(a) Economic entities in the Group (continued)
(i) Subsidiaries (continued)
The Group applies the acquisition method to account for business combinations. The consideration transferred for the acquisition of a subsidiary is the fair values of the assets transferred, the liabilities incurred to the former owners of the acquiree and the equity interests issued by the Group. The consideration transferred includes the fair value of any asset or liability resulting from a contingent consideration arrangement and fair value of any pre-existing equity interest in the subsidiary. Identifiable assets acquired, liabilities and contingent liabilities assumed in a business combination are measured initially at their fair values at the acquisition date. The Group recognises any non-controlling interest (“NCI”) in the acquiree on an acquisition-by-acquisition basis, either at fair value or at the NCI’s proportionate share of the recognised amounts of acquiree’s identifiable net assets.
Acquisition-related costs are expensed as incurred.
If the business combination is achieved in stages, the carrying amount of the acquirer’s previously held equity interest in the acquiree is remeasured to fair value at the acquisition date, any gains or losses arising from such re-measurement are recognised in profit or loss.
Any contingent consideration to be transferred by the Group is recognised at fair value at the acquisition date. Subsequent changes to the fair value of the contingent consideration that is deemed to be an asset or liability is recognised in accordance with MFRS 139 either in profit or loss or as a change to other comprehensive income (“OCI”). Contingent consideration that is classified as equity is not remeasured, and its subsequent settlement is accounted for within equity.
The excess of the consideration transferred by the Group, the amount of any NCI in the acquiree and the acquisition-date fair value of any previous equity interest in the acquiree over the fair value of the identifiable net assets acquired is recognised as goodwill. If the total of consideration transferred, NCI recognised and previously held interest measured is less than the fair value of the net assets of the subsidiary acquired in the case of a bargain purchase, the difference is recognised directly in the profit or loss. The accounting policy of goodwill is stated in Note 3(b)(i) to the financial statements. Goodwill is carried at cost less accumulated impairment losses, if any.
The Group applies predecessor accounting to account for business combinations under common control. Under predecessor accounting, assets and liabilities acquired are not restated to their respective fair values. They are recognised at the carrying amounts from the consolidated financial statements of the ultimate holding company of the Group and adjusted to conform with the accounting policies adopted by the Group. The difference between any consideration given and the aggregate carrying amounts of the assets and liabilities of the acquired entity is recognised as an adjustment to equity. No additional goodwill is recognised.
The acquired entity’s results, assets and liabilities are consolidated as if both the acquirer and acquiree had always been combined. Consequently, the consolidated financial statements reflect both entities’ full year’s results.
Inter-company transactions, balances and unrealised gains on transactions between the Group’s companies are eliminated. Profits and losses resulting from inter-company transactions that are recognised in assets are also eliminated. Accounting policies of subsidiaries have been changed where necessary to ensure consistency with the policies adopted by the Group.
(ii) Changes in ownership interests in subsidiaries without change of control
Transactions with NCIs that do not result in loss of control are accounted for as transactions with equity owners of the Group. A change in ownership interest results in an adjustment between the carrying amounts of the controlling and NCI to reflect their relative interests in the subsidiary. Any difference between the amount of the adjustment to NCI and any consideration paid or received is recognised in equity attributable to owners of the Group.
The potential cash payments related to put options issued by the Group over the equity of subsidiaries are accounted for as financial liabilities. The amount of financial liabilities is recognised initially at the present value of the estimated redemption amount within derivative financial instruments with a corresponding charge directly to equity. The charge to equity is recognised separately as written put options over non-controlling interest, adjacent to NCI in the net assets of consolidated subsidiaries.
The Group recognises the cost of writing such put options, determined as the excess of the fair value of the option over any consideration received, as a financing cost. Such options are subsequently measured at amortised cost, using the effective interest rate method, in order to accrete the liability up to the amount payable under the option at the date at which is first becomes exercisable. The charge arising is recorded as a financing cost. In the event that the option expires unexercised, the liability is derecognised with a corresponding adjustment to equity.

Governance & Audited Financial Statements 2017Audited Financial Statements
59
Notes to the Financial Statements For The Financial Year Ended 31 December 2017
3. SIGNIFICANT ACCOUNTING POLICIES (CONTINUED)
The principal accounting policies in the preparation of these financial statements are set out below: (continued)
(a) Economic entities in the Group (continued)
(iii) Disposal of subsidiaries
When the Group ceases to have control, any retained interest in the entity is re-measured to its fair value at the date when control is lost, with the change in carrying amount recognised in profit or loss. The fair value is the initial carrying amount for the purposes of subsequently accounting for the retained interest as an associate, a joint venture or financial asset. In addition, any amounts previously recognised in OCI in respect of that subsidiary are accounted for as if the Group had directly disposed of the related assets or liabilities. This may mean that amounts previously recognised in consolidated OCI are reclassified to profit or loss.
Gains or losses on the disposal of subsidiaries include the carrying amount of goodwill relating to the subsidiaries sold.
(iv) Joint arrangements
A joint arrangement is an arrangement of which there is contractually agreed sharing of control by the Group with one or more parties, where decisions about the relevant activities relating to the joint arrangement require unanimous consent of the parties sharing control. The classification of a joint arrangement as a joint operation or a joint venture depends upon the rights and obligations of the parties to the arrangement. A joint venture is a joint arrangement whereby the joint ventures have rights to the net assets of the arrangement. A joint operation is a joint arrangement whereby the joint operators have rights to the assets and obligations for the liabilities, relating to the arrangement.
The Group’s interest in joint ventures are accounted for in the consolidated financial statements using the equity method as stated in Note 3(a)(v) to the financial statements. Where necessary, in applying the equity method, adjustments are made to the financial statements of joint venture to ensure consistency of the accounting policies with those of the Group.
Interests in joint ventures are accounted for using the equity method, after initially being recognised at cost in the consolidated statement of financial position. Under the equity method, the investment in a joint venture is initially recognised at cost, and adjusted thereafter to recognise the Group’s share of the post-acquisition profits or losses of the joint venture in profit or loss, and the Group’s share of movements in OCI of the joint venture in OCI. Dividends received or receivable from a joint venture are recognised as a reduction in the carrying amount of the investment. When the Group’s share of losses in a joint venture equals or exceeds its interests in the joint venture, including any long-term interests that, in substance, form part of the Group’s net investment in the joint venture, the Group does not recognise further losses, unless it has incurred legal or constructive obligations or made payments on behalf of the joint venture.
The Group determines at each reporting date whether there is any objective evidence that the investment in the joint venture is impaired. An impairment loss is recognised for the amount by which the carrying amount of the joint venture exceeds its recoverable amount.
Unrealised gains on transactions between the Group and its joint ventures are eliminated to the extent of the Group’s interest in the joint ventures. Unrealised losses are also eliminated unless the transaction provides evidence of an impairment of the asset transferred. Accounting policies of the joint ventures have been changed where necessary to ensure consistency with the policies adopted by the Group.
When the Group ceases to equity account its joint venture because of a loss of joint control, any retained interest in the entity is remeasured to its fair value with the change in carrying amount recognised in profit or loss. This fair value becomes the initial carrying amount for the purposes of subsequently accounting for the retained interest as an associate or financial asset. In addition, any amount previously recognised in OCI in respect of the entity is accounted for as if the Group had directly disposed of the related assets or liabilities. This may mean that amounts previously recognised in OCI are reclassified to profit or loss.
If the ownership interest in a joint venture is reduced but joint control is retained, only a proportionate share of the amounts previously recognised in OCI is reclassified to profit or loss where appropriate.
(v) Associates
Associates are entities which the Group has significant influence, but no control or joint control, generally accompanying a shareholding of between 20% and 50% of the voting rights. Significant influence is power to participate in the financial and operating policy decisions of the associates but not power to exercise control or jointly control over those policies.
Investments in associates are accounted for using the equity method of accounting. Under the equity method, the investment in an associate is initially recognised at cost, and adjusted thereafter to recognise the Group’s share of the post-acquisition profits or losses of the associate in profit or loss, and the Group’s share of movements in OCI of the associate in OCI. Dividends received or receivable from an associate are recognised as a reduction in the carrying amount of the investment. When the Group’s share of losses in an associate equals or exceeds its interests in the associate, including any long-term interests that, in substance, form part of the Group’s net investment in the associate, the Group does not recognise further losses, unless it has incurred legal or constructive obligations or made payments on behalf of the associate. The Group’s investment in associates includes goodwill identified on acquisition.
The Group determines at each reporting date whether there is any objective evidence that the investment in the associate is impaired. An impairment loss is recognised for the amount by which the carrying amount of the associate exceeds its recoverable amount.

Governance & Audited Financial Statements 2017Audited Financial Statements
60
Notes to the Financial Statements For The Financial Year Ended 31 December 2017
3. SIGNIFICANT ACCOUNTING POLICIES (CONTINUED)
(a) Economic entities in the Group (continued)
(v) Associates (continued)
Profits and losses resulting from upstream and downstream transactions between the Group and its associate are recognised in the Group’s consolidated financial statements only to the extent of unrelated investor’s interests in the associates. Unrealised losses are eliminated unless the transaction provides evidence of an impairment of the asset transferred. Accounting policies of associates have been changed where necessary to ensure consistency with the policies adopted by the Group.
When the Group ceases to equity account its associate because of a loss of significant influence, any retained interest in the entity is remeasured to its fair value with the change in carrying amount recognised in profit or loss. This fair value becomes the initial carrying amount for the purposes of subsequently accounting for the retained interest as a financial asset. In addition, any amount previously recognised in OCI in respect of the entity is accounted for as if the Group had directly disposed of the related assets or liabilities. This may mean that amounts previously recognised in OCI are reclassified to profit or loss.
If the ownership interest in an associate is reduced but significant influence is retained, only a proportionate share of the amounts previously recognised in OCI is reclassified to profit or loss where appropriate.
Dilution gains and losses arising in investments in associates are recognised in profit or loss.
The cost of an associate acquired in stages is measured as the sum of the fair value of the interest previously held plus the fair value of any additional consideration transferred as of the date when the investment became an associate. Any gain or loss on re-measurement of the previously held stake is taken to profit or loss and any OCI recognised in prior periods in relation to the previously held stake in the acquired associate is also recognised in profit or loss.
The cost of acquiring an additional stake in an associate is added to the carrying amount of associate and equity accounted. Goodwill arising on the purchase of additional stake is computed using fair value information at the date the additional interest is purchased. The previously held interest is not re-measured.
Any acquisition-related costs are expensed in the periods in which the costs are incurred.
(b) Intangible assets
(i) Goodwill
The Group recognised goodwill based on partial goodwill method. Goodwill represents the excess of the cost of acquisition of subsidiaries over the Group’s share of the fair value of the identifiable net assets including contingent liabilities of subsidiaries at the date of acquisition and fair value of any pre-existing equity interest in the subsidiaries. Any shortfall is recognised in profit or loss.
For the purpose of impairment testing, goodwill acquired in a business combination is allocated to each of the cash generating units (“CGUs”), or groups of CGUs, that is expected to benefit from the synergies of the combination. Each unit or group of units to which the goodwill is allocated represents the lowest level within the entity at which the goodwill is monitored for internal management purposes. Goodwill is monitored at the operating segment level.
Goodwill is not amortised but it is tested for impairment annually or more frequently if events or changes in circumstances indicate that it might be impaired, and carried at cost less accumulated impairment losses. For the purpose of impairment testing, goodwill acquired in a business combination is allocated to each of the CGUs, or groups of CGUs, that is expected to benefit from the synergies of the combination. Each unit or group of units to which the goodwill is allocated represents the lowest level within the entity at which the goodwill is monitored for internal management purposes. The carrying value of goodwill is compared to the recoverable amount, which is the higher of value in use and the fair value less costs of disposal. Any impairment is recognised immediately as an expense and is not subsequently reversed.
(ii) Licenses The Group’s licenses are mainly consisting acquired telecommunication licences with allocated spectrum rights and tower operating license.
Acquired licenses are shown at cost. Licenses acquired in a business combination are recognised at fair value at the acquisition date. Licenses have finite useful lives and are carried at cost less accumulated amortisation. Amortisation is calculated using straight-line method, from the effective date of commercialisation of services, subject to impairment, to the end of the assignment period. Licenses are not revalued. The estimated useful lives of the acquired telecommunication licenses with allocated spectrum rights and tower operating license of the Group are as follows:
Malaysia 15 years
Indonesia 5 - 10 years
Sri Lanka 5 - 10 years
Bangladesh 15 - 18 years
Cambodia 25 - 30 years
Nepal 25 years

Governance & Audited Financial Statements 2017Audited Financial Statements
61
Notes to the Financial Statements For The Financial Year Ended 31 December 2017
3. SIGNIFICANT ACCOUNTING POLICIES (CONTINUED)
(b) Intangible assets (continued)
(iii) Subscriber acquisition costs
Subscriber acquisition costs incurred in providing the customer a free or subsidised device, provided the customer signs a non-cancellable contract for a predetermined contractual period, are amortised over the contractual period on a straight line method.
Subscriber acquisition costs are assessed at each reporting date whether there is any indication that the subscriber acquisition cost may be impaired.
(iv) Customer contracts and the related relationship
Customer contracts and the related customer relationship arose from the acquisition of a subsidiary. The customer contracts and the related relationships are shown at fair value on acquisition of a subsidiary and subsequently subject to amortisation over the useful life. The customer contracts and the related customer relationships are tested for impairment whenever indication of impairment exists.
Indonesia 4 years
Nepal 10 years
Bangladesh 2.5 years
Others 20 years
(v) Brands
Separately acquired brands are shown at historical cost. Brands acquired in a business combination are recognised at fair value at the acquisition date. Brands have a finite useful life and are carried at cost less accumulated amortisation and accumulated losses, if any. Amortisation is calculated using the straight line method to allocate the cost of brands over their estimated useful lives as below:
Indonesia 2 years
Nepal 10 years
Bangladesh 3 years
(c) Property, plant and equipment (“PPE”)
PPE are stated at cost less accumulated depreciation and impairment losses. Cost includes its purchase price and any costs that are directly attributable to bringing to assets to the location and condition necessary for it to be capable of operating in the manner intended by management.
(i) Cost
The cost of telecommunication network includes cost of equipment, site surveys, contractors’ charges, materials and related overhead. The cost of other PPE comprises their purchase cost and any incidental cost of acquisition. These costs include the costs of dismantling, removal and restoration, the obligation which was incurred as a consequence of installing the asset.
PPE also include telecommunication equipment and maintenance spares acquired for the purpose of replacing damaged or faulty plant or spares and supplies to be used in constructing and maintaining the network. PPE acquired in a business combination are recognised at fair value at the acquisition date.
Borrowing costs directly incurred to finance the construction of PPE that takes more than twelve (12) months are capitalised as part of the cost of the assets during the period of time that is required to complete and prepare the qualified asset for its intended use.
Subsequent cost is included in the carrying amount of the asset or recognised as a separate asset, as appropriate, only when it is probable that the future economic benefit associated with the item will flow to the Group and the Company and the cost of the item can be measured reliably. The carrying value of the replaced part is derecognised. All other repairs and maintenance are recognised as expenses in profit or loss during the period in which they are incurred.
(ii) Depreciation and residual value
Freehold land is not depreciated as it has an infinite life. Other PPE are depreciated on the straight-line method to allocate the cost of the assets to their residual values over their estimated useful lives in years, as summarised below:
Leasehold land 3 - 99 years
Buildings 2 - 50 years
Telecommunication network equipment 2 - 20 years
Movable plant and equipment 1 - 10 years
Computer support systems 2 - 10 years

Governance & Audited Financial Statements 2017Audited Financial Statements
62
Notes to the Financial Statements For The Financial Year Ended 31 December 2017
3. SIGNIFICANT ACCOUNTING POLICIES (CONTINUED)
(c) Property, plant and equipment (“PPE”) (continued)
(ii) Depreciation and residual value (continued)
Depreciation on assets under construction or capital work-in-progress commence when the assets are ready for their intended use. Depreciation on PPE ceases at the earlier of derecognition or classification as held-for-sale.
Residual values and useful lives of assets are reviewed, and adjusted if appropriate, at the end of each reporting period.
(iii) Impairment
At the end of the reporting period, the Group and the Company assess whether there is any indication of impairment. If such indication exists, an analysis is performed to assess whether the carrying value of the asset is fully recoverable. A write down is made if the carrying value exceeds the recoverable amount. See significant accounting policies Note 3(e) to the financial statements on impairment of non-financial assets.
(iv) Gains or losses on disposals
Gains or losses on disposals are determined by comparing the proceeds with the carrying amount of the related asset and are included in “other operating income – net” in profit or loss.
(v) Asset exchange transaction
PPE may be acquired in exchange for a non-monetary asset or for a combination of monetary and non-monetary assets and is measured at fair value unless;
• the exchange transaction lacks commercial substance; or• the fair value of neither the assets received nor the assets given up can be measured reliably.
The acquired item is measured in this way even if the Group and the Company cannot immediately derecognise the assets given up. If the acquired item cannot be reliably measured at fair value, its cost is measured at the carrying amount of the asset given up.
(vi) Repairs and maintenance
Repairs and maintenance are charged to the profit or loss during the period in which they are incurred. The cost of major renovations is included in the carrying amount of the asset when it is probable that future economic benefits in excess of the originally assessed standard of performance of the existing asset will flow to the Group and the Company. This cost is depreciated over the remaining useful life of the related asset.
(d) Investments in subsidiaries, associates and joint ventures in separate financial statements
In the Company’s separate financial statements, investments in subsidiaries, associates and joint ventures are stated at cost less accumulated impairment losses.
Where an indication of impairment exists, the carrying amount of the investment is assessed and written down immediately to its recoverable amount. See accounting policy Note 3(e) to the financial statements on impairment of non-financial assets.
On disposal of investments in subsidiaries, associates and joint ventures, the difference between the disposal proceed and its carrying amount of the investment is recognised in profit or loss. Disposal-related costs are expensed as incurred.
The advances to subsidiaries of which the Company does not expect repayment in the foreseeable future are considered as part of the Company’s investments in the subsidiaries.
(e) Impairment of non-financial assets (excluding goodwill)
Assets that have an indefinite useful life are not subject to amortisation and are tested for impairment annually, and as and when events or circumstances occur indicating that an impairment may exist.
Assets with definite useful life are reviewed for impairment losses whenever events or changes in circumstances indicate that the carrying amount may not be recoverable. An impairment loss is recognised for the amount by which the carrying amount of the asset exceeds its recoverable amount. The recoverable amount is the higher of an asset’s fair value less cost to sell (“FVLCS”) and value-in-use (“VIU”). For the purpose of assessing impairment, assets are grouped at the lowest level for which there are separately identifiable cash flows (“CGUs”). Assets that suffered an impairment are reviewed for possible reversal at the end of reporting period.
For investment in associates, when assessing FVLCS, the unit of account is the investment in associate as a whole. The Group uses the adjusted quoted price (as disclosed in Note 27 (c) to the financial statements) which reflects the management’s estimate of block discounts on similar purchases of NCI as one of the impairment indicator.
The impairment loss is charged to profit or loss. Any subsequent increase in recoverable amount is recognised in the profit or loss.

Governance & Audited Financial Statements 2017Audited Financial Statements
63
Notes to the Financial Statements For The Financial Year Ended 31 December 2017
3. SIGNIFICANT ACCOUNTING POLICIES (CONTINUED)
(f) Financial assets
(i) Classification
The Group and the Company classify its financial assets in the following categories: at fair value through profit or loss (“FVTPL”), loans and receivables, available-for-sale (“AFS”) and held-to-maturity (“HTM”). The classification depends on the purpose for which the financial assets were acquired. Management determines the classification at initial recognition.
(a) Financial assets at FVTPL
The Group classifies financial assets at FVTPL if they are acquired principally for the purpose of selling in the short term, i.e. are held for trading. Derivatives are also categorised as held for trading unless they are designated as hedges. See Note 18 to the financial statements on derivative financial instruments and hedging activities.
The assets are presented as current assets if they are expected to be sold within twelve (12) months after the end of the reporting period; otherwise they are presented as non-current assets.
(b) Loans and receivables
Loans and receivables are non-derivative financial assets with fixed or determinable payments that are not quoted in an active market. If collection of the amounts is expected in one year or less they are classified as current assets. Otherwise, they are presented as non-current assets.
(c) AFS financial assets
AFS financial assets are non-derivatives that are either designated in this category or not classified in any of the other categories. They are included in non-current assets unless the investment matures or management intends to dispose of it within twelve (12) months from the end of the reporting period.
(d) HTM financial assets
HTM financial assets are non-derivative financial assets with fixed or determinable payments and fixed maturities that the Group’s and Company’s management have the positive intention and ability to hold to maturity. If the Group and the Company were to sell other than an insignificant amount of HTM financial assets, the whole category would be tainted and reclassified as AFS. HTM financial assets are included in non-current assets, except for those with maturities less than twelve (12) months from the end of the reporting period, which are classified as current assets.
(ii) Recognition and initial measurement
Regular purchases and sales of financial assets are recognised on the trade-date, the date on which the Group and the Company commit to purchase or sell the asset.
Financial assets are initially recognised at fair value plus transaction costs for all financial assets not carried at FVTPL. Financial assets carried at FVTPL are initially recognised at fair value and transaction costs are expensed in profit or loss.
(iii) Subsequent measurement – gains and losses
AFS financial assets and financial assets at FVTPL are subsequently carried at fair value. Loans and receivables and HTM financial assets are subsequently carried at amortised cost using the effective interest method.
Changes in the fair values of financial assets at FVTPL, including the effects of currency translation are recognised in profit or loss in the period in which the changes arise.
Changes in the fair value of AFS financial assets are recognised in OCI, except for impairment losses (see accounting policy Note 3(f)(iv)(b)) and foreign exchange gains and losses on monetary assets. The exchange differences on monetary assets are recognised in profit or loss, whereas exchange differences on non-monetary assets are recognised in OCI as part of fair value change.
(iv) Subsequent measurement – impairment of financial assets
(a) Assets carried at amortised cost
The Group and the Company assess at the end of the reporting period whether there is objective evidence that a financial asset or group of financial assets is impaired. A financial asset or a group of financial assets is impaired and impairment losses are incurred only if there is objective evidence of impairment as a result of one or more events that occurred after the initial recognition of the asset (a ‘loss event’) and that loss event (or events) has an impact on the estimated future cash flows of the financial asset or group of financial assets that can be reliably estimated.

Governance & Audited Financial Statements 2017Audited Financial Statements
64
Notes to the Financial Statements For The Financial Year Ended 31 December 2017
3. SIGNIFICANT ACCOUNTING POLICIES (CONTINUED)
(f) Financial assets (continued)
(iv) Subsequent measurement – impairment of financial assets (continued)
(a) Assets carried at amortised cost (continued)
Evidence of impairment may include indications that the debtors or a group of debtors is experiencing significant financial difficulty, default or delinquency in interest or principal payments, the probability that they will enter bankruptcy or other financial reorganisation, and where observable data indicate that there is a measurable decrease in the estimated future cash flows, such as changes in arrears or economic conditions that correlate with defaults.
The amount of the loss is measured as the difference between the asset’s carrying amount and the present value of estimated future cash flows (excluding future credit that have not been incurred) discounted at the financial asset’s original effective interest rate. The asset’s carrying amount of the asset is reduced and the amount of the loss is recognised in profit or loss. If ‘loans and receivables’ or a ‘HTM investment’ has a variable interest rate, the discount rate for measuring any impairment loss is the current effective interest rate determined under the contract. As a practical expedient, the Group and the Company may measure impairment on the basis of an instrument’s fair value using an observable market price.
If, in a subsequent period, the amount of the impairment loss decreases and the decrease can be related objectively to an event occurring after the impairment was recognised (such as an improvement in the debtor’s credit rating), the reversal of the previously recognised impairment loss is recognised in profit or loss.
When an asset is uncollectible, it is written off against the related accumulated impairment losses account. Such assets are written off after all the necessary procedures have been completed and the amount of the loss has been determined.
(b) Assets classified as AFS
The Group and the Company assess at the end of the reporting period whether there is objective evidence that a financial asset or a group of financial assets is impaired.
For debt securities, the Group and the Company uses criteria and measurement of impairment loss applicable for ‘assets carried at amortised cost’ above. If, in a subsequent period, the fair value of a debt instrument classified as available for sale increases and the increase can be objectively related to an event occurring after the impairment loss was recognised in profit or loss, the impairment loss is reversed through the profit or loss.
In the case of equity securities classified as AFS, in addition to the criteria for ‘assets carried at amortised cost’ above, a significant or prolonged decline in the fair value of the security below its cost is also considered as an indicator that the assets are impaired. If any such evidence exists for AFS financial assets, the cumulative loss that had been recognised directly in equity is removed from equity and recognised in profit or loss. The amount of cumulative loss that is reclassified to profit or loss is the difference between the acquisition cost and the current fair value, less any impairment loss on that financial asset previously recognised in profit or loss. Impairment losses recognised in profit or loss on equity instruments classified as AFS are not reversed through profit or loss in subsequent period.
(v) De-recognition
Financial assets are de-recognised when the rights to receive cash flows from the investments have expired or have been transferred and the Group and the Company have transferred substantially all risks and rewards of ownership.
Receivables that are factored out to banks and other financial institutions with recourse to the Group and the Company are not derecognised until the recourse period has expired and the risks and rewards of the receivables have been fully transferred. The corresponding cash received from the financial institutions is recorded as borrowings.
When AFS financial assets are sold, the accumulated fair value adjustments recognised in OCI are reclassified to profit or loss.
Governance & Audited Financial Statements 2017Audited Financial Statements
65
Notes to the Financial Statements For The Financial Year Ended 31 December 2017
3. SIGNIFICANT ACCOUNTING POLICIES (CONTINUED)
(g) Offsetting financial instruments
Financial assets and liabilities are offset and the net amount presented in the statements of financial position when there is a legally enforceable right to offset the recognised amounts and there is an intention to settle on a net basis, or realise the asset and settle the liability simultaneously. The legally enforceable right must not be contingent on future events and must be enforceable in the normal course of business and in the event of default, insolvency or bankruptcy.
(h) Derivative financial instruments and hedging activities
Derivatives are initially recognised at fair value on the date a derivative contract is entered into and are subsequently re-measured at their fair value at the end of each reporting period.
The accounting for subsequent changes in fair value depends on whether the derivative is designated as a hedging instrument, and if so, the nature
of the item being hedged. Derivatives that do not qualify for hedge accounting are classified as held for trading and accounted for in accordance with the accounting policy set out in Note 3(f) to the financial statements. Derivatives that qualify for hedge accounting are designated as either:
• Hedges of the fair value of recognised assets or liabilities or a firm commitment (fair value hedge);• Hedges of a particular risk associated with a recognised asset or liability or a highly probable forecast transaction (cash flow hedge); or • Hedges of a net investment in a foreign operation (net investment hedge).
The Group and the Company document at the inception of the transaction, the relationship between hedging instruments and hedged items, as well as its risk management objectives and strategy for undertaking various hedging transactions. The Group and the Company also document its assessment, both at hedge inception and on an ongoing basis, of whether the derivatives that are used in hedging transactions are highly effective in offsetting changes in fair values or cash flows of hedged items.
The fair values of various derivative instruments used for hedging purposes are disclosed in Note 18 to the financial statements. Movements on the hedging reserve in OCI are shown in the statement of changes in equity of the financial statements. The full fair value of a hedging derivative is classified as a non-current asset or liability when the remaining hedged item is more than twelve (12) months and as a current asset or liability when the remaining maturity of the hedged item is less than twelve (12) months. Trading derivatives are classified as a current asset or liability.
(i) Fair value hedge
Changes in the fair value of derivatives that are designated and qualify as fair value hedges are recorded in the profit or loss, together with any changes in the fair value of the hedged asset or liability that are attributable to the hedged risk. The gain or loss relating to the effective portion of cross currency interest rate swaps (“CCIRS”) hedging fixed rate borrowings is recognised in the profit or loss within ‘finance costs’. The gain or loss relating to the ineffective portion is recognised in the profit or loss within ‘other gains/(losses) - net’. Changes in the fair value of the hedge fixed rate borrowings attributable to interest rate risk are recognised in the profit or loss within ‘finance cost’.
If the hedge no longer meets the criteria for hedge accounting, the adjustment to the carrying amount of a hedged item for which the effective interest method is used and is amortised to profit or loss over the period to maturity using a recalculated effective interest rate.
(ii) Cash flow hedge
The effective portion of changes in the fair value of derivatives that are designated and qualify as cash flow hedges is recognised in OCI and accumulated in reserves within equity. The gain or loss relating to the ineffective portion is recognised immediately in the profit or loss within ‘other gains/(losses) – net’.
Amounts accumulated in equity are reclassified to profit or loss in the periods when the hedged item affects profit or loss (for example, when the forecast sale that is hedged takes place). The gain or loss relating to the effective portion of interest rate swaps hedging variable rate borrowings is recognised in the profit or loss within ‘finance costs’. The gain or loss relating to the ineffective portion is recognised in the profit or loss within ‘other gains/(losses) - net’. However, when the forecast transaction that is hedged, results in the recognition of a non-financial asset, the gains and losses previously deferred in equity are transferred from equity and included in the initial measurement of the cost of the asset. The deferred amounts are ultimately recognised in cost of goods sold in the case of inventory or in depreciation in the case of PPE.
When a hedging instrument expires or is sold, or when a hedge no longer meets the criteria for hedge accounting, any cumulative gain or loss existing in equity at that time remains in equity and is recognised when the forecast transaction is ultimately recognised in the profit or loss. When a forecast transaction is no longer expected to occur, the cumulative gain or loss that was reported in equity is immediately transferred to the profit or loss within ‘other gains/(losses) – net’.
(iii) Net investment hedge
Hedges of net investments in foreign operations are accounted for similarly to cash flow hedges.
Any gain or loss on the hedging instrument relating to the effective portion of the hedge is recognised in OCI and accumulated in reserves within equity. The gain or loss relating to the ineffective portion is recognised immediately in the profit or loss within ‘other gains/(losses) – net’.
Gains and losses accumulated in equity are included in the profit or loss when the foreign operation is partially disposed of or sold.
Governance & Audited Financial Statements 2017Audited Financial Statements
66
Notes to the Financial Statements For The Financial Year Ended 31 December 2017
3. SIGNIFICANT ACCOUNTING POLICIES (CONTINUED)
(h) Derivative financial instruments and hedging activities (continued)
(iv) Derivatives that do not qualify for hedge accounting
Certain derivative instruments do not qualify for hedge accounting. Changes in the fair value of any derivative instrument that does not qualify for hedge accounting are recognised immediately in profit or loss and are included in ‘other gains/(losses) – net’.
(i) Inventories
Inventories are stated at lower of cost and net realisable value. Certain items such as spare parts, stand-by equipment and servicing equipment shall be recognised as PPE when they meet the definition of PPE
under MFRS 116. Otherwise, the items are classified as inventory.
Cost is determined on a weighted average basis and comprises all cost of purchase and other cost incurred in bringing the inventories to their present location.
Net realisable value represents the estimated selling price in the ordinary course of business, less all estimated costs to completion and applicable variable selling expenses. In arriving at the net realisable value, due allowance is made for all obsolete and slow moving items.
(j) Trade receivables and other receivables
Trade receivables are amounts due from customers for goods sold or services performed in the ordinary course of business. Other receivables generally arise from transactions outside the usual operating activities of the Group and the Company. If collection is expected in one (1) year or less (or in the normal operating cycle of the business if longer), they are classified as current assets. Otherwise, they are presented as non-current assets.
Trade and other receivables are recognised initially at fair value and subsequently measured at amortised cost using the effective interest method, less provision for impairment.
(k) Cash and cash equivalents
For the purpose of the statement of cash flows, cash equivalents are held for the purpose of meeting short-term cash commitments rather than for investment or other purposes. Cash and cash equivalents comprise cash on hand, deposits held at call with financial institutions, other short term, highly liquid investments with original maturities of three (3) months or less that are readily convertible to known amounts of cash and which are subject to an insignificant risk of changes in value.
Bank overdrafts which are repayable on demand and form an integral part of the Group’s cash management are included as a component of cash and cash equivalents in the statement of cash flows. Bank overdrafts are included within borrowings in current liabilities in the statement of financial position.
(l) Trade payables
Trade payables represent liabilities for goods or services provided to the Group prior to the end of financial year which are unpaid. Trade payables are classified as current liabilities unless payment is not due within twelve (12) months after the reporting period. If not, they are presented as non-current liabilities.
Trade payables are recognised initially at fair value and subsequently measured at amortised cost using the effective interest method.
(m) Borrowings
Borrowings are recognised initially at fair value, net of transaction costs incurred. Borrowings are subsequently carried at amortised cost using the effective interest method; any difference between proceeds (net of transaction costs) and the redemption value is recognised in the profit or loss over the period of the borrowings using the effective interest method.
Borrowings are removed from the statement of financial position when the obligation specified in the contract is discharged, cancelled or expired. The difference between the carrying amount of a financial liability that has been extinguished or transferred to another party and the consideration paid, including any non-cash assets transferred or liabilities assumed, is recognised in profit or loss.
Investment income earned on the temporary investment of specific borrowings pending their expenditure on qualifying assets is deducted from the borrowing costs eligible for capitalisation.
Fees paid on the establishment of loan facilities are recognised as transaction costs of the loan to the extent that it is probable that some or all of the facility will be drawn down. In this case, the fee is deferred until the draw-down occurs. To the extend there is no evidence that it is probable that some or all of the facility will be drawn down, the fee is capitalised as a pre-payment for liquidity services and amortised over the period of the facility to which it relates.
Borrowings are classified as current liabilities unless the Group and the Company have an unconditional right to defer settlement of the liability for
at least twelve (12) months after the end of the reporting period.

Governance & Audited Financial Statements 2017Audited Financial Statements
67
Notes to the Financial Statements For The Financial Year Ended 31 December 2017
3. SIGNIFICANT ACCOUNTING POLICIES (CONTINUED)
(n) Current and deferred tax
Tax expense for the period comprises current and deferred income tax. The income tax expense or credit for the period is the tax payable on the current period’s taxable income based on the applicable income tax rate for each jurisdiction adjusted by changes in deferred tax assets and liabilities attributable to temporary differences and to unused tax losses. Tax is recognised in profit or loss, except to the extent that it relates to items recognised in OCI or directly in equity. In this case the tax is also recognised in OCI or directly in equity, respectively.
The current income tax charge is calculated on the basis of the tax laws enacted or substantively enacted at the end of the reporting period in the countries where the Company and its subsidiaries operate and generate taxable income.
Management periodically evaluates positions taken in tax returns with respect to situations in which applicable tax regulation is subject to interpretation. It establishes provisions where appropriate on the basis of amounts expected to be paid to the tax authorities. This liability is measured using the single best estimate of the most likely outcome.
Deferred tax is provided in full, using the liability method, on temporary differences arising between the amounts attributed to assets and liabilities for tax purposes and their carrying amounts in the financial statements. However, deferred tax liabilities are not recognised if they arise from the initial recognition of goodwill. Deferred tax is also not accounted for if it arises from initial recognition of an asset or liability in a transaction other than a business combination that at the time of the transaction affects neither accounting nor taxable profit or loss. Deferred tax is determined using tax rates (and tax laws) that have been enacted or substantively enacted by the end of the reporting period and are expected to apply when the related deferred tax asset is realised or the deferred tax liability is settled.
Deferred tax assets are recognised to the extent that it is probable that taxable profit will be available against which the deductible temporary differences, unused tax losses or unused tax credits can be utilised.
Deferred tax is provided on temporary differences arising on investments in subsidiaries and associates, except for deferred tax liability where the timing of the reversal of the temporary difference is controlled by the Group and it is probable that the temporary difference will not be reversed in the foreseeable future. Generally the Group is unable to control the reversal of the temporary difference for associates. Only where there is an agreement in place that gives the Group the ability to control the reversal of the temporary difference not recognised.
Deferred tax assets and liabilities are offset when there is a legally enforceable right to offset current tax assets against current tax liabilities and when the deferred income taxes assets and liabilities relate to income taxes levied by the same taxation authority on either the same taxable entity or different taxable entities where there is an intention to settle the balances on a net basis.
Tax benefit from investment tax incentive is recognised when the tax credit is utilised and no deferred tax asset is recognised when the tax credit is claimed.
(o) Provisions
Provisions are recognised when the Group and the Company have a present legal or constructive obligation as a result of past events, when it is probable that an outflow of resources will be required to settle the obligation, and when a reliable estimate of the amount can be made. Where the Group and the Company expect a provision to be reimbursed (for example, under an insurance contract), the reimbursement is recognised as a separate asset but only when the reimbursement is virtually certain. Provisions are not recognised for future operating losses.
Where there are a number of similar obligations, the likelihood that an outflow will be required in a settlement is determined by considering the class of obligations as a whole. A provision is recognised even if the likelihood of an outflow with respect to any one item included in the same class of obligations may be small.
Provisions are measured at the present value of the expenditures expected to be required to settle the obligation using a pre-tax rate that reflects current market assessments of the time value of money and the risks specific to the obligation. The increase in the provision due to passage of time is recognised as finance cost.
Provision for liabilities is mainly provisions for dismantling, removal or restoration on identified sites. Provisions are reviewed at the end of the reporting period and adjusted to PPE to reflect the current best estimation. Where the time value of money is material, the amount of a provision is the present value of the future period expenditure expected to be required to settle the obligation.
(p) Contingent liabilities and contingent assets
The Group does not recognise a contingent liability but discloses its existence in the financial statements. A contingent liability is a possible obligation that arises from past events whose existence will be confirmed by uncertain future events beyond the control of the Group or a present obligation that is not recognised because it is not probable that an outflow of resources will be required to settle the obligation. A contingent liability also arises in the extremely rare circumstance where there is a liability that cannot be recognised because it cannot be measured reliably.
A contingent asset is a possible asset that arises from past events whose existence will be confirmed by uncertain future events beyond the control of the Group. The Group does not recognise a contingent asset but discloses its existence where inflows of economic benefits are probable, but not virtually certain.
In the acquisition of subsidiaries by the Group under a business combination, the contingent liabilities assumed are measured initially at their fair values at the acquisition date, irrespective of the extent of any NCI.

Governance & Audited Financial Statements 2017Audited Financial Statements
68
Notes to the Financial Statements For The Financial Year Ended 31 December 2017
3. SIGNIFICANT ACCOUNTING POLICIES (CONTINUED)
(p) Contingent liabilities and contingent assets (continued)
The Group recognises separately the contingent liabilities of the acquirers as part of allocating the cost of a business combination where their fair values can be measured reliably. Where the fair values cannot be measured reliably, the resulting effect will be reflected in the goodwill arising from the acquisitions.
Subsequent to the initial recognition, the Group measures the contingent liabilities that are recognised separately at the date of acquisition at the higher of the amount that would be recognised in accordance with the provisions of MFRS 137 “Provisions, Contingent Liabilities and Contingent Assets” and the amount initially recognised less, when appropriate, cumulative amortisation recognised in accordance with MFRS 118 “Revenue”.
(q) Share capital
(i) Classification
Ordinary shares and non-redeemable preference shares with discretionary dividends are classified as equity. Other shares are classified as equity and/or liability according to the economic substance of the particular instrument.
(ii) Share issue expenses
Incremental costs directly attributable to the issuance of new shares are deducted against equity.
(iii) Dividends to shareholders of the Company
Liability is recognised for the amount of any dividend declared, being appropriately authorised and no longer at the discretion of the Group, on or before the end of the reporting period but not distributed at the end of the reporting period.
Distributions to holders of an equity instrument is recognised directly in equity.
(r) Leases
A lease is an agreement whereby the lessor conveys to the lessee in return for a payment, or series of payments, the right to use an asset for an agreed period of time.
Accounting by lessee
(i) Finance leases
Leases of property, plant and equipment where the Group has substantially all the risks and rewards of ownership are classified as finance leases. Finance leases are capitalised at the lease’s commencement at the lower of the fair value of the leased property and the present value of the minimum lease payments. The corresponding rental obligations, net of finance charges, are included in other short-term and long-term payables.
Each lease payment is allocated between the liability and finance charges so as to achieve a constant rate of interest on the remaining balance of the liability. The finance cost is charged to profit or loss over the lease period so as to produce a constant periodic rate of interest on the remaining balance of the liability for each period. The PPE acquired under finance leases is depreciated over the shorter of the useful life of the asset and the lease term if there is no reasonable certainty that the Group will obtain ownership at the end of the lease term.
Deferred gain from sale and finance lease back transaction is amortised using straight line method over the lease period.
Initial direct costs incurred by the Group in negotiating and arranging finance leases are added to the carrying amount of the leased assets and recognised as an expense in profit or loss over the lease term on the same basis as the lease expense.
(ii) Operating leases
Leases of assets where a significant portion of the risks and rewards of ownership are retained by the lessor are classified as operating leases. Payments made under operating leases are charged to the profit or loss on a straight-line basis over the lease period.
Gain from sale and operating lease back transaction is directly recognised when the transaction occurs.
Initial direct costs incurred by the Group in negotiating and arranging operating leases are recognised in profit or loss when incurred.
Accounting by lessor
(i) Finance leases
When assets are leased out under a finance lease, the present value of the lease payments is recognised as a receivable. The difference between the gross receivable and the present value of the receivable is recognised as unearned finance income. Lease income is recognised over the term of the lease using the net investment method so as to reflect a constant periodic rate of return.

Governance & Audited Financial Statements 2017Audited Financial Statements
69
Notes to the Financial Statements For The Financial Year Ended 31 December 2017
3. SIGNIFICANT ACCOUNTING POLICIES (CONTINUED)
(r) Leases (continued)
Accounting by lessor (continued)
(ii) Operating leases
When assets are leased out under an operating lease, the asset is included in the statements of financial position based on the nature of the asset. Lease income is recognised over the term of the lease on a straight-line basis.
Initial direct costs incurred by the Group in negotiating and arranging operating leases are recognised in profit or loss when incurred.
(s) Revenue recognition
The Group’s operating revenue comprises the fair value of the consideration received or receivable for the sale of products and rendering of services net of returns, duties, sales discounts and sales taxes paid, after eliminating sales within the Group. The Group’s and the Company’s operating revenues are recognised or accrued at the time of the provision of the products or services.
(i) Mobile and interconnect services revenue
Revenue from mobile telephony services are recognised based on actual traffic volume, net of rebates or discounts.
Revenue from sales of prepaid starter packs and prepaid phone cards are deferred (as disclosed as deferred revenue in trade and other payables) and recognised as revenue based on the actual use of the cards, net of taxes and discounts. Any amounts not recognised are deferred, after which such amounts will be recognised as revenue.
Revenue from interconnection with other operators is recognised on the basis of actual recorded call traffic.
(ii) Lease and services of passive infrastructure
Lease revenue is generated from the leasing of space on the Group’s telecommunication towers, where the customers install and maintain their individual communication network equipment. Lease revenue from operating lease is recognised on a straight-line basis over the fixed and non-cancellable term of the lease agreement, irrespective of when payments are due.
Revenue from provision of passive infrastructure services to customers is recognised on an accrual basis based on prices agreed with customers through lease agreements.
(iii) Interest income
Interest income is recognised on a time-proportion basis using the effective interest method. When a receivable is impaired, the Group and the Company reduce the carrying amount to its recoverable amount, being the estimated future cash flow discounted at the original effective interest rate of the instrument, and continues unwinding the discount as interest income. Interest income on impaired loans is recognised using original effective interest rate.
(iv) Dividend income
Dividend income from investment in subsidiaries, joint ventures, associates and other investments is recognised when a right to receive payment is established. This applies even if they are paid out of pre-acquisition profits. However, the investment may need to be tested for impairment as a consequence.
(v) Technical and management services fees
Technical and management services fees comprise of fees for provision of support services to certain subsidiaries, which are recognised on an accrual basis.
(vi) Other revenues
All other revenues are recognised net of rebates or discounts upon the rendering of services or sale of products, when the transfers of risks and rewards have been completed.
(t) Employee benefits
(i) Short term employee benefits
Wages, salaries, paid annual leave and sick leave, bonuses, and non-monetary benefits that are expected to be settled wholly within twelve (12) months after the end of the period in which the employees render the related service are recognised in respect of employees’ services up to the end of the reporting period and are measured at the amounts expected to be paid when the liabilities are settled. The liabilities are presented as “Trade and other payables - payroll liabilities” in the statement of financial position.

Governance & Audited Financial Statements 2017Audited Financial Statements
70
Notes to the Financial Statements For The Financial Year Ended 31 December 2017
3. SIGNIFICANT ACCOUNTING POLICIES (CONTINUED)
(t) Employee benefits (continued)
(ii) Contribution to Employees Provident Fund (“EPF”)
The Group’s and the Company’s contributions to EPF are charged to the profit or loss in the period to which they relate. Once the contributions have been paid, the Group and the Company have no further payment obligations. Prepaid contributions are recognised as an asset to the extent that a cash refund or a reduction in the future payments is available.
(iii) Termination benefits
Termination benefits are payable when employment is terminated by the Group before the normal retirement date, or whenever an employee accepts voluntary redundancy in exchange for these benefits. The Group recognises termination benefits at the earlier of the following dates: (a) when the Group can no longer withdraw the offer of those benefits; and (b) when the entity recognises costs for a restructuring that is within the scope of MFRS 137 and involves the payment of termination benefits. In the case of an offer made to encourage voluntary redundancy, the termination benefits are measured based on the number of employees expected to accept the offer. Benefits falling due more than twelve (12) months after the end of the reporting period are discounted to their present value.
(iv) Share-based compensation
The Group operates a number of equity-settled and cash-settled share-based compensation plan by the Company and certain subsidiaries under which the entity receives services from employees as consideration for equity instruments (options) of the Group/certain subsidiaries. The fair value of the options granted in exchange for the services of the employees are recognised as employee benefit expense with a corresponding increase to share option reserve within equity. The total amount to be expensed is determined by reference to the fair value of the options granted:
- including any market performance conditions;- excluding the impact of any service and non-market performance vesting conditions; and- including the impact of any non-vesting conditions.
Non-market vesting conditions and service conditions are included in assumptions about the number of options that are expected to vest.
The total expense is recognised over the vesting period, which is the period over which all of the specified vesting conditions are to be satisfied. At the end of the reporting period, the Group and the Company revise its estimates of the number of options that are expected to vest based on the non-market vesting conditions and service conditions. It recognises the impact of the revision to original estimates, if any, in profit or loss, with a corresponding adjustment to share option reserve in equity.
When the options are exercised, the Company issues new shares. The proceeds received net of any directly attributable transaction costs are credited to share capital (nominal value) and share premium when the options are exercised. When options are not exercised and lapsed, the share option reserve is transferred to retained earnings.
In its separate financial statements of the Company, the grant by the Company of options over its equity instruments to the employees of subsidiaries in the Group is treated as services provided to the subsidiaries. The fair value of options granted to employees of the subsidiaries in exchange for the services of the employees to the subsidiaries are recognised as payables from subsidiaries, with a corresponding credit to equity of the Company.
(v) Post-employment benefit obligations
The Group operates various defined benefit plans in accordance with local conditions and practices in the countries in which it operates. The plans are generally funded through payments to insurance companies or trustee-administrated funds, determined by periodic actuarial calculations. A defined benefit plan is a pension plan that is not a defined contribution plan. Defined benefit plans define an amount of pension benefit that an employee will receive on retirement, usually dependent on one or more factors such as age, years of service and compensation.
The Group determines the present value of the defined benefit obligation and the fair value of any plan assets with sufficient regularity such that the amounts recognised in the financial statements do not differ materially from the amounts that would be determined at the end of the reporting period. The liability recognised in the statement of financial position in respect of defined benefit pension plans is the present value of the defined obligation at the end of the reporting period less the fair value of plan assets, together with adjustments for actuarial gains/losses and unrecognised past-service costs.
The defined benefit obligation is calculated annually by independent actuaries using projected unit credit method. The present value of the defined benefit obligation is determined by discounting the estimated future cash flows using interest rates of high-quality corporate bonds that are denominated in the currency in which the benefits will be paid, and that have terms to maturity approximately to the terms of related pension obligation. In countries where there is no deep market in such bonds, the market rates on government bonds are used.
Remeasurement, comprising actuarial gains and losses arising from experience adjustments and changes in actuarial assumptions, are charged or credited to equity in OCI in the period in which they arise and will not be reclassified to profit or loss.
Past-service costs are recognised immediately in profit or loss.

Governance & Audited Financial Statements 2017Audited Financial Statements
71
Notes to the Financial Statements For The Financial Year Ended 31 December 2017
3. SIGNIFICANT ACCOUNTING POLICIES (CONTINUED)
(t) Employee benefits (continued)
(v) Post-employment benefit obligations (continued)
The current service cost of the defined benefit plan reflects the increase in the defined benefit obligation resulting from employee service in the current year. It is recognised in profit or loss in employee benefit expense, except where included in the cost of an asset.
The net interest cost is calculated by applying the discount rate to the net balance of the defined benefit obligation and the fair value of plan assets. This cost is included in employee benefit expense in the statement of comprehensive income.
Changes in the present value of the defined benefit obligation resulting from plan amendments or curtailments are recognised immediately in profit or loss as past service costs.
(vi) Cash-Based Long Term Incentive ("LTI") compensation
The Group and the Company recognise a liability and an expense for cash-based long term incentive compensation and over the vesting period, based on a formula that takes into consideration the number of employees, a performance multiplier and discount rate. Provision is recognised when the Group and the Company have a present legal or constructive obligation as a result of past events.
(u) Deferred revenue
Deferred revenue comprises:
(i) The unutilised balance of airtime, data and access fee in respect of prepaid cards sold to customers. Such revenue amounts are recognised as revenue upon utilisation of airtime and activation of access right by the customer.
(ii) The value of advance billings made to customers in respect of the rental of fibre optic network. Such amounts are recognised as revenue systematically over the period covered by the advance billings.
(v) Indefeasible right of use (“IRU”)
The Group has entered into certain IRU agreements with its customers. An IRU is a right to use a specified amount of capacity for a specific time period that cannot be revoked or voided. Such agreements are accounted for either as lease or service transactions.
Those IRU agreements that provide the lessee with exclusive right to the purchased capacity and limit the purchased capacity to a specified fibre are accounted as lease transactions. Other IRUs are accounted for as service contracts.
IRU agreements that transfer substantially all the risks and rewards of ownership to the lessee are classified as sale-type leases. All other IRU leases are classified as operating leases.
(w) Foreign currencies
(i) Functional and presentation currency
Items included in the financial statements of each of the Group’s entities are measured using the currency of the primary economic environment in which the entity operates. The consolidated financial statements are presented in RM, which is the Company’s functional and presentation currency.
(ii) Transactions and balances
Foreign currency transactions are translated into the functional currency using the exchange rates prevailing at the dates of the transactions or valuation where items are remeasured. Foreign exchange gains and losses resulting from the settlement of such transactions and from the translation at year-end exchange rates of monetary assets and liabilities (inclusive of advances to subsidiaries treated as quasi-investments) denominated in foreign currencies are recognised in profit or loss. However, exchange differences are deferred in OCI when they arose from qualifying cash flow or net investment hedges or are attributable to items that form part of the net investment in a foreign operation.
Foreign exchange gains and losses that relate to borrowings are presented in the profit or loss within ‘finance cost’. All other foreign exchange gains and losses are presented in profit or loss within ‘foreign exchange gains/(losses)’.
Changes in the fair value of monetary securities denominated in foreign currency classified as AFS are analysed between translation differences resulting from changes in the amortised cost of the securities and other changes in the carrying amount of the securities. Translation differences related to changes in amortised cost are recognised in the profit or loss for the financial year, and other changes in carrying amount are recognised in OCI.

Governance & Audited Financial Statements 2017Audited Financial Statements
72
Notes to the Financial Statements For The Financial Year Ended 31 December 2017
3. SIGNIFICANT ACCOUNTING POLICIES (CONTINUED)
(w) Foreign currencies (continued)
(iii) Group companies (Consolidated financial statements)
The results and financial position of all the Group entities (none of which has the currency of a hyperinflationary economy) that have a functional currency different from the presentation currency are translated into the presentation currency as follows:
• assets and liabilities for each statement of financial position presented are translated at the closing rate at the date of that statements of financial position;
• income and expenses for each statements of comprehensive income are translated at average exchange rates (unless this average is not a reasonable approximation of the cumulative effect of the rates prevailing on the transaction dates, in which case income and expenses are translated at the rate on the dates of the transactions); and
• all resulting exchange differences are recognised as a separate component of OCI.
Goodwill and fair value adjustments arising on the acquisitions of a foreign entity are treated as assets and liabilities of the foreign entity and translated at the closing rate. Exchange differences arising are recognised in OCI.
On consolidation, exchange differences arising from the translation of any net investment in foreign entities, and of borrowings and other financial instruments designated as hedges of such investments, are recognised in OCI.
On the disposal of a foreign operation (that is, a disposal of the Group’s entire interest in a foreign operation, or a disposal involving loss of control over a subsidiary that includes a foreign operation, a disposal involving loss of joint control over a joint venture that includes a foreign operation, or a disposal involving loss of significant influence over an associate that includes a foreign operation), all of the exchange differences relating to that foreign operation recognised in consolidated OCI and accumulated in the separate component of equity are reclassified to consolidated profit or loss. In the case of a partial disposal that does not result in the Group losing control over a subsidiary that includes a foreign operation, the proportionate share of accumulated exchange differences are re-attributed to NCIs and are not recognised in consolidated profit or loss. For all other partial disposals (that is, reductions in the Group’s ownership interest in associates or joint ventures that do not result in the Group losing significant influence or joint control) the proportionate share of the accumulated exchange difference is reclassified to profit or loss.
(x) Segment reporting
Operating segments are reported in a manner consistent with the internal reporting provided to the Chief Operating Decision maker. The Chief Operating Decision maker, who is responsible for allocating resources and assessing performance of the operating segments, has been identified as the Board of Directors that makes strategic decisions.
(y) Government grants
As a Universal Service Provider (“USP”), the Group is entitled to claim certain qualified expenses from the relevant authorities in relation to USP projects. The claim qualifies as a government grant and is recognised at fair value where there is a reasonable assurance that the grant will be received and the Group will comply with all attached conditions.
Government grants relating to costs are recognised in the profit of loss over the period necessary to match them with the costs they are intended to compensate.
Government grants relating to the purchase of assets are included in non-current liabilities as deferred income and are credited to the profit or loss on the straight line basis over the expected life of the related assets.
(z) Non-current assets (or disposal groups) classified as held-for-sale
Non-current assets (or disposal groups) are classified as assets held for sale when their carrying amount is to be recovered principally through a sale transaction and a sale is considered highly probable. They are stated at the lower of carrying amount and FVLCS.
4. CRITICAL ACCOUNTING ESTIMATES AND JUDGEMENTS
Estimates and judgements are continually evaluated by the Directors and are based on historical experience and other factors, including expectations of future events that are believed to be reasonable under the circumstances.
(a) Critical judgements in applying the Group’s and Company’s accounting policies
In determining and applying accounting policies, judgement is often required in respect of items where the choice of specific policy could materially affect the reported results and financial position of the Group and the Company. The following accounting policies require subjective judgements, often as a result of the need to make estimates about the effect of matters that are inherently uncertain.

Governance & Audited Financial Statements 2017Audited Financial Statements
73
Notes to the Financial Statements For The Financial Year Ended 31 December 2017
4. CRITICAL ACCOUNTING ESTIMATES AND JUDGEMENTS
(a) Critical judgements in applying the Group’s and Company’s accounting policies (continued)
Intangible assets – acquired telecommunication licenses with allocated spectrum rights
The Group has applied judgement in determining the treatment of the annual fees payable over ten (10) years in respect of a 3G spectrum license granted to a foreign subsidiary. The annual fee is charged to the profit or loss when incurred based on management’s judgement that future annual fees will no longer be payable upon the decision by the subsidiary to return the license. The Group considers the annual payment to be usage fees based on interpretation of the license conditions, written confirmation from the Directorate General of Post and Telecommunication, Indonesia. The annual fees are therefore not considered part of the acquisition cost of the license.
Should the regulations and conditions with regards to the payment of the annual fees be amended in the future with the consequence that payment of the remaining outstanding annual fees cannot be avoided upon the subsidiary surrendering the license, the Group will recognise an intangible asset and a corresponding liability at the present value of the remaining annual fees at that point in time.
Intangible assets – estimated useful life of telecommunication licenses with allocated spectrum rights
The telecommunication licenses with allocated spectrum rights acquired by a subsidiary via business combination are not subject to amortisation and are tested annually for impairment as the Group in the opinion that the licenses can be renewed in perpetuity at negligible cost and the associated spectrum rights, similar to land, have an indefinite economic useful life. The estimated indefinite economic useful life reflects the Group’s expectation of the period over which the Group will continuously recover the benefits from the licenses.
(b) Critical accounting estimates and assumptions
The Group makes estimates and assumptions concerning the future. The resulting accounting estimates will, by definition, rarely equal the related actual results. The Group, and to a large extent the activities, are governed by the legal, regulatory and business environment in the countries which the Group operates in and which the Group has investments in. The business of the Group is subject to a number of risks, many of which are beyond the Group’s control.
The main risks relating to the Group’s business are as follows:
- Increasing competition in the countries the Group operates in- Challenges in expanding business in certain emerging markets- Political, regulatory and social developments in the region the Group operates in- Significant expansion of capital investments required- Increasing substitution for traditional voice and data market
To enhance the information content of the estimates, certain key variables that are anticipated to have material impact to the Group’s results and financial position are tested for sensitivity to changes in the underlying parameters. The estimates and assumptions that have a significant risk of causing a material adjustment to the carrying amounts of assets and liabilities within the next year are mentioned below.
(i) Impairment assessment of goodwill
The Group tests goodwill for impairment annually in accordance with its accounting policy or more frequently if events or change in circumstances indicate that this is necessary within the financial year. Recoverable amount is measured at the higher of the FVLCS for that asset and its VIU.
These calculations require the use of estimates. The calculations are inherently judgemental and susceptible to change from period to period because they require the Group to make assumptions about revenue growth, an appropriate discount rate and terminal growth rate.
The assumptions used, results and sensitivities of the impairment assessment of goodwill are disclosed in Note 24 to the financial statements.
(ii) Impairment assessment on non-financial assets (excluding goodwill)
The Group and the Company assess impairment of the assets or CGUs whenever the events or changes in circumstances indicate that the carrying amount of an asset or CGU may not be recoverable i.e. the carrying amount of the asset is more than the recoverable amount. Recoverable amount is measured at the higher of the FVLCS for that asset or CGU and its VIU.
Projected future cash flows used in impairment testing of the assets or CGUs are based on Group’s and Company’s estimates calculated based on historical, sector and industry trends, general market and economic conditions, changes in technology and other available information.
The recoverable amounts of the asset or CGUs are determined based on VIU or FVLCS calculations. These calculations require the use of estimates. The calculations are inherently judgemental and susceptible to change from period to period because they require the Group and the Company to make assumptions about EBITDA margin, an appropriate discount rate and terminal growth rate.
The assumptions used and results of the impairment assessment of investment in an associate are disclosed in Note 27 to the financial statements.

Governance & Audited Financial Statements 2017Audited Financial Statements
74
Notes to the Financial Statements For The Financial Year Ended 31 December 2017
4. CRITICAL ACCOUNTING ESTIMATES AND JUDGEMENTS
(b) Critical accounting estimates and assumptions (continued)
(iii) Estimated useful lives of PPE
The Group reviews the estimated useful lives of PPE based on network and information technology (“IT”) modernisation being planned by the Group. The network and IT modernisation involves estimating when the assets will be upgraded based on the approved modernisation plans and the useful lives of the network and IT assets are revised accordingly. Future results of operations could be materially affected by changes in these estimates brought about by changes in the factors mentioned. A reduction in the estimated useful lives of PPE would increase the recorded depreciation charge and decrease the PPE balance.
(iv) Taxation
Income taxes
The Group and the Company are subject to income tax in numerous jurisdictions. Judgement is involved in determining the group-wide provision for income taxes. There are certain transactions and computations for which the ultimate tax determination is uncertain during the ordinary course of business. The Group and the Company recognise liabilities for tax matters based on estimates of whether additional taxes will be due. If the final outcome of these tax matters result in a difference in the amounts initially recognised, such differences will impact the income tax and/or deferred tax provisions in the period in which such determination is made.
Deferred tax assets
Deferred tax asset is recognised to the extent that it is probable that future taxable profit will be available against which temporary differences can be utilised. This involves judgement regarding future financial performance of a particular entity in which the deferred tax asset has been recognised.
(v) Contingent liabilities
Determination of the treatment of contingent liabilities is based on the Group’s view of the expected outcome of contingencies after consulting legal counsel for litigation cases and internal and external experts of the Group for matters in the ordinary course of business. Please refer to Note 27 and Note 36(d) to the financial statements for legal proceedings that the Group is involved in as at the end of each reporting period.
(vi) Fair value of derivatives and other financial instruments
Certain financial instruments such as investments and derivative financial instruments are carried on the statement of financial position at fair value, with changes in fair value reflected in the profit or loss.
Fair values are estimated by reference in part to published price quotations and in part by using valuation techniques. The fair value of financial instruments that are not traded in an active market (for example, over-the-counter derivatives) is determined by using valuation techniques. The Group uses its judgement to select a variety of methods and make assumptions that are mainly based on market conditions existing at the end of each financial reporting period.
(vii) Provision for dismantling, removal or restoration
Fair value estimates of provision for dismantling, removal or restoration generally involve discounted future cash flows, and periodic accretion of such liabilities due to the passage of time is recorded as finance cost. The significant assumptions used in estimating the provision are: timing of assets removals; cost of assets removals; expected inflation rates; and the discount rates. There can be no assurances that actual costs and the probability of incurring obligations will not differ from these estimates.

Governance & Audited Financial Statements 2017Audited Financial Statements
75
Notes to the Financial Statements For The Financial Year Ended 31 December 2017
5. INCORPORATIONS, ACQUISITIONS, DISSOLUTIONS, DISPOSAL AND DILUTIONS OF INTERESTS
(a) Incorporations, acquisitions, disposal and dilutions of interests during the financial year
(i) Incorporation of Axiata Digital Ecode Sdn Bhd (“ADE”)
Axiata Digital Services Sdn Bhd (“ADS”), had on 9 January 2017 completed the incorporation of ADE, a private company limited by shares, under the Companies Act, 1965 with an issued and paid-up share capital of ADE is RM2. Subsequently, ADE increased its paid-up capital to RM15.0 million via issuance of 14,999,998 ordinary shares.
The incorporation above did not have any significant impact to the Group during the financial year.
(ii) Acquisition of 31.01% equity interest in edotco Bangladesh Co. Ltd. (“edotco BD”) by edotco Investments (Labuan) Limited (“edotco Labuan”) from Robi Axiata Limited.
On 19 January 2017, a call option exercise to acquire 31.01% of the issued and paid up capital of edotco BD pursuant to a sale and purchase agreement dated 5 November 2014 was completed by edotco Group Sdn Bhd (“edotco Group”) via edotco Labuan. Accordingly, the Group’s effective interest in edotco BD increased from 84.03% to 93.74%.
The internal restructuring above did not have material impact to the Group during the financial year.
(iii) Private placement of edotco Group and share divestment in edotco Group
On 27 January 2017, the private placement of edotco Group and the share divestment on edotco Group by the Company were completed with:
• 409,904,436 edotco Group’s ordinary shares were issued to Innovation Network Corporation of Japan (“INCJ”), at a cash consideration of USD300.0 million (RM1,329.1 million); and
• 273,269,624 edotco Group’s ordinary shares were disposed to Mount Bintang Ventures Sdn Bhd at a gross purchase consideration of USD200.0 million (RM888.7 million).
In conjunction with the private placement above, edotco Group had further issued the following:
• On 18 April 2017, a total 136,634,813 ordinary shares were issued to INCJ for a cash consideration of USD100.0 million (RM435.0 million); and
• On 28 April 2017, a total 136,634,813 ordinary shares were issued to Kumpulan Wang Persaraan (Diperbadankan) for a cash consideration of USD100.0 million (RM441.0 million); and
With the completion of the transactions above, the Group’s effective shareholding in edotco Group decreased from 100.00% to 62.37%. The Group recorded the following in the consolidated statement of changes in equity during the financial year as below:
Consolidated statements of changes in equity
Forex exchange
reservesRM’000
Other reserves
RM’000
Retained earnings
RM’000
Non-controlling
interestsRM’000
TotalRM’000
Private placement 724 40,087 1,229,623 908,552 2,178,986
Divestment (1,592) 18,884 590,475 278,428 886,195
(iv) Acquisition of 12.28% equity interest in Milvik AB
ADS had on 3 March 2017 entered into a Subscription Agreement with Kinnivek New Ventures AB, Milicom Holding 100 B.V., Leapfrog Financial Inclusion (Luxembourg) S.a r.l, Future Holdings Limited, Anders Olsson and the Pensioneer Trustee Company (Guernsey) Limited, Gustaf Agartson and Mathilda Strom for the acquisition of 12.28% or 1,523,116 ordinary shares of Milvik AB at a consideration of USD16.8 million (RM74.2 million). The above transaction was completed on 23 March 2017 and effectively Milvik AB became an associate of the Group.
The investment above did not have significant impact to the Group during the financial year.

Governance & Audited Financial Statements 2017Audited Financial Statements
76
Notes to the Financial Statements For The Financial Year Ended 31 December 2017
5. INCORPORATIONS, ACQUISITIONS, DISSOLUTIONS, DISPOSAL AND DILUTIONS OF INTERESTS (CONTINUED)
(a) Incorporations, acquisitions, disposal and dilutions of interests during the financial year (continued)
(v) Acquisitions of equity interest in Unlockd Media Pty Ltd. (“Unlockd”)
ADS, had on 6 March 2017 entered into a Share Subscription Agreement (“SSA”) with Unlockd for the acquisition of the following equity interests:
• Tranche 1: On 19 May 2017, ADS acquired 127,258 ordinary shares at a cash consideration of USD5.0 million (RM21.6 million) and 151,370 ordinary shares at a consideration of USD5.9 million (RM25.7 million) in exchange for intangible assets held by ADS. Effectively Unlockd became a 9.60% owned associate of the Group;
• Tranche 2: 76,355 ordinary shares at a consideration of USD3.0 million (RM12.1 million). ADS shall further subscribe for Tranche 2 subject to ADS achieving the additional conditions precedent as per the SSA. On 7 December 2017, ADS subscribed 38,177 shares for a cash consideration of USD1.5 million (RM6.2 million), increasing ADS’s equity interest in Unlockd from 9.60% to 10.05%.
The investment above did not have significant impact to the Group during the financial year.
(vi) Investment in Etobee Holding Pte Ltd. (“Etobee”)
ADS, had on 15 March 2017 entered into a Subscription Agreement (“SA”) with the Investors, Kejora Investment Partners Pte Ltd, Gobi Partners, the Founders, namely Sven Milder and Iman Kusnadi and the existing shareholders, namely PT Kejora Digital Venturanusa, Bang Bang Venture Pte Ltd, Jimmy Setiadi Wibowo and PT Skystar Kapital Indonesia and Etobee for the acquisition of 20.31% or 300 Series A Preference Share of Etobee which will be split into 2 tranches as below:
• Tranche 1 – On 22 May 2017, ADS acquired 16.30% or 200 Series A Preference Share at a consideration of USD1.0 million (RM4.31 million). Effectively Etobee became an associate of the Group; and
• Tranche 2 – additional 4.01% or 100 Series A Preference Share at a consideration of USD0.5 million (RM2.0 million). ADS shall further subscribe for Tranche 2 subject to ADS achieving the additional conditions precedent as per the SA.
The investment above did not have any significant impact to the Group during the financial year.
(vii) Additional investment in Headstart (Private) Limited (“Headstart”)
Digital Holdings Lanka (Private) Limited (“DHL”), a subsidiary of Dialog Axiata PLC, proceeded with the conversion to equity the ‘Bond type B’ and ‘Bond type C’ in Headstart, consisting of 414 ordinary shares on 15 March 2017. Subsequent to the said conversion, the total shareholding of DHL in Headstart increased from 26.00% to 43.37%.
The additional investment above did not have significant impact to the Group during the financial year.
(viii) Investments in Localcube Commerce Private Limited (“Localcube”)
On 7 April 2016, the Group via Axiata Investments (Mauritius) Limited ("AIM"), a wholly-owned subsidiary of ADS entered into a Share Subscription Agreement with Localcube and the promoters, namely Sridhar Gundaiah and Govardhan Krishnappa Kadaliah for the issuance of 6,236 Compulsorily Convertible Preference Shares of Localcube at par value of INR10 per share representing 25.22% of issued and paid up capital of Localcube for a total consideration of RM51.6 million (USD12.8 million).
On 12 May 2017, the Group further subscribed the remaining 1,559 Compulsorily Convertible Preference Shares of Localcube at par value of INR10 per share resulting in AIM’s total shareholding of 29.65% of issued and paid up capital of Localcube for a total consideration of RM14.2 million (USD3.2 million).
The investments above did not have any significant impact to the Group.
(ix) Disposal of 10.00% equity interest in Axiata (Cambodia) Holdings Limited (“ACH”)
On 19 May 2017, the Company and its wholly owned subsidiary, Axiata Investments (Cambodia) Limited (“AIC”) entered into a Share and Purchase Agreement (“SPA”) with M&Y Asia Telecom Holdings Pte. Ltd. (“MY Asia”) and Mitsui & Co., Ltd. (“Mitsui”) for the disposal by AIC of 226 ordinary shares of USD1 each in ACH, the holding company of Smart Axiata Co., Ltd. ("Smart"), representing 10.00% of the total issued and paid-up share capital of ACH, for a total cash consideration of USD66.0 million (RM285.7 million) (“Initial Sale”). Mitsui and the Company are the guarantors for MY Asia’s and AIC’s obligations, respectively under the SPA.
Pursuant to the Initial Sale, AIC also entered into an Amended and Restated Shareholders Agreement with MY Asia and Southern Coast Ventures Inc. (“SCV”) to govern their relationship as shareholders of ACH which includes inter-alia, a call option to MY Asia for further 10.00% stake in ACH.
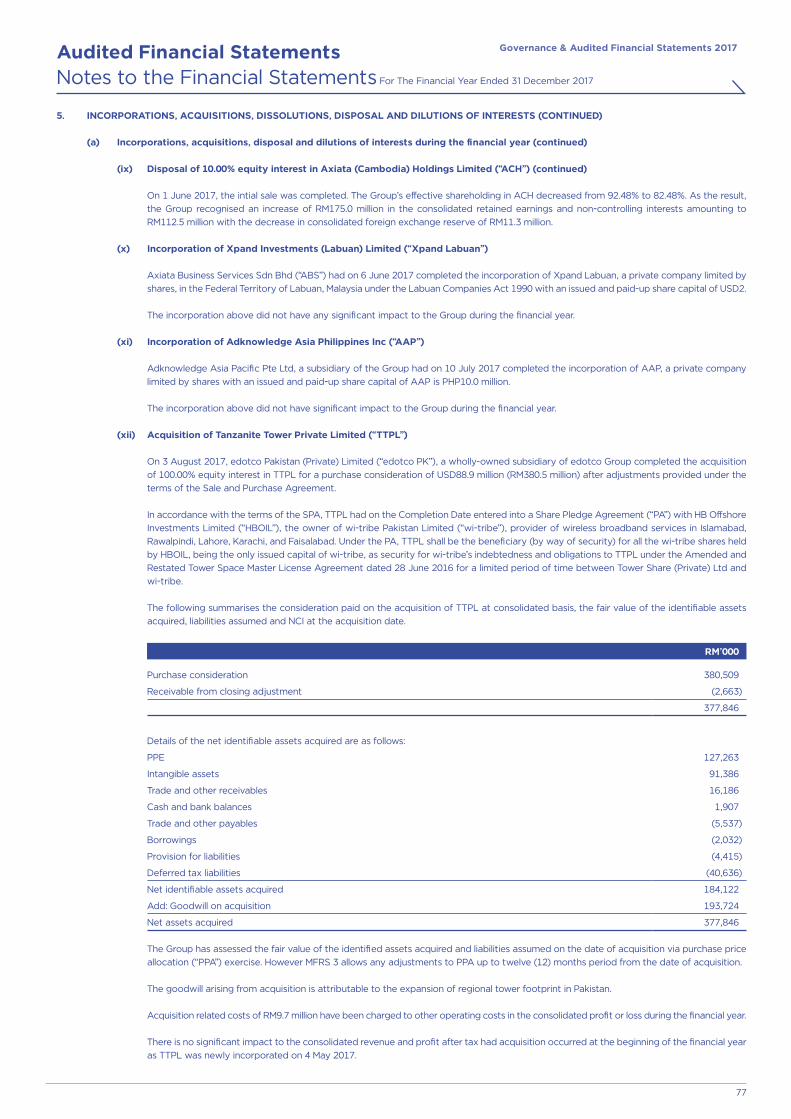
Governance & Audited Financial Statements 2017Audited Financial Statements
77
Notes to the Financial Statements For The Financial Year Ended 31 December 2017
5. INCORPORATIONS, ACQUISITIONS, DISSOLUTIONS, DISPOSAL AND DILUTIONS OF INTERESTS (CONTINUED)
(a) Incorporations, acquisitions, disposal and dilutions of interests during the financial year (continued)
(ix) Disposal of 10.00% equity interest in Axiata (Cambodia) Holdings Limited (“ACH”) (continued)
On 1 June 2017, the intial sale was completed. The Group’s effective shareholding in ACH decreased from 92.48% to 82.48%. As the result, the Group recognised an increase of RM175.0 million in the consolidated retained earnings and non-controlling interests amounting to RM112.5 million with the decrease in consolidated foreign exchange reserve of RM11.3 million.
(x) Incorporation of Xpand Investments (Labuan) Limited (“Xpand Labuan”)
Axiata Business Services Sdn Bhd (“ABS”) had on 6 June 2017 completed the incorporation of Xpand Labuan, a private company limited by shares, in the Federal Territory of Labuan, Malaysia under the Labuan Companies Act 1990 with an issued and paid-up share capital of USD2.
The incorporation above did not have any significant impact to the Group during the financial year.
(xi) Incorporation of Adknowledge Asia Philippines Inc (“AAP”)
Adknowledge Asia Pacific Pte Ltd, a subsidiary of the Group had on 10 July 2017 completed the incorporation of AAP, a private company limited by shares with an issued and paid-up share capital of AAP is PHP10.0 million.
The incorporation above did not have significant impact to the Group during the financial year.
(xii) Acquisition of Tanzanite Tower Private Limited (“TTPL”)
On 3 August 2017, edotco Pakistan (Private) Limited (“edotco PK”), a wholly-owned subsidiary of edotco Group completed the acquisition of 100.00% equity interest in TTPL for a purchase consideration of USD88.9 million (RM380.5 million) after adjustments provided under the terms of the Sale and Purchase Agreement.
In accordance with the terms of the SPA, TTPL had on the Completion Date entered into a Share Pledge Agreement (“PA”) with HB Offshore Investments Limited (“HBOIL”), the owner of wi-tribe Pakistan Limited (“wi-tribe”), provider of wireless broadband services in Islamabad, Rawalpindi, Lahore, Karachi, and Faisalabad. Under the PA, TTPL shall be the beneficiary (by way of security) for all the wi-tribe shares held by HBOIL, being the only issued capital of wi-tribe, as security for wi-tribe’s indebtedness and obligations to TTPL under the Amended and Restated Tower Space Master License Agreement dated 28 June 2016 for a limited period of time between Tower Share (Private) Ltd and wi-tribe.
The following summarises the consideration paid on the acquisition of TTPL at consolidated basis, the fair value of the identifiable assets acquired, liabilities assumed and NCI at the acquisition date.
RM’000
Purchase consideration 380,509
Receivable from closing adjustment (2,663)
377,846
Details of the net identifiable assets acquired are as follows:
PPE 127,263
Intangible assets 91,386
Trade and other receivables 16,186
Cash and bank balances 1,907
Trade and other payables (5,537)
Borrowings (2,032)
Provision for liabilities (4,415)
Deferred tax liabilities (40,636)
Net identifiable assets acquired 184,122
Add: Goodwill on acquisition 193,724
Net assets acquired 377,846
The Group has assessed the fair value of the identified assets acquired and liabilities assumed on the date of acquisition via purchase price allocation (“PPA”) exercise. However MFRS 3 allows any adjustments to PPA up to twelve (12) months period from the date of acquisition.
The goodwill arising from acquisition is attributable to the expansion of regional tower footprint in Pakistan.
Acquisition related costs of RM9.7 million have been charged to other operating costs in the consolidated profit or loss during the financial year.
There is no significant impact to the consolidated revenue and profit after tax had acquisition occurred at the beginning of the financial year as TTPL was newly incorporated on 4 May 2017.

Governance & Audited Financial Statements 2017Audited Financial Statements
78
Notes to the Financial Statements For The Financial Year Ended 31 December 2017
5. INCORPORATIONS, ACQUISITIONS, DISSOLUTIONS, DISPOSAL AND DILUTIONS OF INTERESTS (CONTINUED)
(a) Incorporations, acquisitions, disposal and dilutions of interests during the financial year (continued)
(xiii) Acquisition of Suvitech Co. Ltd. (“Suvitech”)
On 15 May 2017, ABS entered into a Share Sale and Purchase Agreement for the acquisition of 65.00% of the issued share capital of Suvitech at a consideration of USD11.1 million (equivalent to RM47.9 million). The acquisition was completed by ABS through its wholly-owned subsidiary, Xpand Labuan on 16 August 2017.
The acquisition above did not have significant impact to the Group during the financial year.
(xiv) Disposal of PT XL Planet (“XLJV”)
On 22 August 2017, PT XL Axiata Tbk (“XL”) and SK Planet Global Holdings Pte Ltd entered into a Conditional Sales and Purchase Agreement to sell its entire ownership share in XLJV to PT Jaya Kencana Mulia Lestari and Superb Premium Pte Ltd. On 29 August 2017, the Purchasers have been given full control over the management of XLJV. Accordingly the Group recorded a total loss on disposal amounting to RM54.4 million relating to this disposal.
(xv) Registration of SADIF LP (“SADIF”)
Smart had on 8 September 2017 registered SADIF a limited partnership, in Labuan, under the Labuan Limited Partnerships and Limited Liability Partnerships Act 2010.
SADIF was registered with 80.00% of the limited partnership held by Smart and the remaining 19.00% and 1.00% held by Forte Investment Holdings Co., Ltd and Mekong Strategic Ventures, respectively.
The registration above did not have significant impact to the Group during the financial year.
(xvi) Acquisition of Colombo Trust Finance PLC (“CTF”)
On 12 September 2017, Dialog acquired a total of 37,374,598 ordinary shares of CTF, a finance company licensed by the Central Bank of Sri Lanka, representing 80.34% of the voting rights in CTF. The shares were acquired at a price of LKR 28.70 per share amounting to a total consideration of LKR1.1 billion (RM29.6 million).
In accordance with the Takeovers and Mergers Code of the Securities and Exchange Commission of Sri Lanka, the Company made a mandatory offer to the remaining shareholders of CTF to acquire the remaining 9,144,645 ordinary voting shares held by such shareholders in CTF at an offer price of LKR 28.70 per share.
On 2 November 2017, Dialog increased its stake in CTF to 98.87% following the mandatory offer which has netted 8,619,031 million shares or 18.53%. The shares were acquired at a price of LKR 28.70 per share amounting to a total consideration of LKR247.4 million (RM6.6 million). With the latest addition, Dialog now holds 45,993,629 million shares or 98.87% stake in CTF.
The acquisition above did not have significant impact to the Group during the financial year.
(xvii) Incorporation of Merchantrade Digital Services Sdn Bhd (“MDS”)
ADS had on 13 September 2017 completed the incorporation of MDS, a private company limited by shares, under the Companies Act 2016 with paid up share capital of RM1,000 of which 51.00% is held by ADS and the remaining by Merchantrade Asia Sdn Bhd (“MAS”), which is a joint venture of the Group. MDS is the designated vehicle for the joint venture between ADS and MAS to carry out the business of digital financial services and solution provider.
The incorporation above did not have any significant impact to the Group during the financial year.
(xviii) Incorporation of Axiata Digital Bangladesh (Private) Limited (“ADB”)
ADS, had on 11 October 2017 completed the incorporation of ADB, a private company limited by shares, in People’s Republic of Bangladesh, under the Companies Act (Bangladesh) 1994. The issued and paid-up share capital of ADB is BDT1.6 million divided into 16,000 ordinary shares of BDT100 each.
The incorporation above did not have any significant impact to the Group during the financial year.
(xix) Incorporation of Dialog Axiata Digital Innovation Fund (Private) Limited (“DADIF”)
DHL together with ADS and BOV Capital (Private) Limited (“BOV”) incorporated DADIF on 12 October 2017, with the objective of establishing and operating a venture capital fund for the investment in digital start-up businesses. At present, BOV holds 2 shares whilst DHL and ADS hold 1 share each of DADIF.
The incorporation above did not have any significant impact to the Group during the financial year.

Governance & Audited Financial Statements 2017Audited Financial Statements
79
Notes to the Financial Statements For The Financial Year Ended 31 December 2017
5. INCORPORATIONS, ACQUISITIONS, DISSOLUTIONS, DISPOSAL AND DILUTIONS OF INTERESTS (CONTINUED)
(a) Incorporations, acquisitions, disposal and dilutions of interests during the financial year (continued)
(xx) Incorporation of PT Axiata Digital Analytics Indonesia (“PTADAI”)
Axiata Digital Advertising Sdn Bhd.(“ADASB”), a wholly-owned subsidiary of ADS, had on 25 October 2017 incorporated a new subsidiary, PTADAI, a limited liability company under Indonesian Law No. 40 of 2007 with an approved share capital of USD250,000.
The incorporation above did not have any significant impact to the Group during the financial year.
(xxi) Incorporation of PT Axiata Digital Services Indonesia (“PTADSI”)
ADS had on 16 November 2017 incorporated PTADSI, a limited liability company under Indonesian Law No. 40 of 2007 with an approved share capital of USD250,000.
The incorporation above did not have any significant impact to the Group during the financial year.
(xxii) Incorporation of APIgate Sdn Bhd (“APIgate”)
ADS had on 12 December 2017 completed the incorporation of APIgate, a private company limited by shares, under the Companies Act 2016 with an issued and paid-up share capital of RM2.
The incorporation above did not have any significant impact to the Group during the financial year.
(xxiii) Incorporation of On Site Services Sdn Bhd (“On Site Services”)
Celcom Axiata Berhad (“Celcom”) had on 18 December 2017 completed the incorporation of On Site Services, a private company limited by shares, under the Companies Act 2016 with an issued and paid-up share capital of RM2.
The incorporation above did not have any significant impact to the Group during the financial year.
(xxiv) Accretion of equity interest in e.co Group via capitalisation of intercompany advances
On 19 December 2017, the Group increased its equity interest in e.co Group from 62.37% to 63.00% via capitalisation of intercompany advances amounting to RM102.2 million (USD24.2 million).
The accretion above did not have any significant impact to the Group during the financial year.
(xxv) Disposal of Yonder Music Inc (“Yonder”)
On 22 December 2017, ADS entered into a Conditional Sales and Purchase Agreement to sell its entire ownership share in Yonder to Yonder Music Partners LLC. Accordingly the Group recorded a total loss amounting to RM30.0 million relating to this disposal.
(xxvi) Dilution of equity interest in Milvik AB
On 19 December 2017, Milvik AB announced a financing (including USD30.0 million growth round) which resulted in the decrease of ADS’s equity interest in Milvik AB from 12.28% to 10.63%. Accordingly the Group recognised a total gain on dilution of RM5.1 million during the financial year.
(xxvii) Accretion of equity interest in M1 Limited (“M1”)
From 17 August 2017 until 21 August 2017 (2016:19 February until 22 March), M1 had bought back its 5.0 million (2016:7.5 million) ordinary shares by way of market acquisition and all the shares purchased back are held as treasury shares. As a result, the Group’s equity interest in M1, held through Axiata Investments (Singapore) Limited, a wholly-owned subsidiary of the Company increased from 28.54% to 28.69% (2016: 28.32% to 28.55%).
The Group recognised a gain on accretion of equity interest amounting to RM1.8 million (2016: loss of RM2.3 million) during the financial year.
(xxviii) Dilution on equity interest in Idea Cellular Limited (“Idea”)
During the financial year, the Group’s equity interest in Idea, decreased from 19.77% to 19.74% (2016: from 19.78% to 19.77%) following the issuance of new ordinary shares under Idea’s Employee Share Option Scheme (“ESOS”).
The Group recognised a loss on dilution of equity interest amounting to RM9.5 million (2016: RM3.1 million) during the financial year.
(xxix) Dilution on equity interest in Axiata Digital Innovation Fund Sdn Bhd (“ADIF”)
During the financial year, the Group’s equity interest in ADIF via Axiata SPV4 Sdn Bhd, a wholly-owned subsidiary of the Company, decreased from 71.07% to 62.19% following the issuance of shares to the new shareholder of ADIF, namely Johor Corporation or its nominee pursuant to the Subscription Agreement entered into between the parties therein dated 3 May 2017.
The dilution above did not have significant impact to the Group during the financial year.

Governance & Audited Financial Statements 2017Audited Financial Statements
80
Notes to the Financial Statements For The Financial Year Ended 31 December 2017
5. INCORPORATIONS, ACQUISITIONS, DISSOLUTIONS, DISPOSAL AND DILUTIONS OF INTERESTS (CONTINUED)
(b) Incorporations, acquisitions, dissolutions and dilutions of interests in the previous financial year
(i) Dilution of equity interest in ACH
On 22 February 2016, ACH issued 64 ordinary shares to Southern Coast Ventures Inc. resulting in the Group’s equity interest in ACH decreased from 95.28% to 92.48% in conjunction with Co-operation Agreement signed on 13 December 2013. As the result, the Group recorded a decrease in consolidated retained earnings of RM8.9 million and an increase in NCI amounting to RM28.0 million in the previous financial year.
(ii) Incorporation of AD Video Sdn Bhd (“ADV”)
Axiata Digital Services Sdn Bhd (“ADS”), had on 25 February 2016 completed the incorporation of ADV, a private company limited by shares, under the Companies Act, 1965 with an issued and paid-up share capital of ADV is RM4.
The incorporation above did not have any significant impact to the Group in the previous financial year.
(iii) Incorporation of WSO2.Telco (Private) Limited (“WSO2.Telco SL”)
WSO2.Telco Inc., a subsidiary of ADS, had on 17 March 2016 completed the incorporation of WSO2.Telco SL, a private company limited by shares, in Sri Lanka, under the Companies Act No.7 of 2007 with an issued and paid-up capital of 1 ordinary share at value of SLR10 each.
The incorporation above did not have any significant impact to the Group in the previous financial year.
(iv) Acquisition of edotco PK
Axiata Investments (Labuan) Limited, a wholly-owned subsidiary of the Company, had on 19 December 2014 entered into a SPA with Arif Hussain and Joozer Jiwakhan for the acquisition of the issued share capital of edotco PK at a cash consideration of PKR3,100 or RM118. The acquisition was completed on 24 March 2016 and effectively, edotco PK became a subsidiary of the Group.
The acquisition of edotco PK did not have any significant impact to the Group in the previous financial year.
(v) Dilution of equity interest in XL
On 10 March 2016, the EGM of Shareholders of XL approved the Share-based Compensation Program Grant Date V. On 6 April 2016, XL issued 8,986,668 ordinary shares at par value of IDR100 each without pre-emptive rights to its eligible employees. Accordingly, the Group’s effective equity interest in XL diluted from 66.43% to 66.36%. The Group recorded an increase in consolidated retained earnings of RM3.1 million and NCI of RM6.0 million respectively in the previous financial year.
(vi) Acquisition of Reynolds Holdings Limited (“Reynolds”) by Axiata Investments (UK) Limited (“Axiata UK”)
On 21 December 2015, the Company and its wholly-owned subsidiary, Axiata UK entered into a SPA and other ancillary agreements for the acquisition of the entire ordinary shares in issue of Reynolds, which owns 80.00% ordinary shares in issue of Ncell Private Limited (“Ncell”). On 11 April 2016, the Group completed the acquisition of Reynolds and effectively became a subsidiary of the Group.
The consideration paid on the acquisition of Reynolds at consolidated basis, the fair value of the identifiable assets acquired, liabilities assumed and NCI at the acquisition date are disclosed in Note 45 to the financial statements.
The goodwill arising from acquisition is attributable to the expansion of regional footprint in Nepal.
Acquisition related costs of RM25.4 million have been charged to other operating costs in the consolidated profit or loss in the previous financial year.
Had Reynolds and its subsidiary been consolidated from 1 January 2016 until 10 April 2016, consolidated revenue and profit after tax of the Group would have been increased by RM628.4 million and RM218.4 million respectively.
Since the acquisition date, revenue amounting to RM1,629.5 million and profit after tax of RM568.4 million of Ncell respectively have been included in the consolidated statement of comprehensive income in the previous financial year.
(vii) Incorporation of VM Digital (Thailand) Co., Ltd. (“VM Digital”)
ADS had on 3 May 2016 completed the incorporation of VM Digital, a private company limited by shares, in Thailand, under the Thailand Civil and Commercial Code with a registered share capital of THB1.0 million.
The above incorporation did not have any significant impact to the Group in the previous financial year.

Governance & Audited Financial Statements 2017Audited Financial Statements
81
Notes to the Financial Statements For The Financial Year Ended 31 December 2017
5. INCORPORATIONS, ACQUISITIONS, DISSOLUTIONS, DISPOSAL AND DILUTIONS OF INTERESTS (CONTINUED)
(b) Incorporations, acquisitions, dissolutions and dilutions of interests in the previous financial year (continued)
(viii) Entry by XL into a Deed of Establishment with PT Indosat Tbk
XL, a subsidiary of the Company, had on 9 May entered into a Deed of Establishment (“Deed”) with PT Indosat Tbk (“Indosat Ooreedoo”) for the establishment of a joint venture; PT One Indonesia Synergy Tbk (“JVCo”). Under the terms of the Deed, XL subscribed 1,251 ordinary shares of IDR1.0 million totalling IDR1,251.0 million (RM0.4 million) representing 50.0% of the total issued and paid-up share capital of the JVCo with the remaining held by Indosat Ooreedoo.
The above establishment did not have any significant impact to the Group in the previous financial year.
(ix) Dissolution of Advantage Maximum Network Co. Ltd. (“AMN”)
AMN, a subsidiary of ADS had, on 16 May 2016 received the dissolution certificate from Business Registration Office, Ho Chi Minh City. Effectively, AMN ceased to be a subsidiary of the Group.
The above dissolution has no material impact to the Group in the previous financial year.
(x) Dissolution of GSM One (L) Limited (“GSM One”) and GSM Two (L) Limited (“GSM Two”)
GSM One and GSM Two, wholly-owned subsidiaries of XL had on 15 June 2016 received the “Dissolution Certificate” from Labuan Financial Services Authority. Effectively, GSM One and GSM Two ceased to be a subsidiary of the Group.
The above dissolution had no significant impact to the Group in the previous financial year.
(xi) Incorporation of Axiata Business Services Sdn Bhd (“ABS”)
On 29 July 2016, the Company incorporated its wholly-owned subsidiary, ABS, a private company limited by shares, under the Companies Act, 1965 with an issued and paid-up share capital of RM2.
The above incorporation did not have any significant impact to the Group in the previous financial year.
(xii) Amalgamation/Merger of Robi Axiata Limited (“Robi”) and Airtel Bangladesh Limited (“Airtel”)
Robi, had on 28 January 2016 entered into an agreement with, inter-alia, Bharti Airtel Holdings (Singapore) Pte. Ltd. for the amalgamation of Airtel with Robi on the terms set in the agreement and Companies Act, 1994 of Bangladesh.
On 16 November 2016 (date of acquisition), Robi and Airtel registered the Merger Filing with the Registrar of Joint Stock Companies and Firms of Bangladesh. Pursuant to the above and in accordance with the agreement, the Proposed Amalgamation/Merger was completed and the parties are in process to obtain the Merged License and completion of other procedural and/or administrative formalities.
The following summarises the non-cash consideration on the acquisition of Airtel, the fair value of the identified assets acquired, liabilities
assumed and NCI on the date of acquisition.
RM’000
Purchase consideration issued in ordinary shares of Robi based on estimated enterprise value of Airtel 1,020,640
Contingent consideration 106,865
1,127,505
Details of the net identifiable assets acquired are as follows:
PPE 735,823
Intangible assets 568,084
Indemnification assets * 162,352
Trade and other receivables 151,699
Advance tax 12,927
Cash and bank balances 43,906
Deferred tax assets 374,513
Borrowings (479,552)
Trade and other payables (441,897)
Provision for liabilities (20,991)
Total net identifiable assets 1,106,864
Goodwill on acquisition 20,641
* To indemnify certain corporate tax of previous tax assessment years and trade payables related to value added taxes.
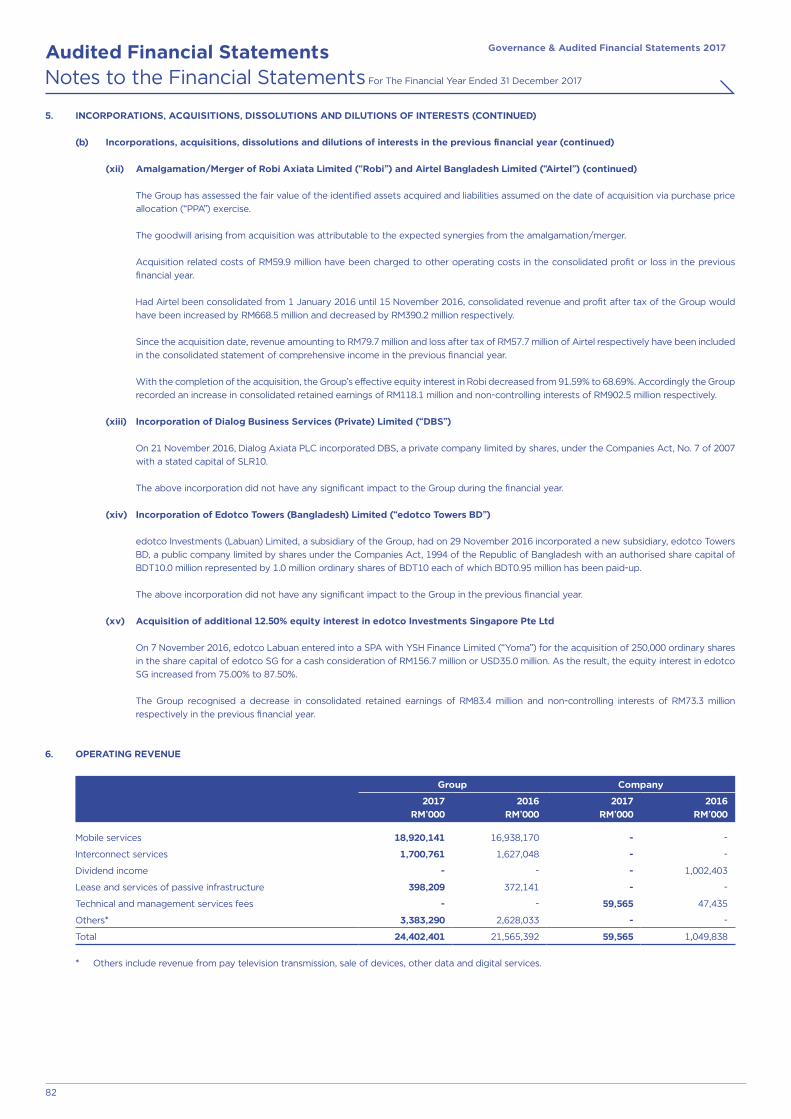
Governance & Audited Financial Statements 2017Audited Financial Statements
82
Notes to the Financial Statements For The Financial Year Ended 31 December 2017
5. INCORPORATIONS, ACQUISITIONS, DISSOLUTIONS AND DILUTIONS OF INTERESTS (CONTINUED)
(b) Incorporations, acquisitions, dissolutions and dilutions of interests in the previous financial year (continued)
(xii) Amalgamation/Merger of Robi Axiata Limited (“Robi”) and Airtel Bangladesh Limited (“Airtel”) (continued)
The Group has assessed the fair value of the identified assets acquired and liabilities assumed on the date of acquisition via purchase price allocation (“PPA”) exercise.
The goodwill arising from acquisition was attributable to the expected synergies from the amalgamation/merger.
Acquisition related costs of RM59.9 million have been charged to other operating costs in the consolidated profit or loss in the previous financial year.
Had Airtel been consolidated from 1 January 2016 until 15 November 2016, consolidated revenue and profit after tax of the Group would have been increased by RM668.5 million and decreased by RM390.2 million respectively.
Since the acquisition date, revenue amounting to RM79.7 million and loss after tax of RM57.7 million of Airtel respectively have been included in the consolidated statement of comprehensive income in the previous financial year.
With the completion of the acquisition, the Group’s effective equity interest in Robi decreased from 91.59% to 68.69%. Accordingly the Group recorded an increase in consolidated retained earnings of RM118.1 million and non-controlling interests of RM902.5 million respectively.
(xiii) Incorporation of Dialog Business Services (Private) Limited (“DBS”)
On 21 November 2016, Dialog Axiata PLC incorporated DBS, a private company limited by shares, under the Companies Act, No. 7 of 2007 with a stated capital of SLR10.
The above incorporation did not have any significant impact to the Group during the financial year.
(xiv) Incorporation of Edotco Towers (Bangladesh) Limited (“edotco Towers BD”)
edotco Investments (Labuan) Limited, a subsidiary of the Group, had on 29 November 2016 incorporated a new subsidiary, edotco Towers BD, a public company limited by shares under the Companies Act, 1994 of the Republic of Bangladesh with an authorised share capital of BDT10.0 million represented by 1.0 million ordinary shares of BDT10 each of which BDT0.95 million has been paid-up.
The above incorporation did not have any significant impact to the Group in the previous financial year.
(xv) Acquisition of additional 12.50% equity interest in edotco Investments Singapore Pte Ltd
On 7 November 2016, edotco Labuan entered into a SPA with YSH Finance Limited (“Yoma”) for the acquisition of 250,000 ordinary shares in the share capital of edotco SG for a cash consideration of RM156.7 million or USD35.0 million. As the result, the equity interest in edotco SG increased from 75.00% to 87.50%.
The Group recognised a decrease in consolidated retained earnings of RM83.4 million and non-controlling interests of RM73.3 million respectively in the previous financial year.
6. OPERATING REVENUE
Group Company
2017RM’000
2016RM’000
2017RM’000
2016RM’000
Mobile services 18,920,141 16,938,170 - -
Interconnect services 1,700,761 1,627,048 - -
Dividend income - - - 1,002,403
Lease and services of passive infrastructure 398,209 372,141 - -
Technical and management services fees - - 59,565 47,435
Others* 3,383,290 2,628,033 - -
Total 24,402,401 21,565,392 59,565 1,049,838
* Others include revenue from pay television transmission, sale of devices, other data and digital services.

Governance & Audited Financial Statements 2017Audited Financial Statements
83
Notes to the Financial Statements For The Financial Year Ended 31 December 2017
7(a). DEPRECIATION, IMPAIRMENT AND AMORTISATION
Group Company
Note2017
RM’0002016
RM’0002017
RM’0002016
RM’000
Depreciation of PPE 25 5,014,373 4,964,247 8,858 8,431
Reversal of impairment of PPE 25 (38,475) - - -
Impairment of advances to subsidiary 26(ii) - - 233,140 -
Impairment of PPE 25 14,802 62,366 - -
Write off of PPE 25 21,809 8,916 - -
Amortisation of intangible assets 24 973,378 630,661 - -
Others 326 315 - -
Total 5,986,213 5,666,505 241,998 8,431
7(b). OTHER OPERATING COSTS
Group Company
Note 2017
RM’0002016
RM’0002017
RM’0002016
RM’000
Impairment of trade and other receivables 32 147,492 97,829 12,163 -
Business license fees 1,201,003 1,075,734 - -
Loss on restructuring of advances 26(iii) - - 1,276,582 -
Charges and commissions 105,324 99,423 55 53
Cost of SIM and recharge cards 220,192 148,643 - -
Revenue sharing outpayment 444,252 560,215 - -
Leased circuit charges 278,574 236,275 - -
Maintenance 1,384,610 1,293,709 7,026 12,252
Professional fees 206,402 298,265 38,596 51,430
Rental-land and buildings 1,455,615 1,472,323 5,950 5,493
Rental-equipment 218,108 186,055 640 253
Rental-others 98,566 102,365 4 -
Roaming costs 210,038 185,737 - -
Supplies and inventories 817,337 567,828 28 127
Transportation and travelling 111,777 107,583 6,504 8,505
USP/Obligation contribution 610,508 551,732 - -
Utilities 286,676 329,164 307 507
Others1 659,392 761,432 43,162 67,778
Total 8,455,866 8,074,312 1,391,017 146,398
Group Company
2017RM’000
2016RM’000
2017RM’000
2016RM’000
1Others include:
Audit fees:
- PricewaterhouseCoopers Malaysia (“PwCM”) 3,684 3,742 1,840 2,113
- Member firm of PwC International Limited (“PwCI”)* 5,985 4,667 - -
- Others 224 147 - -
Audit related fees(i) :
- PwCM and PwCI 2,695 3,914 1,789 2,651
12,588 12,470 3,629 4,764
Other fees paid to PwCM and PwCI:
- Tax and tax related services(ii) 1,142 581 216 101
- Other non-audit services(iii) 14,935 12,354 2,791 884
Total 28,665 25,405 6,636 5,749
* Separate and independent legal entity from PwCM.

Governance & Audited Financial Statements 2017Audited Financial Statements
84
Notes to the Financial Statements For The Financial Year Ended 31 December 2017
7(b). OTHER OPERATING COSTS (CONTINUED)
(i) Fees incurred in connection with performance of quarterly reviews, review of purchase price allocation, agreed-upon procedures and regulatory compliance.
(ii) Fees incurred for assisting the Group in connection with tax compliance and advisory services.
(iii) Fees incurred primarily in relation to due diligences on potential acquisitions, project management and other advisory services mainly incurred by a foreign subsidiary.
In order to maintain the independence of the external auditors, the Audit Committee has determined policies as to what non-audit services can be provided by external auditors of the Group and the approval processes related to them. Under these policies and guidelines, non-audit services can be offered by external auditors of the Group if there are clear efficiencies and value-added benefits to the Group.
7(c). STAFF COSTS (including remuneration of Executive Directors of the Company)
Group Company
Note2017
RM’0002016
RM’0002017
RM’0002016
RM’000
Staff costs excluding Director:
- salaries, allowances, overtime and bonus 1,380,571 1,140,643 94,771 66,290
- termination benefits 148,287 47,992 - -
- contribution to EPF 108,211 93,077 10,688 11,778
- other staff benefits 231,012 220,662 17,315 15,400
- share-based payment expenses 14 (a),(b) 2,800 28,345 9,220 11,218
- share-based compensation expense of a subsidiary 14(c) 11,902 15,650 - -
- Pioneer Grant of a subsidiary 14(d) 17,790 9,896 - -
Remuneration of Executive Director of the Company 7(d) 6,366 8,445 6,366 8,445
Total 1,906,939 1,564,710 138,360 113,131
7(d). DIRECTORS’ REMUNERATION
Group Company
Note 2017
RM’0002016
RM’0002017
RM’0002016
RM’000
Remuneration of Executive Director of the Company:
- salaries, allowances and bonus 3,573 5,500 3,573 5,500
- contribution to EPF 679 1,045 679 1,045
- share-based payment expenses 14 (a),(b) 2,114 1,900 2,114 1,900
6,366 8,445 6,366 8,445
Remuneration of Non-Executive Directors of the Company:
- fees and allowances 4,243 3,744 2,611 2,666
Total 10,609 12,189 8,977 11,111
Estimated money value of benefits of Directors amounting to RM710,956 (2016: RM501,028) for the Group and the Company.

Governance & Audited Financial Statements 2017Audited Financial Statements
85
Notes to the Financial Statements For The Financial Year Ended 31 December 2017
8. OTHER LOSSES - NET
Group
2017RM’000
2016RM’000
Financial assets at FVTPL (3) (10)
Derivative financial instruments:
- CCIRS (9,837) (27,201)
- Put option over share held by NCI (89,863) (94,940)
- Call spread options 42,038 53,990
Total (57,665) (68,161)
9. OTHER OPERATING INCOME - NET
Group Company
Note 2017
RM’0002016
RM’0002017
RM’0002016
RM’000
Loss on disposal of PPE (14,894) (31,240) - -
Gain on tower sale and lease back * - 275,032 - -
Gain on partial disposal of a subsidiary - - 612,924 -
Loss on disposal of joint ventures 5 (a)(xiv), (xxv) (84,409) - - -
Gain on disposal of intangible asset 5 (a)(v) 25,683 - - -
Bad debts recovered 23 13,938 - -
Loss on assets classified as held-for-sale 35 (161,430) - - -
Others^ 240,397 276,836 3,247 2,184
Total 5,370 534,566 616,171 2,184
* On 30 June 2016, XL disposed of certain towers which were subject to the fulfillment of certain survival period clauses as set out in the agreement. In December 2016, the gain amounting to RM275.0 million or IDR0.9 trillion was recognised upon the fulfillment of these clauses.
^ Includes amortisation on deferred gain on sale and lease back assets of a subsidiary of RM137.5 million (2016: RM261.5 million).
10. FINANCE INCOME/(COST)
Group Company
2017RM’000
2016RM’000
2017RM’000
2016RM’000
Finance income
Islamic Financial Instruments 65,306 49,299 26,511 14,392
Other deposits, cash and bank balances 176,501 134,095 629 10,751
Total 241,807 183,394 27,140 25,143
Finance cost
Other borrowings (760,573) (831,657) (63,292) (57,000)
Profit on Sukuks (452,252) (373,128) - -
Finance expense on CCIRS:
- cash flow hedge (49,937) (4,515) - -
- net investment hedge 9,393 8,116 - -
Total (1,253,369) (1,201,184) (63,292) (57,000)

Governance & Audited Financial Statements 2017Audited Financial Statements
86
Notes to the Financial Statements For The Financial Year Ended 31 December 2017
11. TAXATION AND ZAKAT
Group Company
Note 2017
RM’0002016
RM’0002017
RM’0002016
RM’000
Current taxation 1,126,075 557,089 60,877 19,126
Deferred taxation (353,255) (76,477) - -
Total taxation 772,820 480,612 60,877 19,126
Zakat 929 1,810 - -
Total taxation and zakat 773,749 482,422 60,877 19,126
Current taxation:
- Current year 1,132,727 576,903 60,877 3,018
- Prior year (6,652) (19,814) - 16,108
Deferred taxation:
- Net origination of temporary differences 23 (419,422) (76,477) - -
- Other 66,167 - - -
(353,255) (76,477) - -
Total taxation 772,820 480,612 60,877 19,126
Zakat 929 1,810 - -
Total taxation and zakat 773,749 482,422 60,877 19,126
Numerical reconciliation between taxation and the product of accounting profit multiplied by the Malaysian tax rate:
Group Company
2017RM’000
2016RM’000
2017RM’000
2016RM’000
Profit/(loss) before taxation 1,936,231 1,139,580 (2,239,714) 1,222,428
Taxation calculated at the applicable Malaysian tax rate of 24% 464,695 273,499 (537,531) 293,383
Tax effects of:
- income not subject to tax (111,103) (150,671) (147,102) (362,361)
- share of results of associates 84,641 (31,470) - -
- share of results of joint ventures 11,757 23,002 - -
- approved tax credit of a subsidiary (99,250) - - -
- different tax rates in other countries (86,286) (48,541) - -
- utilisation of previously unrecognised tax losses - (3,444) - (3,421)
- unrecognised deferred tax assets 76,171 27,697 28,669 5,328
- expenses not deductible for tax purposes 438,847 410,354 716,841 54,489
- group relief - - - 15,600
- prior year income tax (6,652) (19,814) - 16,108
- zakat 929 1,810 - -
Total taxation and zakat 773,749 482,422 60,877 19,126
12. EARNINGS PER SHARE
(a) Basic earnings per share (“EPS”)
Basic EPS of the Group is calculated by dividing the profit attributable to owners of the Company by the weighted average number of ordinary shares of the Company in issue during the financial year.
Group
2017 2016
Profit attributable to owners of the Company (RM’000) 909,480 504,254
Weighted average number of ordinary shares in issue (‘000) 8,992,086 8,877,928
Basic EPS (sen) 10.1 5.7

Governance & Audited Financial Statements 2017Audited Financial Statements
87
Notes to the Financial Statements For The Financial Year Ended 31 December 2017
12. EARNINGS PER SHARE (CONTINUED)
(b) Diluted earnings per share
For the diluted EPS calculation, the weighted average number of ordinary shares in issue is adjusted to assume conversion of all dilutive potential ordinary shares. The Company has share options and Restricted Share Awards (“RSA”) granted to employees under the Axiata Share Scheme and Axiata Group Performance Based Long Term Incentive Plan (“Axiata PBLTIP”) as disclosed in Note 14(a) and (b) to the financial statements which are dilutive potential ordinary shares and is assumed to have been converted into ordinary shares.
In respect of share options over the ordinary shares of the Company, a calculation is performed to determine the number of shares that could have been acquired at fair value based on the monetary value of the subscription rights attached to outstanding share options. The calculation serves to determine the unexercised share options and RSA outstanding for the purpose of computing the dilution. No adjustment is made to profit attributable to owners of the Company for the share options.
Group
2017 2016
Profit attributable to owners of the Company (RM’000) 909,480 504,254
Weighted average number of ordinary shares in issue (‘000) 8,992,086 8,877,928
Adjusted for share-based payment (‘000) 35,344 36,642
Weighted average number of ordinary shares for the purpose of computing diluted EPS (‘000) 9,027,430 8,914,570
Diluted EPS (sen) 10.1 5.7
13. SHARE CAPITAL
Group and Company
Note
2017 2016
No. ofshares
‘000Value
RM’000
No. ofshares
‘000Value
RM’000
Authorised share capital:
Ordinary shares of RM1 each 13(a) - - 12,000,000 12,000,000
Ordinary shares paid-up capital:
At the beginning of the financial year at RM1 each 8,971,415 8,971,415 8,816,858 8,816,858
Transition to no-par value regime on 31 January 2017 under the Companies Act 2016 13(a) - 4,081,216 - -
Performance-Based ESOS 2,103 9,590 2,668 2,668
Restricted Share Awards 1,387 5,144 4,962 4,962
Dividend Reinvestment Scheme 13(b) 73,046 339,888 146,927 146,927
At the end of the financial year - ordinary shares with no par value (2016: par value of RM1 each) 9,047,951 13,407,253 8,971,415 8,971,415
(a) The Companies Act 2016 was enacted to replace the Companies Act, 1965 and became effective on 31 January 2017. Amongst the key changes introduced in the Companies Act 2016 which affected the share capital of the Company during the financial year are as below:
(i) removal of the authorised share capital;(ii) shares of the Company would cease to have par or nominal value; and(iii) the Company’s share premium account had become part of the Company’s share capital.
There is no impact on the numbers of ordinary shares in issue or the relative entitlement of any of the members as a result of this transition.

Governance & Audited Financial Statements 2017Audited Financial Statements
88
Notes to the Financial Statements For The Financial Year Ended 31 December 2017
13. SHARE CAPITAL (CONTINUED)
(b) Dividend Reinvestment Scheme (“DRS”)
The shareholder of the Company via Annual General Meeting (“AGM”) approved the renewal of the authority for the Directors of the Company to allot and issue new ordinary shares of the Company in relation to the DRS that provided the shareholders of the Company the option to elect to reinvest their full or partial cash dividend entitlement in new ordinary shares of the Company. In the event that only part of the electable portion is reinvested, the shareholders shall receive the remaining portion of the dividend in cash.
The Company has issued the new ordinary shares pursuant to DRS at the conversion price disclosed in Note 44 to the financial statements.
The above mentioned ordinary shares rank pari-passu in all respects with the existing ordinary shares of the Company.
14. EMPLOYEE SHARE OPTION AND SHARE SCHEME
(a) Performance-Based Employee Share Option Scheme and Restricted Share Plan [“Axiata Share Scheme”]
The Performance-Based ESOS of the Company was approved by its shareholders at an Extraordinary General Meeting (“EGM”) held on 24 March 2009. The Performance-Based ESOS was implemented on 16 April 2009.
On 1 June 2011, the Company’s shareholders had, at the Nineteenth (19th) AGM of the Company, approved the amendments to the Bye-Laws of the ESOS to include a Restricted Share Plan (“RSP”). Accordingly, the existing Performance-Based ESOS was renamed as Axiata Share Scheme.
Effective from 15 July 2011, the Company implemented the Axiata Share Scheme and started to offer eligible employees the entitlement to receive RSA under the Restricted Share Plan in the Company on 18 July 2011 instead of ESOS.
The total number of the Performance-Based ESOS granted, percentage exercisable and the vesting periods are as follows:
Options over the Company’s shares
ESOS Grant date Vesting date% of options exercisable1
Number ofoptions
granted
Exerciseprice
RM
Grant 1(a), 2009
Tranche 1 16 April 2009 15 April 2011 50 34,555,750 1.81
Tranche 2 16 April 2009 15 April 2012 50 34,555,750 1.81
Grant 1(b), 20102
Tranche 1 18 January 2010 17 January 2012 50 2,088,050 3.15
Tranche 2 18 January 2010 17 January 2013 50 2,088,050 3.15
Grant 2, 2010
Tranche 1 24 February 2010 23 February 2012 50 24,688,750 3.45
Tranche 2 24 February 2010 23 February 2013 50 24,688,750 3.45
Grant 3(a), 2011
Tranche 1 23 February 2011 22 February 2013 50 32,121,450 5.07
Tranche 2 23 February 2011 22 February 2014 50 32,121,450 5.07
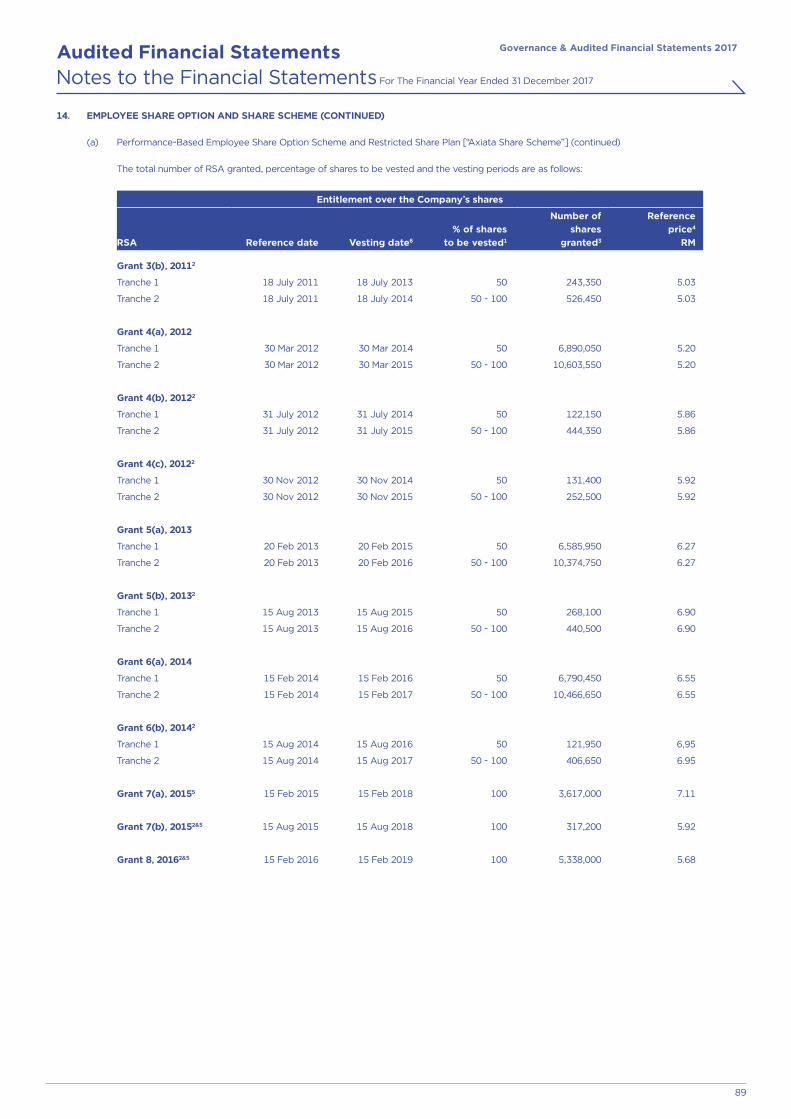
Governance & Audited Financial Statements 2017Audited Financial Statements
89
Notes to the Financial Statements For The Financial Year Ended 31 December 2017
14. EMPLOYEE SHARE OPTION AND SHARE SCHEME (CONTINUED)
(a) Performance-Based Employee Share Option Scheme and Restricted Share Plan [“Axiata Share Scheme”] (continued)
The total number of RSA granted, percentage of shares to be vested and the vesting periods are as follows:
Entitlement over the Company’s shares
RSA Reference date Vesting date6
% of shares to be vested1
Number ofshares
granted3
Referenceprice4
RM
Grant 3(b), 20112
Tranche 1 18 July 2011 18 July 2013 50 243,350 5.03
Tranche 2 18 July 2011 18 July 2014 50 - 100 526,450 5.03
Grant 4(a), 2012
Tranche 1 30 Mar 2012 30 Mar 2014 50 6,890,050 5.20
Tranche 2 30 Mar 2012 30 Mar 2015 50 - 100 10,603,550 5.20
Grant 4(b), 20122
Tranche 1 31 July 2012 31 July 2014 50 122,150 5.86
Tranche 2 31 July 2012 31 July 2015 50 - 100 444,350 5.86
Grant 4(c), 20122
Tranche 1 30 Nov 2012 30 Nov 2014 50 131,400 5.92
Tranche 2 30 Nov 2012 30 Nov 2015 50 - 100 252,500 5.92
Grant 5(a), 2013
Tranche 1 20 Feb 2013 20 Feb 2015 50 6,585,950 6.27
Tranche 2 20 Feb 2013 20 Feb 2016 50 - 100 10,374,750 6.27
Grant 5(b), 20132
Tranche 1 15 Aug 2013 15 Aug 2015 50 268,100 6.90
Tranche 2 15 Aug 2013 15 Aug 2016 50 - 100 440,500 6.90
Grant 6(a), 2014
Tranche 1 15 Feb 2014 15 Feb 2016 50 6,790,450 6.55
Tranche 2 15 Feb 2014 15 Feb 2017 50 - 100 10,466,650 6.55
Grant 6(b), 20142
Tranche 1 15 Aug 2014 15 Aug 2016 50 121,950 6,95
Tranche 2 15 Aug 2014 15 Aug 2017 50 - 100 406,650 6.95
Grant 7(a), 20155 15 Feb 2015 15 Feb 2018 100 3,617,000 7.11
Grant 7(b), 20152&5 15 Aug 2015 15 Aug 2018 100 317,200 5.92
Grant 8, 20162&5 15 Feb 2016 15 Feb 2019 100 5,338,000 5.68

Governance & Audited Financial Statements 2017Audited Financial Statements
90
Notes to the Financial Statements For The Financial Year Ended 31 December 2017
14. EMPLOYEE SHARE OPTION AND SHARE SCHEME (CONTINUED)
(a) Performance-Based Employee Share Option Scheme and Restricted Share Plan [“Axiata Share Scheme”] (continued)
1 The Performance-Based ESOS/RSA granted shall become exercisable/vested only upon the fulfilment of certain performance criteria for the Company and individuals.
2 The grant was made to newly hired employees who did not receive the main cycle grants and have been confirmed as at reporting date.
3 Senior and top management can only vest the RSA at the end of the third (3rd) year or contract period whichever is earlier. Number of shares originally granted are excluding the multiplier effects to be offered to management upon fulfilment of certain performance conditions on the day of vesting.
4 Refers to the price at reference date for the purpose of granting the number of shares to the employees.
5 Effective from financial year 2015, general employees of the Group were awarded a new cash based long term incentive plan instead of Axiata Share Scheme.
6 The unvested RSA after vesting date is subject to retest on quarterly basis until vested or expiry of the scheme which is earlier.
The salient terms and conditions of the Axiata Share Scheme are as follows:
(i) Maximum number of new ordinary shares of the Company available under the Axiata Share Scheme
The maximum amount of shares which may be:
(a) Offered for subscription and allotted on the exercise of the total amount of Share Options under this Axiata Share Scheme; and
(b) Allotted upon the vesting of RSA under a RSP, (collectively referred to as “Aggregate”) shall not be more than 7% of the issued and paid–up ordinary share capital of the Company at any point of time during the duration of this Axiata Share Scheme.
If the Company undertakes a share buy-back exercise or any other corporate proposal resulting in the total number of the Company’s shares issued and/or to be issued under the Axiata Share Scheme exceeding 7% of the Company’s issued and fully paid-up ordinary share capital, all shares under the Axiata Share Scheme offered and/or granted prior to the said variation of the issued and paid-up ordinary share capital of the Company shall remain valid and exercisable in accordance with the provisions of this Axiata Share Scheme as if that reduction had not occurred.
(ii) Basis of allocation and maximum allowable allotment
The total number of new ordinary shares of the Company that can be offered and allotted to any Eligible Employees (as defined in the Bye-Laws in relation to the Axiata Share Scheme shall be at the absolute discretion of the Board (or the Axiata Share Scheme Committee which was folded under the Board Remuneration Committee effective from financial year 2014) that has been established to administer the Axiata Share Scheme from time to time) after taking into consideration such criteria as may be determined by the Board or the Axiata Share Scheme Committee in its/their absolute discretion.
Further, not more than 50% of the Company’s new ordinary shares made available under the Axiata Share Scheme shall be allocated, in aggregate, to Eligible Employees who are Executive Directors of the Company or any corporation within the Group or who are in senior management. In addition, not more than 10% of the Company’s new ordinary shares available under the Axiata Share Scheme will be allocated to any individual Eligible Employee who, either singly or collectively through persons connected with the Eligible Employees, holds 20% or more of the Company’s issued and fully paid-up share capital.
(iii) Eligibility
Any employee of the Group (other than subsidiaries which are dormant) shall be eligible to participate in the Axiata Share Scheme if the employee, as at the dates of the respective offers of options:
(a) has attained the age of eighteen (18) years;
(b) has entered into a full-term contract of employment with, and is on the payroll of, a corporation within the Group and whose service has been confirmed;
(c) is not a non-executive or independent Director of the Company; and
(d) fulfils any other criteria as may be set by the Board or the Axiata Share Scheme Committee in its absolute discretion.
Eligibility under the Axiata Share Scheme does not confer on any Eligible Employee any claim, right to participate in, or any other right whatsoever under the Axiata Share Scheme, and an Eligible Employee does not acquire or have any right over, or in connection with, any Performance-Based ESOS or the RSA under this Axiata Share Scheme unless an Offer has been made by the Board to that Eligible Employee and that Eligible Employee has accepted the Offer in accordance with the terms of the Offer and the Bye-Laws governing the Axiata Share Scheme.

Governance & Audited Financial Statements 2017Audited Financial Statements
91
Notes to the Financial Statements For The Financial Year Ended 31 December 2017
14. EMPLOYEE SHARE OPTION AND SHARE SCHEME (CONTINUED)
(a) Performance-Based Employee Share Option Scheme and Restricted Share Plan [“Axiata Share Scheme”] (continued)
The salient terms and conditions of the Axiata Share Scheme are as follows: (continued)
(iv) Option price and RSA reference price
The subscription price payable for each of the Company’s shares upon exercise of options is the five (5) day volume weighted average market price of the Company’s shares immediately preceding the date of the Offer and is not lower than the nominal value of the Company’s shares.
The reference price at which the Grantees shall be allotted new Shares pursuant to a RSA will be based on the fair value of the shares on the date of offer, but shall not in any event be lower than the nominal value of the ordinary shares.
(v) Duration of the Axiata Share Scheme
The Axiata Share Scheme shall be in force for a period of eight (8) years from the effective date of implementation of the Performance-Based ESOS and RSP, being a date of full compliance with the relevant requirements of the Main Market Listing Requirements of Bursa Malaysia Securities Berhad (“Bursa Securities”) in relation to the initial Long Term Performance-Based ESOS. All Share Options, whether or not exercisable, shall forthwith lapse upon the expiry of the Scheme. All unvested Shares under the RSA which are not vested shall forthwith lapse upon the expiry of the Scheme on 15 April 2017. On 20 May 2014, the shareholders of the Company via AGM approved the extension of the scheme from eight (8) years to ten (10) years until 15 April 2019.
(vi) Retention period
The new ordinary shares of the Company allotted and issued pursuant to the exercise of any Performance-Based ESOS or upon the vesting of RSA under the Axiata Share Scheme will not be subject to any retention period.
(vii) Ranking of the new shares to be issued under the Axiata Share Scheme
The Company’s new shares to be issued pursuant to Axiata Share Scheme shall, upon allotment and issuance, rank pari-passu in all respects with the existing issued shares of the Company except that they shall not be entitled to any dividend, right, allotment and/or other distribution in respect of which the entitlement date is before the date of allotment of such new ordinary shares.
Eligible Employees who are residents in Malaysia and who have been granted share options have the option to elect whether to exercise the options by way of:
(i) Selling Flexibility; or
(ii) To directly subscribe for shares.
Whichever option once selected shall be applicable to the exercise of the Share Options for the full duration of the Axiata Share Scheme unless otherwise determined by the Board in their sole discretion but subject always to the provisions of the Bye-Laws and the terms of the Selling Flexibility.
Eligible Employees who are not residents in Malaysia and who have been granted Share Options shall exercise their Share Options by way of Selling Flexibility for the full duration of the Axiata Share Scheme but subject always to the provisions of the Bye-Laws and the terms of the Selling Flexibility for Foreign Guarantees.

Governance & Audited Financial Statements 2017Audited Financial Statements
92
Notes to the Financial Statements For The Financial Year Ended 31 December 2017
14. EMPLOYEE SHARE OPTION AND SHARE SCHEME (CONTINUED)
(a) Performance-Based Employee Share Option Scheme and Restricted Share Plan [“Axiata Share Scheme”] (continued)
The movement during the financial year and its comparative in the number of options over the new ordinary shares of the Company, in which the employees of the Group and the Company are entitled to, is as follows:
Performance-Based ESOS
Group
Exercise price
RM
At 1 January
2017 ExercisedLapsed/forfeited
At 31December
2017
Fair value atgrant date
RM
Grant 1(a), 2009
Tranche 1 1.81 958,261 (60,250) (611) 897,400 0.54
Tranche 2 1.81 2,308,913 (326,850) (3,737) 1,978,326 0.57
3,267,174 (387,100) (4,348) 2,875,726
Grant 1(b), 2010
Tranche 1 3.15 3,500 - - 3,500 0.93
Tranche 2 3.15 104,700 (28,100) (4,000) 72,600 0.98
108,200 (28,100) (4,000) 76,100
Grant 2, 2010
Tranche 1 3.45 2,571,350 (461,600) (6,000) 2,103,750 1.09
Tranche 2 3.45 3,580,138 (585,800) (54,988) 2,939,350 1.15
6,151,488 (1,047,400) (60,988) 5,043,100
Grant 3(a), 2011
Tranche 1 5.07 6,025,800 (274,050) (156,550) 5,595,200 1.05
Tranche 2 5.07 7,892,000 (366,550) (128,250) 7,397,200 1.10
13,917,800 (640,600) (284,800) 12,992,400
Grand total 23,444,662 (2,103,200) (354,136) 20,987,326
The related weighted average share price at the time of exercise was RM3.64 (2016: RM3.93).

Governance & Audited Financial Statements 2017Audited Financial Statements
93
Notes to the Financial Statements For The Financial Year Ended 31 December 2017
14. EMPLOYEE SHARE OPTION AND SHARE SCHEME (CONTINUED)
(a) Performance-Based Employee Share Option Scheme and Restricted Share Plan [“Axiata Share Scheme”] (continued)
The movement during the financial year and its comparative in the number of options over the new ordinary shares of the Company, in which the employees of the Group and the Company are entitled to, is as follows: (continued)
Performance-Based ESOS
Group
Exerciseprice
RM
At 1January
2016 Exercised
Lapsed/ forfeited/adjusted *
At 31 December
2016
Fair value atgrant date
RM
Grant 1(a), 2009
Tranche 1 1.81 - (113,950) 1,072,211 958,261 0.54
Tranche 2 1.81 2,431,955 (411,200) 288,158 2,308,913 0.57
2,431,955 (525,150) 1,360,369 3,267,174
Grant 1(b), 2010
Tranche 1 3.15 54,350 (100) (50,750) 3,500 0.93
Tranche 2 3.15 145,650 (11,600) (29,350) 104,700 0.98
200,000 (11,700) (80,100) 108,200
Grant 2, 2010
Tranche 1 3.45 2,874,232 (276,650) (26,232) 2,571,350 1.09
Tranche 2 3.45 3,870,816 (536,100) 245,422 3,580,138 1.15
6,745,048 (812,750) 219,190 6,151,488
Grant 3(a), 2011
Tranche 1 5.07 7,364,240 (611,400) (727,040) 6,025,800 1.05
Tranche 2 5.07 8,124,000 (707,300) 475,300 7,892,000 1.10
15,488,240 (1,318,700) (251,740) 13,917,800
Grand total 24,865,243 (2,668,300) 1,247,719 23,444,662
* Adjustments related to grant, vesting, lapse and forfeited in previous years.
The related weighted average share price at the time of exercise was RM3.93 (2015: RM3.88).

Governance & Audited Financial Statements 2017Audited Financial Statements
94
Notes to the Financial Statements For The Financial Year Ended 31 December 2017
14. EMPLOYEE SHARE OPTION AND SHARE SCHEME (CONTINUED)
(a) Performance-Based Employee Share Option Scheme and Restricted Share Plan [“Axiata Share Scheme”] (continued)
The movement during the financial year and its comparative in the number of options over the new ordinary shares of the Company, in which the employees of the Group and the Company are entitled to, is as follows: (continued)
Performance-Based ESOS
Company
Exercise price
RM
At 1 January
2017 ExercisedLapsed/forfeited
At 31December
2017
Fair value atgrant date
RM
Grant 1(a), 2009
Tranche 1 1.81 222,950 - - 222,950 0.54
Tranche 2 1.81 337,450 - - 337,450 0.57
560,400 - - 560,400
Grant 1(b), 2010
Tranche 1 3.15 - - - - 0.93
Tranche 2 3.15 45,800 (3,500) - 42,300 0.98
45,800 (3,500) - 42,300
Grant 2, 2010
Tranche 1 3.45 1,176,000 - - 1,176,000 1.09
Tranche 2 3.45 1,248,100 - - 1,248,100 1.15
2,424,100 - - 2,424,100
Grant 3(a), 2011
Tranche 1 5.07 1,791,900 - - 1,791,900 1.05
Tranche 2 5.07 1,893,700 (2,000) - 1,891,700 1.10
3,685,600 (2,000) - 3,683,600
Grand total 6,715,900 (5,500) - 6,710,400
Performance-Based ESOS
Company
Exercise price
RM
At 1 January
2016 ExercisedLapsed/forfeited
At 31 December
2016
Fair value atgrant date
RM
Grant 1(a), 2009
Tranche 1 1.81 271,600 - (48,650) 222,950 0.54
Tranche 2 1.81 640,900 - (303,450) 337,450 0.57
912,500 - (352,100) 560,400
Grant 1(b), 2010
Tranche 1 3.15 16,150 - (16,150) - 0.93
Tranche 2 3.15 124,950 - (79,150) 45,800 0.98
141,100 - (95,300) 45,800
Grant 2, 2010
Tranche 1 3.45 1,257,675 - (81,675) 1,176,000 1.09
Tranche 2 3.45 1,898,475 - (650,375) 1,248,100 1.15
3,156,150 - (732,050) 2,424,100
Grant 3(a), 2011
Tranche 1 5.07 2,217,650 (87,000) (338,750) 1,791,900 1.05
Tranche 2 5.07 2,473,350 (87,000) (492,650) 1,893,700 1.10
4,691,000 (174,000) (831,400) 3,685,600
Grand total 8,900,750 (174,000) (2,010,850) 6,715,900

Governance & Audited Financial Statements 2017Audited Financial Statements
95
Notes to the Financial Statements For The Financial Year Ended 31 December 2017
14. EMPLOYEE SHARE OPTION AND SHARE SCHEME (CONTINUED)
(a) Performance-Based Employee Share Option Scheme and Restricted Share Plan [“Axiata Share Scheme”] (continued)
The movement during the financial year in the number of RSA shares of the Company, in which the employees of the Group are entitled to, is as follows:
RSP
Group
Closing price at grant date
RM
At 1January
2017 Granted VestedLapsed/forfeited
At 31December
2017
Fair value atgrant date
RM
Grant 3(b), 2011
Tranche 2 5.03 20,000 - - - 20,000 3.90
20,000 - - - 20,000
Grant 4(a), 2012
Tranche 1 5.39 62,050 - - - 62,050 4.39
Tranche 2 5.39 216,150 - - - 216,150 4.26
278,200 278,200
Grant 4(b), 2012 - - -
Tranche 1 6.00 24,350 - - - 24,350 4.93
Tranche 2 6.00 52,050 - - - 52,050 4.69
76,400 - - - 76,400
Grant 4(c), 2012
Tranche 1 6.19 2,300 - - - 2,300 4.46
Tranche 2 6.19 134,600 - - - 134,600 4.11
136,900 - - - 136,900
Grant 5(a), 2013
Tranche 1 6.60 250,300 - - - 250,300 4.76
Tranche 2 6.60 3,339,650 - (134,700) (300,600) 2,904,350 4.28
3,589,950 - (134,700) (300,600) 3,154,650
Grant 5(b), 2013
Tranche 1 6.90 53,800 - - - 53,800 4.88
Tranche 2 6.90 235,250 - - (14,700) 220,550 4.10
289,050 - - (14,700) 274,350
Grant 6(a), 2014
Tranche 1 6.69 6,405,200 - (146,500) (241,600) 6,017,100 4.77
Tranche 2 6.69 6,728,700 - (30,600) (588,300) 6,109,800 4.20
13,133,900 - (177,100) (829,900) 12,126,900
Grant 6(b), 2014
Tranche 1 6.94 105,100 - - (1,900) 103,200 4.72
Tranche 2 6.94 373,200 - - (53,400) 319,800 3.97
478,300 - - (55,300) 423,000
Grant 7(a), 2015 7.06 3,390,500 - - (354,200) 3,036,300 4.46
Grant 7(b), 2015 6.29 317,200 - - - 317,200 4.35
Grant 8, 2016 5.88 5,338,000 - (1,075,150) (431,700) 3,831,150 3.79
Grand total 27,048,400 - (1,386,950) (1,986,400) 23,675,050

Governance & Audited Financial Statements 2017Audited Financial Statements
96
Notes to the Financial Statements For The Financial Year Ended 31 December 2017
14. EMPLOYEE SHARE OPTION AND SHARE SCHEME (CONTINUED)
(a) Performance-Based Employee Share Option Scheme and Restricted Share Plan [“Axiata Share Scheme”] (continued)
The movement in the previous financial year in the number of RSA shares of the Company, in which the employees of the Group are entitled to, is as follows:
RSP
Group
Closing price at grant date
RM
At 1January
2016 Granted VestedLapsed/forfeited
At 31December
2016
Fair value atgrant date
RM
Grant 3(b), 2011
Tranche 2 5.03 20,000 - - - 20,000 3.90
20,000 - - - 20,000
Grant 4(a), 2012
Tranche 1 5.39 62,050 - - - 62,050 4.39
Tranche 2 5.39 283,850 - (67,700) - 216,150 4.26
345,900 (67,700) 278,200
Grant 4(b), 2012 - - -
Tranche 1 6.00 24,350 - - - 24,350 4.93
Tranche 2 6.00 52,050 - - - 52,050 4.69
76,400 - - - 76,400
Grant 4(c), 2012
Tranche 1 6.19 2,300 - - - 2,300 4.46
Tranche 2 6.19 145,200 - (10,600) - 134,600 4.11
147,500 - (10,600) - 136,900
Grant 5(a), 2013
Tranche 1 6.60 250,300 - - - 250,300 4.76
Tranche 2 6.60 9,695,700 - (4,881,200) (1,474,850) 3,339,650 4.28
9,946,000 - (4,881,200) (1,474,850) 3,589,950
Grant 5(b), 2013
Tranche 1 6.90 56,050 - (2,250) - 53,800 4.88
Tranche 2 6.90 272,700 - - (37,450) 235,250 4.10
328,750 - (2,250) (37,450) 289,050
Grant 6(a), 2014
Tranche 1 6.69 6,434,700 - - (29,500) 6,405,200 4.77
Tranche 2 6.69 9,826,300 - - (3,097,600) 6,728,700 4.20
16,261,000 - - (3,127,100) 13,133,900
Grant 6(b), 2014
Tranche 1 6.94 112,950 - - (7,850) 105,100 4.72
Tranche 2 6.94 397,650 - - (24,450) 373,200 3.97
510,600 - - (32,300) 478,300
Grant 7(a), 2015 7.06 3,591,800 - - (201,300) 3,390,500 4.46
Grant 7(b), 2015 6.29 317,200 - - - 317,200 4.35
Grant 8, 2016 5.88 - 5,338,000 - - 5,338,000 3.79
Grand total 31,545,150 5,338,000 (4,961,750) (4,873,000) 27,048,400

Governance & Audited Financial Statements 2017Audited Financial Statements
97
Notes to the Financial Statements For The Financial Year Ended 31 December 2017
14. EMPLOYEE SHARE OPTION AND SHARE SCHEME (CONTINUED)
(a) Performance-Based Employee Share Option Scheme and Restricted Share Plan [“Axiata Share Scheme”] (continued)
The movement during the financial year in the number of RSA shares of the Company, in which the employees of the Company are entitled to, is as follows:
RSP
Company
Closing price at grant date
RM
At 1January
2017 Granted VestedLapsed/forfeited
At 31December
2017
Fair value atgrant date
RM
Grant 4(a), 2012
Tranche 2 5.39 132,800 - - - 132,800 4.26
132,800 - - - 132,800
Grant 4(b), 2012
Tranche 2 6.00 22,600 - - - 22,600 4.69
22,600 - 22,600
Grant 4(c), 2012 - - -
Tranche 2 6.19 103,600 - - - 103,600 4.11
103,600 - - - 103,600
Grant 5(a), 2013
Tranche 1 6.60 15,000 - - - 15,000 4.76
Tranche 2 6.60 1,583,150 - (94,800) - 1,488,350 4.28
1,598,150 - (94,800) - 1,503,350
Grant 5(b), 2013
Tranche 1 6.90 41,250 - - - 41,250 4.88
Tranche 2 6.90 58,350 - - - 58,350 4.10
99,600 - - - 99,600
Grant 6(a), 2014
Tranche 1 6.69 541,850 - (146,500) (23,300) 372,050 4.77
Tranche 2 6.69 2,433,250 - - (105,600) 2,327,650 4.20
2,975,100 - (146,500) (128,900) 2,699,700
Grant 6(b), 2014
Tranche 1 6.94 63,450 - - - 63,450 4.72
Tranche 2 6.94 282,650 - - (51,500) 231,150 3.97
346,100 - - (51,500) 294,600
Grant 7(a), 2015 7.06 1,801,800 - - (75,100) 1,726,700 4.46
Grant 7(b), 2015 6.29 109,000 - - - 109,000 4.35
Grant 8, 2016 5.88 3,033,900 - (760,250) (39,000) 2,234,650 3.79
Grand total 10,222,650 - (1,001,550) (294,500) 8,926,600

Governance & Audited Financial Statements 2017Audited Financial Statements
98
Notes to the Financial Statements For The Financial Year Ended 31 December 2017
14. EMPLOYEE SHARE OPTION AND SHARE SCHEME (CONTINUED)
(a) Performance-Based Employee Share Option Scheme and Restricted Share Plan [“Axiata Share Scheme”] (continued)
The movement in the previous financial year in the number of RSA of the Company, in which the employees of the Company are entitled to, is as follows:
RSP
Company
Closing price at grant date
RM
At 1January
2016 Granted VestedLapsed/forfeited
At 31December
2016
Fair value atgrant date
RM
Grant 4(a), 2012
Tranche 2 5.39 132,800 - - - 132,800 4.26
132,800 - - - 132,800
Grant 4(b), 2012
Tranche 2 6.00 22,600 - - - 22,600 4.69
22,600 - 22,600
Grant 4(c), 2012
Tranche 2 6.19 103,600 - - - 103,600 4.11
103,600 - - - 103,600
Grant 5(a), 2013
Tranche 1 6.60 15,000 - - - 15,000 4.76
Tranche 2 6.60 1,914,500 - (286,650) (44,700) 1,583,150 4.28
1,929,500 - (286,650) (44,700) 1,598,150
Grant 5(b), 2013
Tranche 1 6.90 41,250 - - - 41,250 4.88
Tranche 2 6.90 58,350 - - - 58,350 4.10
99,600 - - - 99,600
Grant 6(a), 2014
Tranche 1 6.69 564,600 - - (22,750) 541,850 4.77
Tranche 2 6.69 2,540,800 - - (107,550) 2,433,250 4.20
3,105,400 - - (130,300) 2,975,100
Grant 6(b), 2014
Tranche 1 6.94 71,300 - - (7,850) 63,450 4.72
Tranche 2 6.94 290,500 - - (7,850) 282,650 3.97
361,800 - - (15,700) 346,100
Grant 7(a), 2015 7.06 1,840,900 - - (39,100) 1,801,800 4.46
Grant 7(b), 2015 6.29 109,000 - - - 109,000 4.35
Grant 8, 2016 5.88 - 3,033,900 - - 3,033,900 3.79
Grand total 7,705,200 3,033,900 (286,650) (229,800) 10,222,650
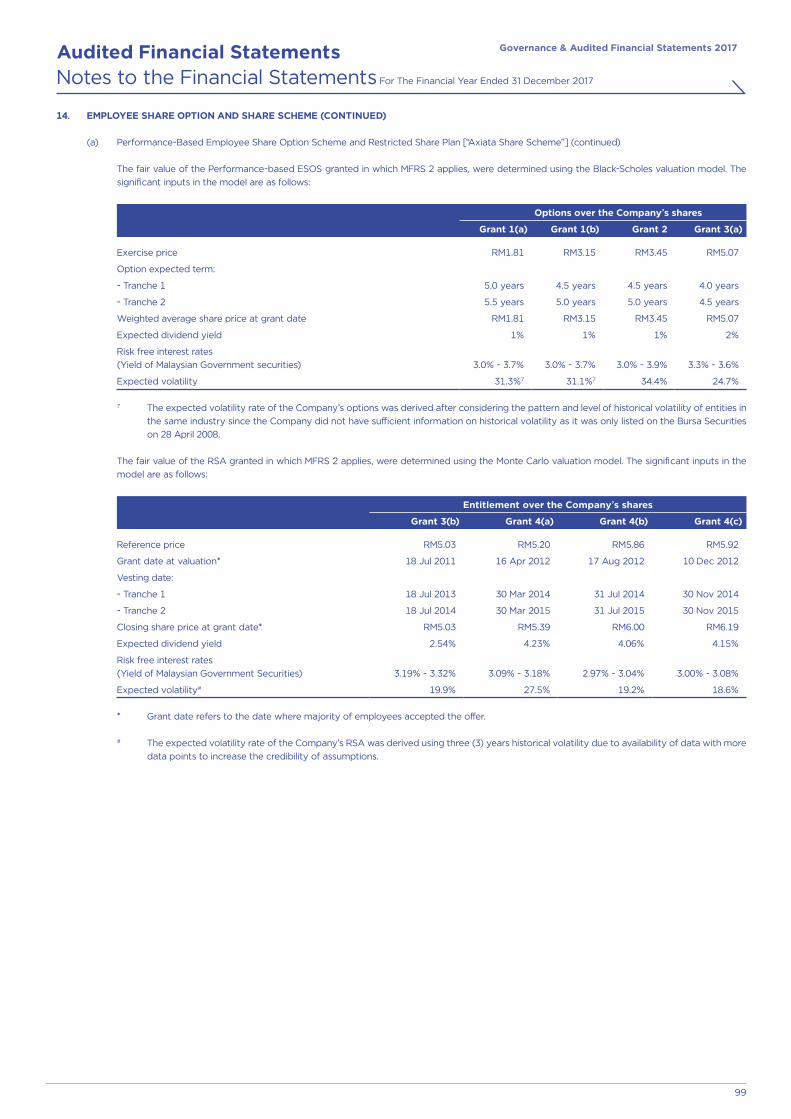
Governance & Audited Financial Statements 2017Audited Financial Statements
99
Notes to the Financial Statements For The Financial Year Ended 31 December 2017
14. EMPLOYEE SHARE OPTION AND SHARE SCHEME (CONTINUED)
(a) Performance-Based Employee Share Option Scheme and Restricted Share Plan [“Axiata Share Scheme”] (continued)
The fair value of the Performance-based ESOS granted in which MFRS 2 applies, were determined using the Black-Scholes valuation model. The significant inputs in the model are as follows:
Options over the Company’s shares
Grant 1(a) Grant 1(b) Grant 2 Grant 3(a)
Exercise price RM1.81 RM3.15 RM3.45 RM5.07
Option expected term:
- Tranche 1 5.0 years 4.5 years 4.5 years 4.0 years
- Tranche 2 5.5 years 5.0 years 5.0 years 4.5 years
Weighted average share price at grant date RM1.81 RM3.15 RM3.45 RM5.07
Expected dividend yield 1% 1% 1% 2%
Risk free interest rates(Yield of Malaysian Government securities) 3.0% - 3.7% 3.0% - 3.7% 3.0% - 3.9% 3.3% - 3.6%
Expected volatility 31.3%7 31.1%7 34.4% 24.7%
7 The expected volatility rate of the Company’s options was derived after considering the pattern and level of historical volatility of entities in the same industry since the Company did not have sufficient information on historical volatility as it was only listed on the Bursa Securities on 28 April 2008.
The fair value of the RSA granted in which MFRS 2 applies, were determined using the Monte Carlo valuation model. The significant inputs in the model are as follows:
Entitlement over the Company’s shares
Grant 3(b) Grant 4(a) Grant 4(b) Grant 4(c)
Reference price RM5.03 RM5.20 RM5.86 RM5.92
Grant date at valuation* 18 Jul 2011 16 Apr 2012 17 Aug 2012 10 Dec 2012
Vesting date:
- Tranche 1 18 Jul 2013 30 Mar 2014 31 Jul 2014 30 Nov 2014
- Tranche 2 18 Jul 2014 30 Mar 2015 31 Jul 2015 30 Nov 2015
Closing share price at grant date* RM5.03 RM5.39 RM6.00 RM6.19
Expected dividend yield 2.54% 4.23% 4.06% 4.15%
Risk free interest rates(Yield of Malaysian Government Securities) 3.19% - 3.32% 3.09% - 3.18% 2.97% - 3.04% 3.00% - 3.08%
Expected volatility# 19.9% 27.5% 19.2% 18.6%
* Grant date refers to the date where majority of employees accepted the offer.
# The expected volatility rate of the Company’s RSA was derived using three (3) years historical volatility due to availability of data with more data points to increase the credibility of assumptions.

Governance & Audited Financial Statements 2017Audited Financial Statements
100
Notes to the Financial Statements For The Financial Year Ended 31 December 2017
14. EMPLOYEE SHARE OPTION AND SHARE SCHEME (CONTINUED)
(a) Performance-Based Employee Share Option Scheme and Restricted Share Plan [“Axiata Share Scheme”] (continued)
The fair value of the Performance-based ESOS granted in which MFRS 2 applies, were determined using the Black-Scholes valuation model. The significant inputs in the model are as follows: (continued)
Entitlement over the Company’s shares
Grant 5(a) Grant 5(b) Grant 6(a) Grant 6(b) Grant 7(a) Grant 7(b) Grant 8
Reference price RM6.27 RM6.90 RM6.55 RM6.95 RM7.11 RM5.92 RM5.68
Grant date at valuation* 29 Mar 2013 15 Aug 2013 07 Apr 2014 02 Sep 2014 09 Apr 2015 17 Sep 2015 14 Apr 2016
Vesting date:
- Tranche 1 20 Feb 2015 15 Aug 2015 15 Feb 2016 15 Aug 2016 - - -
- Tranche 2 20 Feb 2016 15 Aug 2016 15 Feb 2017 15 Aug 2017 15 Feb 2018 15 Aug 2018 15 Feb 2019
Closing share price at grant date* RM6.60 RM6.90 RM6.69 RM6.94 RM7.06 RM6.29 RM5.88
Expected dividend yield 4.58% 4.20% 3.79% 3.89% 3.96% 3.96% 4.08%
Risk free interest rates(Yield of Malaysian
Government Securities) 2.88% - 3.09% 3.17% - 3.36% 3.00% - 3.38% 3.46% 3.57% 3.76% 3.22%
Expected volatility# 18.7% 17.4% 16.5% 15.8% 14.26% 15.20% 16.1%
* Grant date refers to the date where majority of employees accepted the offer.
# The expected volatility rate of the Company’s RSA was derived using three (3) years period on daily basis historical volatility due to availability of data with more data points to increase the credibility of assumptions.
The amounts recognised in the financial statements as disclosed in Note 7(c) and 7(d) to the financial statements for all employees (including Directors) arising from the Performance-Based ESOS and RSA are summarised as below:
Group Company
2017RM’000
2016RM’000
2017RM’000
2016RM’000
Share-based payment expenses* (110) 30,245 7,229 13,118
* Included reversal of previous financial year expenses.
(b) Axiata Group Performance Based Long Term Incentive Plan (“Axiata PBLTIP”)
On 25 May 2016, shareholders of the Company approved Axiata Group Performance Based PBLTIP and implemented on 30 September 2016. Effectively the Group and the Company started to offer eligible employees the entitlement to receive Axiata PBLTIP.
The total number of PBLTIP shares granted, percentage of shares to be vested and the vesting period are as follows:
Entitlement over the Company’s shares
Reference date
Vesting date
% of shares to be
vested1
Number of shares
granted3
Reference price4
RM
Grant 1(a), 2017 28 Feb 2017 28 Feb 2020 100 4,680,100 4.43
Grant 1(b), 20172 15 Aug 2017 15 Aug 2020 100 496,600 4.83
1 The PBLTIP granted shall become exercisable only upon the fufillment of certain performance criteria for the company and individuals.
2 The grant was made to newly hired employees who did not receive the main cycle grant and have been confirmed as at reporting dates.
3 Senior and top management can only vest the PBLTIP shares at the end of the third (3rd) year. Number of shares originally granted are excluding the multiplier effects to be offered to management upon fulfilment of certain performance conditions on the day of vesting.
4 Refers to the price at reference date for the purpose of granting the number of shares to the employees.

Governance & Audited Financial Statements 2017Audited Financial Statements
101
Notes to the Financial Statements For The Financial Year Ended 31 December 2017
14. EMPLOYEE SHARE OPTION AND SHARE SCHEME (CONTINUED)
(b) Axiata Group Performance Based Long Term Incentive Plan (“Axiata PBLTIP”) (continued)
The salient terms and conditions of the Axiata PBLTIP are as follows:
(i) Maximum number of new ordinary shares of the Company available under the Axiata PBLTIP
The maximum amount of shares which may be allotted upon the vesting of PBLTIP shares, (collectively referred to as “Aggregate”) shall not be more than 7% of the issued and paid–up ordinary share capital of the Company at any point of time during the duration of this Axiata PBLTIP.
If the Company undertakes a share buy-back exercise or any other corporate proposal resulting in the total number of the Company’s shares issued and/or to be issued under the Axiata PBLTIP exceeding 7% of the Company’s issued and fully paid-up ordinary share capital, all shares under the Axiata PBLTIP offered and/or granted prior to the said variation of the issued and paid-up ordinary share capital of the Company shall remain valid and exercisable in accordance with the provisions of this Axiata PBLTIP as if that reduction had not occurred.
(ii) Basis of allocation and maximum allowable allotment
The total number of new ordinary shares of the Company that can be offered and allotted to any Eligible Employees (as defined in the Bye-Laws in relation to the Axiata PBLTIP shall be at the absolute discretion of the Board which was folded under the Board Remuneration Committee effective from financial year 2014) that has been established to administer the Axiata PBLTIP from time to time) after taking into consideration such criteria as may be determined by the Board or the Board Remuneration Committee in its/their absolute discretion.
Not more than 10% of the Company’s new ordinary shares available under the Axiata PBLTIP will be allocated to any individual Eligible Employee who, either singly or collectively through persons connected with the Eligible Employees, holds 20% or more of the Company’s paid-up share capital.
(iii) Eligibility
Any employee of the Group (other than subsidiaries which are dormant) shall be eligible to participate in the Axiata PBLTIP if the employee, as at the dates of the respective offers of options:
(a) has attained the age of eighteen (18) years;
(b) has entered into a full-term contract of employment with, and is on the payroll of, a corporation within the Group and whose service has been confirmed;
(c) is not a non-executive or independent Director of the Company; and
(d) fulfils any other criteria as may be set by the Board in its absolute discretion.
Eligibility under the Axiata PBLTIP does not confer on any Eligible Employee any claim, right to participate in, or any other right whatsoever under the Axiata PBLTIP and an Eligible Employee does not acquire or have any right over, or in connection with, any PBLTIP shares under this Axiata PBLTIP unless an Offer has been made by the Board to that Eligible Employee and that Eligible Employee has accepted the Offer in accordance with the terms of the Offer and the Bye-Laws governing the Axiata PBLTIP.
(iv) PBLTIP share reference price
The reference price at which the Grantees shall be allotted new Shares will be based on the fair value of the shares on the date of offer.
(v) Duration of the Axiata PBLTIP
The Axiata PBLTIP shall be in force for a period of ten (10) years from the effective date of implementation, being a date of full compliance with the relevant requirements of the Main Market Listing Requirements of Bursa Malaysia Securities Berhad (“Bursa Securities”). All PBLTIP shares, whether or not exercisable, shall forthwith lapse upon the expiry of the Scheme. All unvested Shares under the Axiata which are not vested shall forthwith lapse upon the expiry of the Scheme on 30 September 2026.

Governance & Audited Financial Statements 2017Audited Financial Statements
102
Notes to the Financial Statements For The Financial Year Ended 31 December 2017
14. EMPLOYEE SHARE OPTION AND SHARE SCHEME (CONTINUED)
(b) Axiata Group Performance Based Long Term Incentive Plan (“Axiata PBLTIP”) (continued)
The movement during the financial year in the number of PBLTIP shares of the Group and the Company, in which the employees of the Group and Company are entitled to, is as follows:
Closing priceat grant date
RM
At 1January
2017 GrantedLapsed/forfeited
At 31 December
2017
Fairvalue at
grant date
RM
Group
Grant 1(a), 2017 5.06 - 4,680,100 (51,000) 4,629,100 3.78
Grant 1(b), 2017 5.27 - 496,600 - 496,600 4.18
Grand total - 5,176,700 (51,000) 5,125,700
Company
Grant 1(a), 2017 5.06 - 3,790,700 - 3,790,700 3.78
Grant 1(b), 2017 5.27 - 496,600 - 496,600 4.18
Grand total - 4,287,300 - 4,287,300
The fair value of the PBLTIP shares granted in which MFRS 2 applies, were determined using the Monte Carlo valuation model. The significant inputs in the model are as follows:
Entitlement over the Company's shares
Grant 1(a) Grant 1(b)
Reference price 4.43 4.83
Grant date at valuation* 14 Apr 2017 13 Oct 2017
Vesting date 28 Feb 2020 15 Aug 2020
Closing share price at grant date* RM5.06 RM5.27
Expected dividend yield 2.02% 2.02%
Risk free interest rates(Yield of Malaysian Government Securities) 3.48% 3.46%
Expected volatility# 20.56% 22.06%
# The expected volatility rate of the Company’s PBLTIP shares was derived using three (3) years period on daily basis historical volatility due to availability of data with more data points to increase the credibility of assumptions.
* Grant date refers to the date where majority of employees accepted the offer.
The amounts recognised in the financial statements as disclosed in Note 7(c) and 7(d) to the financial statements for all employees (including Directors) arising from the Axiata PBLTIP are summarised as below:
Group Company
2017RM’000
2017RM’000
Share-based payment expenses 5,024 4,105

Governance & Audited Financial Statements 2017Audited Financial Statements
103
Notes to the Financial Statements For The Financial Year Ended 31 December 2017
14. EMPLOYEE SHARE OPTION AND SHARE SCHEME (CONTINUED)
(c) Share-based compensation plan of XL
On 10 December 2015, Board of Commissioners of XL approved a long term incentive program 2016-2020 under which the Company’s shares without pre-emptive rights or cash consideration are to be awarded as retention program to motivate employees to enhance performance. The programe was approved by the EGM of shareholders of XL on 10 March 2016.
Under the new scheme, the eligible employees will be contingently granted certain amount of new shares or cash consideration which will vest only if prescribed company performance target is met and the individual employees attaining certain performance rating. XL’s performance is measured based on return on capital employed. Employee’s performance is measured based on average employee’s performance ratings over the relevant vesting period. In addition the employees are required to be with XL up to the end of the relevant vesting period to receive the granted shares issued under this programme. The shares will be issued at the end of the relevent vesting period and are locked up for one (1) year in accordance with prevailing regulation in Indonesia Stock Exchange. The cash consideration will be distributed at the same time with the release date of the shares previously mentioned.
Total share-based compensation expense recognised in the consolidated profit or loss for the financial year ended 31 December 2017 was RM11.9 million (2016: RM15.7 million) as disclosed in Note 7(c) to the financial statements.
(d) Pioneer Grant of edotco Group
On 8 December 2014, edotco Group approved edotco Pioneer Grant to the eligible employees of edotco Group and its subsidiary. The plan is to motivate the employees to drive value creation for edotco Group. Pursuant to the grant letter issued to the eligible employees, the Pioneer Grant will be settled in cash or new ordinary shares of the company upon occurence of certain event during the vesting period, otherwise it is vested in cash.
On 31 March 2015, edotco issued grant letters to eligible employees. The movement in the number of shares over the new ordinary shares of RM1 each of edotco Group, in which the employees are entitled to are as follows:
GroupAt
1 January Grant Adjustments*Lapsed/forfeited
At 31 December
2017 13,183,300 - - (321,500) 12,861,800
2016 13,183,700 - 747,000 (747,400) 13,183,300
* Adjusted refers to re-allocation of grant which was lapsed/forfeited previously to certain new/existing employees under similar terms and conditions.
The total share-based compensation expense recognised in the consolidated profit or loss for the financial year ended 31 December 2017 was RM17.8 million (2016: RM9.9 million).
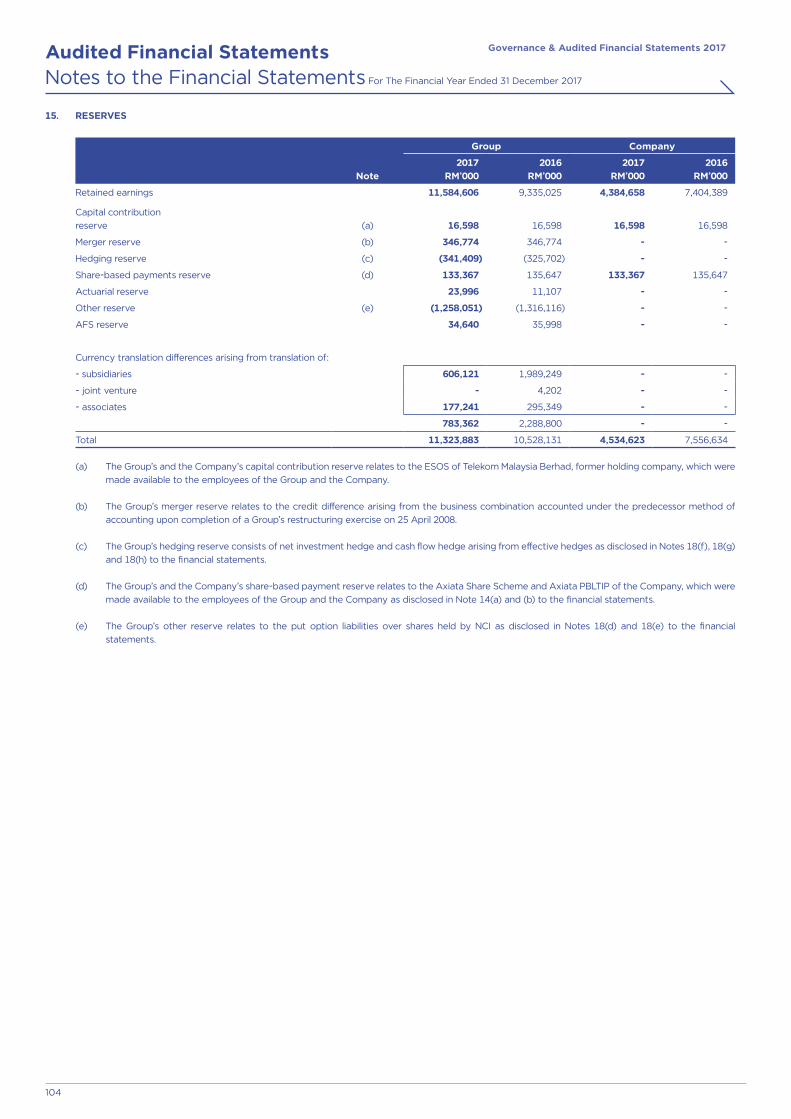
Governance & Audited Financial Statements 2017Audited Financial Statements
104
Notes to the Financial Statements For The Financial Year Ended 31 December 2017
15. RESERVES
Group Company
Note2017
RM’0002016
RM’0002017
RM’0002016
RM’000
Retained earnings 11,584,606 9,335,025 4,384,658 7,404,389
Capital contribution reserve (a) 16,598 16,598 16,598 16,598
Merger reserve (b) 346,774 346,774 - -
Hedging reserve (c) (341,409) (325,702) - -
Share-based payments reserve (d) 133,367 135,647 133,367 135,647
Actuarial reserve 23,996 11,107 - -
Other reserve (e) (1,258,051) (1,316,116) - -
AFS reserve 34,640 35,998 - -
Currency translation differences arising from translation of:
- subsidiaries 606,121 1,989,249 - -
- joint venture - 4,202 - -
- associates 177,241 295,349 - -
783,362 2,288,800 - -
Total 11,323,883 10,528,131 4,534,623 7,556,634
(a) The Group’s and the Company’s capital contribution reserve relates to the ESOS of Telekom Malaysia Berhad, former holding company, which were made available to the employees of the Group and the Company.
(b) The Group’s merger reserve relates to the credit difference arising from the business combination accounted under the predecessor method of accounting upon completion of a Group’s restructuring exercise on 25 April 2008.
(c) The Group’s hedging reserve consists of net investment hedge and cash flow hedge arising from effective hedges as disclosed in Notes 18(f), 18(g) and 18(h) to the financial statements.
(d) The Group’s and the Company’s share-based payment reserve relates to the Axiata Share Scheme and Axiata PBLTIP of the Company, which were made available to the employees of the Group and the Company as disclosed in Note 14(a) and (b) to the financial statements.
(e) The Group’s other reserve relates to the put option liabilities over shares held by NCI as disclosed in Notes 18(d) and 18(e) to the financial statements.

Governance & Audited Financial Statements 2017Audited Financial Statements
105
Notes to the Financial Statements For The Financial Year Ended 31 December 2017
16. BORROWINGS
2017 2016
Note W.A.R.F
%
Non-currentRM’000
CurrentRM’000
TotalRM’000
W.A.R.F%
Non-currentRM’000
CurrentRM’000
TotalRM’000
Group
Overseas
Secured:
- Borrowings from financial institutions (a) 5.26 75,525 88,499 164,024 4.00 633,166 177,082 810,248
- Bank overdrafts 33 5.60 - 4,646 4,646 - - - -
Unsecured:
- Borrowings from financial institutions 5.87 3,712,186 2,015,822 5,728,008 6.15 4,139,369 2,646,475 6,785,844
- Sukuk Ijarah (c)(iii) 8.90 561,200 389,436 950,636 10.55 334,998 2,972 337,970
- Bank overdrafts 33 1.46 - 88,178 88,178 4.19 - 62,067 62,067
4.99 4,348,911 2,586,581 6,935,492 5.66 5,107,533 2,888,596 7,996,129
Malaysia
Secured:
- Borrowings from financial institutions (e) 3.44 223,831 357 224,188 2.54 247,038 156,706 403,744
Unsecured:
- Notes (b) 5.35 1,209,045 11,476 1,220,521 5.36 1,337,866 12,719 1,350,585
- Borrowings from financial institutions (d) 1.83 - 1,689,672 1,689,672 3.47 - 2,968,244 2,968,244
- Sukuk (c)(i),(ii) 4.07 9,014,532 99,584 9,114,116 3.91 8,443,035 1,098,144 9,541,179
3.88 10,447,408 1,801,089 12,248,497 3.92 10,027,939 4,235,813 14,263,752
Total 4.28 14,796,319 4,387,670 19,183,989 4.54 15,135,472 7,124,409 22,259,881
Company
Unsecured:
- Borrowings from financial institutions (d) 1.78 - 1,689,672 1,689,672 3.47 - 2,968,244 2,968,244
(a) Secured by way of fixed charge on certain PPE and deposits with financial institutions of certain subsidiaries, as disclosed in Note 25(a) and Note 33 to the financial statements respectively.
(b) USD300.0 million Guaranteed Notes (“Notes”) maturing on 28 April 2020 are guaranteed by the Company. The Notes, which were issued at 99.94%, carry a coupon rate of 5.375% per annum (“p.a.”) (payable semi-annually in arrears) and have a tenure of 10 years from the date of issuance.
(c) Sukuk of the Group consist of a Multi-Currency Sukuk Programme, a Sukuk Murabahah Programme and a Sukuk Ijarah issued as follows:
(i) Multi-currency Sukuk
The Group established a Multi-Currency Sukuk Programme involving the issuance of up to USD1.5 billion (or its equivalent in other currencies based on Islamic Principle). On 12 November 2015, the Group successfully priced the issuance USD denominated 500 million Sukuk pursuant to the Sukuk Programme. The Sukuk, which was issued at par, carries a coupon rate of 3.466% p.a. (payable semi-annually in arrears) and has tenure of five (5) years from the date of issuance.
On 19 November 2015, the Sukuk was listed and quoted on Bursa Malaysia (under the Exempt Regime) and on the Singapore Exchange Securities Trading Limited.
On 24 March 2016, the Group successfully priced the issuance USD denominated 500 million Sukuk pursuant to the Sukuk Programme. The Sukuk, which was issued at par, carries a coupon rate of 4.357% p.a. (payable semi-annually in arrears) and has tenure of ten (10) years from the date of issuance.
Subsequently, on 25 March 2016, the Sukuk was listed and quoted on Bursa Malaysia (under the Exempt Regime) and on the Singapore Exchange Securities Trading Limited.

Governance & Audited Financial Statements 2017Audited Financial Statements
106
Notes to the Financial Statements For The Financial Year Ended 31 December 2017
16. BORROWINGS (CONTINUED)
(c) Sukuk of the Group consist of a Multi-Currency Sukuk Programme, a Sukuk Murabahah Programme and a Sukuk Ijarah issued as follows: (continued)
(ii) Sukuk Murabahah
On 14 August 2012, Celcom via its wholly-owned Celcom Networks Sdn Bhd (“Celcom Networks”) established a Sukuk Murabahah Programme of up to RM5.0 billion in nominal value.
Subsequently, on 29 August 2017, Celcom Networks completed the issuance of Sukuk Series 9 to 11 amounting to RM1.0 billion nominal value of rated Sukuks to finance the repayment of Sukuk borrowings of RM1.0 billion which had fallen due.
The details of the Sukuk Murabahah as at 31 December are as follows:
Notional amountContractualprofit rate1
%Maturity date 2017
RM’million2016
RM’million
Series 2 3.60 29 Aug 2017 - 1,000
Series 3 3.75 29 Aug 2019 1,500 1,500
Series 4 3.90 28 Aug 2020 1,200 1,200
Series 5 4.05 27 Aug 2021 400 400
Series 6 4.20 29 Aug 2022 400 400
Series 7 4.85 28 Oct 2021 150 150
Series 8 5.27 28 Oct 2026 350 350
Series 9 4.85 29 Aug 2022 200 -
Series 10 5.05 29 Aug 2024 350 -
Series 11 5.20 29 Aug 2027 450 -
5,000 5,000
1 payable semi-annually
(iii) Sukuk Ijarah
On 28 October 2015, XL established a Sukuk Ijarah Programme of up to IDR5.0 trillion in nominal value. The Sukuk Programme was established under a 2-year shelf registration programme. The issuance of Shelf Sukuk Ijarah 1 XL Axiata Tranche I Year 2015 (“Tranche I Sukuk”) amounting up to IDR1.5 trillion was based on the Shariah principle of Ijarah with the payment of Ujrah to be made quarterly in arrears. On 2 December 2015, Tranche I Sukuk was listed and quoted on Indonesian Stock Exchange (“IDX”).
The details of Tranche 1 Sukuk are as below:
Annual fixed Ijarah return Maturity date
Nominal value
2017RM’million
2016RM’million
Series B 26,445 2 Dec 2018 76.9 85.9
Series C 33,915 2 Dec 2020 96.3 107.6
Series D 46,750 2 Dec 2022 126.7 141.5
Revenue sharing of Sukuk Ijarah is paid on a quarterly basis where the first payment is due on 2 March 2016 and the last payment is paid simultaneously with payment of principal of each series of the Sukuk Ijarah.
On 28 April 2017, XL issued Sukuk Ijarah namely Shelf Sukuk Ijarah I XL Axiata Tranche II Year 2017 amounting to RM712.9 million (IDR2.18 trillion) with maturity periods between three hundred seventy six (376) days and ten (10) years and was registered in Indonesia Stock Exchange on 2 May 2017.

Governance & Audited Financial Statements 2017Audited Financial Statements
107
Notes to the Financial Statements For The Financial Year Ended 31 December 2017
16. BORROWINGS (CONTINUED)
(c) Sukuk of the Group consist of a Multi-Currency Sukuk Programme, a Sukuk Murabahah Programme and a Sukuk Ijarah issued as follows: (continued)
(iii) Sukuk Ijarah (continued)
The details of Tranche II Sukuk are as below:
Annual fixed Ijarah return Maturity date
Nominal value
2017RM’mil
Series A 75,400 8 May 2018 309.9
Series B 33,768 28 April 2020 119.8
Series C 12,425 28 April 2022 42.3
Series D 23,660 28 April 2024 77.5
Series E 31,584 28 April 2027 100.1
Revenue sharing of Sukuk Ijarah II is paid on a quarterly basis where the first payment is due on 28 July 2017 and the last payment is paid simultaneously with payment of principal of each series of the Sukuk Ijarah II.
(d) On 31 March 2016, the Company undertook a total of RM3,587.2 million (or USD910.0 million) loan from Bank of Tokyo Mitsubishi UFJ, Labuan. The loan has tenure of twelve (12) months from the date of the Facility Agreement and carries a contractual interest rate of LIBOR + applicable interest margin payable at the option of the Company either on one (1), two (2) or three (3) months basis. On 29 July 2016 and 30 September 2016, the Company had early settled a total amount of RM689.0 million (USD170.0 million) and RM321.5 million (USD78.0 million) respectively.
On 15 February 2017, the Company partially settled an amount of RM800.9 million (USD180.0 million) for its loan undertaken with Bank of Tokyo Mitsubishi.
Subsequently the Company refinanced its remaining loan balance of RM2,143.9 million (USD482.0 million) which was due for settlement on 16 March 2017 with Hong Kong and Shanghai Banking Corporation (“HSBC”) and Oversea-Chinese Banking Corporation amounting to RM1,112.0 million (USD250.0 million) and RM1,031.9 million (USD232.0 million) respectively. Both loans have tenure of twelve (12) months from the date of the Facility Agreement and carry contractual interest rate of LIBOR plus applicable interest.
On 14 June 2017, the Company partially settled an amount of RM281.2 million (USD66.0 million) of the loan with HSBC.
(e) Borrowings are secured by charges over shares of edotco SG.
(f) Borrowings of the Group are subject to certain covenants. These covenants require that certain ratios (Debts over Assets, EBITDA to Borrowing/Finance Costs and Debts to EBITDA) to be met, limitation to certain asset sales or transferred and maintaining majority ownership in certain subsidiaries held by the Group. The Group is in compliance with these covenants at each reporting date.
(g) Total floating interest rate borrowings of the Group are RM7,019.1 million (2016: RM9,715.1 million) as at the reporting date.
(h) The Group and Company net movements in borrowings are analysed below:
Group Company
2017RM’000
2017RM’000
At 1 January 22,259,881 2,968,244
Proceeds from borrowings and Sukuk 6,803,244 2,143,936
Repayments of borrowings and Sukuk (8,250,018) (3,226,039)
Overdraft 43,003 -
Foreign exchange gains (741,827) (201,958)
Net finance costs and transaction costs (net of payment) 68,217 5,489
Acquisition of subsidiaries 7,935 -
Currency translation differences (965,500) -
Reclassification to held for sale (40,946) -
At 31 December 19,183,989 1,689,672

Governance & Audited Financial Statements 2017Audited Financial Statements
108
Notes to the Financial Statements For The Financial Year Ended 31 December 2017
16.
BO
RR
OW
ING
S (
CO
NT
INU
ED
)
The
cur
renc
y p
rofil
e o
f th
e b
orr
owin
gs
of
the
Gro
up is
as
follo
ws:
2017
Fu
nct
ion
al c
urr
en
cy20
16F
un
ctio
na
l cu
rre
ncy
RM
R
M’0
00ID
R*
RM
’000
SL
RR
M’0
00B
DT
R
M’0
00O
the
rs
RM
’000
Tota
l R
M’0
00R
M
RM
’000
IDR
RM
’000
SL
RR
M’0
00B
DT
R
M’0
00O
the
rs
RM
’000
Tota
l R
M’0
00
Gro
up
RM
5,
043,
748
--
--
5,04
3,74
85
,03
5,4
32
--
--
5,0
35
,43
2
US
D
7,20
4,75
11,
424,
760
619,
597
474,
609
12,1
269,
735,
843
9,2
28
,32
21
,60
8,9
58
67
5,1
40
67
2,1
68
67
,19
41
2,2
51
,78
2
IDR
-
3,03
6,31
7-
--
3,03
6,31
7-
3,3
72
,18
9-
--
3,3
72
,18
9
SLR
--
353,
484
--
353,
484
--
35
3,5
55
--
35
3,5
55
BD
T
998
--
1,00
3,07
8-
1,00
4,07
6-
--
1,1
93
,68
0-
1,1
93
,68
0
PK
R
5,55
5-
--
-5,
555
--
--
53
,24
35
3,2
43
TH
B-
--
-4,
966
4,96
6-
--
--
-
Tota
l 12
,255
,052
4,46
1,07
797
3,08
11,
477,
687
17,0
9219
,183
,989
14
,26
3,7
54
4,9
81
,14
71
,02
8,6
95
1,8
65
,84
81
20
,43
72
2,2
59
,88
1
Co
mp
any
US
D
1,68
9,67
2-
--
-1,
689,
672
2,9
68
,24
4-
--
-2
,96
8,2
44
* D
eriv
ativ
e fi
nanc
ial i
nstr
umen
ts a
s d
iscl
ose
d in
No
te 1
8(a)
and
(b)
to
the
fina
ncia
l sta
tem
ents
are
ent
ered
on
US
D b
orr
owin
gs
in ID
R f
unct
iona
l cur
renc
y.
US
D:
Uni
ted
Sta
tes
Do
llar
IDR
: In
do
nesi
an R
upia
hS
LR
: S
ri L
anka
n R
upe
eB
DT:
B
ang
lad
eshi
Tak
aP
KR
: P
akis
tani
Rup
ee
TH
B:
Tha
i Bah
t

Governance & Audited Financial Statements 2017Audited Financial Statements
109
Notes to the Financial Statements For The Financial Year Ended 31 December 2017
16. BORROWINGS (CONTINUED)
The carrying amounts and fair value of the Group’s borrowings are as follows:
2017 2016
CarryingamountRM’000
Fair valueRM’000
CarryingamountRM’000
Fair valueRM’000
Group
Overseas:
- Borrowings1 5,984,856 5,984,856 7,658,159 7,658,159
- Sukuk Ijarah2 950,636 1,037,322 337,970 374,120
6,935,492 7,022,178 7,996,129 8,032,279
Malaysia:
- Notes2 1,220,521 1,286,114 1,350,585 1,449,192
- Multi-currency Sukuk2 4,067,485 4,207,043 4,505,749 4,554,265
- Sukuk Murabahah3 5,046,631 5,437,265 5,035,430 5,012,332
- Borrowings1 1,913,860 1,913,860 3,371,988 3,371,988
12,248,497 12,844,282 14,263,752 14,387,777
19,183,989 19,866,460 22,259,881 22,420,056
1 The fair values are calculated based on cash flows discounted using a rate based on the borrowing rate which ranges from 1.64% to 12.10% (2016: 1.10% to 12.10%) p.a. and are within level 2 of the fair value hierarchy.
2 The fair values are based on quoted prices in an active market and is within level 1 of the fair value hierarchy.
3 The fair values are based on quoted prices in an active market and is within level 1 of the fair value hierarchy (2016: based on quoted prices and where quoted prices are not available, fair values are determined based on cash flows discounted using a borrowing rate at 4.6%).
17. FINANCIAL INSTRUMENTS BY CATEGORIES
Note
2017 2016
Loans andreceivables
RM’000
Assets atFVTPL
RM’000AFS
RM’000Total
RM’000
Loans andreceivables
RM’000
Assets atFVTPL
RM’000AFS
RM’000Total
RM’000
Restated
Group
Financial assets
Derivative financial instruments 18 - 196,886 - 196,886 - 401,053 - 401,053
Long term receivables 29 174,864 - - 174,864 87,089 - - 87,089
AFS financial asset - - 62,030 62,030 - - 63,925 63,925
Trade and other receivables 2,402,340 - - 2,402,340 2,108,641 - - 2,108,641
Financial assets at FVTPL - 64 - 64 - 18 - 18
Deposits, cash and bank balances 33 6,812,868 - - 6,812,868 5,332,414 - - 5,332,414
Total 9,390,072 196,950 62,030 9,649,052 7,528,144 401,071 63,925 7,993,140
Note
2017 2016
Liabilities atFVTPL
RM’000
Otherfinancialliabilities
RM’000Total
RM’000
Liabilities atFVTPL
RM’000
Otherfinancialliabilities
RM’000Total
RM’000
Restated
Group
Financial liabilities
Borrowings 16 - 19,183,989 19,183,989 - 22,259,881 22,259,881
Derivative financial instruments 18 196,836 1,396,946 1,593,782 6,077 1,322,430 1,328,507
Trade and other payables excluding statutory liabilities - 10,527,169 10,527,169 - 9,944,670 9,944,670
Total 196,836 31,108,104 31,304,940 6,077 33,526,981 33,533,058
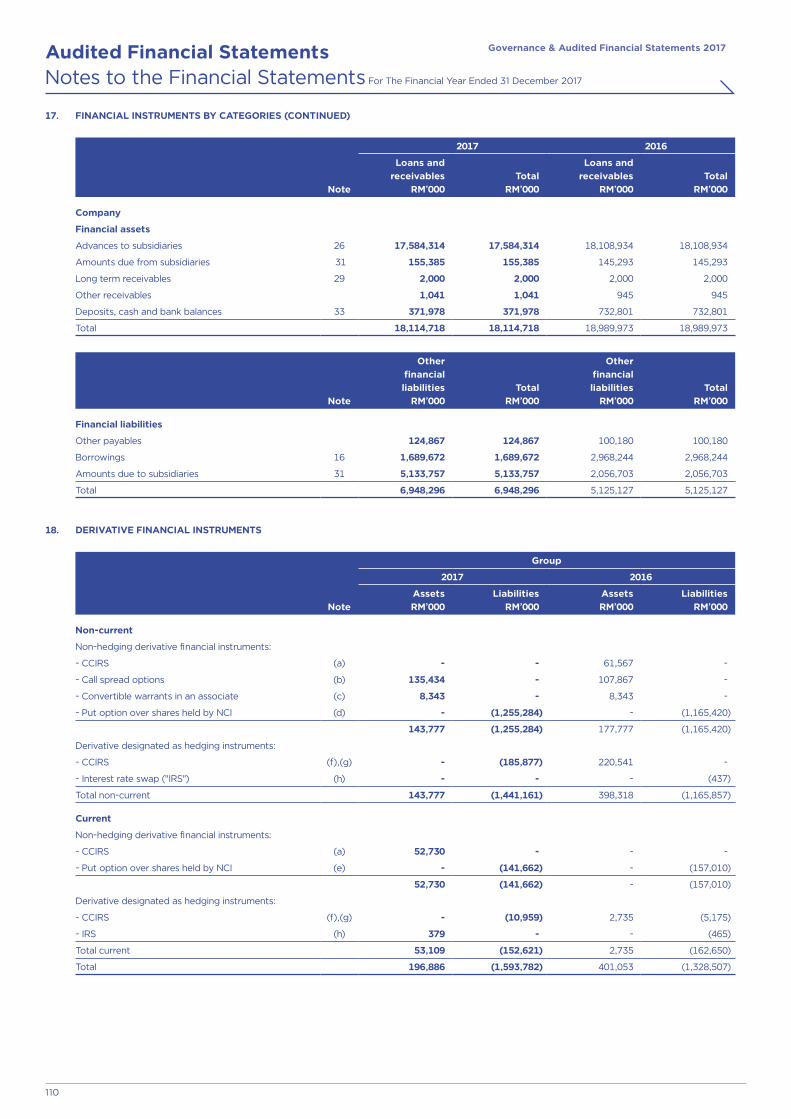
Governance & Audited Financial Statements 2017Audited Financial Statements
110
Notes to the Financial Statements For The Financial Year Ended 31 December 2017
17. FINANCIAL INSTRUMENTS BY CATEGORIES (CONTINUED)
Note
2017 2016
Loans and receivables
RM’000Total
RM’000
Loans and receivables
RM’000Total
RM’000
Company
Financial assets
Advances to subsidiaries 26 17,584,314 17,584,314 18,108,934 18,108,934
Amounts due from subsidiaries 31 155,385 155,385 145,293 145,293
Long term receivables 29 2,000 2,000 2,000 2,000
Other receivables 1,041 1,041 945 945
Deposits, cash and bank balances 33 371,978 371,978 732,801 732,801
Total 18,114,718 18,114,718 18,989,973 18,989,973
Note
Other financialliabilities
RM’000Total
RM’000
Other financialliabilities
RM’000Total
RM’000
Financial liabilities
Other payables 124,867 124,867 100,180 100,180
Borrowings 16 1,689,672 1,689,672 2,968,244 2,968,244
Amounts due to subsidiaries 31 5,133,757 5,133,757 2,056,703 2,056,703
Total 6,948,296 6,948,296 5,125,127 5,125,127
18. DERIVATIVE FINANCIAL INSTRUMENTS
Note
Group
2017 2016
Assets RM’000
Liabilities RM’000
Assets RM’000
Liabilities RM’000
Non-current
Non-hedging derivative financial instruments:
- CCIRS (a) - - 61,567 -
- Call spread options (b) 135,434 - 107,867 -
- Convertible warrants in an associate (c) 8,343 - 8,343 -
- Put option over shares held by NCI (d) - (1,255,284) - (1,165,420)
143,777 (1,255,284) 177,777 (1,165,420)
Derivative designated as hedging instruments:
- CCIRS (f),(g) - (185,877) 220,541 -
- Interest rate swap ("IRS") (h) - - - (437)
Total non-current 143,777 (1,441,161) 398,318 (1,165,857)
Current
Non-hedging derivative financial instruments:
- CCIRS (a) 52,730 - - -
- Put option over shares held by NCI (e) - (141,662) - (157,010)
52,730 (141,662) - (157,010)
Derivative designated as hedging instruments:
- CCIRS (f),(g) - (10,959) 2,735 (5,175)
- IRS (h) 379 - - (465)
Total current 53,109 (152,621) 2,735 (162,650)
Total 196,886 (1,593,782) 401,053 (1,328,507)
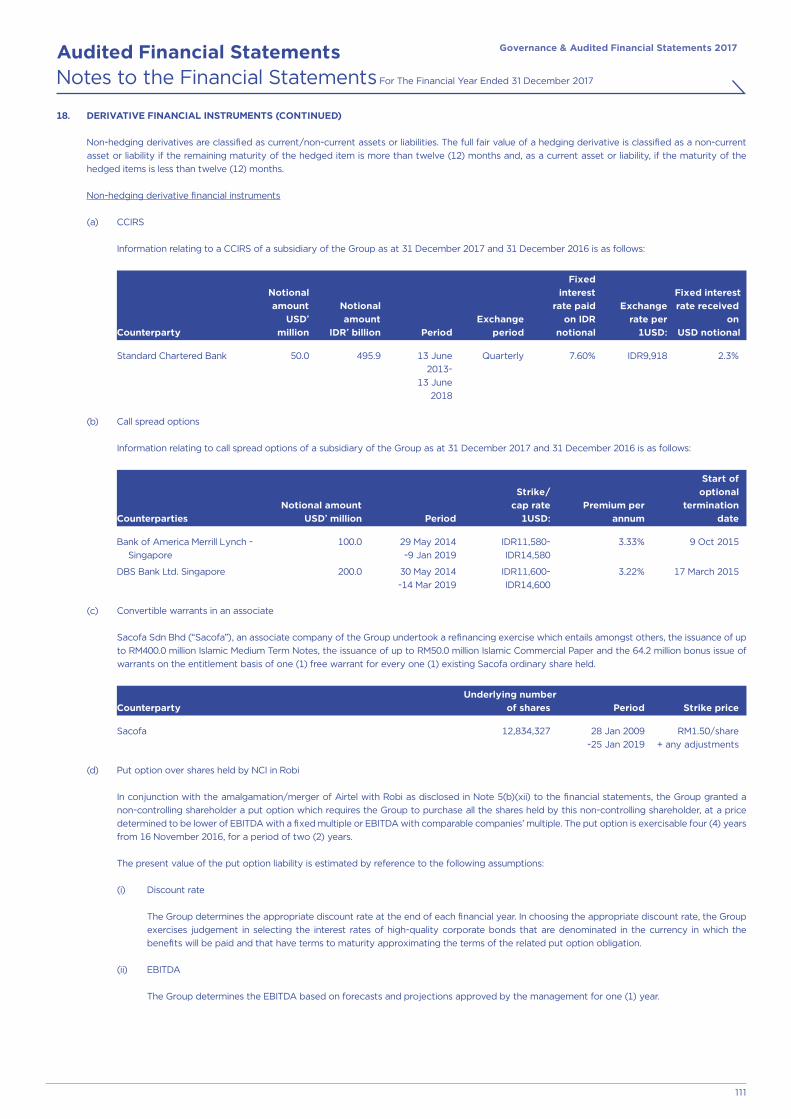
Governance & Audited Financial Statements 2017Audited Financial Statements
111
Notes to the Financial Statements For The Financial Year Ended 31 December 2017
18. DERIVATIVE FINANCIAL INSTRUMENTS (CONTINUED)
Non-hedging derivatives are classified as current/non-current assets or liabilities. The full fair value of a hedging derivative is classified as a non-current asset or liability if the remaining maturity of the hedged item is more than twelve (12) months and, as a current asset or liability, if the maturity of the hedged items is less than twelve (12) months.
Non-hedging derivative financial instruments
(a) CCIRS
Information relating to a CCIRS of a subsidiary of the Group as at 31 December 2017 and 31 December 2016 is as follows:
Counterparty
Notional amount
USD’ million
Notional amount
IDR’ billion PeriodExchange
period
Fixedinterest
rate paidon IDR
notional
Exchange rate per
1USD:
Fixed interest rate received
on USD notional
Standard Chartered Bank 50.0 495.9 13 June 2013-
13 June 2018
Quarterly 7.60% IDR9,918 2.3%
(b) Call spread options Information relating to call spread options of a subsidiary of the Group as at 31 December 2017 and 31 December 2016 is as follows:
CounterpartiesNotional amount
USD’ million Period
Strike/cap rate
1USD:Premium per
annum
Start of optional
termination date
Bank of America Merrill Lynch - Singapore
100.0 29 May 2014-9 Jan 2019
IDR11,580-IDR14,580
3.33% 9 Oct 2015
DBS Bank Ltd. Singapore 200.0 30 May 2014 -14 Mar 2019
IDR11,600-IDR14,600
3.22% 17 March 2015
(c) Convertible warrants in an associate
Sacofa Sdn Bhd (“Sacofa”), an associate company of the Group undertook a refinancing exercise which entails amongst others, the issuance of up to RM400.0 million Islamic Medium Term Notes, the issuance of up to RM50.0 million Islamic Commercial Paper and the 64.2 million bonus issue of warrants on the entitlement basis of one (1) free warrant for every one (1) existing Sacofa ordinary share held.
CounterpartyUnderlying number
of shares Period Strike price
Sacofa 12,834,327 28 Jan 2009 -25 Jan 2019
RM1.50/share + any adjustments
(d) Put option over shares held by NCI in Robi
In conjunction with the amalgamation/merger of Airtel with Robi as disclosed in Note 5(b)(xii) to the financial statements, the Group granted a non-controlling shareholder a put option which requires the Group to purchase all the shares held by this non-controlling shareholder, at a price determined to be lower of EBITDA with a fixed multiple or EBITDA with comparable companies’ multiple. The put option is exercisable four (4) years from 16 November 2016, for a period of two (2) years.
The present value of the put option liability is estimated by reference to the following assumptions:
(i) Discount rate
The Group determines the appropriate discount rate at the end of each financial year. In choosing the appropriate discount rate, the Group exercises judgement in selecting the interest rates of high-quality corporate bonds that are denominated in the currency in which the benefits will be paid and that have terms to maturity approximating the terms of the related put option obligation.
(ii) EBITDA
The Group determines the EBITDA based on forecasts and projections approved by the management for one (1) year.

Governance & Audited Financial Statements 2017Audited Financial Statements
112
Notes to the Financial Statements For The Financial Year Ended 31 December 2017
18. DERIVATIVE FINANCIAL INSTRUMENTS (CONTINUED)
Non-hedging derivative financial instruments (continued)
(d) Put option over shares held by NCI in Robi (continued)
The present value of the put option liability is estimated by reference to the following assumptions: (continued)
(iii) Comparable companies’ multiple
The comparable companies’ multiple as estimated by the Group is based on the forecasted enterprise value of comparable companies over respective companies forecasted EBITDA.
If the comparable companies’ multiple exceeds the fixed multiple, the present value of the option as at reporting date will increase by RM306.5 million.
The Group uses judgement to select a variety of methods and makes assumptions based on market conditions existing at the end of each reporting period.
The Group recognised a derivative liability including a corresponding amount in other reserve of RM1,159.4 million on initial recognition of the option in the previous financial year.
(e) Put option over shares held by NCI in edotco SG
The derivative liability relates to a put option granted to Yoma, a non-controlling shareholder of edotco SG on 19 December 2016, which may require the Group to purchase the remaining shares held by Yoma together with a shareholder’s loan, for a purchase price equivalent to USD35.0 million, or such other price as both parties may agree.
Similarly pursuant to the shareholder agreement entered into with Yoma, the Group was granted a call option by Yoma, which is exercisable by the Group at any time requiring Yoma to sell to the Group, the remaining shares held by Yoma together with a shareholder’s loan, for a purchase price at the higher of USD35.0 million and fair market value of the shares.
The Group recognised a derivative liability including a corresponding amount in other reserve of RM156.7 million on initial recognition of the option in the previous financial year.
Derivative designated as hedging instrument
(f) Net investment hedge – CCIRS
The underlying debt instrument for the CCIRS is the Group’s Notes as disclosed in Note 16(b) to the financial statements. The hedging instrument is designed to hedge against foreign currency risk.
Information relating to a CCIRS of a subsidiary of the Group as at 31 December 2017 is as follows:
Counterparties
Notional amount
USD’million
Notional amount
SGD’million Period
Exchange period
Fixed interest
rate paid
on SGD notional
Fixed interest
rate received
on USD notional
Fair value (liabilities)/assets
2017RM’000
2016RM’000
Hong Kong and Shanghai Banking Corporation
150.0 210.7 28 Oct 2010-28 Apr 2020
Semi-annually 4.315% 5.375% (27,648) 46,769
Goldman Sachs
150.0 210.7 28 Oct 2010- 28 Apr 2020
Semi-annually 4.350% 5.375% (28,195) 45,990
The payment of the Group’s SGD notional amount of USD300.0 million is designated as a hedge of net investment in the Group’s investment in its associate. The hedge has been fully effective from inception and for the financial year.
The Group recognised a loss of RM15.8 million (2016: RM67.6 million) in OCI after reclassification of an unrealised foreign exchange gain of RM131.6 million (2016: loss of RM58.2 million) on the underlying Notes from the profit or loss to OCI.
The fair value changes of the derivative are attributable to future exchange rates and interest rate movements.

Governance & Audited Financial Statements 2017Audited Financial Statements
113
Notes to the Financial Statements For The Financial Year Ended 31 December 2017
18. DERIVATIVE FINANCIAL INSTRUMENTS (CONTINUED)
Derivative designated as hedging instrument (continued)
(g) Cash flow hedge – CCIRS
The underlying debt instrument for the CCIRS is the Group’s Multi-currency Sukuk as disclosed in Note 16(c)(i) to the financial statements. The hedging instrument is designed to hedge against foreign currency risk.
Counterparties
Notional amount
USD’million
Notional amount
RM’million Period
Exchange period
Fixed interest
rate paid
on RM notional
Fixed interest
rate received
on USD notional
Fair value (liabilities)/assets
2017RM’000
2016RM’000
CIMB Bank Berhad
255.0 1,025.3 30 Sep 2016-19 Nov 2020
Semi-annually 5.440% 3.466% (11,854) 99,789
Hong Kong and Shanghai Banking Corporation
30.0 122.5 8 Sep 2016- 19 Nov 2020
Semi-annually 5.350% 3.466% (3,085) 10,090
CIMB Bank Berhad
130.0 545.1 20 Dec 2016-24 Mar 2026
Semi-annually 6.656% 4.357% (56,219) 2,027
Hong Kong and Shanghai Banking Corporation
20.0 83.2 28 Oct 2016-24 Mar 2026
Semi-annually 6.730% 4.357% (8,279) 799
Bank of Tokyo Mitsubishi
154.0 640.7 27 Dec 2016- 24 Mar 2026
Semi-annually 6.641% 4.357% (59,713) 12,638
The derivative is designated as cash flow hedge to hedge the currency risk of borrowings denominated in USD. The hedge has been fully effective from inception and during the financial year.
The Group recognised a loss of RM0.8 million (2016: gain of RM1.9 million) in OCI after reclassification of fair value arising from the unrealised foreign exchange losses of RM258.3 million (2016: RM113.8 million) on the CCIRS from the OCI to the profit or loss.
The fair value changes of the derivative are attributable to future exchange rates and interest rate movements.
(h) Cash flow hedge – IRS
The IRS is used to hedge cash flow risk arising from a floating rate borrowing of a subsidiary. The hedging instrument is designed to hedge against interest rate risks.
Information relating to the derivative as at 31 December 2017 is as follows:
Notional amountUSD’ million Period
Exchange period
Fixed interest
rate paid
Fixed interest
rate received
Fair value assets/(liabilities)
2017RM’000
2016RM’000
33.8 13 Jan 2014- 29 July 2018
Quarterly 2.6075% 3 months’LIBOR +1.45%
379 (902)
The fair value changes of the derivative are attributable to interest rate movements

Governance & Audited Financial Statements 2017Audited Financial Statements
114
Notes to the Financial Statements For The Financial Year Ended 31 December 2017
19. DEFERRED INCOME
Group
2017RM’000
2016RM’000
At 1 January 245,894 223,414
Received during the financial year 74,125 65,409
Released to profit or loss (43,426) (42,147)
Currency translation differences (5,678) (782)
At 31 December 270,915 245,894
The deferred income relates to the government grants received by subsidiaries for the purchase of certain qualifying assets.
20. DEFERRED GAIN ON SALE AND LEASE BACK ASSETS
Deferred gain arising from tower sale and finance lease back transaction where the gain is deferred and amortised over lease back period of ten (10) years.
21. TRADE AND OTHER PAYABLES
Group Company
Note
2017RM’000
2016RM’000
Restated
2017RM’000
2016RM’000
Non-current:
Defined benefit plans (a) 91,126 107,937 - -
Finance lease payables (b) 1,254,886 1,121,659 - -
Other payables 298,185 351,757 7,329 5,157
Total non-current 1,644,197 1,581,353 7,329 5,157
Current:
Trade payables 2,720,556 2,595,043 - -
Accruals 5,084,013 3,586,930 18,346 35,849
Customer deposits 94,101 92,332 - -
Business license payable 162,602 95,341 - -
Payroll liabilities 584,325 302,147 46,887 15,367
Other accruals 485,989 207,575 - -
Other payables 1,110,241 2,749,978 106,521 64,331
Finance lease payables (b) 166,304 172,899 - -
USP payables 682,341 388,918 - -
Taxes 461,991 922,574 14,025 14,762
Deferred revenue 1,064,500 1,169,162 - -
Total current 12,616,963 12,282,899 185,779 130,309
Total trade and other payables 14,261,160 13,864,252 193,108 135,466

Governance & Audited Financial Statements 2017Audited Financial Statements
115
Notes to the Financial Statements For The Financial Year Ended 31 December 2017
21. TRADE AND OTHER PAYABLES (CONTINUED)
(a) Defined benefit plans
The Group operates defined benefit plans in Indonesia and Sri Lanka. The movement in the present value of obligations of the defined benefit plans is as follows:
Group
2017RM’000
2016RM’000
At 1 January 107,937 110,785
Acquisition of a subsidiary 308 -
Charge to profit or loss:
- current service cost 13,116 13,179
- interest costs 9,922 10,098
- past service cost (7,902) (10,845)
15,136 12,432
Benefit paid (3,536) (19,045)
Settlement loss - 15,193
Charge to OCI:
- actuarial gains (18,027) (17,202)
Currency translation differences (10,692) 5,774
At 31 December 91,126 107,937
Present value of the defined benefit obligation of the Group is calculated annually by independent actuaries using the projected unit credit method. The principal actuarial valuation assumption used was as follows:
Group
2017 2016
Discount rate (p.a.) 7.3% - 10.5% 8.5% - 12.8%
Salary increment rate (p.a.) 7.0% - 9.0% 9.0% - 12.0%
(b) Finance lease payables are payables related to the sale and lease back of tower assets of a subsidiary.
Details of the lease payables according to the maturity schedule are as follows:
Group
2017RM’000
2016RM’000
Restated
Within one (1) year 166,304 172,899
Between one (1) and five (5) years 641,927 508,571
More than five (5) years 612,959 613,088
Finance lease payables 1,421,190 1,294,558
The movement in lease payable is as below:
2017RM’000
At 1 January 1,294,558
Additions 435,998
Interest accrued 102,033
Repayment:
- leases (153,693)
- interest (126,192)
Currency translation differences (131,514)
1,421,190
The fair value of lease liabilities recognised by XL as at 31 December 2017 is RM1,587 million (2016: RM1,405 million).
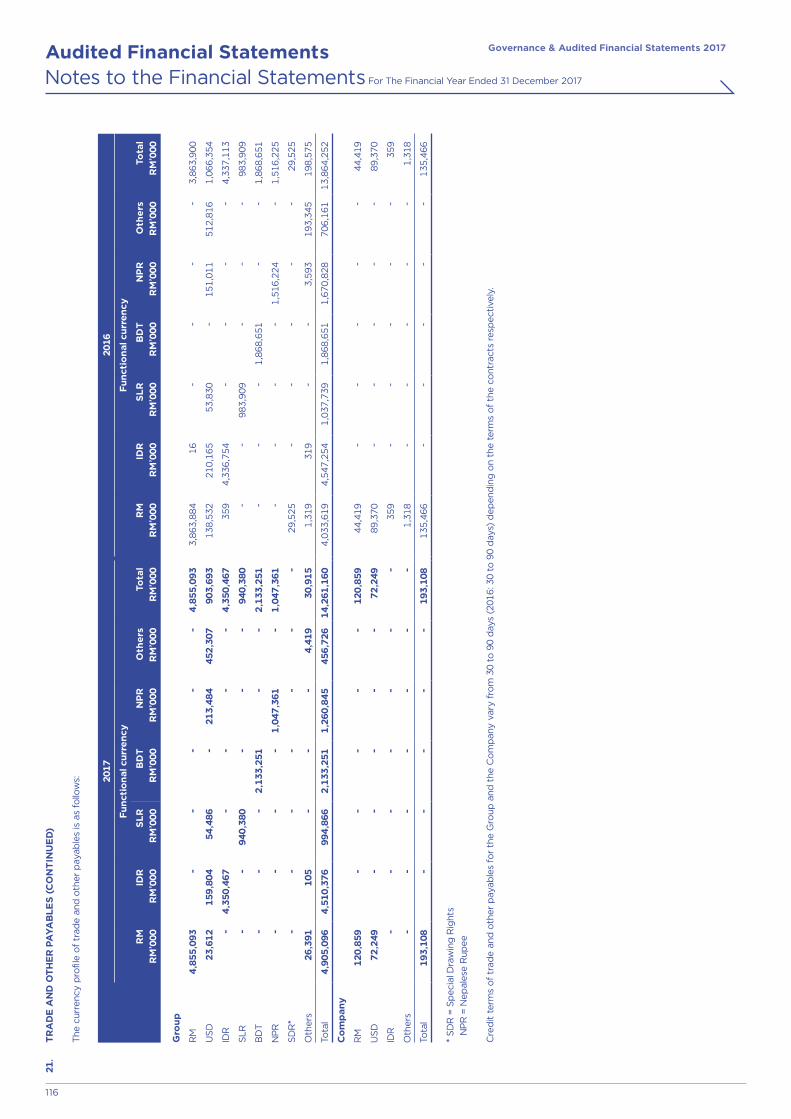
Governance & Audited Financial Statements 2017Audited Financial Statements
116
Notes to the Financial Statements For The Financial Year Ended 31 December 2017
21.
TR
AD
E A
ND
OT
HE
R P
AY
AB
LE
S (
CO
NT
INU
ED
)
T
he c
urre
ncy
pro
file
of
trad
e a
nd o
ther
pay
able
s is
as
follo
ws: 20
1720
16
Fu
nct
ion
al c
urr
en
cyF
un
ctio
na
l cu
rre
ncy
RM
RM
’000
IDR
RM
’000
SL
RR
M’0
00B
DT
RM
’000
NP
RR
M’0
00O
the
rsR
M’0
00To
tal
RM
’000
RM
RM
’000
IDR
RM
’000
SL
RR
M’0
00B
DT
RM
’000
NP
RR
M’0
00O
the
rsR
M’0
00To
tal
RM
’000
Gro
up
RM
4,85
5,09
3-
--
--
4,85
5,09
33
,86
3,8
84
16
--
--
3,8
63
,90
0
US
D23
,612
159,
804
54,4
86-
213,
484
452,
307
903,
693
13
8,5
32
21
0,1
65
53
,83
0-
15
1,0
11
51
2,8
16
1,0
66
,35
4
IDR
-4,
350,
467
--
--
4,35
0,46
73
59
4,3
36
,75
4-
--
-4
,33
7,1
13
SLR
--
940,
380
--
-94
0,38
0-
-9
83
,90
9-
--
98
3,9
09
BD
T-
--
2,13
3,25
1-
-2,
133,
251
--
-1
,86
8,6
51
--
1,8
68
,65
1
NP
R-
--
-1,
047,
361
-1,
047,
361
--
--
1,5
16
,22
4-
1,5
16
,22
5
SD
R*
--
--
--
-2
9,5
25
--
--
-2
9,5
25
Oth
ers
26,3
9110
5-
--
4,41
930
,915
1,3
19
31
9-
-3
,59
31
93
,34
51
98
,57
5
Tota
l4,
905,
096
4,51
0,37
699
4,86
62,
133,
251
1,26
0,84
545
6,72
614
,261
,160
4,0
33
,61
94
,54
7,2
54
1,0
37
,73
91
,86
8,6
51
1,6
70
,82
87
06
,16
11
3,8
64
,25
2
Co
mp
any
RM
120,
859
--
--
-12
0,85
94
4,4
19
--
--
-4
4,4
19
US
D72
,249
--
--
-72
,249
89
,37
0-
--
--
89
,37
0
IDR
--
--
--
-3
59
--
--
-3
59
Oth
ers
--
--
--
-1
,31
8-
--
--
1,3
18
Tota
l19
3,10
8-
--
--
193,
108
13
5,4
66
--
--
-1
35
,46
6
*
SD
R =
Sp
eci
al D
raw
ing
Rig
hts
N
PR
= N
ep
ales
e R
upe
e
C
red
it t
erm
s o
f tr
ade
and
oth
er p
ayab
les
for
the
Gro
up a
nd t
he C
om
pan
y v
ary
fro
m 3
0 to
90
day
s (2
016:
30
to 9
0 d
ays)
de
pen
din
g o
n th
e t
erm
s o
f th
e c
ont
ract
s re
spe
ctiv
ely
.

Governance & Audited Financial Statements 2017Audited Financial Statements
117
Notes to the Financial Statements For The Financial Year Ended 31 December 2017
22. PROVISION FOR LIABILITIES
Group
Note2017
RM’0002016
RM’000Restated
At 1 January (as previously reported) 499,720 417,574
Measurement period adjustment 45 (5,766) -
At 1 January (as restated) 493,954 417,574
Provision for the financial year 4,464 28,432
Acquisition of subsidiaries 4,415 51,047
Accretion of interest 19,319 10,114
Currency translation differences (37,419) 24,024
484,733 531,191
Utilised during the financial year (15,813) (37,237)
At 31 December 468,920 493,954
The provision for liabilities relates to provision for dismantling costs of existing telecommunication network and equipment as disclosed in the significant accounting policies in Note 3(o) to the financial statements.
23. DEFERRED TAXATION
Deferred tax assets and liabilities of the Group are offsetted when there is a legally enforceable right to set off current tax assets against current tax liabilities and when the deferred taxes relate to the same tax authority. The following amounts, determined after appropriate offsetting, are shown in the statements of financial position:
Group
2017RM’000
2016RM’000
Restated
Deferred tax assets (270,046) (291,633)
Deferred tax liabilities 1,672,496 2,195,955
Net deferred tax liabilities 1,402,450 1,904,322
The movement in net deferred tax liabilities of the Group during the financial year is as follows:
Group
Note 2017
RM’0002016
RM’000Restated
At 1 January (as previously reported) 1,949,873 1,561,160
Measurement period adjustment 45 (45,551) -
At 1 January (as restated) 1,904,322 1,561,160
Charge/(credit) to profit or loss:
- PPE (233,762) 180,082
- tax losses (47,068) (162,092)
- provision and others (138,592) (94,467)
11 (419,422) (76,477)
Acquisition of subsidiaries 54,025 386,658
Debit to OCI:
- actuarial reserve 2,801 2,335
Currency translation differences (96,953) 30,646
Reclassification as liabilities classified as held-for-sale 35 (42,323) -
At 31 December 1,402,450 1,904,322

Governance & Audited Financial Statements 2017Audited Financial Statements
118
Notes to the Financial Statements For The Financial Year Ended 31 December 2017
23. DEFERRED TAXATION (CONTINUED)
Breakdown of cumulative balances by each type of temporary differences of the Group:
Group
2017RM’000
2016RM’000
Restated
Deferred tax assets:
- PPE and intangible assets 7,613 49,865
- Tax losses 425,522 426,305
- Provision and others 615,537 573,792
Before offsetting 1,048,672 1,049,962
Offsetting (778,626) (758,329)
After offsetting 270,046 291,633
Deferred tax liabilities:
- PPE and intangible assets 2,450,661 2,946,782
- Others 461 7,502
Before offsetting 2,451,122 2,954,284
Offsetting (778,626) (758,329)
After offsetting 1,672,496 2,195,955
The amounts of deductible temporary differences and unutilised tax losses for which no deferred tax asset is recognised in the statements of financial position are as follows:
Group Company
2017RM’000
2016RM’000
2017RM’000
2016RM’000
Deductible temporary differences 246,988 170,056 62,049 47,229
Unutilised tax losses 746,665 506,216 237,666 133,032
993,653 676,272 299,715 180,261
Tax effect 238,477 162,305 71,932 43,263
The benefits of these tax losses and credit will only be obtained if the Company or the relevant subsidiaries derive future assessable income of a nature and amount sufficient for the benefits to be utilised. The unutilised tax losses have no expiry date.

Governance & Audited Financial Statements 2017Audited Financial Statements
119
Notes to the Financial Statements For The Financial Year Ended 31 December 2017
24. INTANGIBLE ASSETS
Note
Group
GoodwillRM’000
LicensesRM’000
Others *RM’000
TotalRM’000
Net book value
At 1 January (as previously reported) 13,503,850 9,081,240 567,943 23,153,033
Measurement period adjustment 45 263,201 (10,129) - 253,072
At 1 January (as restated) 13,767,051 9,071,111 567,943 23,406,105
Acquisition of subsidiaries 232,733 56,399 91,386 380,518
Additions ^ - 46,886 266,910 313,796
Amortisation 7(a) - (847,539) (125,839) (973,378)
Currency translation differences (244,364) (857,127) 151,823 (949,668)
Reclassification to held-for-sale 35 - (1,087) - (1,087)
At 31 December 2017 13,755,420 7,468,643 952,223 22,176,286
At 1 January 2016 9,958,252 3,839,027 409,206 14,206,485
Acquisition of subsidiaries 3,270,933 4,117,596 112,042 7,500,571
Additions - 1,003,045 120,016 1,123,061
Amortisation 7(a) - (531,409) (99,252) (630,661)
Currency translation differences 537,866 642,852 25,931 1,206,649
At 31 December 2016 (as restated) 13,767,051 9,071,111 567,943 23,406,105
At 31 December 2017
Cost 13,832,917 8,176,847 1,477,659 23,487,423
Accumulated amortisation - (708,204) (525,436) (1,233,640)
Accumulated impairment losses (77,497) - - (77,497)
Net book value 13,755,420 7,468,643 952,223 22,176,286
At 31 December 2016 (as restated)
Cost 13,844,548 11,355,552 971,854 26,171,954
Accumulated amortisation - (2,284,441) (403,911) (2,688,352)
Accumulated impairment losses (77,497) - - (77,497)
Net book value 13,767,051 9,071,111 567,943 23,406,105
* Others mainly represent subscriber acquisition costs, brands and customer contracts and the related customer relationship.
^ Additions during the financial year mainly comprised of subscriber acquisition costs.
In the previous financial year, Malaysian Communications and Multimedia Commission assigned to Celcom Mobile Sdn Bhd (a subsidiary of Celcom), spectrum of 2 x 10 MHz in 900 MHz and 2 x 20 MHz in 1800 MHz bands respectively amounting to RM816.8 million.
The remaining amortisation period of acquired telecommunication licenses with allocated spectrum rights range from one (1) year to twenty six (26) years [2016: two (2) years to twenty seven (27) years].
The carrying amount of the telecommunication licenses of a subsidiary which belongs to Indonesia’s CGU having an indefinite useful life is RM1,702.3 million (2016: RM1,902.2 million).

Governance & Audited Financial Statements 2017Audited Financial Statements
120
Notes to the Financial Statements For The Financial Year Ended 31 December 2017
24. INTANGIBLE ASSETS (CONTINUED)
Impairment tests for goodwill
The Group undertakes an annual test for impairment of its goodwill allocated to the CGUs identified according to operating segment.
The following CGUs, being the lowest level of asset for which the management monitors the goodwill of the Group:
2017 2016
RM’000 RM’000Restated
Mobile segment:
Malaysia 4,031,110 4,031,110
Indonesia 5,205,847 5,439,695
Sri Lanka 264,101 271,173
Cambodia 203,381 225,415
Nepal 3,672,872 3,601,246
Infrastructure segment 298,319 137,562
Others 79,790 60,850
Total 13,755,420 13,767,051
Key assumptions used
The recoverable amount of Malaysia’s, Indonesia’s, Sri Lanka’s, Cambodia’s and Nepal's CGU under mobile segment and infrastructure segment including goodwill in this test is determined as below:
Type of business 2017 2016
Mobile segment:
Malaysia Mobile business VIU VIU
Indonesia Mobile business VIU VIU
Sri Lanka Fixed communication business (consist of fixed telephone, data and infrastructure) and television business
VIU VIU
Cambodia Mobile business VIU VIU
Nepal Mobile business FVLCS FVLCS
Infrastructure segment Telecommunication infrastructure and services FVLCS -
The VIU calculations apply a discounted cash flow model using cash flow projections based on forecasts and projections approved by management covering:
Mobile segment:
- a three (3) year period for the mobile business in Malaysia and Cambodia;- a five (5) year period for mobile business in Indonesia, and- a five (5) period for the fixed telecommunication and television business in Sri Lanka [2016: a ten (10) year period due to the long term nature and
intensive capital required in the initial phase of the business].
The FVLCS calculations apply a discounted cash flow model based on market’s participants’ view [level three (3) in fair value hierarchy] covering a three (3) year period for the mobile business in Nepal and a range from five (5) to ten (10) year period for Infrastructure segment in Pakistan and Myanmar due to long-term customer contracts which are in excess of five (5) years, intensive capital required in the initial phase and expected market penetration growth in these emerging countries beyond five (5) years.
The forecasts and projections reflect management’s expectation of revenue growth, operating costs and margins based on past experience and future outlook of the respective CGUs.

Governance & Audited Financial Statements 2017Audited Financial Statements
121
Notes to the Financial Statements For The Financial Year Ended 31 December 2017
24. INTANGIBLE ASSETS (CONTINUED)
Impairment tests for goodwill (continued)
Key assumptions used (continued)
Cash flows beyond the third (3rd) year for the mobile businesses in Malaysia, Nepal, Cambodia, fifth (5th) year for the mobile business in Indonesia, Sri Lanka and tenth (10th) year for the Infrastructure segment are extrapolated in perpetuity using estimated terminal growth rate which takes into consideration the current Gross Domestic Product, inflation and average growth rate for the telecommunication industry. These rates have been determined with regards to projected growth rates for the market in which the CGUs participate and are not expected to exceed the long term average growth rates for this markets.
Pre-tax discount rates applied to the cash flow forecasts are derived from the pre-tax CGU at the date of assessment of the respective CGU that reflects the risk of the CGU.
The following assumptions have been applied in the VIU and FVLCS calculations:
Infrastructure segment
Mobile segment
Nepal Cambodia Sri Lanka Indonesia Malaysia
2017
Discount rate 13.7%-14.2% 11.5% 13.5% 14.4% 10.2% 11.6%
Terminal growth rate 5.0% 4.0% 2.0% 3.0% 3.0% 0.0%
Revenue growth rate7.9% to 44.7%over 10 years
0.4% to 4.5% over 3 years
1.8% to 4.6% over 3 years
7.0% to 14.5% over 5 years
5.0% to 6.4% over 5 years
0.5% to 3.4% over 3 years
2016
Discount rate - 13.0% 19.4% 14.7% 12.0% 11.9%
Terminal growth rate - 4.0% 2.0% 3.0% 3.0% 0.0%
Revenue growth rate-
2.1% to 4.2% over 3 years
5.3% to 5.6% over 5 years
7.0% to 25.3% over 5 years
6.7% to 7.1% over 5 years
2.0% to 3.9%
over 3 years
Based on the test above, the Malaysia, Indonesia, Sri Lanka, Nepal, Cambodia and Infrastructure segment CGUs’ goodwill are not impaired as the recoverable amounts exceeds the carrying amounts included in the financial statements.
The Group’s review includes an impact assessment of changes in key assumptions. Based on the sensitivity analysis performed, the Directors concluded that no reasonable change in the base case assumptions would cause the carrying amounts of the CGUs to exceed its recoverable amounts.

Governance & Audited Financial Statements 2017Audited Financial Statements
122
Notes to the Financial Statements For The Financial Year Ended 31 December 2017
25. PROPERTY, PLANT AND EQUIPMENT
NoteLand
RM’000Buildings
RM’000
Telecom-munication
networkequipment
RM’000
Movableplant and
equipmentRM’000
ComputersupportsystemsRM’000
Capital work-in progress
RM’000Total
RM’000
Group
Net book value
At 1 January (as previously reported) 508,831 229,766 23,240,447 533,345 658,083 2,295,659 27,466,131
Measurement period adjustment 45 - - 15,474 - - - 15,474
At 1 January (as restated) 508,831 229,766 23,255,921 533,345 658,083 2,295,659 27,481,605
Addition * 50,406 38,658 5,454,707 251,518 371,405 534,111 6,700,805
Inter-classification (12,811) 10,949 (367,362) 42,510 326,012 702 -
Acquisition of subsidiaries 2,420 294 109,945 9,179 263 17,729 139,830
Disposal (1,223) (275) (17,930) (5,474) (5,301) (13,648) (43,851)
Written off 7(a) - (1) (21,654) (35) (4) (115) (21,809)
Depreciation 7(a) (80,509) (34,552) (4,284,025) (182,585) (432,702) - (5,014,373)
Impairment 7(a) - - - (14,802) - - (14,802)
Reversal of impairment 7(a) - - 10,369 - - 28,106 38,475
Reclassification to held-for-sale (5,607) (1,974) (242,539) (43,046) - (11,594) (304,760)
Currency translation differences (42,169) (20,266) (1,677,134) (34,353) (39,941) (237,287) (2,051,150)
At 31 December 2017 419,338 222,599 22,220,298 556,257 877,815 2,613,663 26,909,970
* Included in the additions is a finance lease arrangement of a subsidiary amounting to RM436.0 million.
NoteLand
RM’000BuildingRM’000
Telecom-munication
networkequipment
RM’000
Movableplant and
equipmentRM’000
ComputersupportsystemsRM’000
Capital work-in-progress
RM’000Total
RM’000
Group
Net book value
At 1 January 2016 533,917 206,828 18,941,971 548,635 690,716 2,211,577 23,133,644
Addition - 28,925 5,767,792 143,289 346,797 (145,584) 6,141,219
Acquisition of subsidiaries 36,742 19,813 1,777,190 5,047 - 208,662 2,047,454
Disposal - (7) (63,980) (28,437) 58 (20,061) (112,427)
Written off 7(a) - - (772) (1,413) (9) (6,722) (8,916)
Depreciation 7(a) (93,873) (31,479) (4,315,390) (134,797) (388,708) - (4,964,247)
Impairment 7(a) - - (7,077) (2,474) (1,014) (51,801) (62,366)
Sale and lease back assets - - 336,488 - - - 336,488
Currency translation differences 32,045 5,686 819,699 3,495 10,243 99,588 970,756
At 31 December 2016 (as restated) 508,831 229,766 23,255,921 533,345 658,083 2,295,659 27,481,605

Governance & Audited Financial Statements 2017Audited Financial Statements
123
Notes to the Financial Statements For The Financial Year Ended 31 December 2017
25. PROPERTY, PLANT AND EQUIPMENT (CONTINUED)
LandRM’000
BuildingsRM’000
Telecom-munication
networkequipment
RM’000
Movableplant and
equipmentRM’000
ComputersoftwaresystemsRM’000
Capital work-in progress
RM’000Total
RM’000
Group
At 31 December 2017
Cost 1,297,347 510,832 49,984,345 1,602,150 4,532,298 2,773,830 60,700,802
Accumulated depreciation (870,944) (261,087) (27,392,936) (1,022,866) (3,642,232) - (33,190,065)
Accumulated impairment losses (7,065) (27,146) (371,111) (23,027) (12,251) (160,167) (600,767)
Net book value 419,338 222,599 22,220,298 556,257 877,815 2,613,663 26,909,970
At 31 December 2016
Cost 1,405,964 514,960 51,024,070 1,665,528 3,873,887 2,471,415 60,955,824
Accumulated depreciation (890,068) (257,853) (27,382,945) (1,123,266) (3,203,493) - (32,857,625)
Accumulated impairment losses (7,065) (27,341) (385,204) (8,917) (12,311) (175,756) (616,594)
Net book value (as restated) 508,831 229,766 23,255,921 533,345 658,083 2,295,659 27,481,605
(a) Net book value of PPE of certain subsidiaries pledged as security for borrowings (Note 16(a) to the financial statements) are as follows:
Group
2017RM’000
2016RM’000
Telecommunication network 3,726,399 5,311,014
Movable plant and equipment 207,313 237,467
Computer support system 4,467 6,643
Land 14,442 22,572
Buildings 7,911 12,773
3,960,532 5,590,469
(b) XL owns land located throughout Indonesia with Building Use Rights (Hak Guna Bangunan or “HGB”) for periods of 10-59 years (2016: 20-30 years) which will expire between 2018 and 2047 (2016: 2017 and 2046).
As at 31 December 2017, there are 75 locations (2016: 83 locations) with a total book value of RM12.2 million (2016: RM14.3 million) and for which HGB certificates are in the process.
(c) There had been a change in the expected pattern of consumptions of future economic benefits embodied in certain telecommunication network equipment of subsidiaries within the Group due to assets replacement plans. The revision was accounted for as a change in accounting estimate and has increased the depreciation charge in the previous financial year of the Group by RM581.5 million.
(d) Included in the net book value of telecommunication network equipment of the Group are leased assets amounting to RM1,400.4 million (2016: RM1,465.7 million).
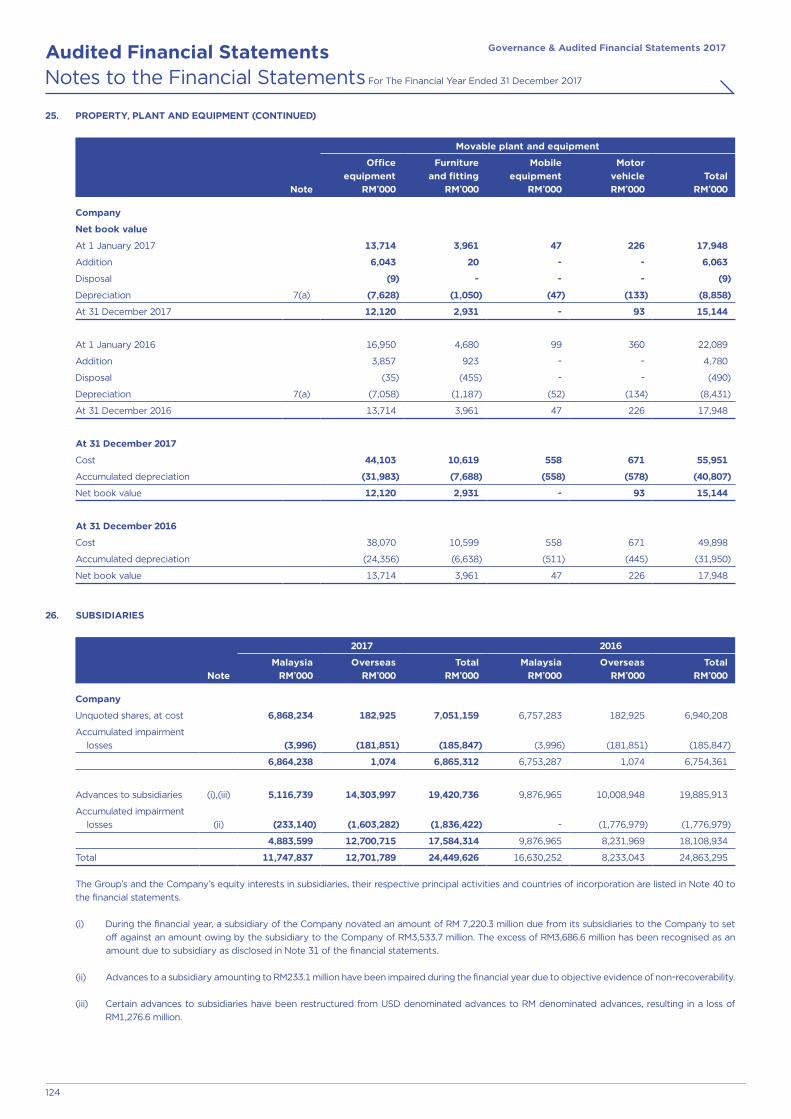
Governance & Audited Financial Statements 2017Audited Financial Statements
124
Notes to the Financial Statements For The Financial Year Ended 31 December 2017
25. PROPERTY, PLANT AND EQUIPMENT (CONTINUED)
Movable plant and equipment
Note
Office equipment
RM’000
Furnitureand fitting
RM’000
Mobile equipment
RM’000
MotorvehicleRM’000
TotalRM’000
Company
Net book value
At 1 January 2017 13,714 3,961 47 226 17,948
Addition 6,043 20 - - 6,063
Disposal (9) - - - (9)
Depreciation 7(a) (7,628) (1,050) (47) (133) (8,858)
At 31 December 2017 12,120 2,931 - 93 15,144
At 1 January 2016 16,950 4,680 99 360 22,089
Addition 3,857 923 - - 4,780
Disposal (35) (455) - - (490)
Depreciation 7(a) (7,058) (1,187) (52) (134) (8,431)
At 31 December 2016 13,714 3,961 47 226 17,948
At 31 December 2017
Cost 44,103 10,619 558 671 55,951
Accumulated depreciation (31,983) (7,688) (558) (578) (40,807)
Net book value 12,120 2,931 - 93 15,144
At 31 December 2016
Cost 38,070 10,599 558 671 49,898
Accumulated depreciation (24,356) (6,638) (511) (445) (31,950)
Net book value 13,714 3,961 47 226 17,948
26. SUBSIDIARIES
2017 2016
Note Malaysia
RM’000Overseas
RM’000Total
RM’000Malaysia
RM’000Overseas
RM’000Total
RM’000
Company
Unquoted shares, at cost 6,868,234 182,925 7,051,159 6,757,283 182,925 6,940,208
Accumulated impairment losses (3,996) (181,851) (185,847) (3,996) (181,851) (185,847)
6,864,238 1,074 6,865,312 6,753,287 1,074 6,754,361
Advances to subsidiaries (i),(iii) 5,116,739 14,303,997 19,420,736 9,876,965 10,008,948 19,885,913
Accumulated impairment losses (ii) (233,140) (1,603,282) (1,836,422) - (1,776,979) (1,776,979)
4,883,599 12,700,715 17,584,314 9,876,965 8,231,969 18,108,934
Total 11,747,837 12,701,789 24,449,626 16,630,252 8,233,043 24,863,295
The Group’s and the Company’s equity interests in subsidiaries, their respective principal activities and countries of incorporation are listed in Note 40 to the financial statements.
(i) During the financial year, a subsidiary of the Company novated an amount of RM 7,220.3 million due from its subsidiaries to the Company to set off against an amount owing by the subsidiary to the Company of RM3,533.7 million. The excess of RM3,686.6 million has been recognised as an amount due to subsidiary as disclosed in Note 31 of the financial statements.
(ii) Advances to a subsidiary amounting to RM233.1 million have been impaired during the financial year due to objective evidence of non-recoverability. (iii) Certain advances to subsidiaries have been restructured from USD denominated advances to RM denominated advances, resulting in a loss of
RM1,276.6 million.

Governance & Audited Financial Statements 2017Audited Financial Statements
125
Notes to the Financial Statements For The Financial Year Ended 31 December 2017
26. SUBSIDIARIES (CONTINUED)
(a) The currency profile of advances to subsidiaries is as follows:
Company
2017RM’000
2016RM’000
RM 11,041,558 5,053,392
USD 6,542,756 13,055,542
17,584,314 18,108,934
The advances are unsecured and are non-interest bearing with no fixed terms of repayment. The Company does not anticipate any repayment of the advances in the foreseeable future.
(b) NCI
The total NCI of the Group as at reporting date is RM 5,773.4 million (2016: RM5,037.5 million), of which:
• RM2,153.8 million (2016: RM2,374.0 million) is attributable to mobile segment-Indonesia;• RM929.1 million (2016:RM1,037.2 million) is attributable to mobile segment-Nepal;• RM824.2 million (2016: RM1,106.7 million) is attributable to mobile segment-Bangladesh; and• RM1,437.4 million is attributable to Infrastructure segment.
The remaining NCI of the Group are immaterial individually.
The information below is before inter-company eliminations.
(i) The summarised statement of comprehensive income for the financial year ended 31 December are as follows:
Infrastructure business
Mobile business
Indonesia Bangladesh Nepal
Note2017
RM’0002017
RM’0002016
RM’0002017
RM’0002016
RM’0002017
RM’0002016
RM’000
Profit/(loss) for the financial year 38 170,150 116,839 112,933 (104,367) (205,630) 711,430 568,446
OCI (234,874) (738,208) 530,867 (481,089) 127,043 (121,488) 322,907
Total comprehensive (expense)/ income (64,724) (621,369) 643,800 (585,456) (78,587) 589,942 891,353
Profit/(loss) for the financial year attributable to NCI 65,347 39,305 48,445 (34,660) (56,596) 142,286 113,689
Dividend paid to NCI - - - - - 167,478 79,512
(ii) The summarised statement of financial position as at 31 December are as follows:
Infrastructure business
Mobile business
Indonesia Bangladesh Nepal
2017RM’000
2017RM’000
2016RM’000
2017RM’000
2016RM’000
2017RM’000
2016RM’000
Non-current assets 2,688,655 14,589,170 15,908,980 6,157,194 7,506,954 2,019,594 2,128,101
Current assets 1,935,201 2,116,653 2,300,888 825,904 861,461 3,025,760 2,605,428
Non-current liabilities (460,109) (5,800,294) (6,396,965) (425,169) (901,762) (193,893) (338,416)
Current liabilities (726,823) (4,506,276) (4,792,280) (3,630,762) (3,506,777) (2,276,785) (1,572,934)
Net assets 3,436,924 6,399,253 7,020,623 2,927,167 3,959,876 2,574,676 2,822,179

Governance & Audited Financial Statements 2017Audited Financial Statements
126
Notes to the Financial Statements For The Financial Year Ended 31 December 2017
26. SUBSIDIARIES (CONTINUED)
(b) NCI (continued)
The information below is before inter-company eliminations.
(iii) The summarised statement of cash flows as at 31 December are as follows:
Infrastructure business
Mobile business
Indonesia Bangladesh Nepal
2017RM’000
2017RM’000
2016RM’000
2017RM’000
2016RM’000
2017RM’000
2016RM’000
Net cash flow from/(used in) operating activities 402,550 2,864,427 2,434,893 (118,743) 471,667 675,445 394,199
Net cash flow (used in)/from investing activities (1,002,365) (1,977,196) (1,281,768) 157,349 (1,295,753) (509,483) (174,685)
Net cash flow from/(used in) financing activities 1,737,387 (573,980) (1,787,718) (161,593) 954,370 (75,272) (409,896)
Net increase/(decrease) in cash and cash equivalent 1,137,572 313,251 (634,593) (122,987) 130,284 90,690 (190,382)
Effect of exchange rate changes on cash and cash equivalents (61,683) (47,728) 70,773 (33,322) 4,466 (7,652) 203,125
Cash and cash equivalents at beginning of financial year 257,325 466,171 1,029,991 241,093 106,343 1,604,357 1,591,614
Cash and cash equivalents at the end of financial year 1,333,214 731,694 466,171 84,784 241,093 1,687,395 1,604,357
27. ASSOCIATES
2017 2016
MalaysiaRM’000
OverseasRM’000
TotalRM’000
MalaysiaRM’000
OverseasRM’000
TotalRM’000
Group
Quoted investments - 8,762,053 8,762,053 - 8,762,053 8,762,053
Unquoted investments 190,820 204,587 395,407 184,868 58,773 243,641
Share of post-acquisition results and reserves (67,152) 444,090 376,938 (58,794) 883,568 824,774
123,668 9,410,730 9,534,398 126,074 9,704,394 9,830,468
Accumulated impairment losses - (1,085,035) (1,085,035) - (1,085,035) (1,085,035)
Currency translation differences - (463,389) (463,389) - (345,281) (345,281)
Share of net assets of associates 123,668 7,862,306 7,985,974 126,074 8,274,078 8,400,152
The Group’s equity interest in the associates, their respective principal activities and countries of incorporation are listed in Note 41 to the financial statements.
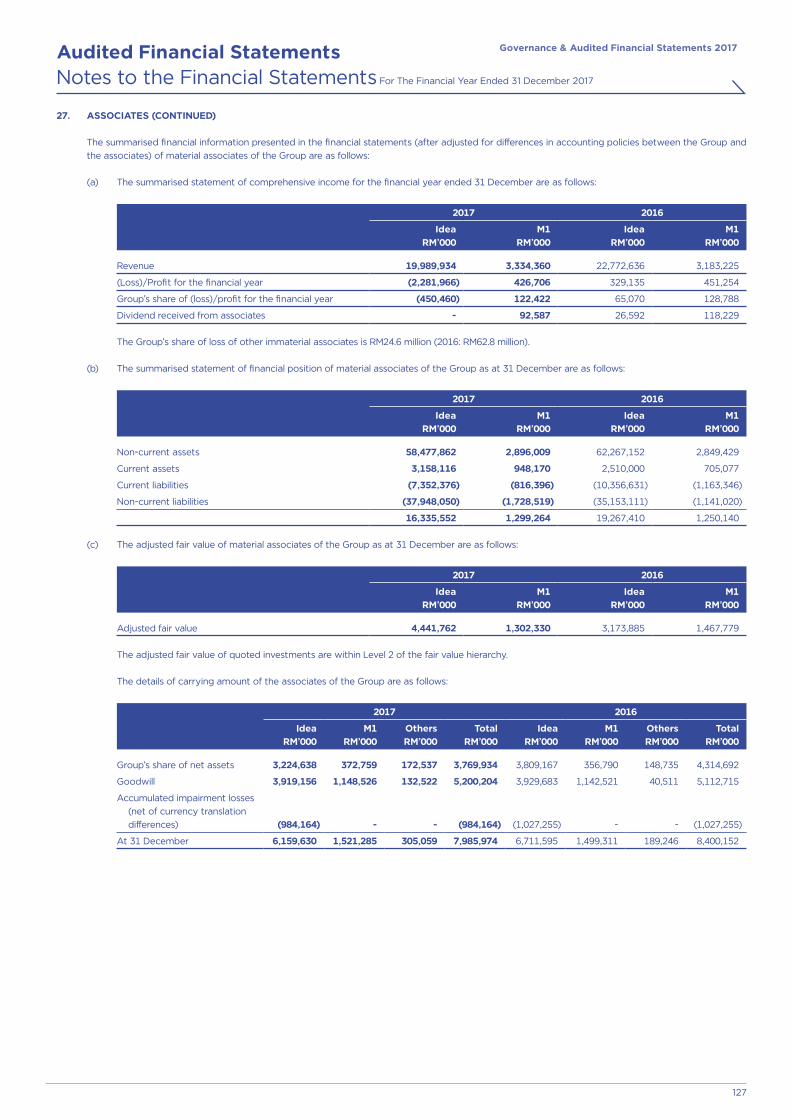
Governance & Audited Financial Statements 2017Audited Financial Statements
127
Notes to the Financial Statements For The Financial Year Ended 31 December 2017
27. ASSOCIATES (CONTINUED)
The summarised financial information presented in the financial statements (after adjusted for differences in accounting policies between the Group and the associates) of material associates of the Group are as follows:
(a) The summarised statement of comprehensive income for the financial year ended 31 December are as follows:
2017 2016
IdeaRM’000
M1RM’000
IdeaRM’000
M1RM’000
Revenue 19,989,934 3,334,360 22,772,636 3,183,225
(Loss)/Profit for the financial year (2,281,966) 426,706 329,135 451,254
Group’s share of (loss)/profit for the financial year (450,460) 122,422 65,070 128,788
Dividend received from associates - 92,587 26,592 118,229
The Group’s share of loss of other immaterial associates is RM24.6 million (2016: RM62.8 million).
(b) The summarised statement of financial position of material associates of the Group as at 31 December are as follows:
2017 2016
IdeaRM’000
M1RM’000
IdeaRM’000
M1RM’000
Non-current assets 58,477,862 2,896,009 62,267,152 2,849,429
Current assets 3,158,116 948,170 2,510,000 705,077
Current liabilities (7,352,376) (816,396) (10,356,631) (1,163,346)
Non-current liabilities (37,948,050) (1,728,519) (35,153,111) (1,141,020)
16,335,552 1,299,264 19,267,410 1,250,140
(c) The adjusted fair value of material associates of the Group as at 31 December are as follows:
2017 2016
IdeaRM’000
M1RM’000
IdeaRM’000
M1RM’000
Adjusted fair value 4,441,762 1,302,330 3,173,885 1,467,779
The adjusted fair value of quoted investments are within Level 2 of the fair value hierarchy.
The details of carrying amount of the associates of the Group are as follows:
2017 2016
IdeaRM’000
M1RM’000
OthersRM’000
TotalRM’000
IdeaRM’000
M1RM’000
OthersRM’000
TotalRM’000
Group’s share of net assets 3,224,638 372,759 172,537 3,769,934 3,809,167 356,790 148,735 4,314,692
Goodwill 3,919,156 1,148,526 132,522 5,200,204 3,929,683 1,142,521 40,511 5,112,715
Accumulated impairment losses (net of currency translation differences) (984,164) - - (984,164) (1,027,255) - - (1,027,255)
At 31 December 6,159,630 1,521,285 305,059 7,985,974 6,711,595 1,499,311 189,246 8,400,152

Governance & Audited Financial Statements 2017Audited Financial Statements
128
Notes to the Financial Statements For The Financial Year Ended 31 December 2017
27. ASSOCIATES (CONTINUED)
List of contingent liabilities of an associate, Idea as at 31 December are as follows:
Description
Potential exposure
2017RM’million
2016RM’million
1. One-off excess spectrum charges On 8 January 2013, the local regulator, the Department of Telecommunications (“DoT”) had issued
demand notices towards one time spectrum charges:
(a) for spectrum beyond 6.2 MHz in respective service areas for retrospective period from 1 July 2008 to 31 December 2012, amounting to INR3,691.3 million, and
(b) for spectrum beyond 4.4 MHz in respective service areas effective 1 January 2013 till expiry of the period as per respective licenses amounting to INR17,443.7 million.
In the opinion of the Directors, inter-alia, the above demand amounts to alteration of financial terms of the licenses issued in the past. The Directors believe, it is not probable that the claim will materialise and therefore, pending outcome of this matter, no provision has been recognised.
1,340.0 1,396.2
2. Tax notice The Income Tax Department (‘‘Tax Department’’) had issued a INR15.0 billion and INR24.0 billion notice
on an associate. The Tax Department alleged that the licenses, assets and liabilities transferred in between the companies in 2009 resulted in taxable capital gains which Idea and its subsidiary did not treat as taxable.
On 19 October 2016, the Income Tax Appellate Tribunal (“ITAT”) has given its verdict in favour of ABTL which there is no INR24.0 billion capital gain tax arising from the transfer of licenses, assets and liabilities. During the financial year, the ITAT has given its verdict in favour of Idea, hence the INR15.0 billion claim from the Tax Department is no longer outstanding as at year end.
In the opinion of the Directors, it is not probable that the claim will materialise and therefore, pending outcome of this matter, no provision has been recognised.
- 990.9
3. Income tax demands An associate of the Group received various demands by income tax authorities in respect of its income
tax returns for the financial years 2007-08 to 2014-15.
The tax demands are mainly on the account of disallowance of revenue share license fee, disputes on non-applicability of tax deduction at source on pre-paid margin allowed to prepaid distributors and roaming settlements and disallowance of interest proportionate to interest free advances given to wholly owned subsidiaries.
The tax demands for financial years 2008-09 are mainly on the difference between fair value of investment made in Indus Towers Limited and net book value of the assets transferred to Idea Infrastructure Services Limited (a 100.0% subsidiary of the associate, which further through a scheme of merger got merged with Indus Towers Limited under High Court approved scheme). The associate has filed an appeal against these demands at the Commissioner of Income Tax appeals.
In the opinion of the Directors, it is not probable that the claim will materialise and therefore, pending outcome of matters, no provision has been recognised.
4,849.3 4,620.1
4. Other taxes, custom duties and demands under adjudication, licensing, appeal or disputes As at 31 December 2017, other taxes, custom duties, demands under adjudication, licensing, appeal or
disputes amounted to approximately INR86.6 billion (2016: INR88.8 billion).
The above primarily includes demands raised during revenue share license fees assessments. The nature of demands raised due to the difference in interpretation of definition of Adjusted Gross Revenue and other license fee assessment related matters. This also includes disputes relating to alleged non-compliance of licence conditions and other disputes with DoT. Most of these demands are currently before the Hon’ble TDSAT, Hon’ble High court and Hon’ble Supreme Court.
In the opinion of the Directors, it is not probable that the claim will materialise and therefore, pending outcome of matters, no provision has been recognised.
5,490.0 5,945.6
Total exposure 11,679.3 12,952.8
Total exposure share of the Group 2,305.5 2,562.1

Governance & Audited Financial Statements 2017Audited Financial Statements
129
Notes to the Financial Statements For The Financial Year Ended 31 December 2017
27. ASSOCIATES (CONTINUED)
(a) Impairment test on Idea
During the financial year, the Group had undertaken the test of impairment of its investment in Idea following an impairment indicator arising from the shortfall between the carrying value and adjusted fair value. No additional impairment loss was required for the carrying amount of Idea as at 31 December 2017 as its recoverable amount exceeded its carrying amount.
Key assumptions used
The recoverable amount was determined based on VIU calculation, which apply a discounted cash flow model based on the forecasts and projections approved by the management. These forecasts and projections reflect management’s expectations based on the current assessment of market share, expectations of market growth and industry growth as benchmarked with external sources.
The key assumptions used in determining the VIU are:
Assumptions Basis of determination
Projection period 2018-2022 (2016: 2017-2021) years cash flow forecast is used.
Cost of equity 14.50% (2016: 13.40%) was used in line with market analysis.
Terminal growth rate Long term terminal growth rate is estimated to be 4.00% (2016: 4.50%) applied beyond the fifth (5th) year cash flows to perpetuity.
Blended EBITDA margin Ranging from 17.23% in 2018 to 35.90% in 2021 (2016: ranging from 27.00% in 2017 to 35.00% in 2020).
Effective tax rate 34.60% (2016: 34.60%).
Capital expenditure The cash flow forecasts for capital expenditure are based on past experience to provide voice, data products and services in the circles Idea operates in.
Based on management’s assessment, no additional impairment charge is required on the carrying amount of Idea for the financial year ended 31 December 2017. The group’s review includes on impact assessment of changes in key assumptions. The effect of the movement in the key assumptions to the recoverable amount is as follows:
2017
Changes in key assumptions
(Shortfall)*/Headroom
RM’000
Headroom/(Shortfall)*
RM’000
Increase/(decrease) in discount rate by 25 basis points (261,291) 322,947
Increase/(decrease) in terminal growth rate by 25 basis points 230,200 (172,155)
Increase /(decrease) in EBITDA margin by 50 basis points 388,840 (345,237)
* The shortfall represents an impairment loss that will affect the Group’s result.
(b) Impairment test on M1
During the financial year, the Group had undertaken the test of impairment of its investment in M1 following an impairment indicator arising from the shortfall between the carrying value and adjusted fair value. No impairment loss was required for the carrying amount of M1 as at 31 December 2017 as its recoverable amount exceeded its carrying amount.
Key assumptions used
The recoverable amount was determined based on VIU calculation, which apply a discounted cash flow model based on the forecasts and projections approved by the management. These forecasts and projections reflect management’s expectations based on the current assessment of market share, expectations of market growth and industry growth as benchmarked with external sources.
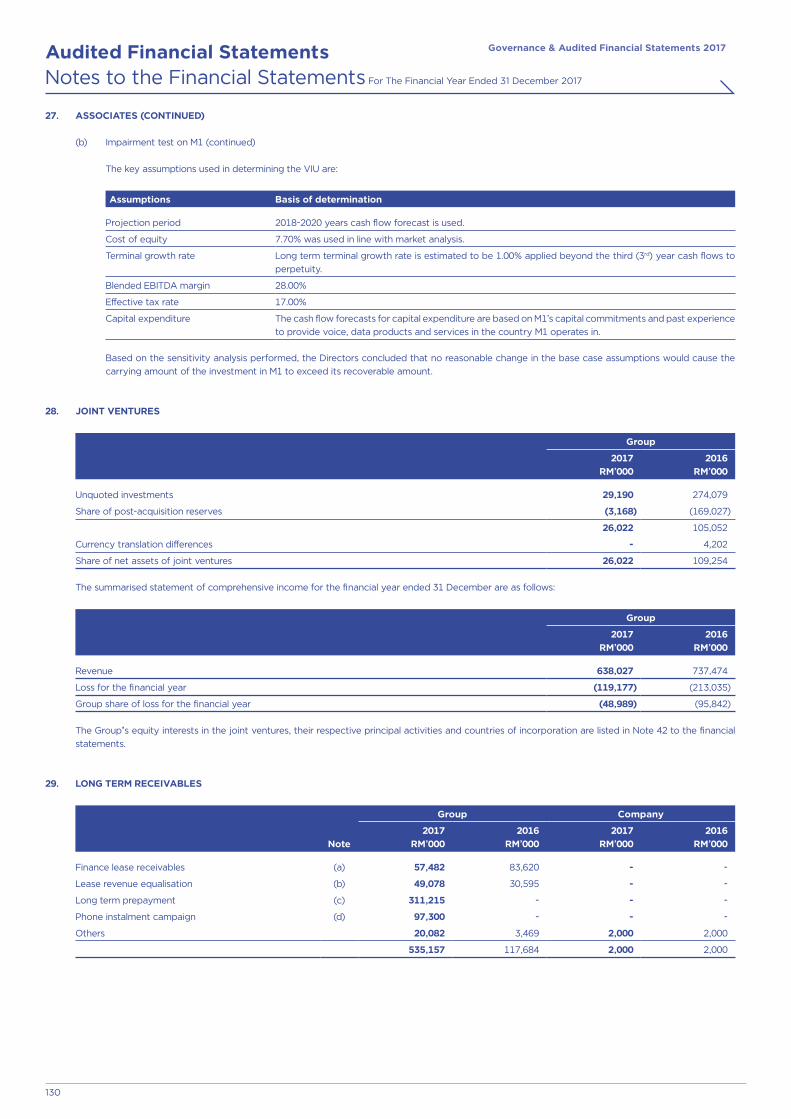
Governance & Audited Financial Statements 2017Audited Financial Statements
130
Notes to the Financial Statements For The Financial Year Ended 31 December 2017
27. ASSOCIATES (CONTINUED)
(b) Impairment test on M1 (continued)
The key assumptions used in determining the VIU are:
Assumptions Basis of determination
Projection period 2018-2020 years cash flow forecast is used.
Cost of equity 7.70% was used in line with market analysis.
Terminal growth rate Long term terminal growth rate is estimated to be 1.00% applied beyond the third (3rd) year cash flows to perpetuity.
Blended EBITDA margin 28.00%
Effective tax rate 17.00%
Capital expenditure The cash flow forecasts for capital expenditure are based on M1’s capital commitments and past experience to provide voice, data products and services in the country M1 operates in.
Based on the sensitivity analysis performed, the Directors concluded that no reasonable change in the base case assumptions would cause the carrying amount of the investment in M1 to exceed its recoverable amount.
28. JOINT VENTURES
Group
2017RM’000
2016RM’000
Unquoted investments 29,190 274,079
Share of post-acquisition reserves (3,168) (169,027)
26,022 105,052
Currency translation differences - 4,202
Share of net assets of joint ventures 26,022 109,254
The summarised statement of comprehensive income for the financial year ended 31 December are as follows:
Group
2017RM’000
2016RM’000
Revenue 638,027 737,474
Loss for the financial year (119,177) (213,035)
Group share of loss for the financial year (48,989) (95,842)
The Group’s equity interests in the joint ventures, their respective principal activities and countries of incorporation are listed in Note 42 to the financial statements.
29. LONG TERM RECEIVABLES
Note
Group Company
2017RM’000
2016RM’000
2017RM’000
2016RM’000
Finance lease receivables (a) 57,482 83,620 - -
Lease revenue equalisation (b) 49,078 30,595 - -
Long term prepayment (c) 311,215 - - -
Phone instalment campaign (d) 97,300 - - -
Others 20,082 3,469 2,000 2,000
535,157 117,684 2,000 2,000
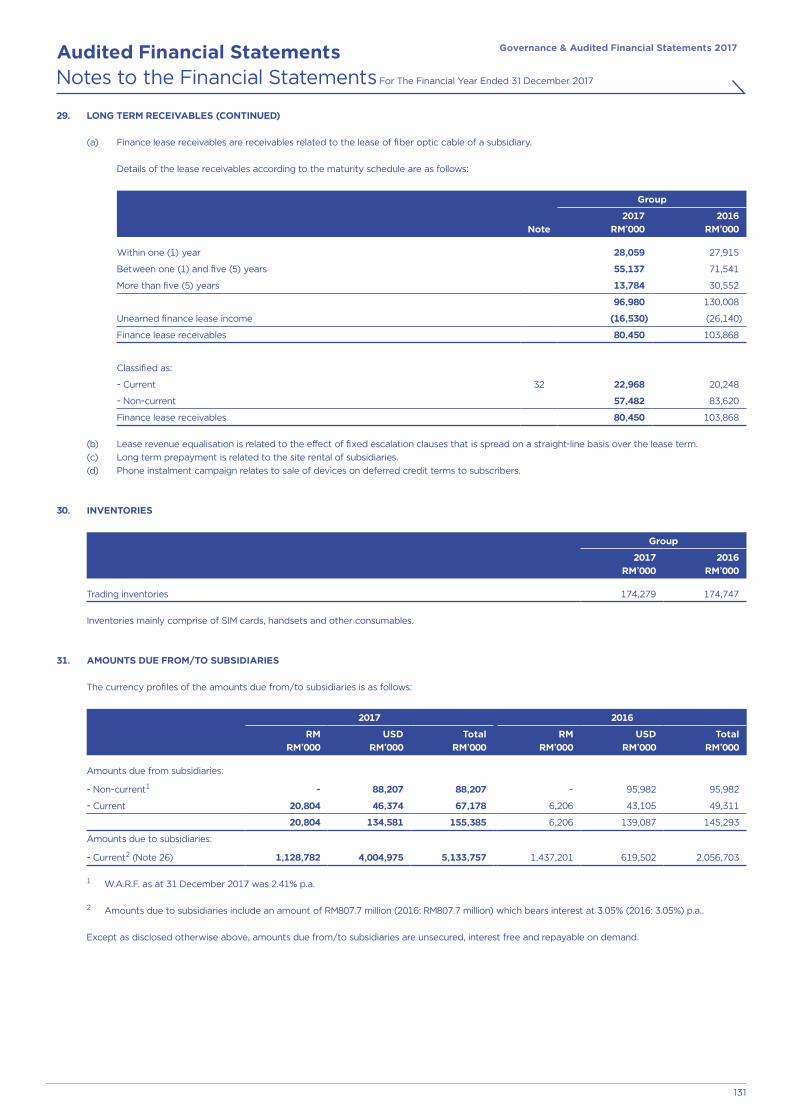
Governance & Audited Financial Statements 2017Audited Financial Statements
131
Notes to the Financial Statements For The Financial Year Ended 31 December 2017
29. LONG TERM RECEIVABLES (CONTINUED)
(a) Finance lease receivables are receivables related to the lease of fiber optic cable of a subsidiary.
Details of the lease receivables according to the maturity schedule are as follows:
Group
Note2017
RM’0002016
RM’000
Within one (1) year 28,059 27,915
Between one (1) and five (5) years 55,137 71,541
More than five (5) years 13,784 30,552
96,980 130,008
Unearned finance lease income (16,530) (26,140)
Finance lease receivables 80,450 103,868
Classified as:
- Current 32 22,968 20,248
- Non-current 57,482 83,620
Finance lease receivables 80,450 103,868
(b) Lease revenue equalisation is related to the effect of fixed escalation clauses that is spread on a straight-line basis over the lease term. (c) Long term prepayment is related to the site rental of subsidiaries.(d) Phone instalment campaign relates to sale of devices on deferred credit terms to subscribers.
30. INVENTORIES
Group
2017RM’000
2016RM’000
Trading inventories 174,279 174,747
Inventories mainly comprise of SIM cards, handsets and other consumables.
31. AMOUNTS DUE FROM/TO SUBSIDIARIES
The currency profiles of the amounts due from/to subsidiaries is as follows:
2017 2016
RMRM’000
USDRM’000
TotalRM’000
RMRM’000
USDRM’000
TotalRM’000
Amounts due from subsidiaries:
- Non-current1 - 88,207 88,207 - 95,982 95,982
- Current 20,804 46,374 67,178 6,206 43,105 49,311
20,804 134,581 155,385 6,206 139,087 145,293
Amounts due to subsidiaries:
- Current2 (Note 26) 1,128,782 4,004,975 5,133,757 1,437,201 619,502 2,056,703
1 W.A.R.F. as at 31 December 2017 was 2.41% p.a.
2 Amounts due to subsidiaries include an amount of RM807.7 million (2016: RM807.7 million) which bears interest at 3.05% (2016: 3.05%) p.a..
Except as disclosed otherwise above, amounts due from/to subsidiaries are unsecured, interest free and repayable on demand.

Governance & Audited Financial Statements 2017Audited Financial Statements
132
Notes to the Financial Statements For The Financial Year Ended 31 December 2017
32. TRADE AND OTHER RECEIVABLES
Group Company
Note2017
RM’0002016
RM’000Restated
2017RM’000
2016RM’000
Trade receivables 2,329,200 1,879,444 - -
Less: Provision for impairment (404,550) (397,805) - -
1,924,650 1,481,639 - -
Other receivables:
Deposits 407,218 285,185 3,692 4,110
Less: Provision for impairment (40,493) (27,030) - -
366,725 258,155 3,692 4,110
Prepayments 1,258,172 2,026,344 14,379 898
Advances on other taxes and supplies - - 1,014 2,107
Staff loans 2,132 2,458 - -
USP receivables 355,534 268,761 - -
Advances 108,945 100,719 154 171
Finance lease receivables 29 22,968 20,248 - -
Other receivables 480,660 621,856 1,041 945
Less: Provision for impairment (23,149) (4,876) - -
457,511 616,980 1,041 945
Total other receivables after provision for impairment 2,571,987 3,293,665 20,280 8,231
Total trade and other receivables after provision for impairment 4,496,637 4,775,304 20,280 8,231
In the previous financial year, a total fair value of RM228.2 million, was acquired via business combination as disclosed in Note 5(b) to the financial statements. The gross contractual amount for those trade receivables is RM247.1 million, of which RM18.9 million was expected to be uncollectible.
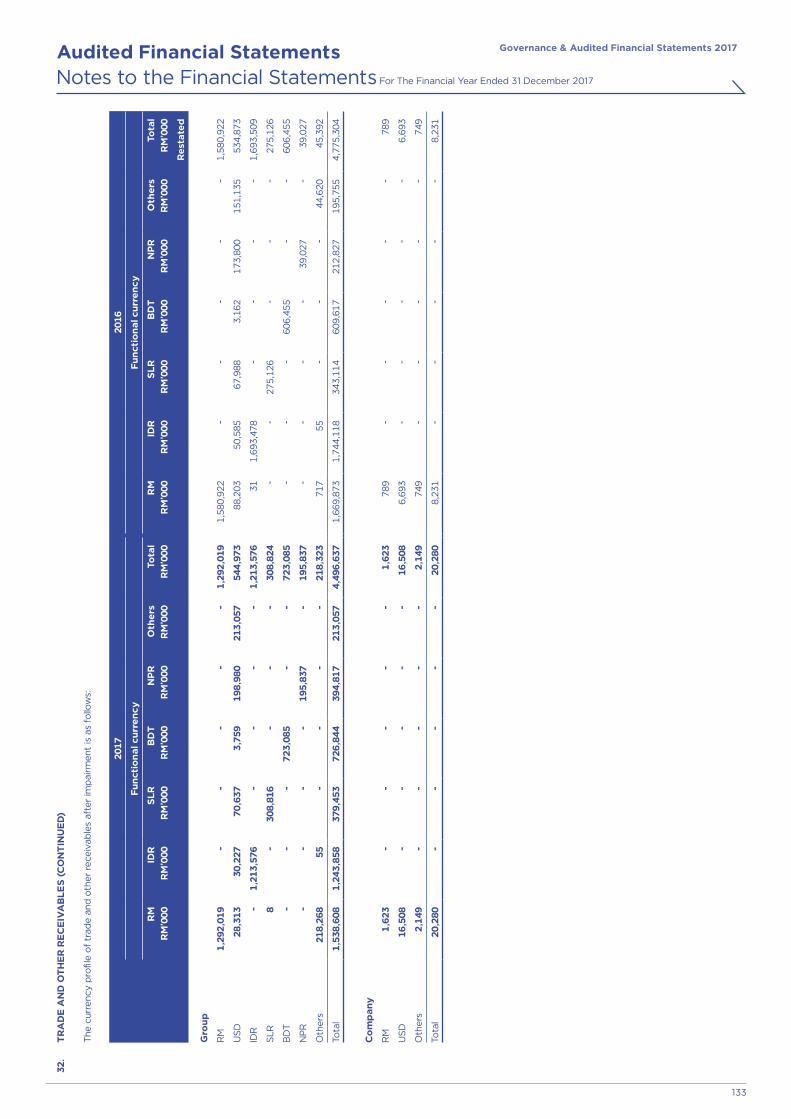
Governance & Audited Financial Statements 2017Audited Financial Statements
133
Notes to the Financial Statements For The Financial Year Ended 31 December 2017
32.
TR
AD
E A
ND
OT
HE
R R
EC
EIV
AB
LE
S (
CO
NT
INU
ED
)
T
he c
urre
ncy
pro
file
of
trad
e a
nd o
ther
re
ceiv
able
s af
ter
imp
airm
ent
is a
s fo
llow
s:
2017
2016
Fu
nct
ion
al c
urr
en
cyF
un
ctio
na
l cu
rre
ncy
RM
RM
’000
IDR
RM
’000
SL
RR
M’0
00B
DT
RM
’000
NP
RR
M’0
00O
the
rsR
M’0
00To
tal
RM
’000
RM
RM
’000
IDR
RM
’000
SL
RR
M’0
00B
DT
RM
’000
NP
RR
M’0
00O
the
rsR
M’0
00To
tal
RM
’000
Res
tate
d
Gro
up
RM
1,29
2,01
9-
--
--
1,29
2,01
91,
580,
922
--
--
-1,
580,
922
US
D28
,313
30,2
2770
,637
3,75
919
8,98
021
3,05
754
4,97
388
,203
50,5
8567
,988
3,16
217
3,80
015
1,13
553
4,87
3
IDR
-1,
213,
576
--
--
1,21
3,57
631
1,69
3,47
8-
--
-1,
693,
509
SLR
8-
308,
816
--
-30
8,82
4-
-27
5,12
6-
--
275,
126
BD
T-
--
723,
085
--
723,
085
--
-60
6,45
5-
-60
6,45
5
NP
R
--
--
195,
837
-19
5,83
7-
--
-39
,027
-39
,027
Oth
ers
218,
268
55-
--
-21
8,32
371
755
--
-44
,620
45,3
92
Tota
l1,
538,
608
1,24
3,85
837
9,45
372
6,84
439
4,81
721
3,05
74,
496,
637
1,66
9,87
31,
744,
118
343,
114
609,
617
212,
827
195,
755
4,77
5,30
4
Co
mp
any
RM
1,62
3-
--
--
1,62
378
9-
--
--
789
US
D16
,508
--
--
-16
,508
6,69
3-
--
--
6,69
3
Oth
ers
2,14
9-
--
--
2,14
974
9-
--
--
749
Tota
l20
,280
--
--
-20
,280
8,23
1-
--
--
8,23
1

Governance & Audited Financial Statements 2017Audited Financial Statements
134
Notes to the Financial Statements For The Financial Year Ended 31 December 2017
32. TRADE AND OTHER RECEIVABLES (CONTINUED)
The movement of provision for impairment of trade and other receivables are as follows:
Group
Note2017
RM’0002016
RM’000Restated
Trade receivables
At 1 January 397,806 352,184
Provision for impairment 7(b) 122,070 97,829
Written off (79,131) (66,308)
Currency translation differences (36,195) 14,101
At 31 December 404,550 397,806
Other receivables
At 1 January (as previously reported) 27,635 30,947
Measurement period adjustment 45 4,271 -
At 1 January (as restated) 31,906 30,947
Provision for impairment 7(b) 25,422 -
Currency translation differences 6,314 959
At 31 December 63,642 31,906
The carrying amounts of trade and other receivables approximate their fair value.
Trade receivables which are due as at the end of the reporting period are as follows:
Not past due Past due
TotalSpecifically
impaired Not specifically impaired
RM’000 RM’000
0-3months RM’000
3-6months RM’000
6-12months RM’000
Over 12 months RM’000 RM’000
2017 541,169 70,842 999,790 112,948 85,946 113,955 1,924,650
2016 (restated) 568,931 12,262 576,785 118,441 37,870 167,350 1,481,639
The Group is not exposed to major concentration of credit risk due to the diverse customer base. In addition, credit risk is mitigated to a certain extent by cash deposits and bankers’ guarantee obtained from customers. The Group considers the accumulated impairment losses of trade receivables at the end of the reporting period to be adequate to cover the potential financial loss.
With respect to the trade and other receivables that are neither past due nor impaired, there is no indication as of reporting date that the debtors will not meet their payment obligations since the Group selects the highest possible quality creditworthy counterparties. The quality of these trade and other receivables is such that management believes no impairment provision is necessary, except in situations whether they are part of individually impaired trade and other receivables.
Credit terms of trade receivables for the Group range from 5 to 90 days (2016: 5 to 90 days).
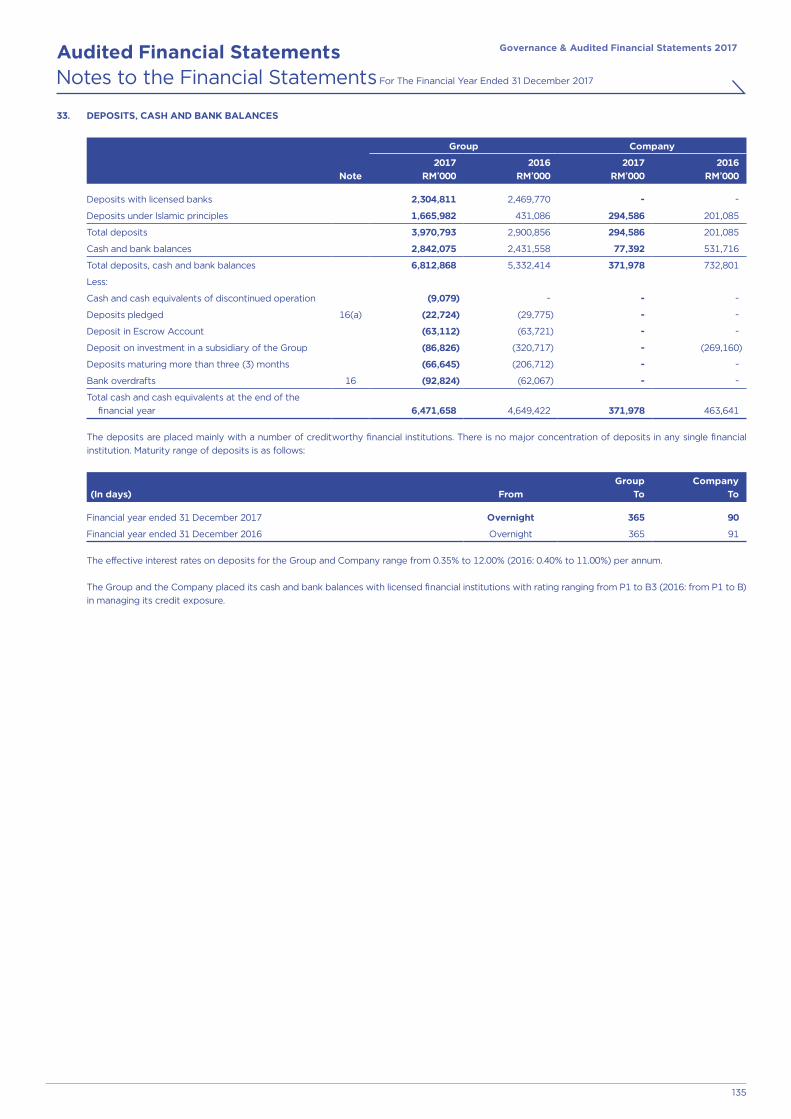
Governance & Audited Financial Statements 2017Audited Financial Statements
135
Notes to the Financial Statements For The Financial Year Ended 31 December 2017
33. DEPOSITS, CASH AND BANK BALANCES
Note
Group Company
2017RM’000
2016RM’000
2017RM’000
2016RM’000
Deposits with licensed banks 2,304,811 2,469,770 - -
Deposits under Islamic principles 1,665,982 431,086 294,586 201,085
Total deposits 3,970,793 2,900,856 294,586 201,085
Cash and bank balances 2,842,075 2,431,558 77,392 531,716
Total deposits, cash and bank balances 6,812,868 5,332,414 371,978 732,801
Less:
Cash and cash equivalents of discontinued operation (9,079) - - -
Deposits pledged 16(a) (22,724) (29,775) - -
Deposit in Escrow Account (63,112) (63,721) - -
Deposit on investment in a subsidiary of the Group (86,826) (320,717) - (269,160)
Deposits maturing more than three (3) months (66,645) (206,712) - -
Bank overdrafts 16 (92,824) (62,067) - -
Total cash and cash equivalents at the end of the financial year 6,471,658 4,649,422 371,978 463,641
The deposits are placed mainly with a number of creditworthy financial institutions. There is no major concentration of deposits in any single financial institution. Maturity range of deposits is as follows:
(In days) FromGroup
ToCompany
To
Financial year ended 31 December 2017 Overnight 365 90
Financial year ended 31 December 2016 Overnight 365 91
The effective interest rates on deposits for the Group and Company range from 0.35% to 12.00% (2016: 0.40% to 11.00%) per annum.
The Group and the Company placed its cash and bank balances with licensed financial institutions with rating ranging from P1 to B3 (2016: from P1 to B) in managing its credit exposure.

Governance & Audited Financial Statements 2017Audited Financial Statements
136
Notes to the Financial Statements For The Financial Year Ended 31 December 2017
33.
DE
PO
SIT
S, C
AS
H A
ND
BA
NK
BA
LA
NC
ES
(C
ON
TIN
UE
D)
T
he c
urre
ncy
pro
file
of
de
po
sits
, cas
h an
d b
ank
bal
ance
s is
as
follo
ws:
2017
2016
Fu
nct
ion
al c
urr
en
cyF
un
ctio
na
l cu
rre
ncy
RM
RM
’000
IDR
RM
’000
SL
RR
M’0
00B
DT
RM
’000
NP
RR
M’0
00O
the
rsR
M’0
00To
tal
RM
’000
RM
RM
’000
IDR
RM
’000
SL
RR
M’0
00B
DT
RM
’000
NP
RR
M’0
00O
the
rsR
M’0
00To
tal
RM
’000
Gro
up
RM
2,61
1,54
8-
--
--
2,61
1,54
81,
760,
969
--
--
-1,
760,
969
US
D1,
102,
194
153,
776
87,9
958,
130
1,12
4,94
627
3,27
12,
750,
312
482,
796
78,2
8471
,973
9,43
41,
471,
547
317,
143
2,43
1,17
7
IDR
8060
0,63
9-
--
-60
0,71
9-
417,
252
--
--
417,
252
SLR
1,84
5-
134,
895
--
-13
6,74
01,
321
-16
9,37
3-
--
170,
694
BD
T1,
879
--
76,6
54-
-78
,533
--
-23
1,65
9-
-23
1,65
9
Oth
ers
80,7
87-
--
554,
229
-63
5,01
671
,895
--
-22
2,42
226
,346
320,
663
Tota
l3,
798,
333
754,
415
222,
890
84,7
841,
679,
175
273,
271
6,81
2,86
82,
316,
981
495,
536
241,
346
241,
093
1,69
3,96
934
3,48
95,
332,
414
Co
mp
any
RM
329,
577
--
--
-32
9,57
725
0,72
3-
--
--
250,
723
US
D42
,401
--
--
-42
,401
482,
078
--
--
-48
2,07
8
Tota
l37
1,97
8-
--
--
371,
978
732,
801
--
--
-73
2,80
1

Governance & Audited Financial Statements 2017Audited Financial Statements
137
Notes to the Financial Statements For The Financial Year Ended 31 December 2017
34. CASH FLOWS FROM/(USED IN) OPERATING, INVESTING AND FINANCING ACTIVITIES
Group Company
2017RM’000
2016RM’000
2017RM’000
2016RM’000
Receipt from customers 23,648,914 21,480,090 - -
Payments to suppliers and employees (15,884,795) (12,804,218) (163,731) (245,925)
Dividends received - - - 1,002,403
Payment of finance costs (1,297,431) (1,153,868) (38,659) (27,583)
Payment of zakat (3,123) (2,000) - -
Payment of income taxes (net of refunds) (730,614) (744,903) - (14)
Total cash flows from/(used in) operating activities 5,732,951 6,775,101 (202,390) 728,881
Proceeds from disposal of PPE 28,945 81,187 - -
Purchase of PPE (4,914,051) (5,564,249) (6,063) (4,656)
Acquisition of intangible assets (99,372) (1,003,074) - -
Investment in deposits maturing more than three (3) months 140,068 479,338 - -
Investment in subsidiaries (net of cash acquired) (446,015) (5,247,127) - -
Proceeds from sale and leaseback transactions of a subsidiary - 564,141 - -
Partial disposal of subsidiaries (net of transaction costs) - - 886,193 -
Investment in an associate (110,047) (57,421) - -
Additional investment in associates (20,149) (83,471) - -
Investment in a joint venture - (384) - -
Additional investment in a joint venture (34,003) (96,162) - -
Interest received 239,343 186,804 27,140 25,457
Settlement of deferred purchase consideration of investment in subsidiaries (43,221) (54,794) - -
Other investment (649) - - -
Dividends received from associates 92,587 118,229 - -
Net repayments from/(advances to) employees 25 (1,622) - -
Additional investment in a subsidiary - (156,612) - -
Advances to subsidiaries - - (352,224) (2,593,067)
Repayments from subsidiaries - - 787,348 186,692
Total cash flows (used in)/from investing activities (5,166,539) (10,835,217) 1,342,394 (2,385,574)
Proceeds from borrowings 5,090,384 6,532,538 2,143,936 3,587,220
Repayments of borrowings (7,250,018) (4,672,168) (3,226,039) (1,010,487)
Repayment of Sukuk (1,000,000) (164,502) - -
Proceeds from Sukuk (net of transaction costs) 1,712,860 2,489,687 - -
Proceeds from private placements of a subsidiary (net of transaction costs) 2,178,986 - - -
Partial disposal of subsidiaries (net of transaction costs) 1,162,440 - - -
Additional investment in a subsidiary (6,555) - - -
Additional investment in a subsidiary by NCI - 900 - -
Repayment of finance lease creditors (153,693) (122,145) - -
Net proceeds from sale and leaseback assets - 531,235 - -
Proceeds from issuance of shares under Axiata Share Scheme 7,650 10,477 7,650 10,477
Share issue expenses - (171) - (171)
Pre-acquisition dividend of a subsidiary paid to a NCI - (79,835) - -
Net proceeds from rights issue of a subsidiary - 667,614 - -
Dividends paid to NCI (115,136) (112,241) - -
Dividends paid to shareholders (379,252) (790,477) (379,252) (790,477)
Total cash flows from/(used in) financing activities 1,247,666 4,290,912 (1,453,705) 1,796,562
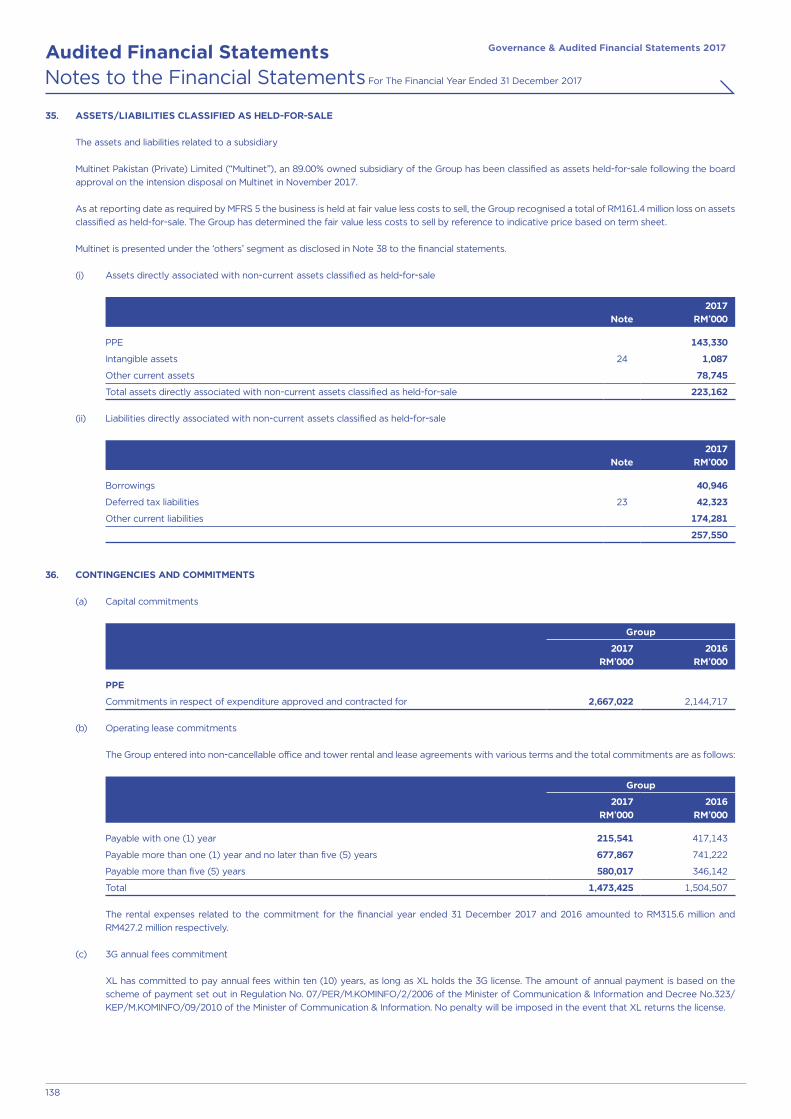
Governance & Audited Financial Statements 2017Audited Financial Statements
138
Notes to the Financial Statements For The Financial Year Ended 31 December 2017
35. ASSETS/LIABILITIES CLASSIFIED AS HELD-FOR-SALE
The assets and liabilities related to a subsidiary
Multinet Pakistan (Private) Limited (“Multinet”), an 89.00% owned subsidiary of the Group has been classified as assets held-for-sale following the board approval on the intension disposal on Multinet in November 2017.
As at reporting date as required by MFRS 5 the business is held at fair value less costs to sell, the Group recognised a total of RM161.4 million loss on assets classified as held-for-sale. The Group has determined the fair value less costs to sell by reference to indicative price based on term sheet.
Multinet is presented under the ‘others’ segment as disclosed in Note 38 to the financial statements.
(i) Assets directly associated with non-current assets classified as held-for-sale
Note 2017
RM’000
PPE 143,330
Intangible assets 24 1,087
Other current assets 78,745
Total assets directly associated with non-current assets classified as held-for-sale 223,162
(ii) Liabilities directly associated with non-current assets classified as held-for-sale
Note2017
RM’000
Borrowings 40,946
Deferred tax liabilities 23 42,323
Other current liabilities 174,281
257,550
36. CONTINGENCIES AND COMMITMENTS
(a) Capital commitments
Group
2017RM’000
2016RM’000
PPE
Commitments in respect of expenditure approved and contracted for 2,667,022 2,144,717
(b) Operating lease commitments
The Group entered into non-cancellable office and tower rental and lease agreements with various terms and the total commitments are as follows:
Group
2017RM’000
2016RM’000
Payable with one (1) year 215,541 417,143
Payable more than one (1) year and no later than five (5) years 677,867 741,222
Payable more than five (5) years 580,017 346,142
Total 1,473,425 1,504,507
The rental expenses related to the commitment for the financial year ended 31 December 2017 and 2016 amounted to RM315.6 million and RM427.2 million respectively.
(c) 3G annual fees commitment
XL has committed to pay annual fees within ten (10) years, as long as XL holds the 3G license. The amount of annual payment is based on the scheme of payment set out in Regulation No. 07/PER/M.KOMINFO/2/2006 of the Minister of Communication & Information and Decree No.323/KEP/M.KOMINFO/09/2010 of the Minister of Communication & Information. No penalty will be imposed in the event that XL returns the license.

Governance & Audited Financial Statements 2017Audited Financial Statements
139
Notes to the Financial Statements For The Financial Year Ended 31 December 2017
36. CONTINGENCIES AND COMMITMENTS (CONTINUED)
(d) List of contingent liabilities of subsidiaries of the Group as at 31 December is as follows:
Potential exposure
Description2017
RM’million2016
RM’million
1. Celcom Trading Sdn Bhd [formerly known as Rego Multi-Trades Sdn Bhd] (“Celcom Trading”) vs Aras Capital Sdn Bhd (“Aras Capital”) and Tan Sri Dato’ Tajudin Ramli (“TSDTR”)
In 2005, Celcom Trading, a wholly-owned subsidiary of Celcom Resources Berhad [formerly known as Technology Resources Industries Berhad] (“Celcom Resources”), commenced proceedings against Aras Capital and TSDTR for amounts due to Celcom Trading pursuant to an investment agreement with Aras Capital and an indemnity letter given by TSDTR. TSDTR filed its defence and instituted a counterclaim against Celcom Trading, Celcom Resources and its directors to void or rescind the indemnity letter and claim damages.
The Board of Directors, based on legal advice received, are of the view that it has good prospects of succeeding on the claim and successfully defending the counterclaim if both were to proceed to trial.
100.0 100.0
2. Celcom Malaysia Berhad [now known as Celcom Axiata Berhad] & Technology Resources Industries Berhad [now known as Celcom Resources Berhad] (“Celcom Resources”) vs TSDTR & 6 others (Conspiracy Suit)
In 2008, Celcom and Celcom Resources initiated a claim against five (5) of its former directors, DeTeAsia Holding GmbH, and Beringin Murni Sdn Bhd (“Defendants”) for conspiring with each other to injure Celcom and Celcom Resources by causing and/or committing them to enter into various agreements in relation to certain rights issue shares in Celcom Resources. Celcom and Celcom Resources are seeking damages for conspiracy against the Defendants. Two of the Defendants, TSDTR and Dato’ Bistamam Ramli (“DBR”) filed a counterclaim against Celcom and Celcom Resources for damages for breach of an alleged global settlement involving, inter alia, the present action, and also for conspiracy and misrepresentation in inducing TSDTR to withdraw a counterclaim in another suit.
The Directors, based on legal advice received, are of the view that it has good prospects of successfully defending the counterclaim.
7,215.0 7,215.0
3. Celcom & Celcom Resources vs TSDTR & 8 others (Indemnity Suit) In 2006, Celcom and Celcom Resources initiated a claim against nine of its former directors
(“Defendants”) seeking inter alia, for indemnity in respect of the sums paid out to DeTeAsia under the Award dated 2 August 2005 handed down by the Tribunal of the International Court of Arbitration of the International Chamber of Commerce in Paris and damages for breach of their fiduciary duties.
Two of the Defendants, TSDTR and DBR filed a counterclaim against Celcom and Celcom Resources for damages for breach of an alleged global settlement involving, inter alia, the present action, and also for conspiracy and misrepresentation in inducing TSDTR to withdraw a counterclaim in another suit.
The Directors, based on legal advice received, are of the view that it has good prospects of successfully defending the counterclaim.
7,215.0 7,215.0
4. Claim on Robi by National Board of Revenue of Bangladesh (“NBR”) The Large Tax Unit of NBR issued a show case letter dated 23 February 2012 to Robi demanding
payment of supplementary duty and VAT levied on the issuance of a certain number of SIM cards to new customers of Robi on the pretext that the issuance was replacement purposes with regards to Robi’s existing customers. The total demand amounted to BDT4,150.6 million.
The Board of Directors, based on legal advice received, are of the view that it has good
prospects of succeeding on the claim.
204.0 236.7
5. Robi’s tax position Robi has claimed for SIM tax subsidy as a deductible expense in its tax provision computations
for FY 2005 to 2016 (2016: FY 2005 to 2015). The National Board of Revenue has challenged this claim and regarded the SIM tax subsidy as non-deductible, on grounds that the subsidies are collectible from the customers and hence is not a ‘business expense’. The case has been taken to the local court whereby the proceeding is still ongoing with no decision reached to-date.
Based on legal opinion received, the Board of Directors are of the view that Robi has good prospects of succeeding on the claim.
311.8 358.5

Governance & Audited Financial Statements 2017Audited Financial Statements
140
Notes to the Financial Statements For The Financial Year Ended 31 December 2017
36. CONTINGENCIES AND COMMITMENTS (CONTINUED)
(d) List of contingent liabilities of subsidiaries of the Group as at 31 December is as follows: (continued)
Potential exposure
Description2017
RM’million2016
RM’million
6. Access Promotion Contribution (“APC”) of Multinet Pakistan (Private) Limited (“Multinet”)
Multinet filed a suit during the financial year ended 31 December 2010 in the Honourable High Court of Sindh against the Federation of Pakistan, Pakistan Telecommunications Authority (“PTA”), Pakistan Telecommunication Company Limited (“PTCL”) and the Universal Service Fund Company inter alia challenging the legality and enforcement of APC applicable on international incoming calls. Multinet has stopped paying APC to PTA from 30 September 2009. In the event a clawback is required, the estimated amount as per PTA monthly demand notice from January 2010 to December 2012 is PKR4.2 billion (2016: PKR4.2 billion).
Based on legal opinion received, the Board of Directors are of the view that Multinet has good prospects of succeeding on the claim.
154.1 180.8
Total exposure 15,199.9 15,306.0
The Company does not have any contingent liability as at 31 December 2017 and 31 December 2016.
(e) Fund commitment
The Company has committed to invest in ADIF for a total amount of RM50.0 million over the period of eight (8) years. As of 31 December 2017, the amount yet to be invested amounted to RM25.3 million (2016: RM31.2 million).
37. SIGNIFICANT NON-CASH TRANSACTIONS
Significant non-cash transactions other than disclosed elsewhere are as follows:
Group
2017RM’000
2016RM’000
Vesting of RSA 7,241 22,262
DRS 339,888 714,639
38. SEGMENTAL REPORTING
By business segments and geographical location of the key operating companies of the Group
Management has determined the operating segments to be based on the management reports reviewed by the Board of Directors (Chief Operating decision maker).
During the financial year, the business segments of the Group have been redefined to core businesses and geographical locations of the key operating companies based on the operating results regularly reviewed by the Board of Directors. Current year information and corresponding information for the prior year have been restated based on the identified segments below:
(i) Mobile segment
The mobile business of the Group is segmented based on the countries in which the key operating companies operate, as shown in Note 40 to the financial statements. The reportable segments derive their revenue primarily from the provision of mobile services and others such as provision of interconnect services, pay television transmission services and provision of other data services.
(ii) Infrastructure segment
The reportable segment derives their revenue primarily from the provision of telecommunication infrastructure and services.
(iii) Others
Others comprise of investment holding entities, financing entities and other operating companies providing other services including digital services in Malaysia and other countries that contributed less than 10% of consolidated revenue.
The Board of Directors assess the performance of the operating segment, before its respective tax charge or tax credits, mainly based on the measure of EBITDA. EBITDA is derived after operating revenue less other operating costs, domestic interconnect and international out payment, marketing, advertising and promotion, and staff costs.

Governance & Audited Financial Statements 2017Audited Financial Statements
141
Notes to the Financial Statements For The Financial Year Ended 31 December 2017
38.
SE
GM
EN
TAL
RE
PO
RT
ING
(C
ON
TIN
UE
D)
----
----
----
----
----
----
----
----
----
----
--M
ob
ile s
eg
me
nt^
----
----
----
----
----
----
----
----
----
----
-In
fra
stru
ctu
rese
gm
en
t^O
the
rs#
RM
’000
Co
nso
lida
tio
n
ad
just
me
nts
/e
limin
ati
on
s1
RM
’000
Tota
lR
M’0
00M
ala
ysi
aR
M’0
00In
do
ne
sia
RM
’000
Ba
ng
lad
esh
RM
’000
Sri
La
nk
aR
M’0
00N
ep
al
RM
’000
Ca
mb
od
iaR
M’0
00M
ala
ysi
aR
M’0
00
Fin
an
cia
l ye
ar
en
de
d 3
1 D
ece
mb
er
2017
Op
erat
ing
rev
enue
:
Tota
l op
erat
ing
rev
enue
6,59
3,23
97,
365,
963
3,64
0,27
32,
655,
808
2,40
1,83
51,
187,
913
1,43
1,56
132
8,35
6-
25,6
04,9
48
Inte
r-se
gm
ent *
(44,
101)
(77,
612)
360
(13,
799)
(49,
628)
(14,
031)
(1,0
02,4
38)
(1,2
98)
-(1
,202
,547
)
Ext
erna
l op
erat
ing
rev
enue
6,54
9,13
87,
288,
351
3,64
0,63
32,
642,
009
2,35
2,20
71,
173,
882
429,
123
327,
058
-24
,402
,401
Res
ults
:
EB
ITD
A2,
317,
905
2,76
1,97
969
3,17
395
4,96
61,
560,
896
589,
433
626,
319
(802
,615
)52
8,06
29,
230,
118
Fin
ance
inco
me
85,6
3346
,484
5,33
26,
897
27,5
937,
699
24,8
9287
,939
(50,
662)
241,
807
Fin
ance
exp
ense
(222
,688
)(5
13,5
66)
(76,
306)
(52,
459)
(24,
954)
(2,6
12)
(37,
053)
(406
,930
)83
,199
(1,2
53,3
69)
De
pre
ciat
ion
of
PP
E(8
73,5
93)
(2,2
55,9
96)
(584
,270
)(5
13,8
38)
(307
,496
)(1
84,6
70)
(275
,266
)(4
3,29
7)24
,053
(5,0
14,3
73)
Am
ort
isat
ion
of
inta
ngib
le a
sset
s(1
27,3
33)
(62,
334)
(250
,494
)(3
7,20
5)(1
59,2
28)
(5,2
09)
(25,
851)
(1,7
04)
(304
,020
)(9
73,3
78)
Join
t ve
ntur
es:
- sh
are
of
resu
lts
(net
of
tax)
403
(33,
136)
--
--
-(1
6,25
6)-
(48,
989)
Ass
oci
ates
:
- sh
are
of
resu
lts
(net
of
tax)
(6,0
07)
-16
,303
(379
)-
(754
)7,
737
(369
,570
)-
(352
,670
)
- lo
ss o
n d
iluti
on
of
eq
uity
inte
rest
s-
--
--
--
(2,5
95)
-(2
,595
)
Imp
airm
ent
of
PP
E, n
et o
f re
vers
al-
22,1
451,
749
13,0
94(1
3,31
5)-
--
-23
,673
Oth
er n
on-
cash
inco
me
/(ex
pen
ses)
22
0,66
210
1,67
3(3
7,72
5)(2
0,49
5)(8
0,12
2)(3
2,25
1)(4
9,22
4)1,
398,
667
(1,4
15,1
78)
86,0
07
Taxa
tio
n(3
37,2
06)
49,5
9012
7,87
1(4
7,21
2)(2
91,9
44)
(88,
074)
(101
,404
)(1
21,9
58)
36,5
88(7
73,7
49)
Seg
men
t p
rofit
/(lo
ss)
for
the
fina
ncia
l yea
r1,
057,
776
116,
839
(104
,367
)30
3,36
971
1,43
028
3,56
217
0,15
0(2
78,3
19)
(1,0
97,9
58)
1,16
2,48
2
#
Sha
re o
f as
soci
ates
’ res
ults
co
ntri
but
ed b
y Id
ea C
ellu
lar
Lim
ited
(-R
M45
0.5
mill
ion)
and
M1
Lim
ited
(R
M12
2.4
mill
ion)
.^
Dur
ing
the
fina
ncia
l yea
r, m
anag
em
ent
has
pre
sent
ed In
fras
truc
ture
seg
men
t as
a s
ep
arat
e s
egm
ent.
Thi
s w
as p
revi
ous
ly in
clud
ed w
ithi
n “O
ther
s”. C
om
par
ativ
e in
form
atio
n ha
s b
een
res
tate
d t
o r
efle
ct t
he n
ew
seg
men
t.1
Incl
uded
in o
ther
no
n-ca
sh in
com
e/(
exp
ense
) is
the
ad
just
men
t o
n p
rovi
sio
n o
f lo
ss o
n as
sets
he
ld f
or
sale
(R
M16
1.4
mill
ion)
, elim
inat
ion
of
gai
ns a
risi
ng f
rom
par
tial
dis
po
sal o
f su
bsi
dia
ries
(R
M79
6.5
mill
ion)
and
in
tra-
gro
up r
estr
uctu
ring
gai
ns o
n as
soci
ates
re
cord
ed b
y r
esp
ect
ive
seg
men
ts (
RM
153.
6 m
illio
n).
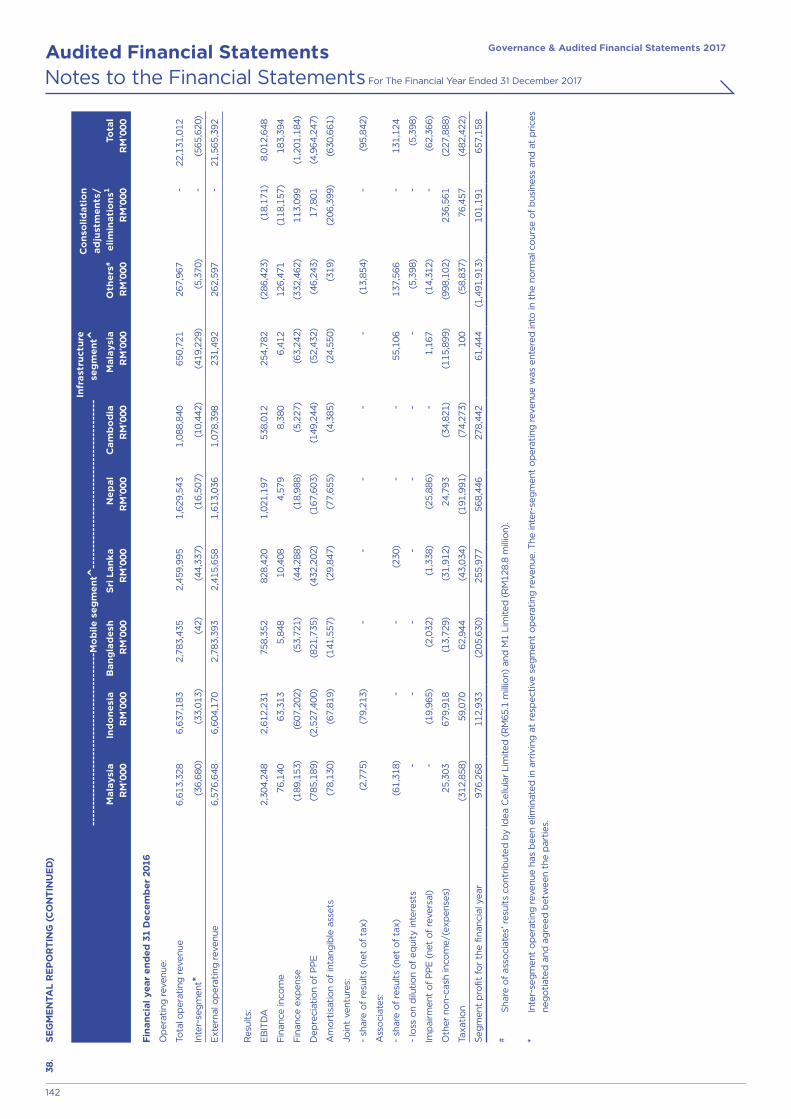
Governance & Audited Financial Statements 2017Audited Financial Statements
142
Notes to the Financial Statements For The Financial Year Ended 31 December 2017
38.
SE
GM
EN
TAL
RE
PO
RT
ING
(C
ON
TIN
UE
D)
----
----
----
----
----
----
----
----
----
----
--M
ob
ile s
eg
me
nt^
----
----
----
----
----
----
----
----
----
----
-In
fra
stru
ctu
re
seg
me
nt^
Oth
ers
#
RM
’000
Co
nso
lida
tio
n
ad
just
me
nts
/e
limin
ati
on
s1
RM
’000
Tota
lR
M’0
00M
ala
ysi
aR
M’0
00In
do
ne
sia
RM
’000
Ba
ng
lad
esh
RM
’000
Sri
La
nk
aR
M’0
00N
ep
al
RM
’000
Ca
mb
od
iaR
M’0
00M
ala
ysi
aR
M’0
00
Fin
an
cia
l ye
ar
en
de
d 3
1 D
ece
mb
er
2016
Op
erat
ing
rev
enue
:
Tota
l op
erat
ing
rev
enue
6,61
3,32
86,
637,
183
2,78
3,43
52,
459,
995
1,62
9,54
31,
088,
840
650,
721
267,
967
-22
,131
,012
Inte
r-se
gm
ent *
(36,
680)
(33,
013)
(42)
(44,
337)
(16,
507)
(10,
442)
(419
,229
)(5
,370
)-
(565
,620
)
Ext
erna
l op
erat
ing
rev
enue
6,57
6,64
86,
604,
170
2,78
3,39
32,
415,
658
1,61
3,03
61,
078,
398
231,
492
262,
597
-21
,565
,392
Res
ults
:
EB
ITD
A2,
304,
248
2,61
2,23
175
8,35
282
8,42
01,
021,
197
538,
012
254,
782
(286
,423
)(1
8,17
1)8,
012,
648
Fin
ance
inco
me
76,1
4063
,313
5,84
810
,408
4,57
98,
380
6,41
212
6,47
1(1
18,1
57)
183,
394
Fin
ance
exp
ense
(189
,153
)(6
07,2
02)
(53,
721)
(44,
288)
(18,
988)
(5,2
27)
(63,
242)
(332
,462
)11
3,09
9(1
,201
,184
)
De
pre
ciat
ion
of
PP
E(7
85,1
89)
(2,5
27,4
00)
(821
,735
)(4
32,2
02)
(167
,603
)(1
49,2
44)
(52,
432)
(46,
243)
17,8
01(4
,964
,247
)
Am
ort
isat
ion
of
inta
ngib
le a
sset
s(7
8,13
0)(6
7,81
9)(1
41,5
57)
(29,
847)
(77,
655)
(4,3
85)
(24,
550)
(319
)(2
06,3
99)
(630
,661
)
Join
t ve
ntur
es:
- sh
are
of
resu
lts
(net
of
tax)
(2,7
75)
(79,
213)
--
--
-(1
3,85
4)-
(95,
842)
Ass
oci
ates
:
- sh
are
of
resu
lts
(net
of
tax)
(61,
318)
--
(230
)-
-55
,106
137,
566
-13
1,12
4
- lo
ss o
n d
iluti
on
of
eq
uity
inte
rest
s-
--
--
--
(5,3
98)
-(5
,398
)
Imp
airm
ent
of
PP
E (
net
of
reve
rsal
)-
(19,
965)
(2,0
32)
(1,3
38)
(25,
886)
-1,
167
(14,
312)
-(6
2,36
6)
Oth
er n
on-
cash
inco
me
/(ex
pen
ses)
25,3
0367
9,91
8(1
3,72
9)(3
1,91
2)24
,793
(34,
821)
(115
,899
)(9
98,1
02)
236,
561
(227
,888
)
Taxa
tio
n(3
12,8
58)
59,0
7062
,944
(43,
034)
(191
,991
)(7
4,27
3)10
0(5
8,83
7)76
,457
(482
,422
)
Seg
men
t p
rofit
fo
r th
e fi
nanc
ial y
ear
976,
268
112,
933
(205
,630
)25
5,97
756
8,44
627
8,44
261
,444
(1,4
91,9
13)
101,
191
657,
158
#
Sha
re o
f as
soci
ates
’ res
ults
co
ntri
but
ed b
y Id
ea C
ellu
lar
Lim
ited
(R
M65
.1 m
illio
n) a
nd M
1 Li
mite
d (
RM
128.
8 m
illio
n).
* In
ter-
seg
men
t o
per
atin
g r
even
ue h
as b
een
elim
inat
ed in
arr
ivin
g a
t re
spe
ctiv
e s
egm
ent
op
erat
ing
rev
enue
. The
inte
r-se
gm
ent
op
erat
ing
rev
enue
was
ent
ered
into
in t
he n
orm
al c
our
se o
f b
usin
ess
and
at
pri
ces
neg
oti
ated
and
ag
reed
bet
we
en t
he p
arti
es.

Governance & Audited Financial Statements 2017Audited Financial Statements
143
Notes to the Financial Statements For The Financial Year Ended 31 December 2017
38. SEGMENTAL REPORTING (CONTINUED)
By Geographical Location
In presenting information for geographical segments of the Group, total assets are determined based on where the assets are located.
MalaysiaRM’000
IndonesiaRM’000
OthersRM’000
TotalRM’000
As at 31 December 2017
Total non-current assets at the end of the financial year^ 14,712,659 17,611,056 25,134,830 57,458,545
As at 31 December 2016
Total non-current assets at the end of the financial year^ 12,382,015 18,870,728 28,174,968 59,427,711
^ Non-current assets other than financial instruments, deferred tax assets and post-employment benefit assets.
39. FINANCIAL RISK MANAGEMENT OBJECTIVES AND POLICIES
(a) Market risks consist of:
(i) foreign currency exchange risk – risk that the value of a financial instrument will fluctuate due to changes in foreign exchange rates.(ii) fair value interest rate risk – risk that the value of a financial instrument will fluctuate due to changes in market interest rates.(iii) cash flow interest rate risk – risk that future cash flows associated with a financial instrument will fluctuate. In the case of a floating rate debt
instrument, such fluctuations result in a change in the effective interest rate of the financial instrument, usually without a corresponding change in its fair value.
(iv) price risk – risk that the value of a financial instrument will fluctuate as a result of changes in market prices, whether those changes are caused by factors specific to the individual instrument or its issuer or factors affecting all instrument traded in the market.
(b) credit risk – risk that one party to a financial instrument will fail to discharge an obligation and cause the other party to incur a financial loss.
(c) liquidity risk (funding risk) – risk that an entity will encounter difficulty in raising funds to meet commitments associated with financial instruments.
The Group’s and the Company’s overall financial risk management programme focuses on the unpredictability of financial markets and seeks to minimise potential adverse effects on the financial performance of the Group and the Company. Financial risk management is carried out through risk reviews, internal control systems, insurance programmes and adherence to the Group’s and the Company’s financial risk management policies. The Board of Directors regularly reviews these risks and approves the treasury policies, which covers the management of these risks. Hedging transactions are determined in the light of commercial commitments. Derivative financial instruments are mainly used to hedge underlying commercial exposures.
(a) Market risks
(i) Foreign currency exchange risk
Group
The foreign exchange risk of the Group predominately arises from borrowings denominated in foreign currencies. The main currency exposure from borrowings denominated in foreign currency is USD. The Group has cross currency swaps and call spread options that are primarily used to hedge selected foreign currency borrowings to reduce the foreign currency exposures on these borrowings.
The Group has certain investment in foreign operations, whose net assets are exposed to foreign currency translation risk. Currency exposure arising from the net assets of the Group’s foreign operation is managed primarily through borrowings denominated in the relevant foreign currency and also the use of cross currency swap.
As at 31 December 2017, if USD were to strengthen/weaken by 5% against IDR, BDT, SLR and RM with all other variables held constant, this will result in foreign exchange losses/gains to the profit or loss of RM232.9 million (2016: RM328.5 million) on translation of USD denominated non-hedged borrowings.
Company
The foreign exchange risk of the Company predominately arises from advances to subsidiaries and non-hedged borrowings denominated in USD.
As at 31 December 2017, if USD were to strengthen/weaken by 5% against RM with all other variables held constant, this will result in foreign exchange gains/losses to the profit or loss of RM242.9 million (2016: RM580.4 million) on translation of USD denominated advances to subsidiaries and non-hedged borrowings.

Governance & Audited Financial Statements 2017Audited Financial Statements
144
Notes to the Financial Statements For The Financial Year Ended 31 December 2017
39. FINANCIAL RISK MANAGEMENT OBJECTIVES AND POLICIES (CONTINUED)
(a) Market risks (continued)
(ii) Cash flow and fair value interest rate risk
The Group and the Company have deposits, cash and bank balances including deposits placed with creditworthy licensed banks and financial institutions. The Group and the Company manage its interest rate risk by actively monitoring the yield curve trend and interest rate movement for the various deposits, cash and bank balances.
The Group’s borrowings comprise borrowings from financial institutions, Sukuk and Notes. The Group’s interest rate risk objective is to manage an acceptable level of rate fluctuation on the interest expense. In order to achieve this objective, the Group targets a composition of fixed and floating borrowings based on assessment of its existing exposure and desirable interest rate profile. To obtain this composition, the Group uses hedging instruments such as interest rate swap contracts and cross currency interest rate swaps.
Group
As at 31 December 2017, if interest rate on different foreign currencies denominated floating interest rates non-hedged borrowings had been lower/higher by 5% with all other variables held constant, this will result in a lower/higher interest expense of the Group amounting to RM45.3 million (2016: RM22.9 million).
Company
As at 31 December 2017, if interest rate on different foreign currencies denominated floating interest rates non-hedged borrowings had been lower/higher by 5% with all other variables held constant, this will result in a lower/higher interest expense of the Company amounting to RM1.5 million (2016: RM5.1 million).
(iii) Price risk
The Group is exposed to equity securities price risk because of the investments held by the Group classified on the consolidated statement of financial position as AFS and FVTPL. The Group is not exposed to commodity price risk. No financial instrument or derivative has been employed to hedge this risk as the equity securities price risk is deemed as insignificant.
(b) Credit risk
Credit risk arises from trade receivables, cash and cash equivalents and financial instruments used in hedging activities.
The Group has no significant concentration of credit risk due to its diverse customer base. Credit risk is managed through the application of credit assessment and approval, credit limit and monitoring procedures. Where appropriate, the Group obtains deposits or bank guarantees from customers.
The Group and the Company place its cash and cash equivalents with a number of creditworthy financial institutions. The Group’s and the Company’s policy limit the concentration of financial exposure to any single financial institution.
All hedging instruments are executed with creditworthy financial institutions with a view to limit the credit risk exposure of the Group and the Company. The Group and the Company, however, are exposed to credit-related losses in the event of non-performance by counterparties to financial derivative instruments, but do not expect any counterparties to fail to meet their obligations.
The maximum credit risk exposure of the financial assets of the Group and the Company are approximately their carrying amounts as at the end of the reporting period.
The carrying amount of trade receivables that are past due is shown in Note 32 to the financial statements.
(c) Liquidity risk
Prudent liquidity risk management implies maintaining sufficient liquid funds to meet its financial obligations.
In the management of liquidity risk, the Group and the Company monitor and maintain a level of cash and cash equivalents deemed adequate by the management to finance the Group’s and the Company’s operations and to mitigate the effects of fluctuations in cash flows. Due to the dynamic nature of the underlying business, the Group and the Company aims at maintaining flexibility in funding by keeping both committed and uncommitted credit lines available.

Governance & Audited Financial Statements 2017Audited Financial Statements
145
Notes to the Financial Statements For The Financial Year Ended 31 December 2017
39.
FIN
AN
CIA
L R
ISK
MA
NA
GE
ME
NT
OB
JEC
TIV
ES
AN
D P
OL
ICIE
S (
CO
NT
INU
ED
)
(c)
Liq
uid
ity r
isk
(co
ntin
ued
)
T
he t
able
be
low
ana
lyse
s th
e G
roup
’s a
nd t
he C
om
pan
y’s
no
n-d
eriv
ativ
e fi
nanc
ial l
iab
iliti
es a
nd n
et s
ettl
ed d
eriv
ativ
e fi
nanc
ial l
iab
iliti
es in
to r
ele
vant
mat
urity
gro
upin
gs
bas
ed o
n th
e r
em
aini
ng p
erio
d a
t th
e
end
of
the
re
po
rtin
g p
erio
d t
o t
he c
ont
ract
ual m
atur
ity d
ate.
As
amo
unts
incl
uded
in t
he t
able
are
co
ntra
ctua
l und
isco
unte
d c
ash
flow
s, t
hese
am
oun
ts m
ay n
ot
be
re
conc
iled
to
the
am
oun
ts d
iscl
ose
d o
n th
e
stat
em
ent
of
finan
cial
po
siti
on
for
bo
rrow
ing
s, t
rad
e a
nd o
ther
pay
able
s an
d d
eriv
ativ
e fi
nanc
ial i
nstr
umen
ts.
2017
2016
Trad
e an
dot
her
paya
bles
RM
’000
Bor
row
ings
RM
’000
Gro
ssse
ttle
dC
CIR
S(In
flow
)R
M’0
00
Gro
ssse
ttle
dC
CIR
SO
utflo
wR
M’0
00
Net
se
ttle
dIR
SR
M’0
00
Put
optio
nde
rivat
ives
RM
’000
Tota
lR
M’0
00
Trad
e an
dot
her
paya
bles
RM
’000
Bor
row
ings
RM
’000
Net
se
ttle
dIR
SR
M’0
00
Put
optio
nde
rivat
ives
RM
’000
Tota
lR
M’0
00
Gro
up
Be
low
1 y
ear
9,52
0,56
04,
817,
784
(158
,858
)20
2,06
563
114
1,66
314
,523
,845
9,05
1,01
47,
247,
562
918
157,
010
16,4
56,5
04
1-2
year
s 21
9,33
63,
742,
882
(158
,858
)20
2,06
5-
-4,
005,
425
212,
031
1,36
0,41
251
3-
1,57
2,95
6
2-3
year
s 23
1,04
66,
427,
888
(2,4
94,0
12)
2,59
8,57
5-
1,41
8,71
08,
182,
207
216,
329
3,55
9,17
5-
-3,
775,
504
3-4
year
s 26
1,35
81,
536,
364
(53,
610)
84,4
36-
-1,
828,
548
210,
559
6,31
6,43
9-
1,37
4,39
37,
901,
391
4-5
year
s 29
3,51
01,
427,
914
(53,
610)
84,4
36-
-1,
752,
250
216,
086
651,
997
--
868,
083
Ove
r 5
year
s 72
3,84
24,
430,
117
(1,4
18,0
76)
1,56
4,61
7-
-5,
300,
500
745,
553
2,91
0,53
3-
-3,
656,
086
Tota
l co
ntra
ctua
l und
isco
unte
d c
ash
flow
s 11
,249
,652
22,3
82,9
49(4
,337
,024
)4,
736,
194
631
1,56
0,37
335
,592
,775
10,6
51,5
7222
,046
,118
1,43
11,
531,
403
34,2
30,5
24
Tota
l car
ryin
g a
mo
unt
10,5
27,1
6919
,183
,989
-19
6,83
637
91,
396,
946
31,3
05,3
199,
944,
670
22,2
59,8
8190
11,
322,
430
33,5
27,8
82
2017
2016
Fin
an
cia
l g
ua
ran
tee
RM
’000
Bo
rro
win
gs
RM
’000
Oth
er
pay
ab
les
RM
’000
Am
ou
nts
du
e t
osu
bsi
dia
rie
sR
M’0
00To
tal
RM
’000
Fin
an
cia
l g
ua
ran
tee
RM
’000
Bo
rro
win
gs
RM
’000
Oth
er
pay
ab
les
RM
’000
Am
ou
nts
du
e t
osu
bsi
dia
rie
sR
M’0
00To
tal
RM
’000
Co
mp
any
Be
low
1 y
ear
65,2
661,
691,
471
124,
867
5,13
3,75
77,
015,
361
72
,33
72
,99
5,4
65
10
0,1
80
2,0
56
,70
35
,22
4,6
85
1-2
year
s 65
,266
--
-65
,266
72
,33
7-
--
72
,33
7
2-3
year
s 1,
246,
883
--
-1,
246,
883
72
,33
7-
--
72
,33
7
3-4
year
s -
--
--
1,3
81
,96
8-
--
1,3
81
,96
8
Tota
l co
ntra
ctua
l und
isco
unte
d c
ash
flow
s 1,
377,
415
1,69
1,47
112
4,86
75,
133,
757
8,32
7,51
01
,59
8,9
79
2,9
95
,46
51
00
,18
02
,05
6,7
03
6,7
51
,32
7
Tota
l car
ryin
g a
mo
unts
-
1,68
9,67
212
4,86
75,
133,
757
6,94
8,29
6-
2,9
68
,24
41
00
,18
02
,05
6,7
03
5,1
25
,12
7
F
inan
cial
gua
rant
ee
re
pre
sent
s th
e m
axim
um a
mo
unt
of
a g
uara
nte
e p
rovi
ded
by
Co
mp
any
to
its
sub
sid
iary
as
dis
clo
sed
in N
ote
16(
b) t
o t
he fi
nanc
ial s
tate
men
ts. I
t is
bas
ed o
n th
e e
arlie
st p
erio
d in
whi
ch t
he
gua
rant
ee
co
uld
be
cal
led
.

Governance & Audited Financial Statements 2017Audited Financial Statements
146
Notes to the Financial Statements For The Financial Year Ended 31 December 2017
39. FINANCIAL RISK MANAGEMENT OBJECTIVES AND POLICIES (CONTINUED)
(d) Capital risk management
The primary objective of the Group’s capital risk management is to ensure that it maintains a strong credit rating and healthy capital ratios in order to support its business and maximise shareholder’s value.
The Group manages its capital structure and makes adjustments to it, in light of changes in economic conditions. To maintain or adjust the capital structure, the Group may or may not make dividend payments to shareholders, return capital to shareholders or issue new shares or other instruments.
Consistent with others in the industry, the Group monitors capital on the basis of the gearing ratios. This ratio is calculated as total borrowings over total equity. Total borrowings including non-current and current borrowings as shown in the consolidated statement of financial position. Total equity is calculated as ‘equity’ in the consolidated statement of financial position.
Note2017
RM’0002016
RM’000Restated
Borrowings 16 19,183,989 22,259,881
Total equity 30,504,583 28,618,101
Gearing ratio 0.63 0.78
The Group’s capital management strategy was to obtain and maintain an investment grade credit rating.
(e) Fair value estimation
The table below analyses financial instruments carried at fair value, by valuation method. The different levels have been defined as follows:
• Quoted prices (unadjusted) in active markets for identified assets or liabilities (Level 1).
• Inputs other than quoted prices included within level 1 that are observable for the asset or liability, either directly [that is, as prices] or indirectly [that is, derived from prices] (Level 2).
• Inputs for the asset or liability that are not based on observable market data [that is unobservable inputs] (Level 3).
The Group measured the financial instruments based on published price quotations (Level 1) and market approach valuation technique (Level 2) with inputs of valuation technique such as interest rates and yield curves observable at commonly quoted intervals; implied volatilities; and credit spreads that are observable direct or indirectly as at reporting date.
There were no transfers between Level 1 and Level 2 during the financial year.
The following table represents the fair value level of the financial assets and liabilities that are measured at fair value as at reporting date.
2017 2016
Level 1RM’000
Level 2RM’000
Level 3RM’000
TotalRM’000
Level 1RM’000
Level 2RM’000
Level 3RM’000
TotalRM’000
Group
Assets
Financial assets at FVTPL:
- Trading securities 64 - - 64 18 - - 18
- Non-hedging derivatives - 196,507 - 196,507 - 177,777 - 177,777
- Derivatives used for hedging - 379 - 379 - 223,276 - 223,276
Financial assets at AFS:
- Equity securities - 61,317 713 62,030 - 62,675 1,250 63,925
Total assets 64 258,203 713 258,980 18 463,728 1,250 464,996
Liabilities
Financial liabilities at FVTPL:
- Non-hedging derivatives - - - - - - - -
- Derivatives used for hedging - (196,836) - (196,836) - (6,077) - (6,077)
Total liabilities - (196,836) - (196,836) - (6,077) - (6,077)

Governance & Audited Financial Statements 2017Audited Financial Statements
147
Notes to the Financial Statements For The Financial Year Ended 31 December 2017
39. FINANCIAL RISK MANAGEMENT OBJECTIVES AND POLICIES (CONTINUED)
(e) Fair value estimation (continued)
(i) Financial instruments in Level 1
The fair value of financial instruments traded in active markets is based on quoted market prices at the reporting date. A market is regarded as active if quoted prices are readily and regularly available from an exchange, dealer, broker, industry group, pricing service, or regulatory agency, and those prices represent actual and regularly occurring market transactions on an arm’s length basis.
(ii) Financial instruments in Level 2
The fair value of financial instruments that are not traded in an active market (for example, over-the-counter derivatives) is determined by using valuation techniques. These valuation techniques maximise the use of observable market data where it is available and rely as little as possible on entity specific estimates. If all significant inputs required to fair value an instrument are observable, the instrument is included in Level 2.
If one or more of the significant inputs is not based on observable market data, the instrument is included in Level 3.
Specific valuation techniques used to value financial instruments include:
• Quoted market prices or dealer quotes for similar instruments; • The fair value of cross currency interest rate swaps and interest rate swaps is calculated as the present value of the estimated future
cash flows based on observable market curves; and• The fair value of forward foreign exchange contracts is determined using forward exchange rates at the reporting date, with the
resulting value discounted back to present value.
(iii) Financial instruments in Level 3 The movement of the financial instruments in Level 3 has no material impact to the results of the consolidated financial statements.
(f) Offsetting financial assets and financial liabilities
The following financial assets and financial liabilities are subject to offsetting, enforceable master netting arrangements and similar agreements.
Grossamounts
RM’000
Gross amountsof recognised
(financial liabilities)
/financial assets set off
RM’000
Netamounts
RM’000
Group
2017
Trade receivables 731,504 (242,678) 488,826
Trade payables (2,797,342) 242,678 (2,554,664)
2016
Trade receivables 971,725 (526,075) 445,650
Trade payables (2,770,398) 526,075 (2,244,323)

Governance & Audited Financial Statements 2017Audited Financial Statements
148
Notes to the Financial Statements For The Financial Year Ended 31 December 2017
40. LIST OF SUBSIDIARIES
The Group had the following subsidiaries as at 31 December 2017:
Name of company
Ownership interest
directly held by the parent
(%)
Ownership interest held by
the Group(%)
Ownership interest held
by NCI(%) Principal activities
Country and place of incorporation
Axiata Investments (Labuan) Limited1 100.00 100.00 - Investment holding Federal Territory, Labuan, Malaysia
Axiata Investments 1 (India) Limited2 100.00 100.00 - Investment holding Mauritius
Axiata Management Services Sdn Bhd1 100.00 100.00 - Provision of services under Axiata’s Service Assurance Centre to telecommunication service providers
Malaysia
Celcom Axiata Berhad1 100.00 100.00 - Telecommunication network capacity, infrastructure and services
Malaysia
Axiata Investments (Singapore) Limited1 100.00 100.00 - Investment holding Federal Territory, Labuan Malaysia
Axiata SPV1 (Labuan) Limited1 100.00 100.00 - Financing Federal Territory, Labuan, Malaysia
Axiata Foundation1 and 6 - - - Develop and nurture talent pool and foster, develop and improve education
Malaysia
Axiata SPV2 Berhad1 100.00 100.00 - Financing Malaysia
edotco Group Sdn Bhd1 63.00 63.00 37.00 Investment holding and provision of technical and operations support services in the telecommunications and related industries in local and/or international markets
Malaysia
Axiata Investments (Cambodia) Limited1 100.00 100.00 - Investment holding Federal Territory, Labuan, Malaysia
Axiata Digital Services Sdn Bhd1 100.00 100.00 - Investment holding Malaysia
Hello Axiata Company Limited2 and 5 100.00 100.00 - Dormant Cambodia
Axiata SPV4 Sdn Bhd1 100.00 100.00 - Investment holding Malaysia
Axiata Investments (UK) Limited2 100.00 100.00 - Investment holding United Kingdom
Axiata Business Services Sdn Bhd1 100.00 100.00 - Provide international carrier services, global communications products, managed information, communications and technology and internet of things.
Malaysia
Subsidiaries held through Axiata Investments (Labuan) Limited
Dialog Axiata PLC2 - 83.32 16.68 Communication services, telecommunication infrastructure services, media and digital services
Sri Lanka
Robi Axiata Limited3 - 68.69 31.31 Mobile telecommunication services
Bangladesh
Axiata Lanka (Private) Limited2 - 100.00 - Property development and letting of property for commercial purposes
Sri Lanka
Multinet Pakistan (Private) Limited3 - 89.00 11.00 Cable television services, information technology and multimedia services
Pakistan
Axiata Investments (Indonesia) Sdn Bhd1 - 100.00 - Investment holding Malaysia

Governance & Audited Financial Statements 2017Audited Financial Statements
149
Notes to the Financial Statements For The Financial Year Ended 31 December 2017
40. LIST OF SUBSIDIARIES (CONTINUED)
The Group had the following subsidiaries as at 31 December 2017: (continued)
Name of company
Ownership interest
directly held by the parent
(%)
Ownership interest held by
the Group(%)
Ownership interest held
by NCI(%) Principal activities
Country and place of incorporation
Subsidiary held through Axiata Investments (Indonesia) Sdn Bhd
PT XL Axiata Tbk2 - 66.36 33.64 Mobile telecommunication services
Indonesia
Subsidiaries held through Dialog Axiata PLC
Dialog Broadband Networks (Private) Limited2
- 83.32 16.68 Data and backbone, fixed wireless and transmission infrastructure
Sri Lanka
Dialog Television (Private) Limited2 - 83.32 16.68 Television broadcasting generated services and direct –to –home satellite pay television services
Sri Lanka
Digital Holdings Lanka (Private) Limited2 (“DHL”)
- 83.32 16.68 Investment holding Sri Lanka
Dialog Business Services (Private) Limited2 - 83.32 16.68 Providing business process outsourcing services including call centre services
Sri Lanka
Colombo Trust Finance Plc3 - 82.38 17.62 Acceptance of deposits, granting lease facilities, hire purchase, margin trading, mortgage loans, demand loans, revolving loans, cheque discounting, factoring and other credit facilities.
Sri Lanka
Subsidiaries held through Dialog Television (Private) Limited
Communiq Broadband Network (Private) Limited2
- 83.32 16.68 Dormant Sri Lanka
Dialog Device Trading (Private) Limited2 - 83.32 16.68 Selling information technology enabled equipment
Sri Lanka
Subsidiaries held through DHL
Digital Health (Private) Limited2 - 58.32 41.68 Developing and operating a state-of-the-art electronic commerce infrastructure for the healthcare sector
Sri Lanka
Digital Commerce Lanka (Private) Limited2 - 83.32 16.68 e-commerce and digital marketing services
Sri Lanka
Subsidiary held through Dialog Broadband Networks (Private) Limited
Telecard (Private) Limited2 - 83.32 16.68 Dormant Sri Lanka
Subsidiary held through Axiata Investments 1 (India) Limited
Axiata Investments 2 (India) Limited2 - 100.00 - Investment holding Mauritius
Subsidiary held through Axiata Investments (Cambodia) Limited
Axiata (Cambodia) Holdings Limited1 - 82.48 17.52 Investment holding Federal Territory, Labuan, Malaysia
Subsidiaries held through Celcom Axiata Berhad
Celcom Mobile Sdn Bhd1 - 100.00 - Mobile communication, network and application services and content
Malaysia
Celcom Networks Sdn Bhd1 - 100.00 - Network telecommunication, capacity and services
Malaysia
Celcom Properties Sdn Bhd1 - 100.00 - Property investment Malaysia
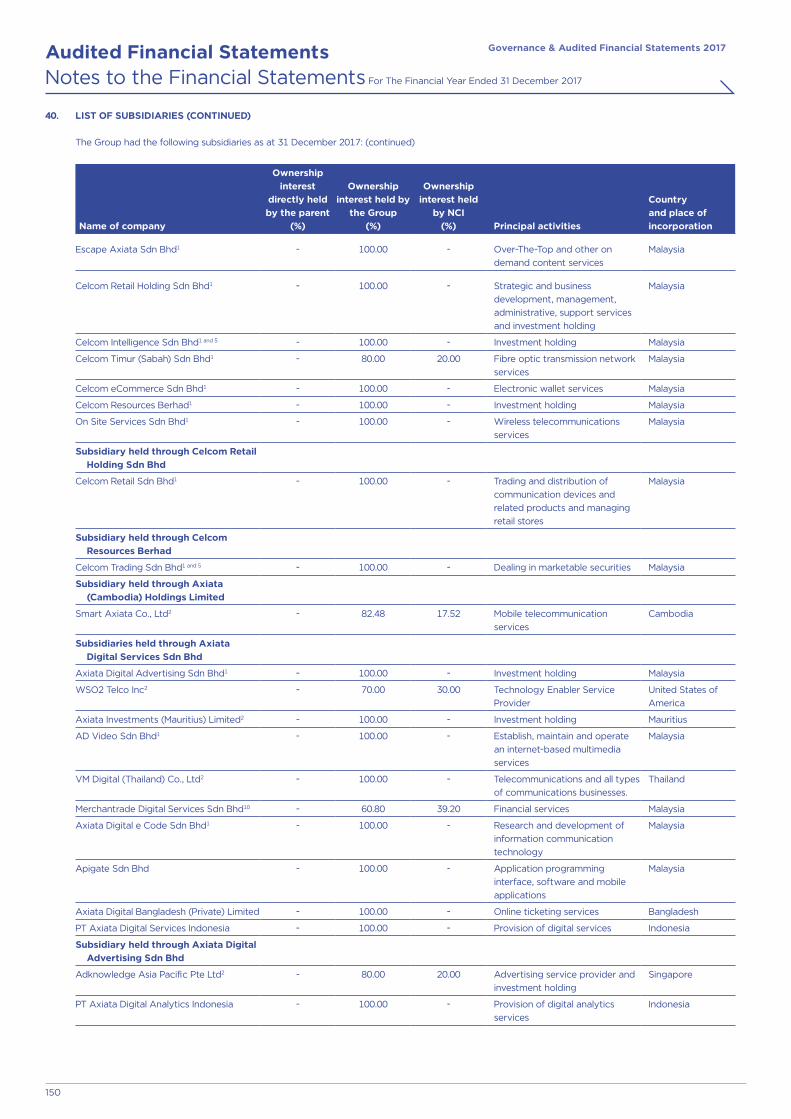
Governance & Audited Financial Statements 2017Audited Financial Statements
150
Notes to the Financial Statements For The Financial Year Ended 31 December 2017
40. LIST OF SUBSIDIARIES (CONTINUED)
The Group had the following subsidiaries as at 31 December 2017: (continued)
Name of company
Ownership interest
directly held by the parent
(%)
Ownership interest held by
the Group(%)
Ownership interest held
by NCI(%) Principal activities
Country and place of incorporation
Escape Axiata Sdn Bhd1 - 100.00 - Over-The-Top and other on demand content services
Malaysia
Celcom Retail Holding Sdn Bhd1 - 100.00 - Strategic and business development, management, administrative, support services and investment holding
Malaysia
Celcom Intelligence Sdn Bhd1 and 5 - 100.00 - Investment holding Malaysia
Celcom Timur (Sabah) Sdn Bhd1 - 80.00 20.00 Fibre optic transmission network services
Malaysia
Celcom eCommerce Sdn Bhd1 - 100.00 - Electronic wallet services Malaysia
Celcom Resources Berhad1 - 100.00 - Investment holding Malaysia
On Site Services Sdn Bhd1 - 100.00 - Wireless telecommunications services
Malaysia
Subsidiary held through Celcom Retail Holding Sdn Bhd
Celcom Retail Sdn Bhd1 - 100.00 - Trading and distribution of communication devices and related products and managing retail stores
Malaysia
Subsidiary held through Celcom Resources Berhad
Celcom Trading Sdn Bhd1 and 5 - 100.00 - Dealing in marketable securities Malaysia
Subsidiary held through Axiata (Cambodia) Holdings Limited
Smart Axiata Co., Ltd2 - 82.48 17.52 Mobile telecommunication services
Cambodia
Subsidiaries held through Axiata Digital Services Sdn Bhd
Axiata Digital Advertising Sdn Bhd1 - 100.00 - Investment holding Malaysia
WSO2 Telco Inc2 - 70.00 30.00 Technology Enabler Service Provider
United States of America
Axiata Investments (Mauritius) Limited2 - 100.00 - Investment holding Mauritius
AD Video Sdn Bhd1 - 100.00 - Establish, maintain and operate an internet-based multimedia services
Malaysia
VM Digital (Thailand) Co., Ltd2 - 100.00 - Telecommunications and all types of communications businesses.
Thailand
Merchantrade Digital Services Sdn Bhd10 - 60.80 39.20 Financial services Malaysia
Axiata Digital e Code Sdn Bhd1 - 100.00 - Research and development of information communication technology
Malaysia
Apigate Sdn Bhd - 100.00 - Application programming interface, software and mobile applications
Malaysia
Axiata Digital Bangladesh (Private) Limited - 100.00 - Online ticketing services Bangladesh
PT Axiata Digital Services Indonesia - 100.00 - Provision of digital services Indonesia
Subsidiary held through Axiata Digital Advertising Sdn Bhd
Adknowledge Asia Pacific Pte Ltd2 - 80.00 20.00 Advertising service provider and investment holding
Singapore
PT Axiata Digital Analytics Indonesia - 100.00 - Provision of digital analytics services
Indonesia

Governance & Audited Financial Statements 2017Audited Financial Statements
151
Notes to the Financial Statements For The Financial Year Ended 31 December 2017
40. LIST OF SUBSIDIARIES (CONTINUED)
The Group had the following subsidiaries as at 31 December 2017: (continued)
Name of company
Ownership interest
directly held by the parent
(%)
Ownership interest held by
the Group(%)
Ownership interest held
by NCI(%) Principal activities
Country and place of incorporation
Subsidiaries held through Adknowledge Asia Pacific Pte Ltd
Komli Asia Holdings Pte Ltd2 - 80.00 20.00 Investment holding and provision of IT products and services for online media companies
Singapore
Adknowledge Asia Pacific (India) Private Limited
- 80.00 20.00 Dormant India
Adknowledge Asia Philippines Inc.2 - 79.99 20.01 Provision of technology and software solutions
Philippines
Subsidiary held through Komli Asia Holdings Pte Ltd
Adknowledge Asia Hong Kong Limited (“AAP Hong Kong”)2
- 80.00 20.00 Investment holding and provision of IT products and services for online media companies
Hong Kong
Subsidiaries held through AAP Hong Kong
Adknowledge Asia (Thailand) Co Ltd2 and 7 - 79.88 20.12 Provision of IT products and services for online media companies
Thailand
Komli Network Philippines, Inc2 and 8 - 80.00 20.00 Being principal and agent to engage in marketing and sale of digital publication, advertising inventory both locally and abroad, using the internet or mobile technology
Philippines
PT Adknowledge Asia Indonesia2 - 79.20 20.80 Provision of IT products and services for online media companies
Indonesia
Adknowledge Asia Malaysia Sdn Bhd2 - 80.00 20.00 Being consultants, specialists and agents in multimedia advertising and other related activities
Malaysia
Adknowledge Asia Singapore Pte Ltd2 - 80.00 20.00 Provision of IT products and services for online media companies
Singapore
Subsidiary held through WSO2 Telco Inc
WSO2. Telco (Private) Limited2 - 70.00 30.00 Develop and provide support services for software technologies products and solutions
Sri Lanka
Subsidiary held through Axiata Business Services Sdn Bhd
Xpand Investments (Labuan)1 - 100.00 - Investment holding Federal Territory, Labuan Malaysia
Subsidiary held through Xpand Investments (Labuan) Limited
Suvitech Co., Ltd2 - 65.00 35.00 Owner and operation of a mobile virtual network enabler (MVNE) platform to facilitate the provision of sales, dealer management, products, pricing and provisioning, and billing for customer, enterprise and IoT services
Thailand

Governance & Audited Financial Statements 2017Audited Financial Statements
152
Notes to the Financial Statements For The Financial Year Ended 31 December 2017
40. LIST OF SUBSIDIARIES (CONTINUED)
The Group had the following subsidiaries as at 31 December 2017: (continued)
Name of company
Ownership interest
directly held by the parent
(%)
Ownership interest held by
the Group(%)
Ownership interest held
by NCI(%) Principal activities
Country and place of incorporation
Subsidiaries held through edotco Group Sdn Bhd
edotco Malaysia Sdn Bhd1 - 63.00 37.00 Telecommunication infrastructure and services
Malaysia
edotco Investments (Labuan) Limited1 - 63.00 37.00 Investment holding Federal Territory, Labuan Malaysia
edotco Holdings (Labuan) Limited1 - 49.23 50.77 Investment holding Federal Territory, Labuan Malaysia
edotco Bangladesh Co. Ltd3 - 50.40 29.60 Telecommunication infrastructure and services
Bangladesh
Associate held through Robi Axiata Limited
edotco Bangladesh Co. Ltd3 - 13.74 6.26 Telecommunication infrastructure and services
Bangladesh
Subsidiaries held through edotco Investments (Labuan) Limited
edotco Towers (Bangladesh) Limited2 - 63.00 37.00 Telecommunication infrastructure and services
Bangladesh
edotco Pakistan (Private) Limited2 - 63.00 37.00 Telecommunication infrastructure and services
Pakistan
edotco Services Lanka (Private) Limited2 - 63.00 37.00 Provision of end to end Integrated Infrastructure Services
Sri Lanka
edotco Investments Singapore Pte Ltd (“edotco SG”)2
- 55.13 44.87 Investment holding Singapore
Subsidiaries held through edotco SG
Asian Towers Holdings Pte Limited2 - 55.13 44.87 Investment holding Singapore
edotco Myanmar Limited2 - 55.13 44.87 Telecommunication infrastructure and services
Myanmar
Subsidiary held through edotco Holdings (Labuan) Limited
edotco (Cambodia) Co., Ltd2 - 39.38 40.62 Telecommunication infrastructure and services
Cambodia
Associate held through Smart Axiata Co., Ltd
edotco (Cambodia) Co., Ltd2 - 16.50 3.50 Telecommunication infrastructure and services
Cambodia
Subsidiary held through edotco Pakistan (Private) Limited
Tanzanite Tower (Private) Limited2 - 63.00 37.00 Telecommunication infrastructure and services
Pakistan
Subsidiary held through Axiata Investments (UK) Limited
Reynolds Holdings Limited4 - 100.00 - Investment holding St Kitts and Nevis
Subsidiary held through Reynolds Holdings Limited
Ncell Private Limited3 and 9 - 80.00 20.00 Telecommunication services Nepal

Governance & Audited Financial Statements 2017Audited Financial Statements
153
Notes to the Financial Statements For The Financial Year Ended 31 December 2017
40. LIST OF SUBSIDIARIES (CONTUNUED)
1 Audited by PricewaterhouseCoopers Malaysia.
2 Audited by member firms of PricewaterhouseCoopers International Limited which are a separate and independent legal entity from PricewaterhouseCoopers Malaysia.
3 Audited by a firm other than a member firm of PricewaterhouseCoopers International Limited.
4 No audit is required as allowed by the laws of the perspective country in incorporation.
5 Inactive as at 31 December 2017.
6 In accordance with IC 112-Consolidation: “Special Purpose Vehicles”, AF is consolidated in the Group as the substance of the relationship between the Company and the special purpose entity indicates that the entity is controlled by the Company.
7 AAP Hong Kong and MGMG Venture Co Ltd hold 255,200 ordinary shares and 382,800 preference shares respectively in the entity. One (1) ordinary share is entitled to one (1) vote and one thousand (1,000) preference shares are entitled to one (1) vote. Accordingly AAP Hong Kong maintains its control over the entity.
8 AAP Hong Kong is holding 3,125 ordinary shares in the entity and 9,375 ordinary shares via Trust Deed.
9 Ncell has a financial year end in accordance with the calendar year of Nepal in every mid of July.
10 8.20% ownership interest is held through a joint venture of the Group, Merchantrade Asia Sdn Bhd.
41. LIST OF ASSOCIATES
The investments in associates are as follows:
Name of companyGroup’s effective ownership
interest Principal activities
Country and place of incorporation
2017(%)
2016(%)
Associate held through Celcom Axiata Berhad
Sacofa Sdn Bhd 15.12 15.12 Telecommunication infrastructure and services Malaysia
Associate held through Axiata Investments (Singapore) Limited
M1 Limited 28.69 28.54 Mobile telecommunication services, sales of telecommunication equipment and accessories
Singapore
Associates held through Axiata Investments 1 (India) Limited and Axiata Investments 2 (India) Limited
Idea Cellular Limited 19.74 19.77 Mobile telecommunication services India
Associate held through Dialog Axiata PLC
Firstsource Dialog Solutions (Private) Limited
21.66 21.66 Information technology enabled services Sri Lanka
Associate held through Digital Holdings Lanka (Private) Limited
Headstart (Private) Limited 36.14 21.66 Creating and providing e-learning content Sri Lanka
Dialog Axiata Digital Innovation Fund (Private) Limited
20.83 - Venture capital fund Sri Lanka
Associate held through Axiata SPV4 Sdn Bhd
Axiata Digital Innovation Fund Sdn Bhd2 62.19 71.07 Venture capital Malaysia
Associates held through Axiata Digital Services Sdn Bhd
Celcom Planet Sdn Bhd1 49.00 49.00 e-commerce platform business Malaysia
Dialog Axiata Digital Innovation Fund (Private Limited)
25.00 - Venture capital fund Sri Lanka
Milvik 10.63 - Micro-insurance platform business Sweden

Governance & Audited Financial Statements 2017Audited Financial Statements
154
Notes to the Financial Statements For The Financial Year Ended 31 December 2017
41. LIST OF ASSOCIATES (CONTINUED)
The investments in associates are as follows: (continued)
Name of companyGroup’s effective ownership
interest Principal activities
Country and place of incorporation
2017(%)
2016(%)
Associates held through Axiata Digital Services Sdn Bhd
Unlockd Media Pty Ltd3 10.05 - Ad and content funded mobile platform Australia
Etobee Holdings Pte Ltd 20.31 - Mobile application logistics provider Indonesia
Associate held through Axiata Investments (Mauritius) Limited
Localcube Commerce Private Limited 29.65 25.22 e-commerce and digital kiosk India
LocalCube Commerce Asia Sdn Bhd 29.66 - e-commerce Malaysia
PT Localcube Commerce Indonesia 29.65 - e-commerce Indonesia
Associate held through Smart Axiata Co., Ltd
SADIF LP4 65.98 - Venture capital fund Labuan
1 The Group restructured its holding in Celcom Planet via disposal from Celcom Intelligence Sdn Bhd to Axiata Digital Services Sdn Bhd.
2 The Group and the Company exercised its significant influence via 1 out of 5 votes in the Investment Committee.
3 The Group exercised its significant influence via 1 out of 6 votes in the Investment Committee.
4 The Group exercised its significant influence via 2 out of 5 votes in the Investment Committee.
All associates have co-terminous financial year end with the Group except for Idea and Localcube with financial year ended on 31 March.
42. LIST OF JOINT VENTURES
The investments in joint ventures are as follows:
Name of companyGroup’s effective ownership
interest Principal activities
Country and place of incorporation
2017(%)
2016(%)
Joint ventures held through Celcom Axiata Berhad
PLDT Malaysia Sdn Bhd 49.00 49.00 Mobile virtual network operator Malaysia
Digital Milestone Sdn Bhd1 51.00 51.00 Special purpose investment company Malaysia
Tune Talk Sdn Bhd 35.00 35.00 Mobile communication services Malaysia
Merchantrade Asia Sdn Bhd 20.00 20.00 Provision of money service business, i.e. remittance and money changing and operator of mobile virtual network
Malaysia
Joint ventures held through PT XL Axiata Tbk
PT XL Planet - 33.18 e-commerce Indonesia
PT One Indonesia Synergy 33.18 33.18 Consultancy services in future network collaboration
Indonesia
Joint venture held through Axiata Digital Services Sdn Bhd
Yonder Music Inc - 27.03 Mobile-only digital music download service United States Of America
1 On 20 April 2015, Digital Milestone commenced members’ voluntary winding-up. Liquidators of Digital Milestone lodged the required return with the Registrar of Companies and the Official Receiver on 22 January 2018. Pursuant to Section 459 (5) of the Companies Act 2016, on expiration of 3 months after the lodging of such return, Digital Milestone would be dissolved with effect from 23 April 2018.

Governance & Audited Financial Statements 2017Audited Financial Statements
155
Notes to the Financial Statements For The Financial Year Ended 31 December 2017
43. RELATED PARTY TRANSACTIONS
All related party transactions were entered into in the normal course of business and at prices available at negotiated terms. The names of these related parties, nature of these transactions and their total value have been set out in accordance with the provisions of MFRS 124: “Related Party Disclosure”.
The Government of Malaysia and bodies controlled or jointly controlled by the Government of Malaysia are related parties of the Group. The Government of Malaysia has significant influence over the Group. The Group enters into transactions with many of these bodies, which includes but is not limited to:
– receiving telecommunications services, including interconnection revenue/charges– purchasing of goods, including use of public utilities and amenities, and– placing of bank deposits
The Group has established its procurement policies and approval processes for purchases of products and services, which do not depend on whether the counterparties are government-related entities or not.
The Group provides telecommunications services as part of its ordinary operations. The Group has collectively, but not individually significant transactions with Government-related entities. These telecommunication services are carried out on commercial terms that are negotiated and agreed upon between the parties.
Key management personnel are the persons who have authority and responsibility for planning, directing and controlling the activities of the Group or the Company either directly or indirectly. Key management personnel of the Group and the Company include the Senior Leadership Team who report directly to the Group Chief Executive Officer.
Whenever exist, related party transactions also includes transaction with entities that are controlled, joint ventures or significantly influenced directly by any key management personnel or their close family members.
In addition to related party transactions and balances mentioned elsewhere in the financial statements, set out below are significant related party transactions and balances which were carried out on terms and conditions negotiated amongst the related parties.
Group Company
2017RM’000
2016RM’000
2017RM’000
2016RM’000
(a) Sale of goods and services:
Associates:
- International roaming revenue 6,979 14,312 - -
- Telecommunication services - 258,946 - -
6,979 273,258 - -
Joint ventures:
- Telecommunication services 254,293 406,285 - -
(b) Purchase of goods and services:
Associates:
- Interconnection charges 795 11,751 - -
- Leaseline charges, maintenance and others 65,022 69,220 - -
65,817 80,971 - -
Joint ventures:
- Revenue sharing 18,336 96,815 - -
(c) Intercompany service agreement with subsidiaries:
- Technical and management services - - 59,565 47,435
(d) Dividends received from subsidiaries/associates - - - 1,002,403
(e) Repayments from/(advances to) subsidiaries:
- Repayments - - 787,348 186,692
- Advances - - (352,224) (2,593,067)
(f) Interest income/(expense) on advances (from)/to subsidiaries:
- Interest income - - - 10,657
- Interest expense - - (24,634) (24,701)

Governance & Audited Financial Statements 2017Audited Financial Statements
156
Notes to the Financial Statements For The Financial Year Ended 31 December 2017
43. RELATED PARTY TRANSACTIONS (CONTINUED)
(g) The outstanding balances as at reporting date are disclosed in Note 26 and Note 31 to the financial statements.
Group Company
2017RM’000
2016RM’000
2017RM’000
2016RM’000
(h) Key management compensation short term employee benefits:
- Salaries, allowances and bonus 22,567 23,525 22,567 23,525
- Contribution to EPF 1,908 2,383 1,908 2,383
- Estimated money value of benefits 44 47 44 47
- Other staff benefits 205 171 205 171
- Share-based payment expenses 6,549 4,708 6,549 4,708
Included in key management compensation is the Executive Directors’ remuneration of the Company as disclosed in Note 7(d) to the financial statements.
44. DIVIDENDS
Tax exempt dividend under single tier system
2017 2016
Type
Per ordinaryshare
Sen Total
RM’000 Type
Per ordinaryshare
Sen Total
RM’000
In respect of financial year ended 31 December:
- 2015 - - - Final3 12 1,058,806
- 20161 Final 3 269,221 Interim4 5 446,310
- 20172 Interim 5 449,919 - - -
8 719,140 17 1,505,116
1 Out of the total dividend distribution, a total RM113.2 million was converted into 24.1 million new ordinary shares of the Company at a conversion price of RM4.70 per ordinary share pursuant to DRS of the Company.
2 Out of the total dividend distribution, a total RM226.7 million was converted into 49.0 million new ordinary shares of the Company at a conversion price of RM4.63 per ordinary share pursuant to DRS of the Company.
3 Out of the total dividend distribution, a total RM496.9 million was converted into 102.0 million new ordinary shares of the Company at a conversion price of RM4.87 per ordinary share pursuant to DRS of the Company.
4 Out of the total dividend distribution, a total RM217.7 million was converted into 44.9 million new ordinary shares of the Company at a conversion price of RM4.85 per ordinary share pursuant to DRS of the Company.
The Board of Directors has recommended a final tax exempt dividend under the single tier system of 3.5 sen per each ordinary share of the Company in respect of financial year ended 31 December 2017 amounting to a total of RM316.7 million, based on the paid-up capital of the Company as at 31 December 2017. The proposed dividend is subject to approval by the shareholders at the forthcoming AGM.
The Board of Directors also determined that the Company’s DRS will apply to the Proposed Final Dividend. This will be subject to the approval of shareholders at the forthcoming AGM for the renewal of the authority for the Directors of the Company to allot and issue the new ordinary shares pursuant to the DRS and the approval of Bursa Malaysia Securities Berhad.

Governance & Audited Financial Statements 2017Audited Financial Statements
157
Notes to the Financial Statements For The Financial Year Ended 31 December 2017
45. MEASUREMENT PERIOD ADJUSTMENTS
On 11 April 2016, the Group completed the acquisition of Reynolds. As at 31 December 2016, the goodwill was accounted for on a provisional basis. In April 2017, the Group completed the purchase price allocation and retrospectively adjusted the provisional amounts recognised at the acquisition date to reflect the new information obtained about facts and circumstances that existed as of the acquisition date.
The following summarises the consideration paid on the acquisition of Reynolds at consolidated basis, the fair value of the identifiable assets acquired, liabilities assumed and NCI at the acquisition date.
As previously reported
RM’000Adjustments
RM’000As restated
RM’000
Purchase consideration as per the SPA in cash 5,327,469 5,327,469
Details of the net identifiable assets acquired are as follows:
PPE 1,404,320 15,474 1,419,794
Intangible assets 3,559,641 (10,129) 3,549,512
Inventories 4,526 - 4,526
Trade and other receivables 853,141 (4,271) 848,870
Cash and bank balances 1,626,407 - 1,626,407
Deferred tax liabilities (754,266) 45,551 (708,715)
Provision for liabilities (35,822) 5,766 (30,056)
Trade and other payables (1,595,788) (976) (1,596,764)
Tax liabilities (194,159) (61,932) (256,091)
Total net identifiable assets 4,868,000 (10,517) 4,857,483
Less: NCI (911,746) 2,103 (909,643)
Total net identifiable assets acquired, net of NCI’s shares 3,956,254 (8,414) 3,947,840
Closing statement adjustments and liability incurred which were part of the total purchase consideration for goodwill computation purpose 1,589,037 254,787 1,843,824
Goodwill on acquisition 2,960,252 263,201 3,223,453
46. SIGNIFICANT EVENTS DURING THE FINANCIAL YEAR
(a) Subscription Agreement for shares in edotco PK
On 30 August 2017, edotco Labuan entered into a Subscription Agreement with Dawood Hercules Corporation Limited (“DH Corp”) for the subscription of shares in edotco PK.
Under the SA, edotco Labuan and DH Corp will respectively subscribe to 955,260,813 and 1,743,000,000 of edotco PK shares of PKR10 each (“Proposed Subscription”) at consideration of USD154.7 million (equivalent to RM660.6 million) and USD166.0 million (equivalent to RM708.7 million) respectively (“Subscription Monies”). The Subscription Monies including the initial equity injection by edotco Labuan of USD19.2 million (equivalent to RM82.2 million) shall be used to partially fund the acquisition of Deodar (Private) Limited (“Deodar”) which owns and operates approximately 13,000 of Pakistan Mobile Communications Limited (“PMCL”) tower portfolio. Upon closing of the Proposed Subscription, edotco Labuan and DH Corp will respectively hold 55% and 45% interest in edotco PK.
The proposed subscription has not been completed as at 31 December 2017.
(b) Acquisition of Deodar (Private) Limited
On 30 August 2017, TTPL entered into an Agreement for the Subscription, Sale and Purchase of the Shares in Deodar with PMCL for the subscription of up to 3,569,990,000 ordinary shares of PKR10 each and the subsequent acquisition of the remaining nominal amount of shares in the capital of Deodar from PMCL for a total cash consideration of USD940.0 million (equivalent to approximately RM4,012.9 million).
The proposed acquisition has not been completed as at 31 December 2017.

Governance & Audited Financial Statements 2017Audited Financial Statements
158
Notes to the Financial Statements For The Financial Year Ended 31 December 2017
47. EVENTS AFTER REPORTING PERIOD
(a) Investment in Headstart (Private) Limited (“Headstart”)
On 18 January 2018, Headstart became a subsidiary company of Dialog following the conversion to equity the last tranche of bonds. Effectively equity interest in Headstart increased from 43.37% as disclosed in Note5 (a)(vii) to the financial statements to 50.59%.
(b) Incorporation of Axiata Global Services Pte Ltd (“AGSPL”)
ABS had on 22 January 2018 incorporated AGSPL, a private company limited by shares, in Singapore, under the Companies (Amendment) Act 2017. AGSPL was incorporated with an issued and paid-up share capital of USD2. The intended principal activities of AGSPL are to carry out regional Business-to-Business transactions including shared service support for the Group.
(c) Letter of Offer on Spectrum Assignment in the 2100 Mhz Spectrum Band
Celcom had on 29 September 2017 received the letter from the Malaysian Communications and Multimedia Commission (“MCMC”) on the reissuance of the existing Spectrum Assignment in 1950 Mhz to 1965 Mhz and 2140 Mhz to 2155 Mhz for a period of 16 years effective from 2 April 2018, subject to price component payment of RM118.4 million being made in one lump sum before 1 February 2018 and annual fixed fee payment of RM50.0 million payable before 15 December throughout the assignment period. Celcom has submitted the price component fee of RM118.4 million on 30 January 2018.
(d) Dilution on equity interest in Idea
Idea had on 12 February 2018 allotted 326,633,165 equity shares with face value of INR10 each (“Idea Shares”) at an issue price of INR99.50 per Idea Share aggregating to INR32.5 billion on preferential basis to several entities (“Preferential Issuance of Idea Shares”) to the National Stock Exchange of India Limited.
Following the non-participation by the Group on the allotment of Idea Shares under the Preferential Issuance of Idea Shares, the Group’s equity interest in Idea decreased from 19.74% to 18.10%.

Governance & Audited Financial Statements 2017Audited Financial Statements
159
Statement by Directors Pursuant To Section 251(2) Of The Companies Act 2016
Statutory Declaration Pursuant To Section 251(1) Of The Companies Act 2016
We, Tan Sri Datuk Wira Azman Hj. Mokhtar and Tan Sri Jamaludin Ibrahim, two of the Directors of Axiata Group Berhad, do hereby state that, in the opinion of the Directors, the financial statements set out on pages 45 to 158 are drawn up in accordance with Malaysian Financial Reporting Standards, International Financial Reporting Standards and the requirements of the Companies Act 2016 in Malaysia so as to give a true and fair view of the financial position of the Group and of the Company as of 31 December 2017 and of their financial performance and cash flows for the financial year then ended.
Signed on behalf of the Board of Directors in accordance with their resolution dated 22 February 2018.
TAN SRI DATUK WIRA AZMAN HJ. MOKHTAR TAN SRI JAMALUDIN IBRAHIMDIRECTOR DIRECTOR
I, Yap Wai Yip, the officer primarily responsible for the financial management of Axiata Group Berhad, do solemnly and sincerely declare that the financial statements set out on pages 45 to 158 are, to the best of my knowledge and belief, correct and I make this solemn declaration conscientiously believing the same to be true, and by virtue of the provisions of the Statutory Declarations Act, 1960.
YAP WAI YIP
Subscribed and solemnly declared by the above named Yap Wai Yip at Kuala Lumpur in Malaysia on 22 February 2018, before me.
COMMISSIONER FOR OATHS
Governance & Audited Financial Statements 2017Audited Financial Statements
160
Independent Auditors’ Report To the Members of Axiata Group Berhad (Incorporated in Malaysia) (Company No. 242188-H)
REPORT ON THE AUDIT OF THE FINANCIAL STATEMENTS
Our opinion
In our opinion, the financial statements of Axiata Group Berhad (“the Company”) and its subsidiaries (“the Group”) give a true and fair view of the financial position of the Group and of the Company as at 31 December 2017, and of their financial performance and their cash flows for the year then ended in accordance with Malaysian Financial Reporting Standards, International Financial Reporting Standards and the requirements of the Companies Act 2016 in Malaysia.
What we have audited
We have audited the financial statements of the Group and of the Company, which comprise the statements of financial position as at 31 December 2017 of the Group and of the Company, and the statements of comprehensive income, statements of changes in equity and statements of cash flows of the Group and of the Company for the year then ended, and notes to the financial statements, including a summary of significant accounting policies, as set out on pages 45 to 158.
Basis for opinion
We conducted our audit in accordance with approved standards on auditing in Malaysia and International Standards on Auditing. Our responsibilities under those standards are further described in the “Auditors’ responsibilities for the audit of the financial statements” section of our report.
We believe that the audit evidence we have obtained is sufficient and appropriate to provide a basis for our opinion.
Independence and other ethical responsibilities
We are independent of the Group and of the Company in accordance with the By-Laws (on Professional Ethics, Conduct and Practice) of the Malaysian Institute of Accountants (“By-Laws”) and the International Ethics Standards Board for Accountants’ Code of Ethics for Professional Accountants (“IESBA Code”), and we have fulfilled our other ethical responsibilities in accordance with the By-Laws and the IESBA Code.
Our audit approach
As part of designing our audit, we determined materiality and assessed the risks of material misstatement in the financial statements of the Group and the Company. In particular, we considered where the Directors made subjective judgements; for example, in respect of significant accounting estimates that involved making assumptions and considering future events that are inherently uncertain. As in all of our audits, we also addressed the risk of management override of internal controls, including among other matters, consideration of whether there was evidence of bias that represented a risk of material misstatement due to fraud.
We tailored the scope of our audit in order to perform sufficient work to enable us to provide an opinion on the financial statements as a whole, taking into account the structure of the Group and of the Company, the accounting processes and controls, and the industry in which the Group and the Company operate.
Key audit matters
Key audit matters are those matters that, in our professional judgement, were of most significance in our audit of the financial statements of the Group and of the Company for the current year. These matters were addressed in the context of our audit of the financial statements of the Group and of the Company as a whole, and in forming our opinion thereon, and we do not provide a separate opinion on these matters.

Governance & Audited Financial Statements 2017Audited Financial Statements
161
REPORT ON THE AUDIT OF THE FINANCIAL STATEMENTS (CONTINUED)
Key audit matters (continued)
Key audit matter How our audit addressed the key audit matter
Carrying value assessment of the investment in an associate, Idea Cellular Limited (“Idea”) – impairment and classification
Refer to Note 3(e) – Significant Accounting Policies – Impairment of non-financial assets (excluding goodwill), Note 4(b)(ii) Critical accounting estimates and assumptions – Impairment assessment on non-financial assets (excluding goodwill) and Note 27 – Associates
The Group has an investment in Idea, a listed associate, with a carrying amount of RM6,159.6 million which is significant to the Group.
(i) Impairment assessment
As of 31 December 2017, the carrying amount of the investment in associate is higher than its fair value. The fair value was based on its share price adjusted for block discount in accordance with the Group’s accounting policy as stated in Note 3(e) to the financial statements. Accordingly, the Group had tested the carrying amount of the investment in associate for impairment.
We focused on this area as management’s assessment of the recoverable amount of the investment in associate based on the value in use method involves significant judgement in estimating the future cash flows.
(ii) Classification assessment
During the financial year, the merger of Vodafone India and Idea Cellular was announced. The merger, once completed, will result in a dilution of the Group’s existing equity investment in Idea.
It is expected that Axiata’s equity interest in Idea of 19.74% at year end will be diluted on completion of the merger, which would result in a loss of significant influence. At year end, management has taken the view that it is not highly probable the merger will be completed within 12 months from year end. On this basis, the criteria under MFRS 5 – “Non-current assets held for sale and discontinued operations”, for the investment in Idea to be classified as held for sale have not been met. This is based on the fact that regulatory approvals by the relevant authorities in India for the merger have not been obtained and based on management’s judgement, the outcome is highly uncertain and timing for the approval is typically protracted given the industry practice in India.
Accordingly, the investment in Idea continues to be equity accounted by the Group at year end. Had the requirements of MFRS 5 been met, the non-current asset or disposal group classified as held for sale (or held for distribution to owners) would be measured at the lower of its carrying amount and fair value less costs to sell.
We focused on this area as management’s view that regulatory approvals for the merger is not highly probable within the next 12 months from year end is significant to the accounting conclusion for the investment in Idea at year end.
We performed the following audit procedures:
(i) Impairment assessment
• We were assisted by our valuation expert in assessing the appropriateness of the methodology adopted by management for impairment assessment in accordance with MFRS 136 “Impairment of Assets”. We found that the methodology used is acceptable.
• We compared the discount rate, terminal growth rate and revenue growth rate by reference to the comparable companies and the industry in the same territory. We found that these assumptions used by management were supported by ranges observed from comparable companies and industry estimates.
• We compared the EBITDA margin to the historical performance of the associate and found this assumption to be within the range of historical performance.
(ii) Classification assessment
• We challenged management’s judgement that the criteria under MFRS 5 for the investment in Idea to be classified as held for sale had not been met as at reporting date, including reading of relevant supporting evidence.
• We discussed with management and the Audit Committee. We obtained an understanding of the basis of judgement made by the management and the Directors.
• In particular, we evaluated management’s judgement that the outcome of the regulatory approval and the timing to complete the merger is uncertain at year end due to pending regulatory approvals, and that it is not highly probable the regulatory approvals will be received within 12 months from year end. This involved corroborating the assumption to past practices in India by the relevant authorities, understanding the regulatory requirements to which the approval is subject to, and the level of scrutiny required by the relevant authorities which would typically result in a protracted approval process as well as possible termination of similar schemes.
Independent Auditors’ Report To the Members of Axiata Group Berhad (Incorporated in Malaysia) (Company No. 242188-H)Independent Auditors’ Report To the Members of Axiata Group Berhad (Incorporated in Malaysia) (Company No. 242188-H)
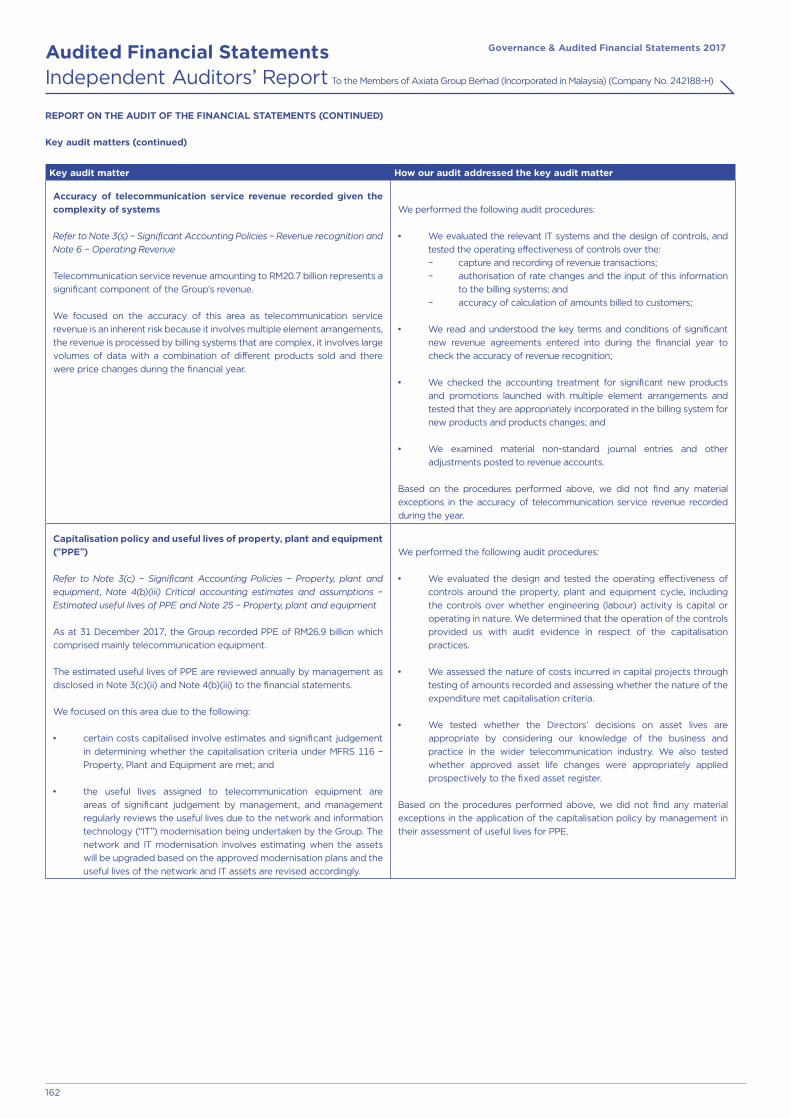
Governance & Audited Financial Statements 2017Audited Financial Statements
162
REPORT ON THE AUDIT OF THE FINANCIAL STATEMENTS (CONTINUED)
Key audit matters (continued)
Key audit matter How our audit addressed the key audit matter
Accuracy of telecommunication service revenue recorded given the complexity of systems
Refer to Note 3(s) – Significant Accounting Policies – Revenue recognition and Note 6 – Operating Revenue
Telecommunication service revenue amounting to RM20.7 billion represents a significant component of the Group’s revenue.
We focused on the accuracy of this area as telecommunication service revenue is an inherent risk because it involves multiple element arrangements, the revenue is processed by billing systems that are complex, it involves large volumes of data with a combination of different products sold and there were price changes during the financial year.
We performed the following audit procedures:
• We evaluated the relevant IT systems and the design of controls, and tested the operating effectiveness of controls over the: – capture and recording of revenue transactions; – authorisation of rate changes and the input of this information
to the billing systems; and – accuracy of calculation of amounts billed to customers;
• We read and understood the key terms and conditions of significant
new revenue agreements entered into during the financial year to check the accuracy of revenue recognition;
• We checked the accounting treatment for significant new products and promotions launched with multiple element arrangements and tested that they are appropriately incorporated in the billing system for new products and products changes; and
• We examined material non-standard journal entries and other adjustments posted to revenue accounts.
Based on the procedures performed above, we did not find any material exceptions in the accuracy of telecommunication service revenue recorded during the year.
Capitalisation policy and useful lives of property, plant and equipment (“PPE”)
Refer to Note 3(c) – Significant Accounting Policies – Property, plant and equipment, Note 4(b)(iii) Critical accounting estimates and assumptions – Estimated useful lives of PPE and Note 25 – Property, plant and equipment
As at 31 December 2017, the Group recorded PPE of RM26.9 billion which comprised mainly telecommunication equipment.
The estimated useful lives of PPE are reviewed annually by management as disclosed in Note 3(c)(ii) and Note 4(b)(iii) to the financial statements.
We focused on this area due to the following:
• certain costs capitalised involve estimates and significant judgement in determining whether the capitalisation criteria under MFRS 116 – Property, Plant and Equipment are met; and
• the useful lives assigned to telecommunication equipment are areas of significant judgement by management, and management regularly reviews the useful lives due to the network and information technology (“IT”) modernisation being undertaken by the Group. The network and IT modernisation involves estimating when the assets will be upgraded based on the approved modernisation plans and the useful lives of the network and IT assets are revised accordingly.
We performed the following audit procedures:
• We evaluated the design and tested the operating effectiveness of controls around the property, plant and equipment cycle, including the controls over whether engineering (labour) activity is capital or operating in nature. We determined that the operation of the controls provided us with audit evidence in respect of the capitalisation practices.
• We assessed the nature of costs incurred in capital projects through testing of amounts recorded and assessing whether the nature of the expenditure met capitalisation criteria.
• We tested whether the Directors’ decisions on asset lives are appropriate by considering our knowledge of the business and practice in the wider telecommunication industry. We also tested whether approved asset life changes were appropriately applied prospectively to the fixed asset register.
Based on the procedures performed above, we did not find any material exceptions in the application of the capitalisation policy by management in their assessment of useful lives for PPE.
Independent Auditors’ Report To the Members of Axiata Group Berhad (Incorporated in Malaysia) (Company No. 242188-H)

Governance & Audited Financial Statements 2017Audited Financial Statements
163
REPORT ON THE AUDIT OF THE FINANCIAL STATEMENTS (CONTINUED)
Key audit matters (continued)
Key audit matter How our audit addressed the key audit matter
Recoverability of advances to Axiata Investments 1 (India) Limited and Axiata Investments 2 (India) Limited
Refer to Note 3(d) – Significant Accounting Policies – Investments in subsidiaries, associates and joint ventures in separate financial statements and Note 26 – Subsidiaries, in separate financial statements
The Company had made advances denominated in US Dollar to its subsidiaries, Axiata Investments 1 (India) Limited and Axiata Investments 2 (India) Limited in previous financial year. These advances were made for the acquisition of investment in Idea, an associate of the Group.
At 31 December 2017, the US Dollar advances of USD1,835 million have been restructured into RM denominated advances amounting to RM6,159 million. As a result, a loss on restructuring of RM1,277 million was recognised in the Statement of Comprehensive Income of the Company.
We focused on this balance as the amount is material and involved management’s estimate in determining the present value of the future cash flows.
We performed the following audit procedures:
• We read the new RM denominated loan agreement to obtain an understanding of the terms of the restructured loan. We checked the mathematical accuracy of the loss on restructuring recognised.
• We tested the assumptions made by management on future cash flows expected for repayment.
• We found these assumptions to be consistent with the assumptions used in testing of the recoverable amount of investment in Idea. Our procedures on the assumptions were explained in the Key Audit Matter relating to carrying value assessment of the investment in Idea above.
• We checked the calculations made by management on the restructuring and carrying amount of the restructured loan and we found no exception.
Information other than the financial statements and auditors’ report thereon
The Directors of the Company are responsible for the other information. The other information comprises the Directors’ Report and Statement of Risk Management and Internal Control, which we obtained prior to the date of this auditors’ report, and other sections of the 2017 Integrated Annual Report, which is expected to be made available to us after that date. Other information does not include the financial statements of the Group and of the Company and our auditors’ report thereon.
Our opinion on the financial statements of the Group and of the Company does not cover the other information and we do not express any form of assurance conclusion thereon.
In connection with our audit of the financial statements of the Group and of the Company, our responsibility is to read the other information and, in doing so, consider whether the other information is materially inconsistent with the financial statements of the Group and of the Company or our knowledge obtained in the audit or otherwise appears to be materially misstated.
If, based on the work we have performed on the other information that we obtained prior to the date of this auditors’ report, we conclude that there is a material misstatement of this other information, we are required to report that fact. We have nothing to report in this regard.
Responsibilities of the Directors for the financial statements
The Directors of the Company are responsible for the preparation of the financial statements of the Group and of the Company that give a true and fair view in accordance with Malaysian Financial Reporting Standards, International Financial Reporting Standards and the requirements of the Companies Act 2016 in Malaysia. The Directors are also responsible for such internal control as the Directors determine is necessary to enable the preparation of financial statements of the Group and of the Company that are free from material misstatement, whether due to fraud or error.
In preparing the financial statements of the Group and of the Company, the Directors are responsible for assessing the Group’s and the Company’s ability to continue as a going concern, disclosing, as applicable, matters related to going concern and using the going concern basis of accounting unless the Directors either intend to liquidate the Group or the Company or to cease operations, or have no realistic alternative but to do so.
Auditors’ responsibilities for the audit of the financial statements
Our objectives are to obtain reasonable assurance about whether the financial statements of the Group and of the Company as a whole are free from material misstatement, whether due to fraud or error, and to issue an auditors’ report that includes our opinion. Reasonable assurance is a high level of assurance, but is not a guarantee that an audit conducted in accordance with approved standards on auditing in Malaysia and International Standards on Auditing will always detect a material misstatement when it exists. Misstatements can arise from fraud or error and are considered material if, individually or in the aggregate, they could reasonably be expected to influence the economic decisions of users taken on the basis of these financial statements.
As part of an audit in accordance with approved standards on auditing in Malaysia and International Standards on Auditing, we exercise professional judgement and maintain professional scepticism throughout the audit. We also:
(a) Identify and assess the risks of material misstatement of the financial statements of the Group and of the Company, whether due to fraud or error, design and perform audit procedures responsive to those risks, and obtain audit evidence that is sufficient and appropriate to provide a basis for our opinion. The risk of not detecting a material misstatement resulting from fraud is higher than for one resulting from error, as fraud may involve collusion, forgery, intentional omissions, misrepresentations, or the override of internal control.
Independent Auditors’ Report To the Members of Axiata Group Berhad (Incorporated in Malaysia) (Company No. 242188-H)

Governance & Audited Financial Statements 2017Audited Financial Statements
164
REPORT ON THE AUDIT OF THE FINANCIAL STATEMENTS (CONTINUED)
Auditors’ responsibilities for the audit of the financial statements (continued)
(b) Obtain an understanding of internal control relevant to the audit in order to design audit procedures that are appropriate in the circumstances, but not for the purpose of expressing an opinion on the effectiveness of the Group’s and the Company’s internal control.
(c) Evaluate the appropriateness of accounting policies used and the reasonableness of accounting estimates and related disclosures made by the Directors.
(d) Conclude on the appropriateness of the Directors’ use of the going concern basis of accounting and, based on the audit evidence obtained, whether a material uncertainty exists related to events or conditions that may cast significant doubt on the Group’s or the Company’s ability to continue as a going concern. If we conclude that a material uncertainty exists, we are required to draw attention in our auditors’ report to the related disclosures in the financial statements of the Group and of the Company or, if such disclosures are inadequate, to modify our opinion. Our conclusions are based on the audit evidence obtained up to the date of our auditors’ report. However, future events or conditions may cause the Group or the Company to cease to continue as a going concern.
(e) Evaluate the overall presentation, structure and content of the financial statements of the Group and of the Company, including the disclosures, and whether the financial statements of the Group and of the Company represent the underlying transactions and events in a manner that achieves fair presentation.
(f) Obtain sufficient appropriate audit evidence regarding the financial information of the entities or business activities within the Group to express an opinion on the financial statements of the Group. We are responsible for the direction, supervision and performance of the group audit. We remain solely responsible for our audit opinion.
We communicate with the Directors regarding, among other matters, the planned scope and timing of the audit and significant audit findings, including any significant deficiencies in internal control that we identify during our audit.
We also provide the Directors with a statement that we have complied with relevant ethical requirements regarding independence, and to communicate with them all relationships and other matters that may reasonably be thought to bear on our independence, and where applicable, related safeguards.
From the matters communicated with the Directors, we determine those matters that were of most significance in the audit of the financial statements of the Group and of the Company for the current year and are therefore the key audit matters. We describe these matters in our auditors’ report unless law or regulation precludes public disclosure about the matter or when, in extremely rare circumstances, we determine that a matter should not be communicated in our report because the adverse consequences of doing so would reasonably be expected to outweigh the public interest benefits of such communication.
REPORT ON OTHER LEGAL AND REGULATORY REQUIREMENTS
In accordance with the requirements of the Companies Act 2016 in Malaysia, we report that the subsidiaries of which we have not acted as auditors, are disclosed in Note 40 to the financial statements.
OTHER MATTERS
This report is made solely to the members of the Company, as a body, in accordance with Section 266 of the Companies Act 2016 in Malaysia and for no other purpose. We do not assume responsibility to any other person for the content of this report.
PRICEWATERHOUSECOOPERS PLT IRVIN GEORGE LUIS MENEZESLLP0014401-LCA & AF 1146 02932/06/2018 JChartered Accountants Chartered Accountant
Kuala Lumpur22 February 2018
Independent Auditors’ Report To the Members of Axiata Group Berhad (Incorporated in Malaysia) (Company No. 242188-H)

Go
ve
rna
nce
& A
ud
ited
Fin
an
cial S
tate
me
nts 2
017
Oth
er In
form
atio
n
165
Ma
lay
sia
- S
ira
t

Governance & Audited Financial Statements 2017Other Information
166
Shareholding Statistics as at 31 March 2018
ANALYSIS OF SHAREHOLDINGS
Issued Shares:• 9,049,032,813 Ordinary shares• Voting Right : 1 vote per shareholder on a show of hands 1 vote per ordinary share on a poll
Total No. of Shareholders:• 19,574
DISTRIBUTION OF SHAREHOLDINGS(without aggregating the securities from different securities accounts belonging to the same Depositor)
Size of Shareholdings Shareholders Shares
Malaysian Foreign Malaysian Foreign
No. % No. % No. % No. %
Less than 100 2,024 10.91 22 2.17 38,357 0.001 591 0.001
100 – 1,000 4,363 23.51 68 6.69 3,121,904 0.04 42,006 0.001
1,001 – 10,000 9,951 53.62 214 21.06 34,279,652 0.42 928,980 0.11
10,001 – 100,000 1,806 9.73 258 25.39 44,772,397 0.55 10,939,383 1.28
100, 001 – 452,451,639(less than 5% of issued shares)
411 2.21 454 44.69 2,312,163,148 28.22 844,891,706 98.61
452,451,640 and above(5% and above of issued shares)
3 0.02 0 0.001 5,797,854,689 70.77 0 0.001
Total 18,558 100.00 1,016 100.00 8,192,230,147 100.00 856,802,666 100.00
Note:1 Less than 0.01%
CATEGORY OF SHAREHOLDINGS
Category of Shareholders No. ofShareholders
% ofShareholders
No. ofShares Held
% ofIssued Shares
Individuals 16,174 82.63 72,177,966 0.80
Bank/Finance Companies 95 0.48 2,524,658,571 27.90
Investments Trusts/Foundations/Charities 13 0.07 225,282 0.001
Other Types of Companies 230 1.17 36,134,004 0.40
Government Agencies/Institutions 15 0.08 3,387,853,758 37.44
Nominees 3,045 15.56 3,027,976,174 33.46
Others 2 0.01 7,058 0.001
Total 19,574 100.00 9,049,032,813 100.00
Note:1 Less than 0.01%

Governance & Audited Financial Statements 2017Other Information
167
Shareholding Statistics as at 31 March 2018
SUBSTANTIAL SHAREHOLDERS (HOLDING 5% & ABOVE) (as per Register of Substantial Shareholders)
No. Name Direct Interest Indirect/Deemed Interest Total Interest
No. of Shares Held
% of Issued Shares
No. of Shares Held
% of Issued Shares
No. of Shares Held
% of Issued Shares
1. Khazanah Nasional Berhad 3,285,606,277 36.31 85,632,340 0.95# 3,371,238,617 37.26
2. Citigroup Nominees (Tempatan) Sdn Bhd- Employees Provident Fund Board
1,513,522,052 16.73 - - 1,513,522,052 16.73
3. AmanahRaya Trustees Berhad- Skim Amanah Saham Bumiputera
1,082,516,684 11.97 - - 1,082,516,684 11.97
Note:# Includes 90,500 Ordinary shares of Axiata Group Berhad (“Axiata Shares”) being the number of Axiata Shares to be returned to Khazanah Nasional
Berhad (“Khazanah”) under the Selling Flexibility Arrangement to facilitate the sale of Axiata Shares by Axiata’s employees who have exercised their Axiata ESOS options. Khazanah is deemed to have an interest in the Axiata Shares pursuant to Section 8 of the Companies Act 2016.
DIRECTORS’ DIRECT AND INDIRECT INTERESTS IN THE COMPANY AND ITS RELATED CORPORATIONS
The Directors’ direct and/or indirect interest in the Company based on the Register of Directors’ Shareholdings are as follows:-
Interest in the Company Number of Ordinary shares
Direct Interest Indirect Interest Total Interest
No. of Shares Held
% of Issued Shares
No. of Shares Held
% of Issued Shares
No. of Shares Held
% of Issued Shares
Tan Sri Jamaludin Ibrahim - - 2,742,330 0.03 2,742,330# 0.03
Interest in the Company Number of options/RSA over Ordinary shares
Direct Interest Indirect Interest Total Interest
No. of Shares Held
% of Issued Shares
No. of SharesHeld
% of Issued Shares
No. of Shares Held
% of Issued Shares
Tan Sri Jamaludin Ibrahim - Options 3,154,800 0.03 - - 3,154,800@ 0.03
- Restricted Shares
- PBLTIP
1,219,80039,600
670,100
0.010.001
0.001
---
---
1,219,800&
39,600˚ 670,100^
0.010.001
0.001
Notes:# Axiata shares held under CIMSEC Nominees (Tempatan) Sdn Bhd ("CIMSEC Nominees") for CIMB Commerce Trustee Berhad, a trustee of discretionary trust
and the beneficiaries of which are members of the family of Tan Sri Jamaludin Ibrahim subject to the terms of such discretionary trust@ Options pursuant to Axiata Performance-Based ESOS for Eligible Employees and Executive Directors of Axiata Group& Restricted Share Grant under Axiata Share Scheme˚ Restricted Share Grant under Axiata Share Scheme – Special Grant^ Performance-Based Long Term Incentive Plan (“PBLTIP”) granted in 20171 Less than 0.01%
Save as disclosed above, none of the Directors of the Company has any interest direct or indirect in the Company and its related corporations.
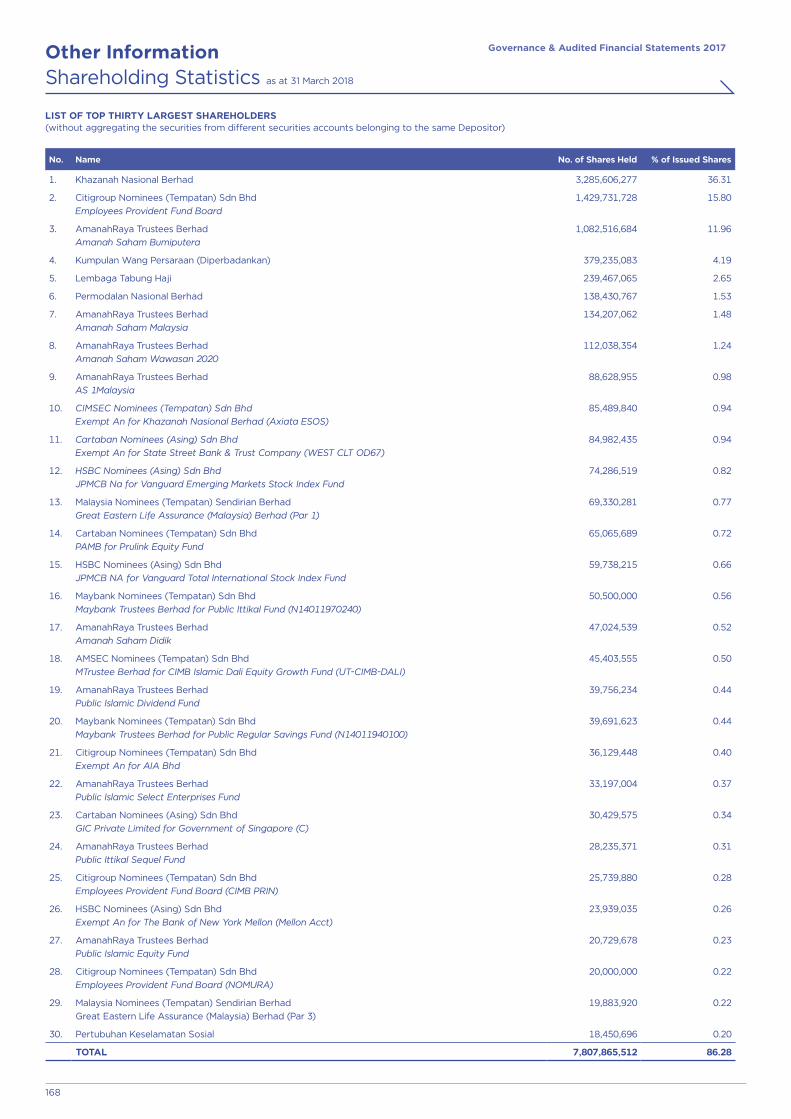
Governance & Audited Financial Statements 2017Other Information
168
LIST OF TOP THIRTY LARGEST SHAREHOLDERS (without aggregating the securities from different securities accounts belonging to the same Depositor)
No. Name No. of Shares Held % of Issued Shares
1. Khazanah Nasional Berhad 3,285,606,277 36.31
2. Citigroup Nominees (Tempatan) Sdn BhdEmployees Provident Fund Board
1,429,731,728 15.80
3. AmanahRaya Trustees BerhadAmanah Saham Bumiputera
1,082,516,684 11.96
4. Kumpulan Wang Persaraan (Diperbadankan) 379,235,083 4.19
5. Lembaga Tabung Haji 239,467,065 2.65
6. Permodalan Nasional Berhad 138,430,767 1.53
7. AmanahRaya Trustees BerhadAmanah Saham Malaysia
134,207,062 1.48
8. AmanahRaya Trustees BerhadAmanah Saham Wawasan 2020
112,038,354 1.24
9. AmanahRaya Trustees BerhadAS 1Malaysia
88,628,955 0.98
10. CIMSEC Nominees (Tempatan) Sdn BhdExempt An for Khazanah Nasional Berhad (Axiata ESOS)
85,489,840 0.94
11. Cartaban Nominees (Asing) Sdn BhdExempt An for State Street Bank & Trust Company (WEST CLT OD67)
84,982,435 0.94
12. HSBC Nominees (Asing) Sdn BhdJPMCB Na for Vanguard Emerging Markets Stock Index Fund
74,286,519 0.82
13. Malaysia Nominees (Tempatan) Sendirian BerhadGreat Eastern Life Assurance (Malaysia) Berhad (Par 1)
69,330,281 0.77
14. Cartaban Nominees (Tempatan) Sdn BhdPAMB for Prulink Equity Fund
65,065,689 0.72
15. HSBC Nominees (Asing) Sdn BhdJPMCB NA for Vanguard Total International Stock Index Fund
59,738,215 0.66
16. Maybank Nominees (Tempatan) Sdn BhdMaybank Trustees Berhad for Public Ittikal Fund (N14011970240)
50,500,000 0.56
17. AmanahRaya Trustees BerhadAmanah Saham Didik
47,024,539 0.52
18. AMSEC Nominees (Tempatan) Sdn BhdMTrustee Berhad for CIMB Islamic Dali Equity Growth Fund (UT-CIMB-DALI)
45,403,555 0.50
19. AmanahRaya Trustees BerhadPublic Islamic Dividend Fund
39,756,234 0.44
20. Maybank Nominees (Tempatan) Sdn BhdMaybank Trustees Berhad for Public Regular Savings Fund (N14011940100)
39,691,623 0.44
21. Citigroup Nominees (Tempatan) Sdn BhdExempt An for AIA Bhd
36,129,448 0.40
22. AmanahRaya Trustees BerhadPublic Islamic Select Enterprises Fund
33,197,004 0.37
23. Cartaban Nominees (Asing) Sdn BhdGIC Private Limited for Government of Singapore (C)
30,429,575 0.34
24. AmanahRaya Trustees BerhadPublic Ittikal Sequel Fund
28,235,371 0.31
25. Citigroup Nominees (Tempatan) Sdn BhdEmployees Provident Fund Board (CIMB PRIN)
25,739,880 0.28
26. HSBC Nominees (Asing) Sdn BhdExempt An for The Bank of New York Mellon (Mellon Acct)
23,939,035 0.26
27. AmanahRaya Trustees BerhadPublic Islamic Equity Fund
20,729,678 0.23
28. Citigroup Nominees (Tempatan) Sdn BhdEmployees Provident Fund Board (NOMURA)
20,000,000 0.22
29. Malaysia Nominees (Tempatan) Sendirian BerhadGreat Eastern Life Assurance (Malaysia) Berhad (Par 3)
19,883,920 0.22
30. Pertubuhan Keselamatan Sosial 18,450,696 0.20
TOTAL 7,807,865,512 86.28
Shareholding Statistics as at 31 March 2018
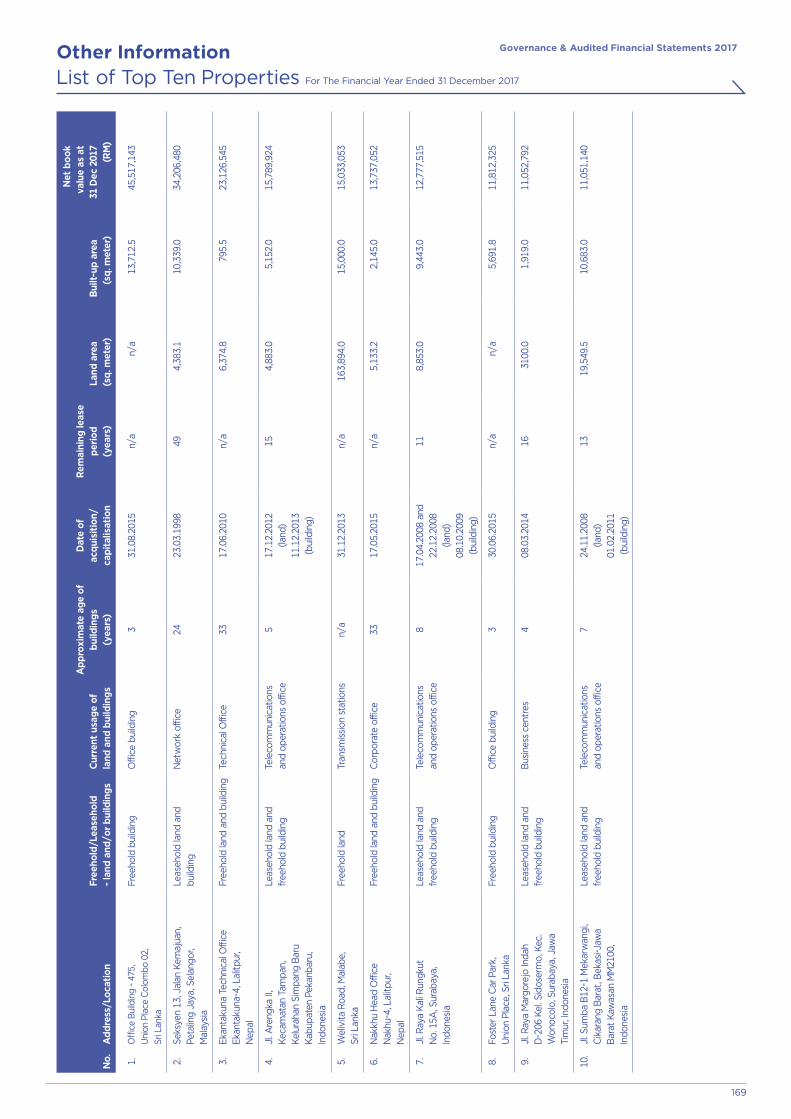
Governance & Audited Financial Statements 2017Other Information
169
No.
Add
ress
/Loc
atio
nFr
eeho
ld/L
ease
hold
-
land
and
/or
build
ings
Cur
rent
usa
ge o
f la
nd a
nd b
uild
ings
App
roxi
mat
e ag
e of
bu
ildin
gs
(yea
rs)
Dat
e of
ac
quis
itio
n/
capi
talis
atio
n
Rem
aini
ng le
ase
peri
od
(yea
rs)
Land
are
a (s
q. m
eter
)B
uilt-
up a
rea
(sq.
met
er)
Net
boo
k va
lue
as a
t 31
Dec
201
7 (R
M)
1.O
ffic
e B
uild
ing
- 47
5,
Uni
on P
lace
Col
ombo
02,
Sr
i Lan
ka
Free
hold
bui
ldin
gO
ffice
bui
ldin
g3
31.0
8.20
15n/
a n
/a
13,7
12.5
45,5
17,1
43
2.Se
ksye
n 13
, Jal
an K
emaj
uan,
Pe
talin
g Ja
ya, S
elan
gor,
Mal
aysi
a
Leas
ehol
d la
nd a
nd
build
ing
Net
wor
k off
ice
2423
.03.
1998
49 4
,383
.1
10,3
39.0
34,
206,
480
3.Ek
anta
kuna
Tec
hnic
al O
ffice
Ekan
taku
na-4
, Lal
itpur
,N
epal
Free
hold
land
and
bui
ldin
gTe
chni
cal O
ffice
3317
.06.
2010
n/a
6,37
4.8
795.
523
,126
,545
4.Jl
. Are
ngka
II,
Keca
mat
an T
ampa
n,
Kelu
raha
n Si
mpa
ng B
aru
Kabu
pate
n Pe
kanb
aru,
In
done
sia
Leas
ehol
d la
nd a
nd
free
hold
bui
ldin
gTe
leco
mm
unic
atio
ns
and
oper
atio
ns o
ffice
517
.12.
2012
(land
)11
.12.
2013
(bui
ldin
g)
154,
883.
05,
152.
015
,789
,924
5.W
eliv
ita R
oad,
Mal
abe,
Sri L
anka
Free
hold
land
Tr
ansm
issi
on s
tatio
ns
n/a
31.1
2.20
13n/
a16
3,89
4.0
15,0
00.0
15,0
33,0
53
6.N
akkh
u H
ead
Offi
ceN
akhu
-4, L
alitp
ur,
Nep
al
Free
hold
land
and
bui
ldin
gC
orpo
rate
offi
ce33
17.0
5.20
15n/
a5,
133.
22,
145.
013
,737
,052
7.Jl
. Ray
a Ka
li R
ungk
ut
No.
15A
, Sur
abay
a,
Indo
nesi
a
Leas
ehol
d la
nd a
nd
free
hold
bui
ldin
gTe
leco
mm
unic
atio
ns
and
oper
atio
ns o
ffice
817
.04.
2008
and
22
.12.
2008
(la
nd)
08.1
0.20
09
(bui
ldin
g)
118,
853.
09,
443.
012
,777
,515
8.Fo
ster
Lan
e C
ar P
ark,
U
nion
Pla
ce, S
ri La
nka
Free
hold
bui
ldin
gO
ffice
bui
ldin
g3
30.0
6.20
15n/
an/
a5,
691.
811
,812
,325
9.Jl
. Ray
a M
argo
rejo
Inda
h D
-206
Kel
. Sid
oser
mo,
Kec
. W
onoc
olo,
Sur
abay
a, J
awa
Tim
ur, I
ndon
esia
Leas
ehol
d la
nd a
nd
free
hold
bui
ldin
gB
usin
ess
cent
res
408
.03.
2014
1631
00.0
1,91
9.0
11,0
52,7
92
10.
Jl. S
umba
B12
-1 M
ekar
wan
gi,
Cik
aran
g Ba
rat,
Bek
asi-J
awa
Bara
t Ka
was
an M
M21
00,
Indo
nesi
a
Leas
ehol
d la
nd a
nd
free
hold
bui
ldin
gTe
leco
mm
unic
atio
ns
and
oper
atio
ns o
ffice
724
.11.
2008
(la
nd)
01.0
2.20
11
(bui
ldin
g)
1319
,549
.510
,683
.011
,051
,140
List of Top Ten Properties For The Financial Year Ended 31 December 2017

Governance & Audited Financial Statements 2017Other Information
170
Freehold Leasehold
Net book value
of land
Net book value of
buildings
Location No. of
Lots Area
(’000 sq ft) No. of
Lots Area
(’000 sq ft) RM’000 RM’000
1 Malaysia
(a) Federal Territory (Kuala Lumpur) - - 3 91.0 6,813.6 3,074.9
(b) Selangor 1 53.9 2 48.7 7,215.5 20,565.2
(c) Perak 2 44.5 4 63.0 1,305.4 -
(d) Pulau Pinang 7 15.3 3 64.1 1,578.1 1,366.9
(e) Kedah - - 1 15.9 145.4 360.9
(f) Johor 6 41.6 1 78.8 1,393.1 1,456.8
(g) Negeri Sembilan 2 50.1 - - 1,160.0 210.6
(h) Terengganu - - 7 871.8 385.9 9.9
(i) Kelantan 1 11.9 3 107.2 133.2 309.2
(j) Pahang 1 37.1 17 429.6 3,485.6 1,531.6
(k) Sabah - - 5 224.4 1,293.5 756.6
(l) Sarawak 2 320.1 3 58.5 641.0 677.9
2 Indonesia - - 10,633 32,228.0 324,033.6 41,088.6
3 Sri Lanka 39 1,027.4 - - 16,719.2 115,720.2
4 Bangladesh 264 2,073.6 5,907 4,755.0 14,454.9 7,910.9
5 Cambodia - - - - - 6,590.9
6 Nepal 9 479.2 - - 38,579.6 20,967.4
Total 334 4,154.7 16,589 39,036.0 419,337.6 222,598.5
Net Book Value of Land & Buildings For the financial year ended 31 December 2017

Governance & Audited Financial Statements 2017Other Information
171
2GSecond generation wireless telephone technology
3GThird generation mobile phone technologies covered by the ITU IMT- 2000 family
3RRevamp, Rise, Reinvent
4GFourth generation mobile phone technology
Advanced DataData, VAS & Broadband
AAPAdknowledge Asia Pacific Pte Ltd
ABSAxiata Business Services
Axiata DigitalAxiata Digital Services Sdn Bhd
ADIFAxiata Digital Innovation Fund
AGIAAxiata Group Internal Audit
AGMAnnual General Meeting
AICAxiata Investments (Cambodia) Limited
AI1Axiata Investments 1 (India) Limited
AI2Axiata Investments 2 (India) Limited
AILAxiata Investments (Labuan) Limited
Airtel Airtel Bangladesh Limited
AISAxiata Investments (Singapore) Limited
AMSAxiata Management Services Sdn Bhd
APIApplication Programme Interface
AOBDTAnnual Overseas Business Development Trip
ARPUAverage Monthly Revenue Per User
ASEANAssociation of Southeast Asian Nations
ATCAxiata Towers (Cambodia) Company Limited
AUSAIDAustralian Agency for International Development
AxiataAxiata Group Berhad
Axiata IndonesiaAxiata Investments (Indonesia) Sdn Bhd
Axiata Share SchemePerformance-Based ESOS and RSP
Axiata SPV1Axiata SPV1 (Labuan) Limited
Axiata SPV2Axiata SPV2 Berhad
AxisPT Axis Telekom Indonesia
AYTPAxiata Young Talent Programme
B2BBusiness to Business
B2B2CBusiness to Business to Consumer
BACBoard Audit Committee
BEEBoard Effectiveness Evaluation
BICLBangladesh Infrastructure Company Limited
BNCBoard Nomination Committee
BODBoard of Directors
BRCBoard Remuneration Committee
BTSBase Transceiver Station
Bursa SecuritiesBursa Malaysia Securities Berhad
CAMELCustomised Applications for Mobile network Enhanced Logic
CAPEXCapital Expenditure
CBNCommuniq Broadband Network (Private) Limited
CDMACode Division Multiple Access
CelcomCelcom Axiata Berhad
Celcom GroupCelcom and its subsidiaries
Celcom NetworksCelcom Networks Sdn Bhd
Celcom PlanetCelcom Planet Sdn Bhd
Celcom ResourcesCelcom Resources Berhad
CLMCustomer Lifecycle Management
CRCorporate Responsibility
CSCOCyber Security Operation Centre
CSPACyber Security Posture Assessment
CSSCCyber Security Steering Committee
CWIConnected Women Initiative
DBNDialog Broadband Networks (Private) Limited
DCRDirectors’ Circular Resolutions
DialogDialog Axiata PLC
DigitalDigital Commerce Lanka (Private) Limited
DiGiDiGi.Com Berhad
DiGi TelDiGi Telecommunications Sdn Bhd
DMSBDigital Milestone Sdn Bhd
DPRDividend Payout Ratio
DPSDividend Per Share
DRSDividend Reinvestment Scheme
DTHDirect to Home
DTTDialog Television Trading (Private) Limited
DTVDialog Television (Private) Limited
edotco Bangladesh edotco Bangladesh Co Ltd
edotco Groupedotco Group Sdn Bhd
edotco CambodiaEdotco (Cambodia) Co., Ltd
e-moneyelectronic money
EBITEarnings Before Interest and Taxes
EBITDAEarnings Before Interest, Taxes, Depreciation and Amortisation
EDGEEnhanced Data rates for GSM Evolution
EDExecutive Director
EESEconomic, Environmental and Social
EMDEEmerging Market and Developing Economy
ERMEnterprise Wide Risk Management
EscapeEscape Axiata Sdn Bhd
ESGEnvironmental, Social and Corporate Governance
ESOSEmployee Share Option Scheme
Etisalat IndonesiaEmirates Telecommunications Corporation (Etisalat) International Indonesia Limited
EVEnterprise Value
EVPExecutive Vice President
Glossary
FCFFree Cash Flow
FDIForeign Direct Investment
FSLFirstsource Solutions Limited
FY13Financial year ended 31 December 2013
FY14Financial year ended 31 December 2014
FY15Financial year ended 31 December 2015
GAAPGenerally Accepted Accounting Principles
GCEOGroup Chief Executive Officer
GCFOGroup Chief Financial Officer
GCIAGroup Chief Internal Auditor
GDPGross Domestic Product
GLCGovernment Linked Companies
GLCTGovernment Linked Company Transformation
GMVGross Merchandise Value
GPRSGeneral Packet Radio Service
GRMDGroup Risk Management Department
GSMGlobal System for Mobile Communications
GSMAThe GSM Association
GADPGroup Accelerated Development Program
GlasswoolGlasswool Holdings Limited
HelloHello Axiata Company Limited
HACLHello Axiata Company Limited
HetNetHeterogeneous Network
HSDPAHigh Speed Downlink Packet Access
HSPAHigh Speed Packet Access
IAInternal Audit
ICTInformation and Communications Technology
IDCInternet Data Centre
IdeaIdea Cellular Limited
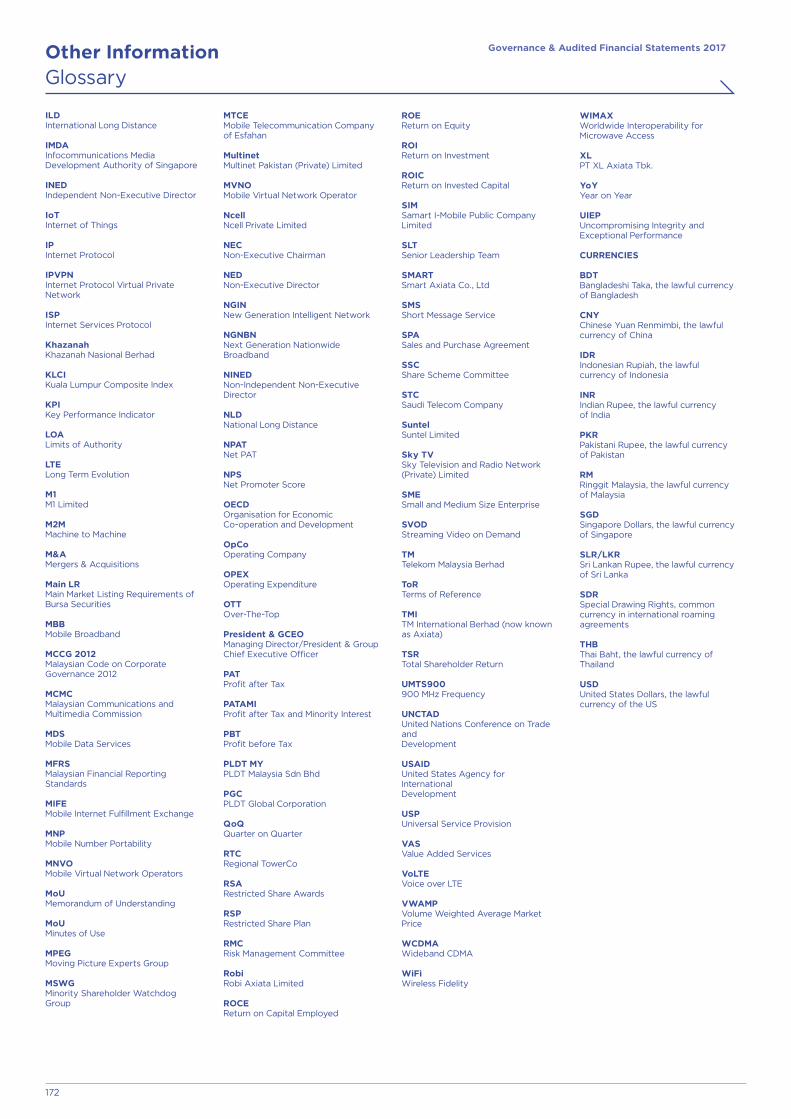
Governance & Audited Financial Statements 2017Other Information
172
Glossary
ILDInternational Long Distance
IMDAInfocommunications Media Development Authority of Singapore
INEDIndependent Non-Executive Director
IoTInternet of Things
IPInternet Protocol
IPVPNInternet Protocol Virtual Private Network
ISPInternet Services Protocol
KhazanahKhazanah Nasional Berhad
KLCIKuala Lumpur Composite Index
KPIKey Performance Indicator
LOALimits of Authority
LTELong Term Evolution
M1M1 Limited
M2MMachine to Machine
M&AMergers & Acquisitions
Main LRMain Market Listing Requirements of Bursa Securities
MBBMobile Broadband
MCCG 2012Malaysian Code on Corporate Governance 2012
MCMCMalaysian Communications and Multimedia Commission
MDSMobile Data Services
MFRSMalaysian Financial Reporting Standards
MIFEMobile Internet Fulfillment Exchange
MNPMobile Number Portability
MNVOMobile Virtual Network Operators
MoUMemorandum of Understanding
MoUMinutes of Use
MPEGMoving Picture Experts Group
MSWGMinority Shareholder Watchdog Group
MTCEMobile Telecommunication Company of Esfahan
MultinetMultinet Pakistan (Private) Limited
MVNOMobile Virtual Network Operator
NcellNcell Private Limited
NECNon-Executive Chairman
NEDNon-Executive Director
NGINNew Generation Intelligent Network
NGNBNNext Generation Nationwide Broadband
NINEDNon-Independent Non-Executive Director
NLDNational Long Distance
NPATNet PAT
NPSNet Promoter Score
OECDOrganisation for Economic Co-operation and Development
OpCoOperating Company
OPEXOperating Expenditure
OTTOver-The-Top
President & GCEOManaging Director/President & Group Chief Executive Officer
PATProfit after Tax
PATAMIProfit after Tax and Minority Interest
PBTProfit before Tax
PLDT MYPLDT Malaysia Sdn Bhd
PGCPLDT Global Corporation
QoQQuarter on Quarter
RTCRegional TowerCo
RSARestricted Share Awards
RSPRestricted Share Plan
RMCRisk Management Committee
RobiRobi Axiata Limited
ROCEReturn on Capital Employed
ROEReturn on Equity
ROIReturn on Investment
ROICReturn on Invested Capital
SIMSamart I-Mobile Public Company Limited
SLTSenior Leadership Team
SMARTSmart Axiata Co., Ltd
SMSShort Message Service
SPASales and Purchase Agreement
SSCShare Scheme Committee
STCSaudi Telecom Company
SuntelSuntel Limited
Sky TVSky Television and Radio Network (Private) Limited
SMESmall and Medium Size Enterprise
SVODStreaming Video on Demand
TMTelekom Malaysia Berhad
ToRTerms of Reference
TMITM International Berhad (now known as Axiata)
TSRTotal Shareholder Return
UMTS900900 MHz Frequency
UNCTADUnited Nations Conference on Trade and Development
USAIDUnited States Agency for International Development
USPUniversal Service Provision VASValue Added Services
VoLTEVoice over LTE VWAMPVolume Weighted Average Market Price
WCDMAWideband CDMA
WiFiWireless Fidelity
WIMAXWorldwide Interoperability for Microwave Access
XLPT XL Axiata Tbk.
YoYYear on Year
UIEPUncompromising Integrity and Exceptional Performance
CURRENCIES
BDTBangladeshi Taka, the lawful currency of Bangladesh
CNYChinese Yuan Renmimbi, the lawful currency of China
IDRIndonesian Rupiah, the lawful currency of Indonesia
INRIndian Rupee, the lawful currency of India
PKRPakistani Rupee, the lawful currency of Pakistan
RMRinggit Malaysia, the lawful currency of Malaysia
SGDSingapore Dollars, the lawful currency of Singapore
SLR/LKRSri Lankan Rupee, the lawful currency of Sri Lanka
SDRSpecial Drawing Rights, common currency in international roaming agreements
THBThai Baht, the lawful currency of Thailand
USDUnited States Dollars, the lawful currency of the US