governing cities: the challenge of providing transport services to burgeoning...
TRANSCRIPT

Governing cities: the challenge of providing transport services to burgeoning urban
populations of Dhaka
Shanawez Hossain Ph.D. Research Fellow and Head
Urban, Climate Change and Environment (UCCE) Cluster
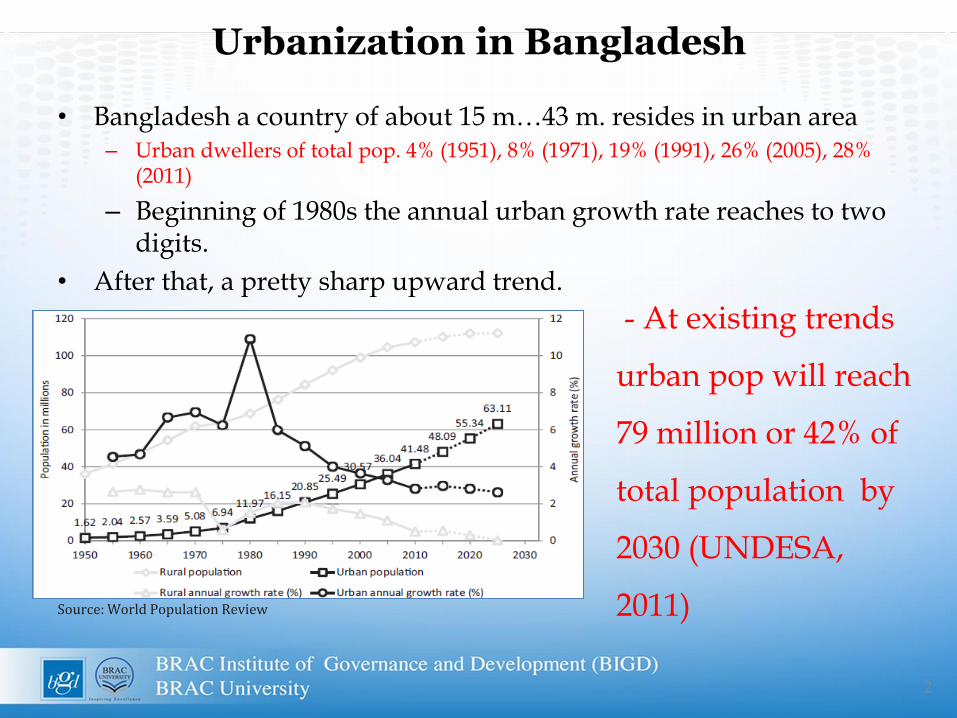
Urbanization in Bangladesh
• Bangladesh a country of about 15 m…43 m. resides in urban area
– Urban dwellers of total pop. 4% (1951), 8% (1971), 19% (1991), 26% (2005), 28% (2011)
– Beginning of 1980s the annual urban growth rate reaches to two digits.
• After that, a pretty sharp upward trend.
2
Source: World Population Review
- At existing trends
urban pop will reach
79 million or 42% of
total population by
2030 (UNDESA,
2011)

Challenges of Urbanization in Dhaka
• Dhaka being the capital lies in the center of this urbanization process.
• It alone houses 44 percent of total urban population of Bangladesh
3
This rapid growth in urbanization in Dhaka was largely unanticipated so there was not enough planning to respond to the needs of the citizen.
Source: World Population Review

4
• Urbanization in Dhaka became a subject to governance failure, among many problems causing :
• Severe infrastructure and service deficiencies
• Inadequate land administration,
• Massive slums and social breakdown and l
• Lack economic dynamism .
• Rahman (2013) described the process as a chain as below:
Urbanization and Governance

Traffic Congestion- Problem and Impact
• Congestion costs billions to world economy (Canters, 2014), annually 200bn
Euro in Europe (2% of GDP) and 101bn dollars in USA
• Vehicles on Asian roads doubles every 5 to 7 years, costs an estimated 2–5% of
GDP annually and 80% air pollution attributable to transport (ADB, 2016)
5
Traffic Congestion in Dhaka
• One of the fastest-growing most crowded but least-liveable (4th) city
• Dhaka slowing down: 21.2kph (2004); 15.1kph (2009) and 6.8kph (2015)
• Transport demand increased dramatically, cost of congestion is about $11.4bn
per year (RSTP, 2015) and losses around 7.0% of the country's GDP (BoI, 2015)
• Despite various measures traffic congestion is growing with major economic,
social and environmental impacts
6
Rational of the study
‘Without a much fuller understanding of the ‘Governance Perspective’
and seeing the 'big picture' (i.e. developing a comprehensive view of
different dynamics), piecemeal and sporadic efforts and interventions in
improving the situation (including building a flyover here and widening a
road there) may not provide desired results or live up to the expectations
of the common citizenry'
Objective
Examine the governance and institutional issues underlying traffic
congestion in Dhaka, and develop proposals to tackle the issues and
strengthen the institutions responsible for Dhaka's traffic management

Transport User Survey N=774
Key Informant Interview N=100 Secondary Sources
Transport Survey Airport to Postogula
Scorecard survey 6 Organisation
In-Depth Interviews 5 Stakeholders
Data and methods
7

0.0
5.0
10.0
15.0
20.0
25.0
30.0
35.0
Hong
Kong
Hano
i
Med
an
Cebu
Colo
mbo
Dhak
a
Delh
i
Man
ila
Kat
hman
du
Ban
galore
Road densities in selected Asian cities (km/ sq. Km)
Current Scenario of road capacity
Dhaka’s road network has not been properly planned– the network reflects short-term needs but the long-term requirements have not been sufficiently considered
8
Demand supply mis-match

Types of Vehicles 2014 2015 July, 2016
Bus and Minibus 1,499 2,324 2,136
Human Hauler 109 502 611
Microbus 3,842 4,569 3,274
Motor Cycle 32,894 46,764 28,936
Private Car and Jeep 14,554 21,531 13,972
Car registrations in Dhaka and Bangladesh
Source: BRTA, 2016
Source: BRTA, 2016
Car registration in Dhaka
9

Institutional arrangement and coordination
• Human resource and skills, budget, transparency, accountability and coordination
Human resource and skill : Shortage, underused, skill mis-match
Budget allocations and transparency : No separate budget
10
Accountability
• Internal accountability: monthly meeting mostly ineffective except DMP (rewards system, internal coordination)
• External accountability: by only a three monthly board meeting at line ministry
• As DTCA is the main authority of traffic management other organisations should be accountable to them
• Auditing process: BRTA and RAJUK are audited yearly by AG, DTCA does not have any auditing process, except for projects

Coordination among institutions
11
RAJUK has the lowest coordination with other institutions whereas DMP and DTCA are ranked as strongest
Organisations are internally challenged and externally lacking in coordination
DTCA

12
Bus route management
• Inadequate number of buses in Dhaka City
Description Number
Bus Routes 168
Enterprises of bus service 157
Ceiling for buses & minibuses 7362
Total issued permits for buses & minibuses 5407 (27% fewer than the
ceiling)
Dhaka Road Transport Owners’ Assoc. estimate
3000 (run every day)
Number of buses per lakh population Dhaka 30 Delhi 33 Kolkata 44 Bangalore 73 Hong Kong 80 London 108
13
Sidewalks management
• over 2.6 lakh hawkers in Dhaka paying average Tk.192 per day, this would give a daily unofficial revenue of Tk. 5 crore (Daily Star, 2013)
• Scaled up yearly, unofficial income from hawkers’ rents around Tk. 1825 crore per year, nearly the combined budgets (Tk. 2062 crore) of DNCC and DSCC in 2015/16
• This unofficial revenue is divided between police, linemen, and local political elements

14
Costs of traffic congestion
• About one-quarter of working hours are lost due to congestion
• Annual cost of time lost $10.6bn and vehicle operating cost is $0.8bn
(RSTP, 2015)
• Around three quarters of travelers face both physical and psychological
health impacts (noise level is 100-130 dB in some intersections)
• Cause high air pollution: vehicles contribute to 55% of SO, 70% N2O,
60% CO
• Traffic congestion incur huge: Economic, Social and Environmental Costs
to inhabitants and economy

Estimation of economic cost in a route
Annual Economic Costs: Per Month Per Year
Opportunity cost: lost travel time (Tk. Millions) 2,040 24,485
Additional vehicle operating cost: fuel lost while
idle (Tk. million) 231 2,775
Total (Tk. Million) 2,271 27,260
Total (USD Million) $28.4m $341m
15
(i) Additional time wasted in congestion
(ii) Additional vehicles costs (considered as additional fuel costs for delay)
Cost is roughly Tk.53 for each passenger trip. The majority of this cost
(90%) was due to time loss; the additional vehicle costs (mostly in
additional fuel consumption) were estimated at only 10%

Policy Measures: willingness to pay
• Impacts of congestion are not equally experienced by all groups so willingness to pay also varies
– 10,000-20,000 and 20,000-30,000 income group 38%
– Tk.50,000 and above not willing-to-pay extra money
• Pay extra money to avoid congestion?
– Higher income strata can afford their own private transport and travel in comfort and unwilling to pay
– People dependent on public transportation, inconvenience of travelling is willing to pay extra to avoid congestion
There is a strong correlation between impacts of traffic congestion and user’s willing-to-pay to avoid congestion
16

Policy Measure: Governance measures
a) Management measures to balance transport demand and supply
b) Priority to public transport
c) Strengthening transport co-ordination
d) Strengthening transport agencies
e) Converting the informal practices into formalised, legal systems
Dhaka’s severe traffic congestion can be reduced significantly at
low cost by improving governance and strengthening institutions
responsible for traffic management and enforcement
