government e-payments adoption ranking (gear) - eiugraphics.eiu.com/upload/eb/visapayments.pdf ·...
TRANSCRIPT
2011 Government E-Payments Adoption RankingA global index and benchmarking study by the Economist Intelligence Unit
Findings and methodology
SPONSORED BY
© Economist Intelligence Unit Limited 20121
2011 Government E-Payments Adoption Ranking A global index and benchmarking study
Preface
The 2011 Government E-Payments Adoption Ranking (GEAR) is an Economist Intelligence Unit (EIU) global index and benchmarking study commissioned by Visa. This is the second edition of the study, which was initially published in October 2007. This report discusses the key fi ndings of the index and the accompanying model. The research for this project was conducted during the summer and autumn of 2011 by a team of country analysts. The fi ndings, interpretation and conclusions expressed herein are those of the author(s) and do not necessarily refl ect the views of Visa.
Lucy Hurst (Associate Director) was the Research Director for this study. Hilary Ewing (Senior Analyst), Polina Minkovski (Analyst) and Nadia Hussaini (Analyst) provided research support and analysis. William Shallcross advised on the construction of the model and Mike Kenny was responsible for layout and design.
March 2012
For further information, please contact:Economist Intelligence UnitLucy Hurst, Associate Director, AmericasCustom [email protected]
Whilst every effort has been made to verify the accuracy of this information, neither the Economist Intelligence Unit Ltd nor the sponsor of this report can accept any responsibility or liability for reliance by any person on this report or any other information, opinions or conclusions set out herein. The terms “state” and “country” in this work do not imply any judgement on the part of the Economist Intelligence Unit or the funding organisation concerning the legal status of any territory.
© Economist Intelligence Unit Limited 2012
2011 Government E-Payments Adoption Ranking A global index and benchmarking study
2
Executive summary 3
Introduction and study context 5
Measuring e-payments adoption by governments 6
Key fi ndings 7
2011 GEAR rankings 9
Geographic scope 14
Category and indicator framework 14
Category results 16
Overview 16
Citizen-to-Government (C2G) 17
Government-to-Citizen (G2C) 19
Business-to-Government (B2G) 21
Government-to-Business (G2B) 22
Infrastructure 24
Social and economic context 29
Policy context 33
Moving forward with e-payments: Tracking progress from 2007 to 2011 37
Conclusion 43
Appendices
Appendix I: Country summaries 45
Appendix II: Project scope, framework and methodology 77
Appendix III: Select bibliography 102
Table of contents
© Economist Intelligence Unit Limited 20123
2011 Government E-Payments Adoption Ranking A global index and benchmarking study
In a relatively short time, advances in technology and business models based on electronic platforms have enabled many governments to increase the effi ciency and scope of their e-payment
infrastructure. Submitting a tax return online, swiping an electronic card to pay for a bus journey or even, perhaps, receiving government health and/or social benefi ts directly in a bank account are now a way of life in many countries. The ability of governments to offer these services via electronic platforms benefi ts all parties in the form of reduced costs and increased access. Indeed, an effective, inclusive e-payments system has become the core of what is being termed the “transformational approach” to government. Effective and effi cient systems are dependent on not only a strong technological infrastructure but also strong connectivity between government, citizens and businesses.
To understand the growth and evolution of government e-payments adoption, and to understand where countries stand in relation to one another, the Economist Intelligence Unit (EIU) created the Government E-Payments Adoption Ranking (GEAR) in 2007. The objective of the study is to measure the extent to which countries provide key government payment services on electronic platforms and the underlying factors that affect government e-payments adoption. The 2011 GEAR study represents an expansion of this inquiry to rank 62 countries across seven categories and 37 indicators (see Category and
indicator framework on pages 14 and 15).The top-line results of the 2011 GEAR study are summarised as follows:
● The top three performers—the US, the UK and Norway—offer a comprehensive e-payments landscape, strong policies and developed infrastructure. Led in 2011 by the US (fi rst), the UK (second) and Norway (third), the top-ranked countries demonstrate a high degree of connectivity and score well in all areas, from the availability of e-payments for businesses and citizens to the quality of infrastructure and social and economic drivers of e-payment uptake.
● The bottom three—Nigeria, Uganda and Ukraine—perform poorly in most of the categories. While each country has specifi c challenges, under-performance at this end of the spectrum serves to highlight the negative impact of inaction in e-payments adoption.
● Top performers typically have high GDP per capita. The study reveals a moderately strong correlation between high GDP per capita and overall score. This implies that an improvement in a country’s government e-payments adoption score will likely correlate with an increase in GDP per capita.
Executive summary
© Economist Intelligence Unit Limited 2012
2011 Government E-Payments Adoption Ranking A global index and benchmarking study
4
● There has been a marked improvement in technological infrastructure since 2007. Government e-payments adoption stands to benefi t from this given that connectivity—through a variety of devices—is the primary enabler of such payments. Recognising that investment in technological infrastructure can support economic growth, many developing countries are investing in Internet infrastructure, including installing technologies that allow individuals to access the Internet through mobile devices. The EIU expects to see the biggest gains in infrastructure development in emerging markets over the next few years.
● Overall, the countries in the study performed well in the following areas: ✓ Income tax payments✓ Social security contributions✓ Automotive payments✓ Value-added/sales tax payments✓ Mobile-phone subscriptions per 100 people✓ Broadband penetration ✓ Number of automated teller machines (ATMs) per 10,000 people
● Overall areas where most countries need improvement are:✓ Obtaining/paying for an ID card✓ Requesting unemployment, workers’ compensation and welfare benefi ts✓ Disbursement of loans✓ Integrating the informal economy
● By region, the strongest performers are in the Americas, Western Europe and Asia. Within the top 20 countries, the US is ranked fi rst, Canada is ranked 16th and 10 are West European countries. South Korea and Singapore lead the four top-twenty Asian countries.
● The scope and depth of government payment services is closely related to the existence of enabling policies and a developed infrastructure. As demonstrated in the previous study, we see again in 2011 that the range and quality of government payment services is closely related to a country’s technological infrastructure, enabling policies and strength of social and economic factors.
By examining some 37 indicators in seven broad areas, the study explores the e-payments landscape in each country. The results of this study will be presented in more detail in the following pages as we report on the fi ndings for each of the seven categories and explain the project methodology in more detail.
© Economist Intelligence Unit Limited 20125
2011 Government E-Payments Adoption Ranking A global index and benchmarking study
Many governments have improved the effi ciency and reach of their e-payment infrastructure in recent years, yet, a key challenge has been to maintain the momentum of change in the face of
fi scal constraints. Some onlookers feared that the roll-out of the infrastructure that supports e-payment systems, as well as government spending initiatives, would slow sharply in light of the global fi nancial crisis, tight public fi nances and continued economic uncertainty. Despite recent challenges, the benefi ts derived from improving government e-payment services have helped to spur their continued growth. Governments can point to effi ciency gains, fi nancial inclusion and increased transparency as reasons to push ahead, despite budget constraints. Austerity measures in some countries may make operational effi ciencies and cost savings even more important for governments.
As e-payments continue to take off in the public and private sectors, government commitment to the uptake of e-payment systems will continue to be crucial. The 2011 GEAR study highlights the need for a comprehensive approach by governments to improve service provision, infrastructure, social and economic context indicators and policies.
Financial inclusion—the provision of fi nancial services at affordable costs to society—also offers the opportunity to bring greater numbers of citizens and businesses into the fold—a laudable effort that pays dividends in terms of poverty reduction. It also facilitates access to government services. Yet without access to a bank account, many people have to rely on alternative payment methods such as cash and cheques to receive government benefi ts or a business loan. Governments are also adopting innovative solutions to e-payments, including mobile payments systems, which may increase access to services by the unbanked.
In many developing countries the implementation of effective and comprehensive e-payment systems is seen as essential for the transition to a market-based economy. Improvements in accounting and transaction audit procedures will help governments track taxes owed and potentially increase tax revenue. Moreover, the transparency implicit in the introduction and use of government e-payment services is a tool for combating corruption. In particular, bringing transactions onto an electronic platform makes it easier to keep better track of cashfl ows and to increase accountability. Emerging markets are looking to close the gap with developed countries in terms of providing e-payment services. The results so far have been mixed, with some countries having more success with e-payments adoption than others.
Introduction and study context

© Economist Intelligence Unit Limited 2012
2011 Government E-Payments Adoption Ranking A global index and benchmarking study
6
Measuring e-payments adoption by governmentsFor the purposes of this research, e-payment is defi ned as the exchange or transfer of funds over an electronic platform. Examples of electronic platforms include the Internet (accessed via multiple devices, including personal computers, mobile phones and tablets) and mobile-phone networks. Payments through these electronic platforms can be made by various means, including payment card, direct deposit, direct debit, electronic funds transfer and wire transfer.
Key changes for the 2011 studyThe primary objective of the study is to measure government payment services provision on electronic platforms and to assess each country’s infrastructure and enabling environment. The initial study assessed 43 countries1 across 31 indicators, 16 of which were actual transactions between citizens, businesses and their government. The 2011 GEAR study now ranks 62 countries across 37 indicators (see Geographic scope and Category and indicator framework sections on pages 14 and 15 for more information).
In the 2011 GEAR study, EIU analysts and contributors conducted online research to test 17 common transactions, including tax payments and refunds, automotive costs, social welfare benefi ts, business registration and government procurement. They also gathered information on these countries’ payment infrastructure and their social, economic and policy context. The results of this research will be discussed in greater detail in subsequent sections of the report.
Since the initial study in 2007, the generally higher levels of Internet connectivity between governments, citizens and businesses, as well as the indispensable role that electronic services now play in most of the world’s economies, have changed the status quo for government e-payments adoption. For this reason, the 2011 study introduces some changes to the indicators that form the research framework. To summarise:
● The modifi cations for 2011 were made to refl ect changes in the ways that citizens, governments and businesses access the Internet, as well as the necessity for governments to have in place the regulatory foundation to secure electronic payments.
● Some indicators were adjusted to refl ect technological advances. For example, with greater connectivity worldwide, the EIU now evaluates broadband penetration instead of Internet penetration (including dial-up). We also consider the provision of government services via mobile and contactless payments, which have experienced widespread growth in recent years. The 2011 study also looks at e-payments for public transit.
1. Hong Kong is a Special Administrative Region of the People’s Republic of China. For the purposes of this report, Hong Kong is referred to as a country.
© Economist Intelligence Unit Limited 20127
2011 Government E-Payments Adoption Ranking A global index and benchmarking study
Key fi ndingsThe 2011 GEAR study reveals a number of noteworthy fi ndings and trends:
● The top three performers offer a comprehensive e-payment landscape, strong policies and developed infrastructure. Led in 2011 by the US (fi rst), the UK (second) and Norway (third), the top-ranked countries demonstrate a high degree of connectivity and score well in all areas, from the availability of e-payments for businesses and citizens to the quality of infrastructure and social and economic drivers of e-payment uptake. Progress towards e-payments adoption requires concerted action in offering the services and having the policies and infrastructure to support them.
● The lower-ranked countries have narrowed the divide in terms of e-payments adoption. The 2011 GEAR study shows that the difference in the overall scores between the top-ranked and bottom-ranked countries (on a 0-100 scale) has narrowed from 79.6 points in 2007 to 69.6 points in 2011, demonstrating that even those countries that need to catch up the most are making progress.
● Top performers typically have high GDP per capita, but there are some notable exceptions. High GDP per capita correlates positively with a relatively strong ranking in this study. The positive correlation between GDP per capita and overall score is 0.64. However, there are some interesting exceptions: Czech Republic, South Korea and Taiwan are all high achievers, but have below average GDP per capita. The opposite is true for many Middle Eastern countries, which rank far below where their relative wealth might suggest.
● Governments vary in the diversity and range of tools used to provide e-payment services. Financial and technological infrastructure, as well as geography and demographics, infl uence the types of e-payment services offered by governments. Some countries with poor technological and fi nancial services infrastructure are adopting mobile technology to meet e-payment objectives, while those countries with more developed infrastructure are using a wider range of solutions. The 2011 GEAR study demonstrates that governments have many tools with which to improve the provision and quality of e-payment services for both citizens and businesses.
● There has been a marked global improvement in technological infrastructure since 20072. More than half of the countries in the 2011 GEAR study have developed 3G and other mobile-phone technologies, including 4G3. The number of mobile-phone subscriptions has soared since 2007, and the diffusion of broadband has grown swiftly. Government e-payments adoption stands to benefi t since connectivity—through a variety of devices—is the primary enabler of such payments. Recognising that investment in technological infrastructure can support economic growth, many developing countries are investing in Internet infrastructure, including installing technologies that allow individuals to access the Internet through mobile devices. The EIU expects to see the biggest gains in infrastructure in emerging markets in the coming years.
2. The 2007 and 2011 GEAR studies differ in a number of important ways. First, the number of countries covered by the research increased from 43 in 2007 to 62 in 2011. Second, the indicators used to evaluate countries increased, and some indicators that were retained were modifi ed. Finally, the standards used to evaluate countries in 2011 were higher than in 2007. In order to make an accurate comparison between each study, the EIU analysed only the changes witnessed in the original countries researched in the 2007 study, and for an identical set of indicators.
3. Third generation (3G) mobile technology allows users to access the Internet, video calls and mobile TV, among other applications. Fourth generation (4G) is a successor to the 3G cellular standards, enabling signifi cantly faster connectivity speeds.

© Economist Intelligence Unit Limited 2012
2011 Government E-Payments Adoption Ranking A global index and benchmarking study
8
● E-services for tax collection are progressing more rapidly than those for tax refunds. Over the past four years there has been greater adoption of electronic payments for the collection of income tax and value-added/sales tax than for tax refunds. There is evidence, though, that improvements in electronic tax refund systems will follow.
● Integrating the informal economy remains a key challenge facing governments. Integrating the informal economy is considered by many to be a side effect of e-payments adoption. The idea is that well-organised, extensive e-payment systems offer signifi cant benefi ts and incentives to operate within the formal economy. Such systems also curb the shadow economy by reducing unreported or under-reported sales and cash-based transactions. Many governments espouse commitment to integrating the informal economy, but most struggle with policy execution (assuming there is a policy in place).
● Regulations and policies surrounding e-payments are strengthening. Most countries have legislation and regulations that govern electronic transactions, although far fewer have the means to enforce them. For years the biggest constraint on e-payments adoption (beyond the lack of services offered in many countries) was a lack of trust, as citizens and businesses worried that their credit card or bank account details would be abused. This challenge is slowly being overcome by the roll-out of new and improved e-payment security systems and government enforcement mechanisms. More than one-third of the 62 countries in the 2011 GEAR study receive the highest possible score for their efforts in this area.
Comparisons between the 2007 and 2011 GEAR studies must be approached with care owing to the revised methodology4. Nevertheless, a few notable comparisons can be made:
● E-payments for services such as paying automotive fi nes, tolls and parking costs have increased in the past four years.
● It is still relatively uncommon to be able to obtain or renew a driving licence and/or an ID card online, and where systems are in place there are typically several drawbacks.
● Similar to the situation observed in 2007, few countries have systems in place to facilitate online requests for unemployment, workers’ compensation and welfare benefi ts. While many governments currently disburse benefi ts via cash or cheques, there is a noticeable movement toward automating these processes.
The overall rankings for the study and the rankings within the categories that comprise the overall score are presented in the following pages.
4. The 2007 and 2011 GEAR studies differ in a number of important ways. First, the number of countries covered by the research increased from 43 in 2007 to 62 in 2011. Second, the indicators used to evaluate countries increased, and some indicators that were retained were modifi ed. Finally, the standards used to evaluate countries in 2011 were higher than in 2007. In order to make an accurate comparison between each study, the EIU analysed only the changes witnessed in the original countries researched in the 2007 study, and for an identical set of indicators.

© Economist Intelligence Unit Limited 20129
2011 Government E-Payments Adoption Ranking A global index and benchmarking study
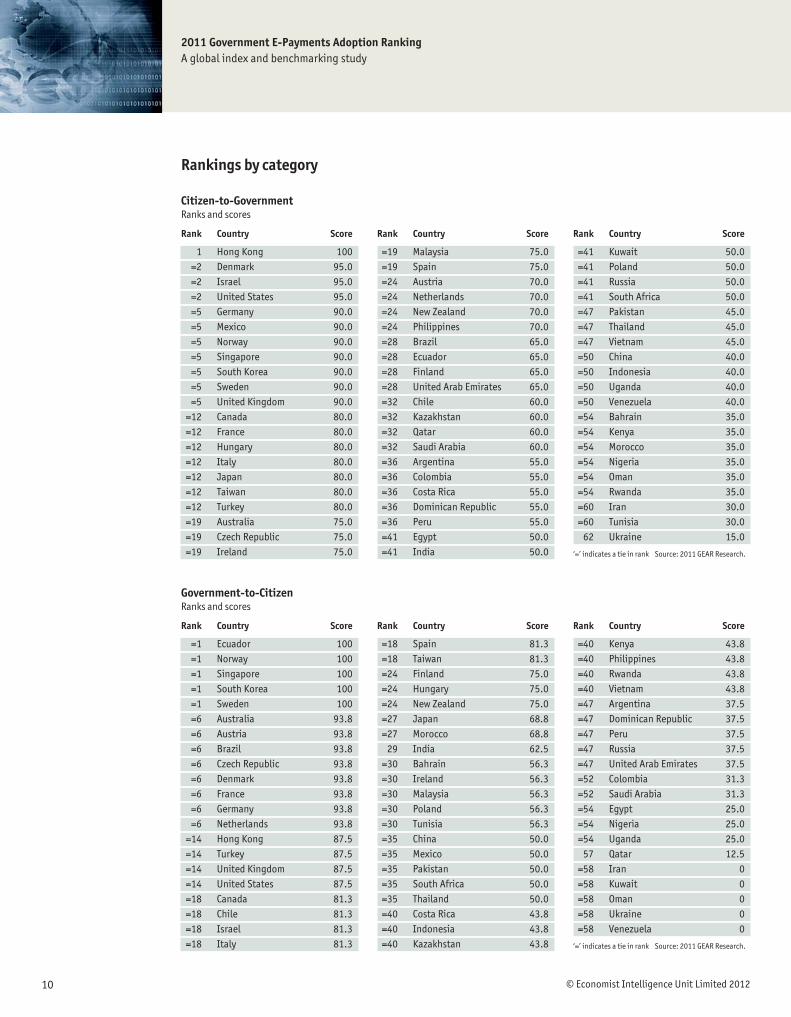
2011 GEAR rankings The overall rankings and scores for the 62 countries in the study and the results for each of the seven categories that contribute to each country’s overall rank and score are presented in the following tables. The overall score is a weighted sum of category scores (on a 0-100 scale where 100=most favourable).
1 United States 93.6 2 United Kingdom 91.6 3 Norway 91.0 4 Germany 89.3 5 South Korea 88.6 6 Australia 88.5 7 Singapore 88.3 8 Austria 88.2 9 Denmark 87.6 10 Sweden 86.4 11 France 86.0 12 Netherlands 85.0 13 Taiwan 84.4 14 Czech Republic 82.8 15 Hong Kong 82.7 16 Canada 82.5 17 Ireland 81.3 18 Israel 80.5 19 Finland 80.1 20 Hungary 79.1 21 Japan 78.5
22 Spain 78.1 23 Italy 78.0 24 Turkey 74.6 25 New Zealand 73.5 26 Chile 72.2 27 Mexico 72.1 28 Brazil 71.7 29 Malaysia 69.3 30 Philippines 64.2 31 Ecuador 62.1 32 Poland 60.6 33 Argentina 59.6 34 Peru 57.7 35 South Africa 57.4 36 India 56.1 37 China 55.3 38 Dominican Republic 54.7 39 United Arab Emirates 53.4 40 Russia 50.1 41 Colombia 48.7 42 Vietnam 48.5
43 Thailand 47.6 44 Tunisia 47.1 45 Costa Rica 47.0 46 Bahrain 46.2 =47 Indonesia 45.7 =47 Pakistan 45.7 49 Kazakhstan 44.7 50 Qatar 44.0 51 Saudi Arabia 43.1 52 Morocco 40.2 53 Venezuela 38.7 54 Oman 35.2 55 Kuwait 33.4 56 Egypt 32.2 57 Rwanda 32.0 58 Kenya 30.3 59 Iran 29.7 60 Ukraine 28.6 61 Uganda 26.8 62 Nigeria 24.0
‘=’ indicates a tie in rank Source: 2011 GEAR Research.
Rank Country Score Rank Country Score Rank Country Score
Overall country performanceRanks and scores
© Economist Intelligence Unit Limited 2012
2011 Government E-Payments Adoption Ranking A global index and benchmarking study
10
1 Hong Kong 100 =2 Denmark 95.0 =2 Israel 95.0 =2 United States 95.0 =5 Germany 90.0 =5 Mexico 90.0 =5 Norway 90.0 =5 Singapore 90.0 =5 South Korea 90.0 =5 Sweden 90.0 =5 United Kingdom 90.0 =12 Canada 80.0 =12 France 80.0 =12 Hungary 80.0 =12 Italy 80.0 =12 Japan 80.0 =12 Taiwan 80.0 =12 Turkey 80.0 =19 Australia 75.0 =19 Czech Republic 75.0 =19 Ireland 75.0
=19 Malaysia 75.0 =19 Spain 75.0 =24 Austria 70.0 =24 Netherlands 70.0 =24 New Zealand 70.0 =24 Philippines 70.0 =28 Brazil 65.0 =28 Ecuador 65.0 =28 Finland 65.0 =28 United Arab Emirates 65.0 =32 Chile 60.0 =32 Kazakhstan 60.0 =32 Qatar 60.0 =32 Saudi Arabia 60.0 =36 Argentina 55.0 =36 Colombia 55.0 =36 Costa Rica 55.0 =36 Dominican Republic 55.0 =36 Peru 55.0 =41 Egypt 50.0 =41 India 50.0
=41 Kuwait 50.0 =41 Poland 50.0 =41 Russia 50.0 =41 South Africa 50.0 =47 Pakistan 45.0 =47 Thailand 45.0 =47 Vietnam 45.0 =50 China 40.0 =50 Indonesia 40.0 =50 Uganda 40.0 =50 Venezuela 40.0 =54 Bahrain 35.0 =54 Kenya 35.0 =54 Morocco 35.0 =54 Nigeria 35.0 =54 Oman 35.0 =54 Rwanda 35.0 =60 Iran 30.0 =60 Tunisia 30.0 62 Ukraine 15.0
‘=’ indicates a tie in rank Source: 2011 GEAR Research.
Rank Country Score Rank Country Score Rank Country Score
Citizen-to-Government Ranks and scores
Rankings by category
=1 Ecuador 100 =1 Norway 100 =1 Singapore 100 =1 South Korea 100 =1 Sweden 100 =6 Australia 93.8 =6 Austria 93.8 =6 Brazil 93.8 =6 Czech Republic 93.8 =6 Denmark 93.8 =6 France 93.8 =6 Germany 93.8 =6 Netherlands 93.8 =14 Hong Kong 87.5 =14 Turkey 87.5 =14 United Kingdom 87.5 =14 United States 87.5 =18 Canada 81.3 =18 Chile 81.3 =18 Israel 81.3 =18 Italy 81.3
=18 Spain 81.3 =18 Taiwan 81.3 =24 Finland 75.0 =24 Hungary 75.0 =24 New Zealand 75.0 =27 Japan 68.8 =27 Morocco 68.8 29 India 62.5 =30 Bahrain 56.3 =30 Ireland 56.3 =30 Malaysia 56.3 =30 Poland 56.3 =30 Tunisia 56.3 =35 China 50.0 =35 Mexico 50.0 =35 Pakistan 50.0 =35 South Africa 50.0 =35 Thailand 50.0 =40 Costa Rica 43.8 =40 Indonesia 43.8 =40 Kazakhstan 43.8
=40 Kenya 43.8 =40 Philippines 43.8 =40 Rwanda 43.8 =40 Vietnam 43.8 =47 Argentina 37.5 =47 Dominican Republic 37.5 =47 Peru 37.5 =47 Russia 37.5 =47 United Arab Emirates 37.5 =52 Colombia 31.3 =52 Saudi Arabia 31.3 =54 Egypt 25.0 =54 Nigeria 25.0 =54 Uganda 25.0 57 Qatar 12.5 =58 Iran 0 =58 Kuwait 0 =58 Oman 0 =58 Ukraine 0 =58 Venezuela 0
‘=’ indicates a tie in rank Source: 2011 GEAR Research.
Rank Country Score Rank Country Score Rank Country Score
Government-to-CitizenRanks and scores

© Economist Intelligence Unit Limited 201211
2011 Government E-Payments Adoption Ranking A global index and benchmarking study
=1 Australia 100 =1 Austria 100 =1 Canada 100 =1 Dominican Republic 100 =1 Germany 100 =1 Israel 100 =1 Norway 100 =1 Peru 100 =1 Philippines 100 =1 Singapore 100 =1 Taiwan 100 =1 United Kingdom 100 =1 United States 100 =14 Chile 93.8 =14 Czech Republic 93.8 =14 Denmark 93.8 =14 Ecuador 93.8 =14 Finland 93.8 =14 France 93.8 =14 Hong Kong 93.8 =14 Hungary 93.8
=14 Italy 93.8 =14 Mexico 93.8 =14 New Zealand 93.8 =14 Turkey 93.8 =26 Argentina 87.5 =26 Ireland 87.5 =26 Netherlands 87.5 =26 South Africa 87.5 =26 Spain 87.5 =31 Sweden 81.3 =31 Venezuela 81.3 =33 Brazil 75.0 =33 Malaysia 75.0 =33 Pakistan 75.0 =33 South Korea 75.0 =33 Tunisia 75.0 =38 China 68.8 =38 Colombia 68.8 =38 Japan 68.8 =38 Rwanda 68.8 =38 Uganda 68.8
=43 India 62.5 =43 Poland 62.5 =45 Costa Rica 56.3 =45 Kazakhstan 56.3 =45 Thailand 56.3 =45 Vietnam 56.3 =49 Russia 50.0 =49 United Arab Emirates 50.0 =51 Egypt 43.8 =51 Morocco 43.8 =53 Bahrain 37.5 =53 Indonesia 37.5 =53 Kenya 37.5 =56 Iran 31.3 =56 Ukraine 31.3 =58 Kuwait 25.0 =58 Qatar 25.0 =60 Nigeria 18.8 =60 Saudi Arabia 18.8 62 Oman 0
‘=’ indicates a tie in rank Source: 2011 GEAR Research.
Rank Country Score Rank Country Score Rank Country Score
Business-to-Government Ranks and scores
=1 Ireland 100 =1 Netherlands 100 =1 Norway 100 =1 South Korea 100 =1 United States 100 =6 Chile 93.8 =6 Czech Republic 93.8 =6 Germany 93.8 =6 Taiwan 93.8 =6 Turkey 93.8 =6 United Kingdom 93.8 =12 Australia 87.5 =12 Austria 87.5 =12 Denmark 87.5 =12 Finland 87.5 =12 France 87.5 =12 Italy 87.5 =12 Japan 87.5 =12 Mexico 87.5 =12 Singapore 87.5 =21 Brazil 81.3
=21 Hungary 81.3 =21 Peru 81.3 =21 Spain 81.3 =21 Sweden 81.3 =26 Canada 75.0 =26 Israel 75.0 =26 Philippines 75.0 =26 Poland 75.0 =30 Ecuador 62.5 =30 India 62.5 =30 Malaysia 62.5 =33 China 56.3 =33 Dominican Republic 56.3 =33 Pakistan 56.3 =33 Russia 56.3 =37 Hong Kong 50.0 =37 South Africa 50.0 =39 Argentina 43.8 =39 Vietnam 43.8 =41 Kazakhstan 37.5 =41 New Zealand 37.5
=41 Thailand 37.5 =44 Costa Rica 31.3 =44 Indonesia 31.3 =44 Qatar 31.3 =47 Colombia 25.0 =47 Morocco 25.0 =47 Saudi Arabia 25.0 =47 Tunisia 25.0 =47 United Arab Emirates 25.0 =52 Iran 18.8 =52 Kenya 18.8 =52 Oman 18.8 =52 Ukraine 18.8 =56 Bahrain 12.5 =56 Egypt 12.5 =56 Kuwait 12.5 =56 Nigeria 12.5 =60 Rwanda 0 =60 Uganda 0 =60 Venezuela 0
‘=’ indicates a tie in rank Source: 2011 GEAR Research.
Rank Country Score Rank Country Score Rank Country Score
Government-to-BusinessRanks and scores

© Economist Intelligence Unit Limited 2012
2011 Government E-Payments Adoption Ranking A global index and benchmarking study
12
1 South Korea 82.7 2 Australia 81.6 3 Austria 80.4 4 United Kingdom 76.8 5 United States 76.6 6 Sweden 75.7 7 Ireland 74.1 8 Canada 73.3 9 Hong Kong 73.0 10 France 72.2 11 Norway 70.9 12 Japan 70.6 13 Taiwan 68.7 14 Singapore 68.5 15 Italy 68.0 16 United Arab Emirates 65.9 17 Finland 65.1 18 Germany 64.5 19 Hungary 64.3 20 Malaysia 63.2 21 Netherlands 62.9
=22 Czech Republic 62.8 =22 Spain 62.8 24 Israel 62.3 25 Denmark 61.8 26 New Zealand 58.3 27 Argentina 57.9 28 Turkey 49.9 29 Qatar 49.7 30 Poland 48.9 31 Mexico 47.8 32 Brazil 46.5 33 Russia 45.4 34 Oman 44.6 35 Bahrain 44.0 36 Saudi Arabia 42.6 37 Indonesia 39.6 38 China 39.3 39 Thailand 39.1 40 Vietnam 38.4 41 South Africa 37.4 42 Philippines 37.0
43 Kuwait 36.8 44 Costa Rica 35.9 45 Venezuela 35.4 46 Chile 35.0 47 India 34.6 48 Morocco 33.1 49 Peru 32.2 50 Dominican Republic 32.1 =51 Colombia 31.2 =51 Ukraine 31.2 53 Ecuador 28.2 54 Iran 26.2 55 Egypt 23.7 56 Kazakhstan 22.3 57 Tunisia 22.0 =58 Kenya 21.6 =58 Pakistan 21.6 60 Uganda 19.2 61 Nigeria 18.4 62 Rwanda 13.6
‘=’ indicates a tie in rank Source: 2011 GEAR Research.
Rank Country Score Rank Country Score Rank Country Score
InfrastructureRanks and scores
1 New Zealand 96.8 2 United States 96.0 3 United Kingdom 93.5 4 Canada 93.1 5 Taiwan 91.9 6 Germany 91.7 7 Australia 90.0 8 Denmark 89.9 9 Netherlands 89.1 10 South Korea 88.9 11 Austria 85.4 12 Sweden 85.0 13 Ireland 84.9 14 Norway 84.2 15 France 83.1 16 Hong Kong 82.7 17 Finland 82.6 18 Japan 82.0 19 Singapore 80.5 20 Spain 75.5 21 Israel 75.1
22 Malaysia 69.7 23 Czech Republic 68.9 24 Argentina 68.8 25 Italy 68.7 26 Hungary 67.6 27 Chile 66.7 28 Brazil 65.2 29 Poland 64.9 30 United Arab Emirates 64.1 31 Iran 60.3 32 Kuwait 59.6 33 Oman 56.5 34 Venezuela 55.6 35 Bahrain 54.9 36 Colombia 54.7 37 Ukraine 54.3 38 Russia 53.5 39 South Africa 52.1 40 Mexico 52.0 41 Kazakhstan 51.3 42 Turkey 50.7
=43 China 49.3 =43 Saudi Arabia 49.3 45 Costa Rica 48.6 46 Thailand 47.3 47 Qatar 46.4 48 Tunisia 46.2 49 Indonesia 44.3 50 Dominican Republic 43.5 51 Philippines 40.5 52 Peru 39.6 53 Vietnam 37.2 54 India 36.9 55 Ecuador 35.3 56 Morocco 25.9 57 Kenya 22.3 58 Rwanda 21.2 59 Uganda 18.3 60 Nigeria 16.9 61 Pakistan 14.1 62 Egypt 12.2
‘=’ indicates a tie in rank Source: 2011 GEAR Research.
Rank Country Score Rank Country Score Rank Country Score
Social and economic contextRanks and scores
© Economist Intelligence Unit Limited 201213
2011 Government E-Payments Adoption Ranking A global index and benchmarking study
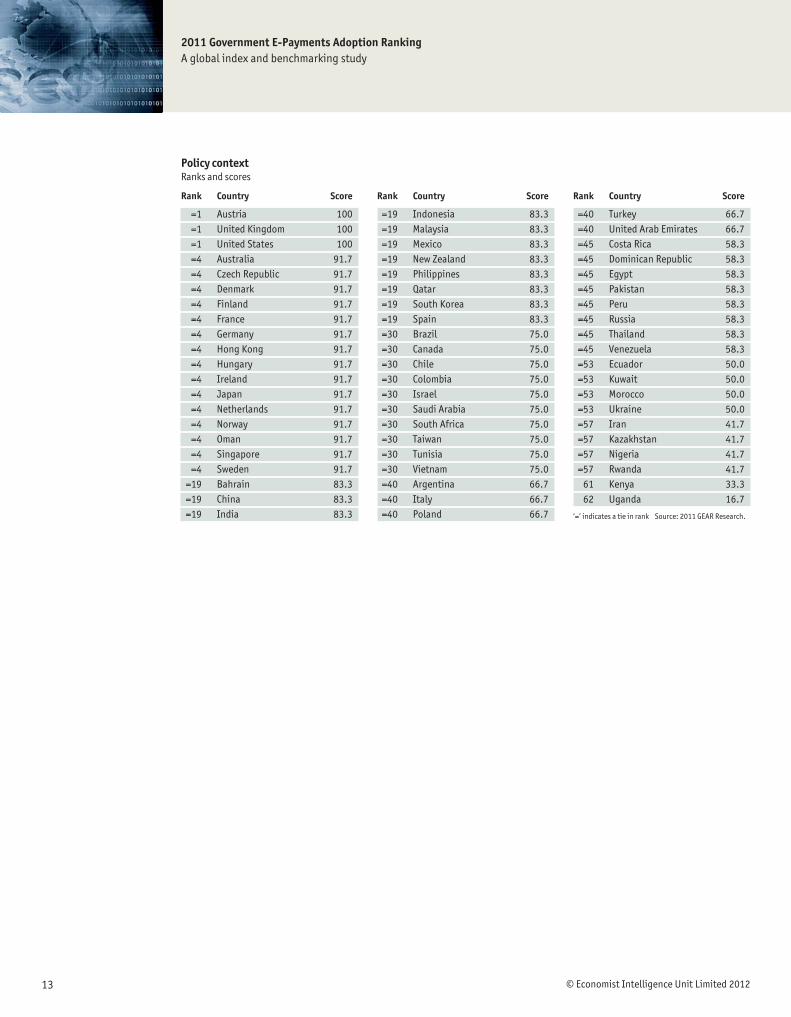
=1 Austria 100 =1 United Kingdom 100 =1 United States 100 =4 Australia 91.7 =4 Czech Republic 91.7 =4 Denmark 91.7 =4 Finland 91.7 =4 France 91.7 =4 Germany 91.7 =4 Hong Kong 91.7 =4 Hungary 91.7 =4 Ireland 91.7 =4 Japan 91.7 =4 Netherlands 91.7 =4 Norway 91.7 =4 Oman 91.7 =4 Singapore 91.7 =4 Sweden 91.7 =19 Bahrain 83.3 =19 China 83.3 =19 India 83.3
=19 Indonesia 83.3 =19 Malaysia 83.3 =19 Mexico 83.3 =19 New Zealand 83.3 =19 Philippines 83.3 =19 Qatar 83.3 =19 South Korea 83.3 =19 Spain 83.3 =30 Brazil 75.0 =30 Canada 75.0 =30 Chile 75.0 =30 Colombia 75.0 =30 Israel 75.0 =30 Saudi Arabia 75.0 =30 South Africa 75.0 =30 Taiwan 75.0 =30 Tunisia 75.0 =30 Vietnam 75.0 =40 Argentina 66.7 =40 Italy 66.7 =40 Poland 66.7
=40 Turkey 66.7 =40 United Arab Emirates 66.7 =45 Costa Rica 58.3 =45 Dominican Republic 58.3 =45 Egypt 58.3 =45 Pakistan 58.3 =45 Peru 58.3 =45 Russia 58.3 =45 Thailand 58.3 =45 Venezuela 58.3 =53 Ecuador 50.0 =53 Kuwait 50.0 =53 Morocco 50.0 =53 Ukraine 50.0 =57 Iran 41.7 =57 Kazakhstan 41.7 =57 Nigeria 41.7 =57 Rwanda 41.7 61 Kenya 33.3 62 Uganda 16.7
‘=’ indicates a tie in rank Source: 2011 GEAR Research.
Rank Country Score Rank Country Score Rank Country Score
Policy contextRanks and scores
© Economist Intelligence Unit Limited 2012
2011 Government E-Payments Adoption Ranking A global index and benchmarking study
14
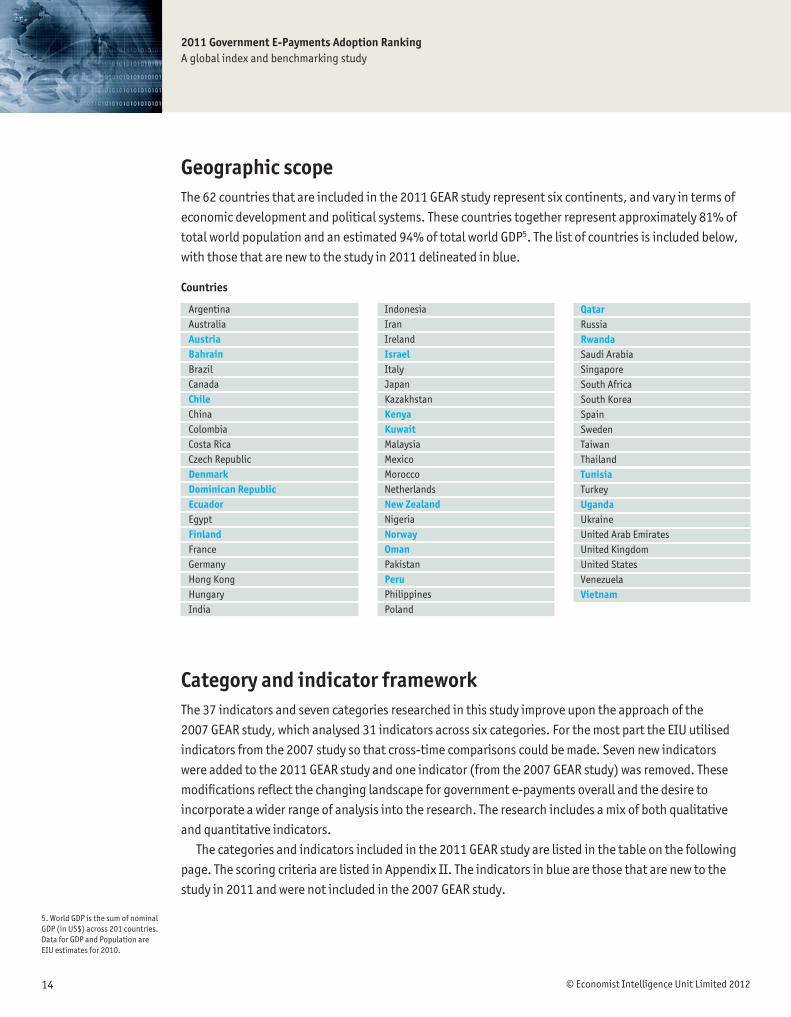
Geographic scopeThe 62 countries that are included in the 2011 GEAR study represent six continents, and vary in terms of economic development and political systems. These countries together represent approximately 81% of total world population and an estimated 94% of total world GDP5. The list of countries is included below, with those that are new to the study in 2011 delineated in blue.
ArgentinaAustraliaAustriaBahrainBrazilCanadaChileChinaColombiaCosta RicaCzech RepublicDenmarkDominican RepublicEcuadorEgyptFinlandFranceGermanyHong KongHungaryIndia
IndonesiaIranIrelandIsraelItalyJapanKazakhstanKenyaKuwaitMalaysiaMexicoMoroccoNetherlandsNew ZealandNigeriaNorwayOmanPakistanPeruPhilippinesPoland
QatarRussiaRwandaSaudi ArabiaSingaporeSouth AfricaSouth KoreaSpainSwedenTaiwanThailandTunisiaTurkeyUgandaUkraineUnited Arab EmiratesUnited KingdomUnited StatesVenezuelaVietnam
Countries
5. World GDP is the sum of nominal GDP (in US$) across 201 countries. Data for GDP and Population are EIU estimates for 2010.
Category and indicator framework The 37 indicators and seven categories researched in this study improve upon the approach of the 2007 GEAR study, which analysed 31 indicators across six categories. For the most part the EIU utilised indicators from the 2007 study so that cross-time comparisons could be made. Seven new indicators were added to the 2011 GEAR study and one indicator (from the 2007 GEAR study) was removed. These modifi cations refl ect the changing landscape for government e-payments overall and the desire to incorporate a wider range of analysis into the research. The research includes a mix of both qualitative and quantitative indicators.
The categories and indicators included in the 2011 GEAR study are listed in the table on the following page. The scoring criteria are listed in Appendix II. The indicators in blue are those that are new to the study in 2011 and were not included in the 2007 GEAR study.

© Economist Intelligence Unit Limited 201215
2011 Government E-Payments Adoption Ranking A global index and benchmarking study
1 CITIZEN-TO-GOVERNMENT (C2G) 1.1 Income tax payments 1.2 Social security contributions 1.3 Obtaining/paying for an ID card 1.4 Automotive costs: tolls and fi nes 1.5 Public transit payments
2 GOVERNMENT-TO-CITIZEN (G2C) 2.1 Income tax refunds 2.2 Social security benefi ts 2.3 Unemployment, workers’ compensation and welfare benefi ts 2.4 Government health benefi ts
3 BUSINESS-TO-GOVERNMENT (B2G) 3.1 Income tax payments 3.2 VAT/sales tax payments 3.3 Social security and other contributions 3.4 Company registration and payment of fees
4 GOVERNMENT-TO-BUSINESS (G2B) 4.1 Income tax refunds 4.2 VAT/sales tax refunds 4.3 Payments for goods and services 4.4 Disbursement of loans
5 INFRASTRUCTURE 5.1 Number of ATMs per 10,000 people 5.2 Number of POS terminals per 10,000 people 5.3 Diffusion of broadband 5.4 Public-access terminals per capita 5.5 Mobile subscriptions per 100 people 5.6 Level of development of stored value cards 5.7 Level of development of 3G and other technologies 5.8 Level of development of contactless and mobile payments
6 SOCIAL AND ECONOMIC CONTEXT 6.1 Literacy level 6.2 Educational level 6.3 Internet/technology savviness 6.4 Percentage of population using banks/other fi nancial institutions 6.5 Percentage of businesses using banks/other fi nancial institutions 6.6 Provision of fi nancial education 6.7 Proportion of businesses placing orders via the Internet 6.8 Proportion of consumer orders of goods via the Internet 6.9 Percentage of population with payment card(s)
7 POLICY CONTEXT 7.1 Government commitment to e-payment security 7.2 Government commitment to integrating the informal economy 7.3 Government commitment to the Financial Action Task Force (FATF)
Category and indicator framework
© Economist Intelligence Unit Limited 2012
2011 Government E-Payments Adoption Ranking A global index and benchmarking study
16
OverviewThe following sections provide an overview of the fi ndings by category. The seven categories should be considered as interrelated aspects of the e-payments landscape. For example, Internet/technology savviness (a social and economic context indicator) relies on the availability of various technologies, including mobile-phone subscriptions and broadband penetration (which are captured in the infrastructure category). This example suggests that a comprehensive approach should be taken in evaluating countries’ e-payments adoption results. Indeed, the countries that perform the best in the 2011 study—the US, the UK and Norway—all do well across each of the seven categories captured by the research. With this in mind, the sections that follow provide an overview of the key fi ndings in each of the categories. The analysis highlights top performers and trends, opportunities for improvement and noteworthy fi ndings and initiatives for each of the seven categories.
Category results

© Economist Intelligence Unit Limited 201217
2011 Government E-Payments Adoption Ranking A global index and benchmarking study
Citizen-to-Government (C2G)This category captures the extent to which citizens can complete various transactions electronically. These
transactions are: income tax payments, social security contributions, obtaining/paying for an ID card,
automotive costs and public transit payments.
Top performers and trendsWith a perfect score, Hong Kong is the clear winner in the C2G category, closely followed by Denmark, Israel and the US (see chart Hong Kong is top). Hong Kong receives the highest possible score across all fi ve indicators in this category, refl ecting the relatively trouble-free access to government e-payment services. Income tax is easily calculated and fi led online in Hong Kong, and employee contributions to the Mandatory Provident Fund, the state retirement fund, are also electronic. Notably, citizens can use the Octopus smartcard on all forms of public transport and, increasingly, at retail outlets as well. Moreover, homeowners can pay quarterly government rents and rates on their properties online, while citizens can pay driving licence fees, traffi c fi nes and road tolls electronically.
The collection of taxes is essential for governments to function. It therefore comes as no surprise that they are rather good at effi ciently collecting what is owed to them. The vast majority of countries (just over 90%) have a system in place for calculating and fi ling income tax electronically. Government initiatives in this area have paid off in recent years. The all countries average score for income tax payments has jumped by nearly 15 points to 84.9 since 20076. Around two-thirds of countries have systems that suffer no major drawbacks, leaving just a handful of countries with no electronic system in place. Countries have made similar gains with social security contributions. According to the research, 77% of countries have an e-payment system in place, while the average score for social security payments has increased by a solid 15 points to 73.8 since 2007.
6. The 2007 and 2011 GEAR studies differ in a number of important ways. First, the number of countries covered by the research increased from 43 in 2007 to 62 in 2011. Second, the indicators used to evaluate countries increased, and some indicators that were retained were modifi ed. Finally, the standards used to evaluate countries in 2011 were higher than in 2007. In order to make an accurate comparison between each study, the EIU analysed only the changes witnessed in the original countries researched in the 2007 study, and for an identical set of indicators.
Source: 2011 GEAR Research.
Hon
g Ko
ng
Denm
ark
Isra
el
Uni
ted
Stat
es
Germ
any
Mex
ico
Nor
way
Sing
apor
e
Sout
h Ko
rea
Swed
en
Uni
ted
King
dom
Hong Kong is topCitizen-to-Government
100.
0
95.0
95.0
95.0
90.0
90.0
90.0
90.0
90.0
90.0
90.0
Governments are
making progress in
automating income
tax payments and
social security
contributions

© Economist Intelligence Unit Limited 2012
2011 Government E-Payments Adoption Ranking A global index and benchmarking study
18
Today some 84% of countries have electronic and/or automated payment systems for vehicle-related costs such as fi nes and tolls, yet only 40% of the countries in the study receive a perfect score—there is still room for improvement. Other ways in which countries are taking action include installing electronic-toll collection facilities on roads and bridges. Vehicles equipped with a transponder are charged automatically as they pass through the toll gate, helping to alleviate traffi c congestion and streamline toll collection.
Opportunities for improvementTo most drivers a trip to the government offi ce in charge of issuing new or replacement driving licences can be cumbersome, owing to long queues, inconvenient hours, or an onerous process. On the other hand, governments cite the risk of identifi cation fraud and resulting security threats as grounds for an in-person requirement7.
Denmark, Israel and the US all fall short of a perfect score in this area: citizens in those countries are required to appear in person to obtain and pay for driving licences. In the US, most states require a visit to the local Department of Motor Vehicles to obtain and pay for a driving licence. In some US cities the introduction of electronic terminals to process some vehicle-related costs is a still a newsworthy event, suggesting that many parts of the country have some way to go in rolling out electronic services in this area. Standout countries in this area are Bahrain, Hong Kong, Mexico, Qatar and the UK, which offer convenient e-payment services for citizens.
Iran, Tunisia and Ukraine have the most ground to make up in the C2G category. Iran is beta-testing a system for government and private entities to pay employee income taxes online. Currently, employers submit forms on behalf of employees in person to the local tax authority. While Tunisia has taken steps to set up government e-payment systems, recent political turbulence there may slow the adoption of e-payment services in the short term. The government of Ukraine, meanwhile, offers little in the way of C2G e-payment platforms.
Noteworthy fi ndings Government services are increasingly at one’s fi ngertips. Given that Hong Kong is the best performer in this category, it is not surprising that it has recently rolled out a standout C2G initiative. In December 2010 MyGovHK, a personalised portal through which citizens enjoy integrated access to various government service accounts and information, was revealed to the public. The portal allows citizens to request and receive government information of their choice, and is linked directly to the users’ government records (such as existing eTAX accounts). Some payment facilities are available8. Not to be outdone, in June 2011 Singapore launched mGov@SG, a centralised mobile website that helps users access and take advantage of the m-services provided by the government. The site serves as a directory and provides mobile-phone applications for government services. A platform to enable mobile payment capabilities, for both public and commercial services, is currently in development. The utilisation of a mobile platform comes as no surprise in a country where there are more than 4.7m 3G subscribers (representing 66% of the total subscriber base) and where 3G is now the norm.
7. 2011 GEAR Research.
8. MyGovHK was not used as the primary source for the 2011 GEAR study for Hong Kong.
© Economist Intelligence Unit Limited 201219
2011 Government E-Payments Adoption Ranking A global index and benchmarking study
Government-to-Citizen (G2C)This category assesses the extent to which various government transfers to citizens can be completed
electronically. These transactions are: income tax refunds, social security benefi ts, government health
benefi ts and unemployment, workers’ compensation and welfare benefi ts.
Top performers and trendsEcuador stands out as a leader in this category, alongside more developed countries including Norway, Singapore, South Korea and Sweden (see chart The leaders receive top marks). Ecuador is one of only three countries from the Latin America and the Caribbean region to achieve above-average scores (the other two are Brazil and Chile). The country’s Internal Revenue Service and the Ecuadorian Institute of Social Security facilitate various e-payments, including electronic tax refunds, social security payments, unemployment, workers’ compensation, welfare and government health benefi ts, among other payments. Co-leaders Norway, Singapore, South Korea and Sweden also have similarly comprehensive systems for G2C payments.
Octopus in Hong Kong
Many cities now use smartcards as a payment system for public transit networks. These systems were designed initially to replace paper tickets and have now evolved to offer individuals greater opportunities for use on multiple transport modes and/or integration with fi nancial institutions, allowing for automatic top-ups using bank account or credit card details. Most of these cards remain closed-loop cards, meaning that they are accepted by one merchant, usually the transport authority. However, this is not the case in Hong Kong, where an Octopus card can do a whole lot more than just get you around town.
The Octopus card has been around since 1997, and is increasingly being used in more innovative ways. The card can be used on all forms of public transport, and its contactless card system can also be used at cinemas, sports grounds, hospitals, car parks, vending machines and most retail stores in Hong Kong, from fast-food kiosks to department stores. Recent innovations enable cardholders to pay mobile-phone bills at self-service terminals, purchase umbrellas
from vending machines at railway stations or use the card as a form of access control at more than 220 residential and commercial buildings in Hong Kong. Most children in Hong Kong have an Octopus card, which is used at more than 180 schools for access control, recording attendance and the payment of ad hoc fees. There are currently 24m Octopus cards in circulation, processing 11m transactions a day for a total value of more than HK$100m (US$12.8m)9. Around 95% of people living in Hong Kong own an Octopus card.
Hong Kong has also been quick to realise that the technology need not be in card form. Today individuals can own the Octopus technology in the form of an Octopus ornament, a watch with Octopus functionality built in, an Octopus mobile-phone cover or a two-in-one credit card that doubles as an Octopus card10.
Octopus is arguably the world’s most advanced smartcard payment system, with more than 60,000 readers used by over 4,000 service providers. The government of Hong Kong is effectively the biggest shareholder of Octopus Holdings (the company that operates Octopus cards) via its stake in the fi ve companies that own and operate the transport network. As such, Hong Kong received the highest possible score in this study’s measure of public transit e-payments.
9. “Value Chain Flexibility with RFID: A Case Study of the Octopus Card”, Lam Tak Min, International Journal of Engineering Business Management, Volume 3, Issue 1, 2011 (pp 44-49).
10. Ibid.

© Economist Intelligence Unit Limited 2012
2011 Government E-Payments Adoption Ranking A global index and benchmarking study
20
Opportunities for improvementThe number of benefi t recipients has increased in recent years as unemployment has risen in most countries. High unemployment fi gures are observed in both developed and emerging economies, while food insecurity11 has also increased in some countries. Despite the greater demand, few governments have taken advantage of electronic platforms in order to increase effi ciency in the distribution of payments such as unemployment, workers’ compensation and welfare benefi ts. Only 10 countries in this study provide citizens with electronic systems to request benefi ts easily, although there are other means of requesting and receiving such payments12. A further 17 have a system in place that has one major drawback, such as an in-person requirement for an unemployment insurance application. Governments have a long way to go in providing e-payment services in this area.
Weaknesses in G2C e-payment development are not region-specifi c. Five regions—Africa, Latin America and the Caribbean, Southern Asia, Western and Central Asia and Eastern Europe—are represented in the bottom ten countries. Interestingly, Eastern and South-Eastern Asian countries fare better, despite the fact that the vast majority of these are developing countries.
Noteworthy fi ndings While India’s performance in the G2C category is only average in the 2011 GEAR study, it should be recognised for some noteworthy initiatives. Aadhaar, meaning “foundation” in Hindi, is an identifi cation project that was launched in September 2010. The aim of the project is to provide every resident with clear proof of identity through a unique identifi cation number and associated biometric data, which are fed into a national database13. The rationale is that Aadhaar will empower the underprivileged to access services such as the formal banking and retail sectors. The system is also expected to reduce the risk of fraud in government subsidy and poverty-alleviation programmes. Existing databases (such as those for ration cards, voter registration rolls and driving licences) will eventually be integrated into the Aadhaar database, streamlining public services and government benefi ts systems.
Source: 2011 GEAR Research.
Ecua
dor
Nor
way
Sing
apor
e
Sout
h Ko
rea
Swed
en
Aust
ralia
Aust
ria
Braz
il
Czec
h Re
publ
ic
Denm
ark
Fran
ce
Germ
any
Net
herl
ands
The leaders receive top marksGovernment-to-Citizen
100.
0
100.
0
100.
0
100.
0
100.
0
93.8
93.8
93.8
93.8
93.8
93.8
93.8
93.8
Few governments have
turned to electronic
platforms to disburse
benefi ts
11. The Food and Agriculture Organisation of the UN states that food insecurity “exists when people do not have adequate physical, social or economic access to food”.
12. These 10 countries are: Bahrain, Canada, Denmark, Ecuador, Hong Kong, Norway, Singapore, South Korea, Sweden and Turkey.
13. Unique Identifi cation Authority of India: Planning Commission, Government of India (UIDAI) (< http://uidai.gov.in/index.php?option=com_content&view=article&id=153&Itemid=13>).

© Economist Intelligence Unit Limited 201221
2011 Government E-Payments Adoption Ranking A global index and benchmarking study
Business-to-Government (B2G)This category captures the extent to which businesses can complete various transactions electronically.
These transactions are: income tax payments, value-added/sales tax payments, social security and other
contributions and company registration and payment of fees.
Top performers and trendsThere are 13 top performers in the B2G category, including the three overall front-runners (US, UK and Norway), and the Dominican Republic, Peru and the Philippines. They each maintain fully developed e-payment systems for businesses to pay income and value-added/sales taxes, as well as social security and other contributions. The systems of the 13 co-leaders (see table Leading the way) also allow the automated processing of company registration and facilitate electronic payments.
The 2011 GEAR results point to a striking trend in government e-service availability for income tax and value-added tax (VAT) payment. The vast majority of countries (90%) have a system in place for calculating and fi ling business income tax electronically and 61% of countries have a system with no major drawback. This suggests that government tax departments are keen to collect what is owed from businesses through effi cient electronic systems. Meanwhile, 86% of countries have a similar system for VAT or sales tax. The electronic payment of employee social security contributions by businesses is also an area of strength globally.
=1 Australia 100 =1 Austria 100 =1 Canada 100 =1 Dominican Republic 100 =1 Germany 100 =1 Israel 100 =1 Norway 100 =1 Peru 100 =1 Philippines 100 =1 Singapore 100 =1 Taiwan 100 =1 United Kingdom 100 =1 United States 100
Source: 2011 GEAR Research.
Rank Country Score
Leading the wayBusiness-to-Government
Opportunities for improvementIn an environment of fi erce competition to attract and retain businesses, some governments may not be doing enough to make their markets business-friendly. While some countries offer electronic services for various transactions, many do not. Out of the so-called BRIC countries (Brazil, Russia, India and China), only Brazil scores above average in this category (albeit by a slim margin). India allows businesses to register and, in some cases, pay associated fees online. Brazil, China and Russia have systems in place, but each has at least one drawback. For example, in Russia businesses must register at a local unit of the

© Economist Intelligence Unit Limited 2012
2011 Government E-Payments Adoption Ranking A global index and benchmarking study
22
Federal Tax Service and the State Pension Fund. In Brazil initiatives vary signifi cantly by state. The countries of the Gulf Co-operation Council (GCC)—Bahrain, Kuwait, Oman, Qatar, Saudi Arabia and
the United Arab Emirates (UAE)—perform relatively poorly in this category. Most Middle Eastern countries do not levy income taxes. The EIU used the zakat, an Islamic religious tax, as a proxy for evaluating e-payment capabilities for B2G income tax payment in these countries14. Of the six GCC countries, Kuwait, Qatar and the UAE have facilities for businesses to pay zakat online15. For the most part, the low category scores for Middle Eastern countries in B2G mirror their low scores in the G2B category, pointing to a general lack of investment in e-payment systems to facilitate business operations. Only Bahrain and the UAE have some online system in place for company registration and the payment of fees. With the exception of Saudi Arabia, none of these countries has electronic facilities for social security contributions, although the UAE has an e-service facility in development.
Noteworthy fi ndings Norway’s Altinn (“all in”) electronic platform is a standout initiative in the B2G area16. Altinn was introduced in 2004 and is a so-called point of single contact for small- and medium-sized businesses. The Altinn platform allows businesses to submit forms, including those for taxes and licences, to the relevant government ministries from one website. In addition, by providing businesses with the necessary forms, information and instructions, the platform helps to facilitate electronic payments to various government agencies and ministries. Altinn is leading the way as it continuously improves the effi ciency of government e-service administration. The results have been so impressive that the system was introduced to Chinese tax authorities at a World Expo 2010 exhibition in Norway. Australia is another standout country in the B2G category. While a portal similar to that of Altinn is not available in Australia, the relevant government agencies and ministries allow businesses to make numerous e-payments electronically. This earns Australia top marks in this category.
Government-to-Business (G2B)This category captures the extent to which various government transfers to businesses can be completed
electronically. These transactions are: refunds for income and value-added/sales taxes, payments for goods
and services and the disbursement of loans.
Top performers and trendsThe old adage “it is better to give than to receive” does not extend to G2B payments. Indeed, the all countries average score for G2B is nearly 15 points lower than for B2G (see chart We’re open for business to see how the top performers in the B2G category fared in the G2B category). Why is this the case? Part of the answer lies in the indicators: the categories share two out of four indicators. However, for those two sets of indicators—income tax payments/refunds and VAT/sales tax payments/refunds—the results are telling. While 38 governments allow fi rms to make e-payments for income taxes, just 31 offer a similar system for refunds. The fi gures are similar for VAT/sales tax.
The other half of the equation is the countries’ performance in payments for goods and services and the
14. In many Middle Eastern countries, zakat is applicable to both individuals and businesses. In some countries it is obligatory, whereas in others it is voluntary.
15. A notable exception among GCC countries is Oman, which applies a corporate income tax. Interestingly, Oman’s government e-portal states that corporate taxes can only be paid with cash or cheque. Oman does not apply a personal income tax.
16. Altinn (<https://www.altinn.no/en/>).
Some governments can
do more to make their
markets business-
friendly

© Economist Intelligence Unit Limited 201223
2011 Government E-Payments Adoption Ranking A global index and benchmarking study
disbursement of loans. Many countries have online procurement systems, although they vary to an extent in terms of their capabilities. A fi ne example is Norway, where the relevant government entities handle e-payments according to national procurement procedures. Businesses simply have to register with Doffi n, the national database for public procurement. Another top performer in this area is Australia. Payments are handled electronically in AusTender, which allows for e-payment distribution and settlement. AusTender also provides a centralised publication of Australian government business opportunities, annual procurement plans, multi-use lists and contracts awarded.
Opportunities for improvementGovernments are not doing as well in terms of disbursing loans electronically to businesses, although there are a few notable exceptions. Ten countries, including overall top-performers Norway, South Korea and the US, receive top marks in this area17. The US Small Business Administration has a model electronic loan disbursement programme, while South Korea has a more decentralised system in place, with numerous government agencies providing loans to businesses via direct deposit. Norway collects another star in this category, with its Innovasjon Norge providing a simple platform for businesses to apply for and receive loans. However, 21 countries have no system in place for businesses to apply for and receive loans electronically. The other half of the countries in question fall somewhere in-between, suggesting there is much room for improvement in this area.
Noteworthy fi ndings Interestingly, all of the EU member states covered in this research score well above average in this category. In particular, Ireland, the Netherlands and Norway receive the highest possible score. These EU member states have advanced systems in place for G2B e-payments, including tax refunds and the disbursement of loans. For large fi rms and all public bodies in Ireland, e-fi ling and e-payment of taxes is mandatory and refunds are made by electronic transfer—a sign that the government takes seriously its commitment to streamlining these processes. Moreover, Irish contracting authorities are required to use etenders.gov.ie and to publish electronically procurement opportunities of more than €10,000 (around US$14,490). Dutch and Norwegian fi rms benefi t from very similar systems in their domestic markets, almost undoubtedly allowing fi rms to make effi ciency gains.
Source: 2011 GEAR Research.
Aust
ralia
Aust
ria
Cana
da
Dom
inic
an R
epub
lic
Germ
any
Isra
el
Nor
way
Peru
Phili
ppin
es
Sing
apor
e
Taiw
an
Uni
ted
King
dom
Uni
ted
Stat
es
We’re open for businessGovernment-to-Business Business-to-Government score Government-to-Business score
56.3
100.
0
100.
0
100.
0
100.
010
0.0
100.
0
100.
0
100.
0
100.
0
100.
0
100.
010
0.0
75.0
100.
0
87.5
100.
0
87.5
100.
0
93.8
75.0
93.8
93.8
87.5
75.081
.3
EU member states
set an example with
their G2B e-payments
initiatives
17. The other countries are: Chile, Czech Republic, Hong Kong, Ireland, Israel, the Netherlands and Turkey.
© Economist Intelligence Unit Limited 2012
2011 Government E-Payments Adoption Ranking A global index and benchmarking study
24
InfrastructureThis category examines the existing technological infrastructure that supports the adoption of e-payments.
It comprises indicators that assess the number of ATMs and point-of-sale (POS) terminals per 10,000 people,
the diffusion of broadband, public-access terminals per capita, mobile subscriptions per 100 people, the level
of development of stored value cards, the level of development of 3G and other technologies, and the level of
development of contactless and mobile payments.
Top performers and trendsSince 2007 there has been a marked global improvement in technological infrastructure. More than half of the countries included in this research receive high marks for the level of development of 3G and other technologies. Interestingly, despite the signifi cant strides made in recent years in the development of 3G and even 4G services, the slow-and-steady 2G service based on the Global System for Mobile Communications (GSM) quietly remains the most widely used mobile-phone technology in the world. Meanwhile, the diffusion of broadband, an area of relative weakness in the 2007 research, has witnessed signifi cant gains. Moreover, mobile subscriptions per 100 people have skyrocketed since 2007.
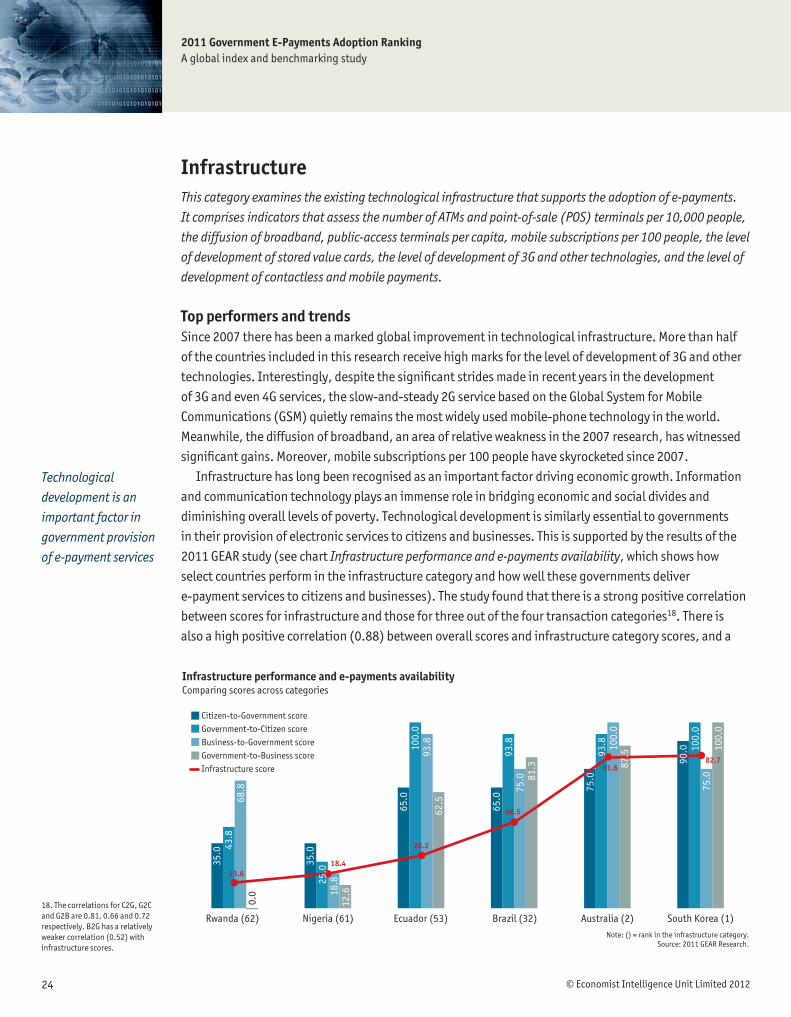
Infrastructure has long been recognised as an important factor driving economic growth. Information and communication technology plays an immense role in bridging economic and social divides and diminishing overall levels of poverty. Technological development is similarly essential to governments in their provision of electronic services to citizens and businesses. This is supported by the results of the 2011 GEAR study (see chart Infrastructure performance and e-payments availability, which shows how select countries perform in the infrastructure category and how well these governments deliver e-payment services to citizens and businesses). The study found that there is a strong positive correlation between scores for infrastructure and those for three out of the four transaction categories18. There is also a high positive correlation (0.88) between overall scores and infrastructure category scores, and a
13.6
28.2
18.4
46.5
81.682.7
Note: () = rank in the infrastructure category.Source: 2011 GEAR Research.
Rwanda (62) Nigeria (61) Ecuador (53) Brazil (32) Australia (2) South Korea (1)
Infrastructure performance and e-payments availabilityComparing scores across categories
Citizen-to-Government scoreGovernment-to-Citizen scoreBusiness-to-Government scoreGovernment-to-Business scoreInfrastructure score
0.0
43.8
35.0
100.
093
.8
75.0
93.8
65.0
81.3
75.0
93.8
87.5
100.
0
90.0 10
0.0
100.
075
.0
68.8
35.0
25.0
18.8
12.6
62.5
65.0
18. The correlations for C2G, G2C and G2B are 0.81, 0.66 and 0.72 respectively. B2G has a relatively weaker correlation (0.52) with infrastructure scores.
Technological
development is an
important factor in
government provision
of e-payment services

© Economist Intelligence Unit Limited 201225
2011 Government E-Payments Adoption Ranking A global index and benchmarking study
relatively high positive correlation between the overall scores and the majority of individual indicators that comprise the infrastructure category.
The top fi ve performers in this category—South Korea, Australia, Austria, the UK and the US—tend to also score well in the transaction categories. This suggests that these governments are both providing e-payment services and that they have the infrastructure in place that allows citizens and businesses to access e-payment services. But there are other countries—for example, Brazil and Ecuador—that receive below average scores in the infrastructure category, but generally perform above average in the transaction categories. This implies that some countries have taken steps to make e-payments available, but that access to these services may be lacking because of the current state of the country’s technological infrastructure.
Note: ( ) = rank in the infrastructure category. ‘=’ indicates a tie in rank.Source: 2011 GEAR Research.
South Korea (1)
Australia (2)
Austria (3)
United Kingdom (4)
United States (5)
Norway (11)
Germany (18)
Hungary (19)
Malaysia (20)
Denmark (25)
Qatar (29)
All countries average
Brazil (32)
South Africa (41)
Kuwait (43)
Ecuador (53)
Kenya (=58)
Pakistan (=58)
Uganda (60)
Nigeria (61)
Rwanda (62)
Wealth and technologyInfrastructure performance and GDP per capita (US $) Infrastructure score
GDP per capitaAll countries average
0 20 40 60 80 100
$20,490
$55,590
$44,980
$36,139
$46,820
$83,974
$40,240
$13,024
$8,418
$55,800
$74,760
$21,552
$10,945
$7,420
$34,730
$4,050
$763
$957
$504
$1,290
$516
$00

© Economist Intelligence Unit Limited 2012
2011 Government E-Payments Adoption Ranking A global index and benchmarking study
26
Countries with high scores in this category typically have relatively high GDP per capita. However, some countries deviate from this trend (see chart Wealth and technology, which shows select countries’ GDP per capita and their performance in the infrastructure category). For example, Kuwait has a GDP per capita of US$34,730 (compared with an all countries average of US$21,552), but scores below average in the infrastructure category. Its weak score in part refl ects the fact that the country has just 1.5 broadband connections per 100 people, which is exceedingly low for a country with such high GDP per capita. In contrast, Hungary and Malaysia have relatively low GDP per capita (US$13,024 and US$8,418 respectively), but score better than average in the infrastructure category. The level of development of 3G and other technologies, the availability of public-access terminals, and the level of development of contactless and mobile payments all contribute to the high scores achieved by these countries in the infrastructure category. These countries are exceptions to the rule, and make it evident that wealth does not always translate into the solid development of technological infrastructure.
Opportunities for improvementAll of the countries in this research have room to improve in terms of infrastructure development. Governments (and, in many cases, the private sector) must continually invest in new infrastructure as technologies emerge and evolve. In addition, more can be done in terms of the geographical deployment of technological infrastructure. Disparities in the presence and quality of infrastructure available in rural and urban areas are common. Oftentimes, the availability of technology (eg public-access terminals or 3G technologies) is restricted to major cities. For example, although public-access terminals are generally available in urban areas throughout South Africa, deployment in rural areas is not yet widespread. This suggests that there are signifi cant gains to be made to ensure that technological infrastructure is available to all citizens and businesses.
However, having infrastructure in place is just one piece of the puzzle. Citizens and businesses must be keen to take advantage of e-payment services. For example, while contactless and mobile payments are on the rise globally, some countries are encountering slow uptake, even when the infrastructure is already in place. A number of mobile and contactless payment initiatives have been introduced in Germany, but the population has yet to move away from more traditional payment methods. Societal factors will continue to affect how and where technologies are adopted.

© Economist Intelligence Unit Limited 201227
2011 Government E-Payments Adoption Ranking A global index and benchmarking study
Mobile technologies: An opportunity for governments to close the gap
There is a noticeable relationship between economic development (as measured by GDP per capita) and the diffusion of broadband. Governments in less-developed countries are overcoming a lack of Internet infrastructure and taking advantage of the infrastructure already in place—namely, mobile-phone networks. Increasingly, mobile phones are viewed as computers, with capabilities ranging from Internet access to word processing.
Certainly, mobile phones are more common than bank accounts in some less-developed markets: Kenya, Nigeria, Rwanda and Uganda had more mobile-phone subscriptions than bank accounts per 100 people, according to 2009 fi gures from the International Telecommunication Union, a UN agency responsible for information and communication technologies. When citizens do not have bank accounts or access to computers, providing e-payment services is diffi cult. Some governments, lacking the fi nancial and technological infrastructure present in many developed countries, have started to take advantage
of the technological infrastructure available to them. In particular, governments have begun to use mobile-phone technology to transfer payments and provide services to citizens. In India’s Andhra Pradesh state, one such initiative allows the disbursement of welfare payments and pensions directly into users’ bank accounts via a special handset, which is a combination of a mobile phone, a fi ngerprint reader and a small printer19. Another well-known mobile payment initiative is M-PESA. This service originated in Kenya in 2007 and allows users to transfer cash via text messages20. It has more than 14m users and has now been expanded to facilitate the payment of salaries and certain bills. Although the government of Kenya has not yet taken full advantage of the capabilities of this initiative, it has collaborated with the UN’s World Food Programme and Oxfam, a UK-based non-profi t group working towards poverty alleviation, to introduce a pilot cash-transfer programme in a number of Kenyan communities.
Both initiatives point to a signifi cant evolution in the use of mobile technologies to provide services. Governments with low Internet penetration can turn to mobile technologies to offer basic transactional services to businesses and citizens.
Noteworthy fi ndings
19. The Economist, “There’s an app for that” (<http://www.economist.com/blogs/baobab/2011/02/more_mobile_phone_services>).
20. Safaricom (<http://www.safaricom.co.ke>).
© Economist Intelligence Unit Limited 2012
2011 Government E-Payments Adoption Ranking A global index and benchmarking study
28
The next big thing: Contactless and mobile payments
The uptake of contactless payments is expected to increase in the coming years. Contactless payment systems are credit cards and debit cards, key fobs, smartcards or other devices that use radio-frequency identifi cation for making secure payments. Technological innovation in contactless payments has moved at a quick pace, and the uptake of mobile-phone-based contactless technologies may even outstrip that of traditional card-based contactless payment systems. While some countries, such as the US and the UK, now have a wide deployment of both card-based and mobile-based contactless payment systems, many of the countries in this research are still in the nascent stages of introducing contactless payment systems.
Mobile contactless payment enables users to engage in fi nancial transactions with greater effi ciency, combining the convenience of undertaking transactions via a handheld device with the effi ciency and security of contactless card payment. With the deployment of mobile contactless payment technology already well under way, those countries that have yet to see signifi cant uptake in contactless payment (which includes the majority of countries in this study) may see usage increase quickly. In these countries, users may leap-frog over card-based technologies and instead utilise mobile-based technologies. There are several reasons for this: in many countries there are more mobile phones than bank accounts, making mobile payments more accessible. According to ARC chart, a UK-based independent research and consulting fi rm, there are around 400m contactless
cards currently in circulation, accounting for just 6% of all cards. Meanwhile, there are more than 5bn mobile-phone users in the world, and this number is expected to continue to rise in coming years. Accessibility and convenience increase the likelihood of adoption.
Among the countries researched for the 2011 GEAR study, Japan stands out as one of the leaders in adopting contactless technology, with a wide availability of both tap-and-go phones and digital wallet (also known as e-wallet) smartcards, which allow users to make electronic transactions. Edy, one of the most popular contactless cards in Japan, is an integrated circuit card (otherwise known as a smartcard), and is commonly used as a means of storing money21. In addition to offering e-money technology via e-wallets, Japan is also a leader in m-payments, with around 47m Japanese (or 37% of the population) undertaking tap-and-go phone transactions.
Mobile contactless payments are under development in both developed and developing markets. New Zealand is among those countries experimenting with near-fi eld communication (a short range, high-frequency wireless communication technology that enables the exchange of data). One of New Zealand’s leading banking and fi nancial services groups is testing a mobile contactless payment system. Likewise, in Poland, six of the country’s major banks have pilot programmes for contactless mobile payment technologies. Meanwhile, a recent study by Frost & Sullivan, a US-based business research and consulting fi rm, found that owing to the success of already implemented smartcard programmes in the BRIC countries, these countries appear “the most receptive and ready to adopt smartcards in various verticals”, and have “the critical mass needed to sustain these deployments”22.
21. Sony Japan (<http://www.sony.co.jp/Products/felica/consumer/index.html?j-short=pcrw>).
22. Frost & Sullivan, “Second Growth Spurt in Smart Cards Market Will Come from the BRIC Region” (<http://www.frost.com/prod/servlet/press-release.pag?docid=224531429>).
© Economist Intelligence Unit Limited 201229
2011 Government E-Payments Adoption Ranking A global index and benchmarking study
Social and economic contextThis category examines the social and economic environment that supports the adoption of e-payments.
It comprises indicators that assess literacy and educational levels, Internet/technology savviness, the
percentage of the population and businesses using banks or other fi nancial institutions, the provision of
fi nancial education, the proportion of businesses placing orders via the Internet, the proportion of consumer
orders of goods via the Internet, and the percentage of the population with payment card(s).
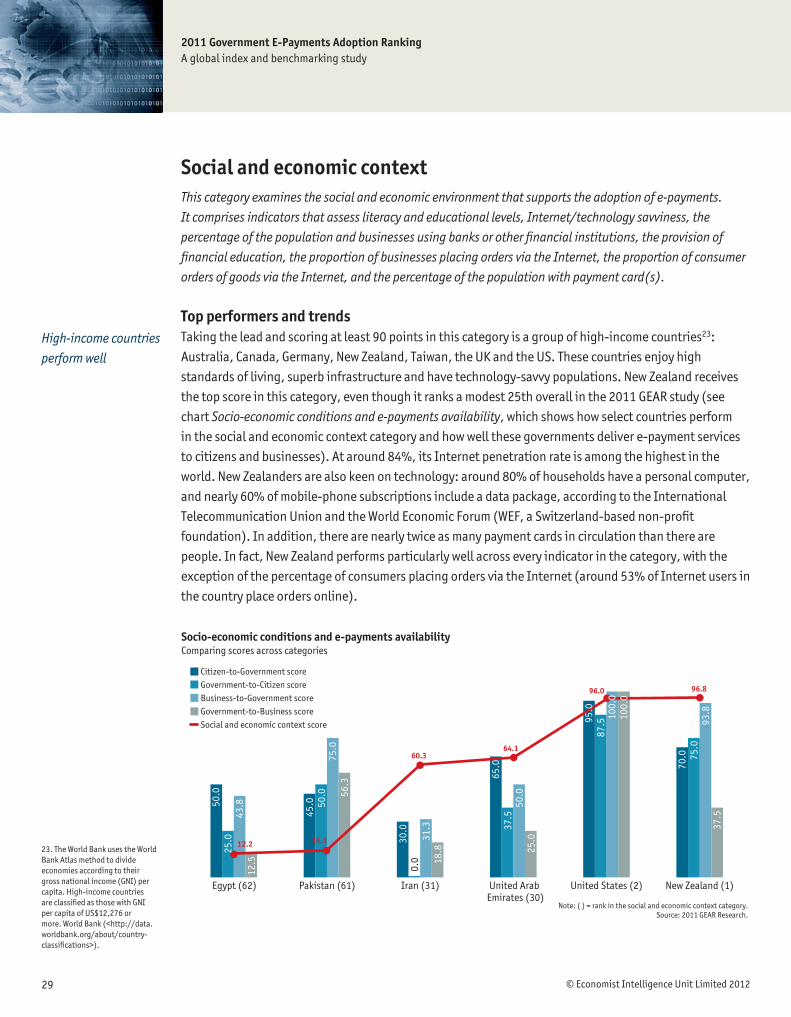
Top performers and trendsTaking the lead and scoring at least 90 points in this category is a group of high-income countries23: Australia, Canada, Germany, New Zealand, Taiwan, the UK and the US. These countries enjoy high standards of living, superb infrastructure and have technology-savvy populations. New Zealand receives the top score in this category, even though it ranks a modest 25th overall in the 2011 GEAR study (see chart Socio-economic conditions and e-payments availability, which shows how select countries perform in the social and economic context category and how well these governments deliver e-payment services to citizens and businesses). At around 84%, its Internet penetration rate is among the highest in the world. New Zealanders are also keen on technology: around 80% of households have a personal computer, and nearly 60% of mobile-phone subscriptions include a data package, according to the International Telecommunication Union and the World Economic Forum (WEF, a Switzerland-based non-profi t foundation). In addition, there are nearly twice as many payment cards in circulation than there are people. In fact, New Zealand performs particularly well across every indicator in the category, with the exception of the percentage of consumers placing orders via the Internet (around 53% of Internet users in the country place orders online).
12.2 14.1
60.364.1
96.0 96.8
Note: ( ) = rank in the social and economic context category.Source: 2011 GEAR Research.
Egypt (62) Pakistan (61) Iran (31) United Arab United States (2) New Zealand (1) Emirates (30)
Socio-economic conditions and e-payments availabilityComparing scores across categories
Citizen-to-Government scoreGovernment-to-Citizen scoreBusiness-to-Government scoreGovernment-to-Business scoreSocial and economic context score
25.0
50.0
50.0 56
.3
70.0 75
.0
37.5
93.8
43.8
12.5
75.0
45.0
0.0 18
.831
.3
30.0
87.5
100.
010
0.0
95.0
37.5
25.0
50.0
65.0
High-income countries
perform well
23. The World Bank uses the World Bank Atlas method to divide economies according to their gross national income (GNI) per capita. High-income countries are classifi ed as those with GNI per capita of US$12,276 or more. World Bank (<http://data.worldbank.org/about/country-classifi cations>).

© Economist Intelligence Unit Limited 2012
2011 Government E-Payments Adoption Ranking A global index and benchmarking study
30
Norway, which has the highest GDP per capita of the 62 countries in this study, ranks 14th in this category (see chart Wealth and socio-economic conditions, which shows select countries’ GDP per capita and their performance in the social and economic context category). It is not that Norway’s social and economic environment is poor, but rather that the top-ranked countries set the bar extremely high. Norway performs relatively poorly against its rich-country peers in the provision of fi nancial education, the proportion of consumer orders over the Internet and the percentage of population using banks or other fi nancial institutions.
The 62 countries in this study represent almost 81% of the total world population—or around 5.5bn people. However, the countries that receive an above-average score in this category account for just 19% of the world’s population (while accounting for nearly 69% of total world GDP). The fi ndings are similar in the infrastructure category—namely that higher-income countries (those that account for a large share of global GDP) do better than their lower-income counterparts. By the same token, countries performing below average in these categories cumulatively account for a larger percentage of the world population. This implies not only that there is great scope for catch-up in terms of improving the social and economic context and infrastructure, but that doing so will have an impact on a large number of people.
Note: ( ) = rank in the social and economic context category.Source: 2011 GEAR Research.
New Zealand (1)
United States (2)
United Kingdom (3)
Canada (4)
Taiwan (5)
Germany (6)
Australia (7)
Denmark (8)
Norway (14)
Chile (27)
All countries average
South Africa (39)
Mexico (40)
Vietnam (53)
India (54)
Ecuador (55)
Morocco (56)
Kenya (57)
Rwanda (58)
Uganda (59)
Nigeria (60)
Pakistan (61)
Egypt (62)
Wealth and socio-economic conditionsSocial and economic context performance and GDP per capita (US $) Social and economic context score
GDP per capitaAll countries average
0 20 40 60 80 100
$32,070
$46,820
$36,139
$46,334
$18,550
$40,240
$55,590
$55,800
$83,974
$11,900
$21,552
$7,420
$9,196
$1,180
$1,460
$4,050
$2,804
$763
$516
$504
$1,290
$957
$2,539
$00

© Economist Intelligence Unit Limited 201231
2011 Government E-Payments Adoption Ranking A global index and benchmarking study
Opportunities for improvementJust as with technology infrastructure development, certain social and economic metrics correlate strongly with overall government e-payments adoption. Notably, educational levels, Internet/technology savviness and the proportion of consumer orders placed over the Internet all have a positive correlation above 0.70 with the overall score. Africa has the most room for improvement, as six of the ten lowest-scoring countries in the social and economic context category are on the continent. Ecuador, India, Pakistan and Vietnam occupy the other four spots in the bottom ten. Most statistics suggest it will be a long time before African countries catch up. They perform poorly across a number of indicators, including literacy and educational levels and consumer orders via the Internet. In large part, poor performance can be attributed to inadequate infrastructure. Without electricity, computers will not work; and without telephone and broadband lines, there is no Internet. In the absence of basic infrastructure, citizens and businesses cannot access the Internet—and even if they could, the adoption, uptake and convenience of e-payment services would be hindered by the relatively poor access to fi nancial services. African countries typically have low percentages of businesses and citizens with a bank account, without which e-payments are diffi cult (although not impossible; see Mobile technologies: An opportunity for governments to close
the gap for information on how mobile technologies facilitate e-payment services). The top-performing African country in this category, South Africa, comes in at 39th (and is 35th overall).
© Economist Intelligence Unit Limited 2012
2011 Government E-Payments Adoption Ranking A global index and benchmarking study
32
Facilitating government e-payments initiatives
The results of the 2011 GEAR study reveal a signifi cant relationship between Internet/technology savviness and economic development. Countries that receive the lowest scores overall all have GDP per capita of less than US$20,000. Interestingly, all of the countries receiving the lowest scores for Internet/technology savviness have a GDP per capita below US$10,000. The poorest countries in this group (Kenya, Pakistan, Rwanda, Uganda and Vietnam) also score below the all countries average across all four transaction categories in the 2011 study. This implies that less-developed countries are likely to have a population that is not particularly technologically savvy, as well as weaker adoption of government e-payment services. This relationship between Internet/technology savviness and GDP per capita is refl ected in a high positive correlation (0.76). This strong correlation implies that oftentimes as GDP per capita increases, so too will Internet/technology savviness.
A common explanation for a lack of Internet/technology savviness is poor technological infrastructure and limited access to computers and—perhaps more importantly—the Internet. According to the WEF, the countries that receive the lowest scores for Internet/technology savviness in the 2011 GEAR study have a household computer penetration rate (defi ned as the percentage of households with a personal computer) of less than 30%, compared with an average penetration rate of 36% for the 136 countries in the WEF study. The countries that
score top marks for Internet/technology savviness in the 2011 GEAR study had a household computer penetration rate of at least 69%.
While Internet penetration levels (and, in particular, broadband penetration) are also low in the countries that receive the lowest Internet/technology savviness scores, the number of mobile subscriptions per 100 people tends to be quite high. Indeed, mobile penetration averages 83% in these countries. Some governments are keen to make the most of mobile technology, taking advantage of the prevalent familiarity with mobile technology and providing e-payment services via mobile phones. M-PESA is perhaps among the most well-known of these initiatives. Another available initiative is Uganda’s MTN MobileMoney, which allows users to transfer money domestically via mobile devices. MTN MobileMoney, a service of a South Africa-based communications and network access company24, has recently launched an upgrade that links a customer’s mobile account to a bank account, thereby allowing users to withdraw money directly from an authorised MTN MobileMoney agent. The service also allows users to pay utility bills and buy airtime using their mobile device.
Investing in these kinds of technologies and innovations is often a resourceful way of overcoming barriers, including a lack of technological savviness among the population, and could help to spur the uptake of e-payment solutions in developing markets. Other initiatives are also important, including basic literacy (without which access to a computer or other device is futile) and the provision of fi nancial education, which lends itself to a sense of security for those undertaking e-payments.
Noteworthy fi ndings
24. MTN Uganada (<http://mtn.co.ug/MTN-Services/Mobile-Banking/MTN-MobileMoney.aspx>).
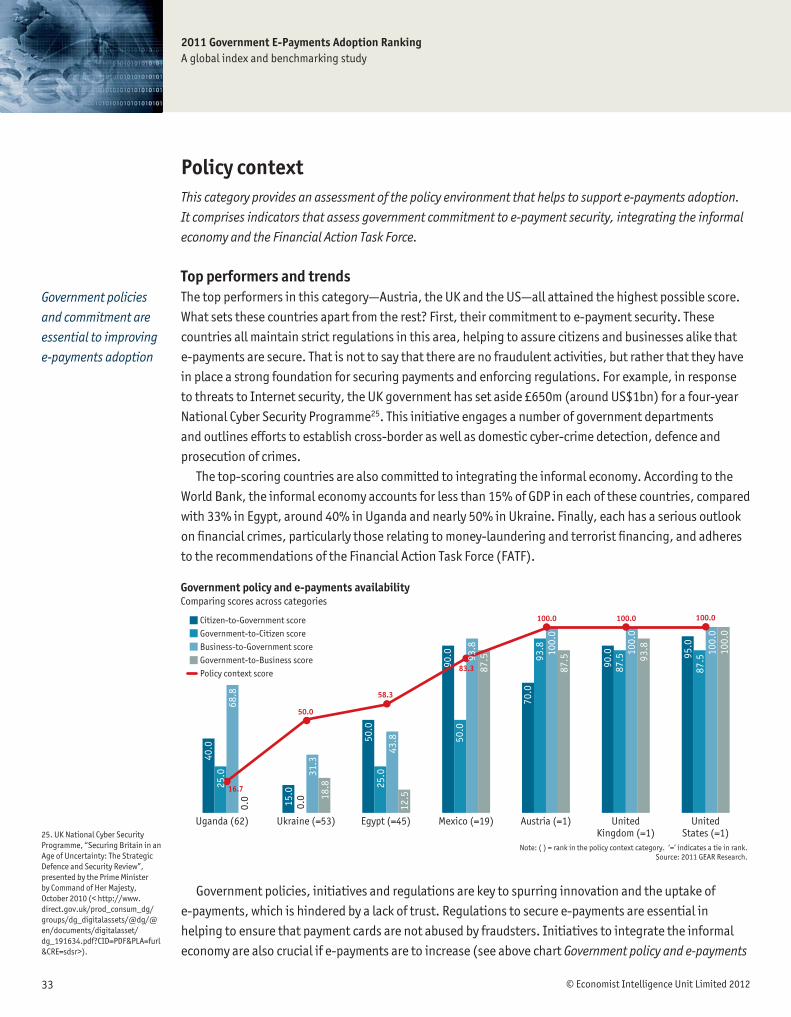
© Economist Intelligence Unit Limited 201233
2011 Government E-Payments Adoption Ranking A global index and benchmarking study
Policy contextThis category provides an assessment of the policy environment that helps to support e-payments adoption.
It comprises indicators that assess government commitment to e-payment security, integrating the informal
economy and the Financial Action Task Force.
Top performers and trendsThe top performers in this category—Austria, the UK and the US—all attained the highest possible score. What sets these countries apart from the rest? First, their commitment to e-payment security. These countries all maintain strict regulations in this area, helping to assure citizens and businesses alike that e-payments are secure. That is not to say that there are no fraudulent activities, but rather that they have in place a strong foundation for securing payments and enforcing regulations. For example, in response to threats to Internet security, the UK government has set aside £650m (around US$1bn) for a four-year National Cyber Security Programme25. This initiative engages a number of government departments and outlines efforts to establish cross-border as well as domestic cyber-crime detection, defence and prosecution of crimes.
The top-scoring countries are also committed to integrating the informal economy. According to the World Bank, the informal economy accounts for less than 15% of GDP in each of these countries, compared with 33% in Egypt, around 40% in Uganda and nearly 50% in Ukraine. Finally, each has a serious outlook on fi nancial crimes, particularly those relating to money-laundering and terrorist fi nancing, and adheres to the recommendations of the Financial Action Task Force (FATF).
Government policies
and commitment are
essential to improving
e-payments adoption
25. UK National Cyber Security Programme, “Securing Britain in an Age of Uncertainty: The Strategic Defence and Security Review”, presented by the Prime Minister by Command of Her Majesty, October 2010 (< http://www.direct.gov.uk/prod_consum_dg/groups/dg_digitalassets/@dg/@en/documents/digitalasset/dg_191634.pdf?CID=PDF&PLA=furl&CRE=sdsr>).
16.7
50.0
58.3
83.3
100.0100.0 100.0
Note: ( ) = rank in the policy context category. ‘=’ indicates a tie in rank.Source: 2011 GEAR Research.
Uganda (62) Ukraine (=53) Egypt (=45) Mexico (=19) Austria (=1) United United Kingdom (=1) States (=1)
Government policy and e-payments availabilityComparing scores across categories
Citizen-to-Government scoreGovernment-to-Citizen scoreBusiness-to-Government scoreGovernment-to-Business scorePolicy context score
25.0
40.0
0.0 18
.8
68.8
0.0
31.3
15.0
50.0
87.593
.8
90.0 93
.8
87.5
100.
0
70.0
87.5 93
.8100.
0
90.0
87.5
100.
010
0.0
95.0
25.0
12.5
43.850
.0
Government policies, initiatives and regulations are key to spurring innovation and the uptake of e-payments, which is hindered by a lack of trust. Regulations to secure e-payments are essential in helping to ensure that payment cards are not abused by fraudsters. Initiatives to integrate the informal economy are also crucial if e-payments are to increase (see above chart Government policy and e-payments
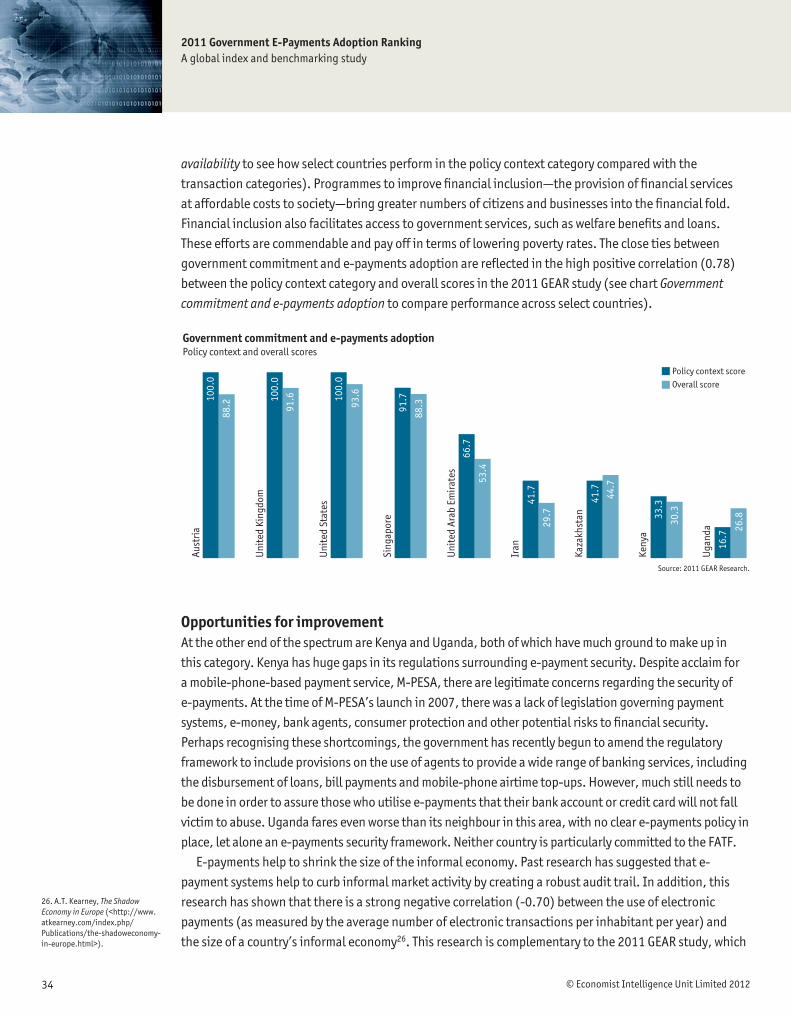
© Economist Intelligence Unit Limited 2012
2011 Government E-Payments Adoption Ranking A global index and benchmarking study
34
availability to see how select countries perform in the policy context category compared with the transaction categories). Programmes to improve fi nancial inclusion—the provision of fi nancial services at affordable costs to society—bring greater numbers of citizens and businesses into the fi nancial fold. Financial inclusion also facilitates access to government services, such as welfare benefi ts and loans. These efforts are commendable and pay off in terms of lowering poverty rates. The close ties between government commitment and e-payments adoption are refl ected in the high positive correlation (0.78) between the policy context category and overall scores in the 2011 GEAR study (see chart Government
commitment and e-payments adoption to compare performance across select countries).
Opportunities for improvementAt the other end of the spectrum are Kenya and Uganda, both of which have much ground to make up in this category. Kenya has huge gaps in its regulations surrounding e-payment security. Despite acclaim for a mobile-phone-based payment service, M-PESA, there are legitimate concerns regarding the security of e-payments. At the time of M-PESA’s launch in 2007, there was a lack of legislation governing payment systems, e-money, bank agents, consumer protection and other potential risks to fi nancial security. Perhaps recognising these shortcomings, the government has recently begun to amend the regulatory framework to include provisions on the use of agents to provide a wide range of banking services, including the disbursement of loans, bill payments and mobile-phone airtime top-ups. However, much still needs to be done in order to assure those who utilise e-payments that their bank account or credit card will not fall victim to abuse. Uganda fares even worse than its neighbour in this area, with no clear e-payments policy in place, let alone an e-payments security framework. Neither country is particularly committed to the FATF.
E-payments help to shrink the size of the informal economy. Past research has suggested that e-payment systems help to curb informal market activity by creating a robust audit trail. In addition, this research has shown that there is a strong negative correlation (-0.70) between the use of electronic payments (as measured by the average number of electronic transactions per inhabitant per year) and the size of a country’s informal economy26. This research is complementary to the 2011 GEAR study, which
Source: 2011 GEAR Research.
Aust
ria
Uni
ted
King
dom
Uni
ted
Stat
es
Sing
apor
e
Uni
ted
Arab
Em
irat
es
Iran
Kaza
khst
an
Keny
a
Uga
nda
Government commitment and e-payments adoptionPolicy context and overall scores
Policy context scoreOverall score
100.
0
100.
0
100.
0
88.2
88.3
66.7
41.7
29.7
53.4
44.7
41.7
33.3
30.3
16.7
26.8
91.6
91.7
93.6
26. A.T. Kearney, The Shadow Economy in Europe (<http://www.atkearney.com/index.php/Publications/the-shadoweconomy-in-europe.html>).

© Economist Intelligence Unit Limited 201235
2011 Government E-Payments Adoption Ranking A global index and benchmarking study
evaluates government commitment to the integration of the informal economy. The analysis considers both the size of the informal economy (as a percentage of GDP) and the existence of a strategy document for fi nancial inclusion. The study shows that there is a moderate positive correlation (0.42) between this indicator and the overall score. Only around one-third of the countries researched in the 2011 GEAR study have a strategy document in place, which is consistent with the results observed in the Financial Access 2010 report (45% of the 141 economies surveyed by the Consultative Group to Assist the Poor have a strategy document). The results of the 2011 GEAR study indicate a general need for countries to take more formal steps to mitigate and integrate the informal economy.
Governments are increasingly expected to take steps to function with the effi ciency of the private sector. The private sector is seemingly more effi cient, in part because it typically adopts technologies more quickly than the public sector. When governments outsource functions to the private sector, e-payment services may be introduced where none previously existed. One example of public-private sector collaboration is in Canada, where the government utilises 17 private-sector lenders to disburse government-funded business loans. Governments often recognise that they do not have the resources (particularly fi nancial) or the expertise to provide citizens and businesses with the best services, making outsourcing a potential option.
Promoting electronic payments adoption
Governments have made great strides in recent years in promoting electronic payments. Initiatives are grounded in securing electronic payments, but typically go well beyond regulation to encourage citizen and business uptake of e-payment services. Some countries offer direct incentives, such as lower VAT rates when a card is used, or indirectly encourage uptake by, for example, paying government salaries directly to a bank account.
Cash is still king in many countries in the Middle East. However, change is coming rapidly to some countries. As governments look to roll out e-payment services, some are also improving upon existing card payment options. The UAE has recently launched the G2 E-Dirham, which improves upon the existing system by offering users more payment facilities. Elsewhere, Oman rolled out its electronic purse initiative in 2009. An electronic purse replaces the use of credit or debit cards in electronic transactions. In Oman, the e-purse
is a national ID card embedded with an electronic chip. The ID can be loaded with money using cards or bank accounts and used in paying for government goods and services, making payments to various government agencies, such as the Royal Oman Police, and for conducting commercial transactions. The government’s objective in introducing the e-purse system is to increase security, effi ciency and convenience. While the government has certainly made enormous strides in terms of promoting e-payments and e-government in recent years, there are drawbacks to the e-purse initiative—namely, the card can only be used for transactions within Oman, meaning that online purchases abroad are not facilitated by the e-purse.
This highlights a broader issue for governments in their efforts to encourage electronic payments: e-commerce is increasingly global, but regulations, currencies and even languages are not the same across borders. Governments around the world are taking varying steps to encourage e-payments and the systems implemented take on a number of different forms.
Noteworthy fi ndings
© Economist Intelligence Unit Limited 2012
2011 Government E-Payments Adoption Ranking A global index and benchmarking study
36
Focusing on e-payment security
More than one-third of the 62 countries in this research receive the highest possible score for their efforts to promote electronic payment security. Governments have responded to citizens’ concerns over fraud and identity theft by implementing and enforcing regulations relating to electronic transactions. Two countries stand out: Singapore and Sweden both receive the highest marks in this research, and are ranked fi rst and second in the WEF’s Global Information Technology 2010–2011 ranking of laws relating to the use of information and communication technologies (eg, electronic commerce, digital signatures, consumer protection). Most governments view security as the foundation of a positive e-payment environment.
Singapore has gone beyond implementing the legal framework necessary to ensure security. In 2001 a National Trust Council (NTC) was formed to help boost public confi dence in electronic transactions and spur growth in e-commerce. NTC supports TrustSg, an online shopping directory where accredited domestic businesses can list their products and services27. The
TrustSg seal on a merchant website tells consumers that electronic transactions are processed securely. This is just one example of a trustmark organisation; trustmarks are one of the key mechanisms for boosting consumer confi dence and self-regulation in e-commerce.
However, challenges remain: standardising codes of conduct, dispute mechanisms and other security-related processes across borders is an arduous and long-term process. In order for consumers to feel secure in making purchases from other countries, there will need to be much more global co-ordination in this area so that the e-commerce market can become truly global. Even in countries like Sweden, where more than 90% of the population makes purchases online and domestic e-commerce regulations are robust, Internet security acts as a barrier to consumer purchases from foreign countries. According to an E-commerce without Borders study undertaken by the Swedish Trade Federation28, the leading reason cited for not shopping at foreign websites is distrust of the security of the payment data. Governments must think beyond their own border when it comes to regulating the e-commerce market in order for consumers to feel secure in a global e-commerce marketplace.
27. Singapore National Trust Council (<http://www.trustsg.sg/index.html>).
28 “E-commerce without borders creates new consumer behaviour: A survey of Swedish e-commerce companies and Nordic consumers”, Svensk Handel (<http://www.svenskhandel.se/Documents/Rapporter/E-handelsrapport_engelska.pdf>).
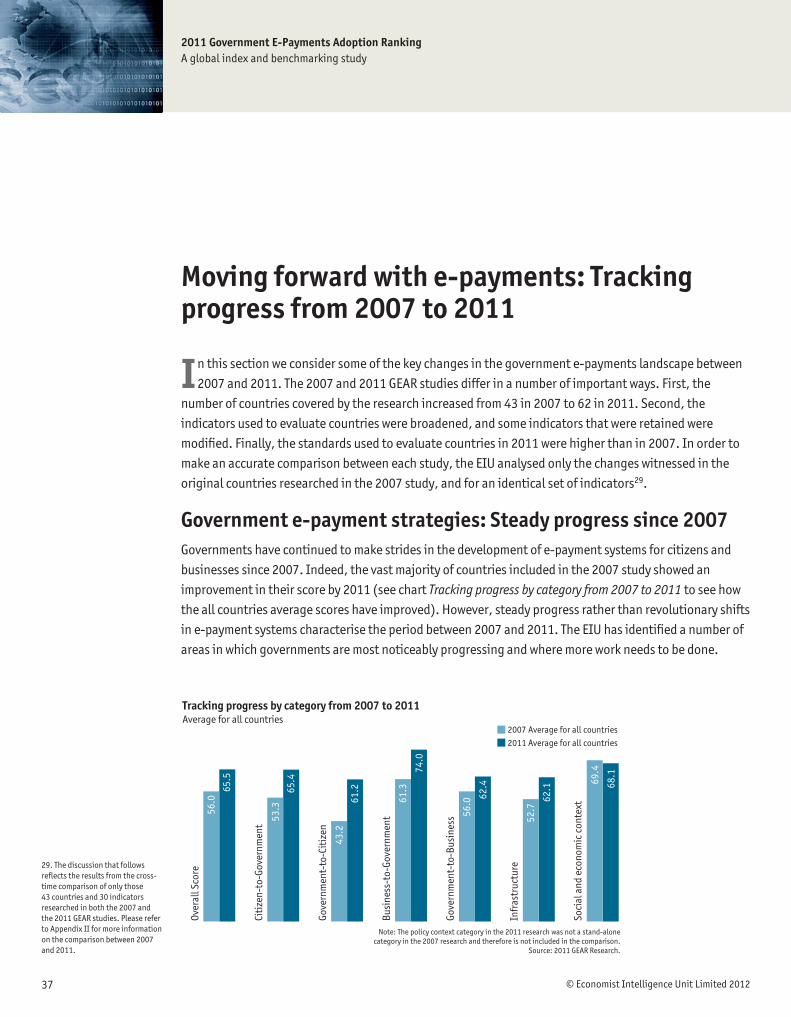
© Economist Intelligence Unit Limited 201237
2011 Government E-Payments Adoption Ranking A global index and benchmarking study
In this section we consider some of the key changes in the government e-payments landscape between 2007 and 2011. The 2007 and 2011 GEAR studies differ in a number of important ways. First, the
number of countries covered by the research increased from 43 in 2007 to 62 in 2011. Second, the indicators used to evaluate countries were broadened, and some indicators that were retained were modifi ed. Finally, the standards used to evaluate countries in 2011 were higher than in 2007. In order to make an accurate comparison between each study, the EIU analysed only the changes witnessed in the original countries researched in the 2007 study, and for an identical set of indicators29.
Government e-payment strategies: Steady progress since 2007Governments have continued to make strides in the development of e-payment systems for citizens and businesses since 2007. Indeed, the vast majority of countries included in the 2007 study showed an improvement in their score by 2011 (see chart Tracking progress by category from 2007 to 2011 to see how the all countries average scores have improved). However, steady progress rather than revolutionary shifts in e-payment systems characterise the period between 2007 and 2011. The EIU has identifi ed a number of areas in which governments are most noticeably progressing and where more work needs to be done.
Moving forward with e-payments: Tracking progress from 2007 to 2011
Note: The policy context category in the 2011 research was not a stand-alonecategory in the 2007 research and therefore is not included in the comparison.
Source: 2011 GEAR Research.
Over
all S
core
Citi
zen-
to-G
over
nmen
t
Gove
rnm
ent-
to-C
itiz
en
Busi
ness
-to-
Gove
rnm
ent
Gove
rnm
ent-
to-B
usin
ess
Infr
astr
uctu
re
Soci
al a
nd e
cono
mic
con
text
Tracking progress by category from 2007 to 2011Average for all countries
2007 Average for all countries2011 Average for all countries
56.0
53.3
43.2
65.5
74.0
56.0
52.7
62.1
62.4 68
.1
69.4
65.4
61.3
61.2
29. The discussion that follows refl ects the results from the cross-time comparison of only those 43 countries and 30 indicators researched in both the 2007 and the 2011 GEAR studies. Please refer to Appendix II for more information on the comparison between 2007 and 2011.
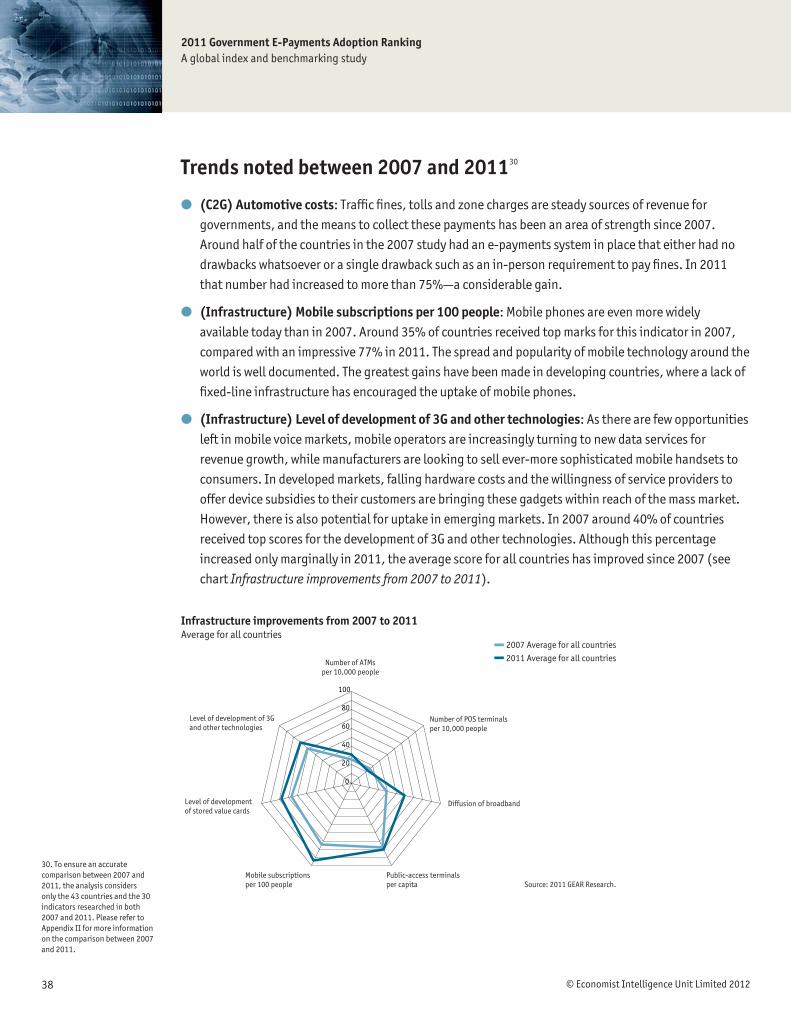
© Economist Intelligence Unit Limited 2012
2011 Government E-Payments Adoption Ranking A global index and benchmarking study
38
Trends noted between 2007 and 201130
● (C2G) Automotive costs: Traffi c fi nes, tolls and zone charges are steady sources of revenue for governments, and the means to collect these payments has been an area of strength since 2007. Around half of the countries in the 2007 study had an e-payments system in place that either had no drawbacks whatsoever or a single drawback such as an in-person requirement to pay fi nes. In 2011 that number had increased to more than 75%—a considerable gain.
● (Infrastructure) Mobile subscriptions per 100 people: Mobile phones are even more widely available today than in 2007. Around 35% of countries received top marks for this indicator in 2007, compared with an impressive 77% in 2011. The spread and popularity of mobile technology around the world is well documented. The greatest gains have been made in developing countries, where a lack of fi xed-line infrastructure has encouraged the uptake of mobile phones.
● (Infrastructure) Level of development of 3G and other technologies: As there are few opportunities left in mobile voice markets, mobile operators are increasingly turning to new data services for revenue growth, while manufacturers are looking to sell ever-more sophisticated mobile handsets to consumers. In developed markets, falling hardware costs and the willingness of service providers to offer device subsidies to their customers are bringing these gadgets within reach of the mass market. However, there is also potential for uptake in emerging markets. In 2007 around 40% of countries received top scores for the development of 3G and other technologies. Although this percentage increased only marginally in 2011, the average score for all countries has improved since 2007 (see chart Infrastructure improvements from 2007 to 2011).
Infrastructure improvements from 2007 to 2011Average for all countries
2007 Average for all countries2011 Average for all countries
0
20
40
60
80
100
Level of development of 3Gand other technologies
Level of developmentof stored value cards
Mobile subscriptionsper 100 people
Public-access terminalsper capita Source: 2011 GEAR Research.
Diffusion of broadband
Number of POS terminals per 10,000 people
Number of ATMsper 10,000 people
30. To ensure an accurate comparison between 2007 and 2011, the analysis considers only the 43 countries and the 30 indicators researched in both 2007 and 2011. Please refer to Appendix II for more information on the comparison between 2007 and 2011.

© Economist Intelligence Unit Limited 201239
2011 Government E-Payments Adoption Ranking A global index and benchmarking study
● (C2G) Obtaining/paying for an ID card: As noted previously, this is an area of weakness for countries in the 2011 GEAR study—a trend that has carried through from 2007. Two-thirds of countries still do not have an electronic system that allows citizens to obtain and pay for an ID card or driving licence online. That is not to say that improvements have not been made: around 30% of countries have boosted their score since 2007.
● (G2C) Unemployment, workers’ compensation and welfare benefi ts: Only six countries receive the top score for providing e-payment services for unemployment, workers’ compensation and welfare benefi ts—the same number that received the best mark in 2007. While this is a low fi gure, it should be noted that governments currently disburse benefi ts through other means, such as cash or cheques, and many are making progress in terms of e-payments. An extraordinary 65% of countries improved their score in this area since 2007. Given the greater needs of many people in the current economic climate, this is indeed encouraging.
● (Policy context) Government commitment to integrating the informal economy: Here, few countries have progressed since 2007. Although 25% of countries have boosted their score since 2007, the rest have done little (if anything) to bring the informal sector into the fold. Given the economic challenges of recent years, it is not surprising that governments have not prioritised the issue. Nevertheless, governments have much to gain by pushing forward with initiatives in this area. For instance, governments may look to enhance the efforts to cut down on tax avoidance as fi scal austerity measures kick in, and integrating the informal economy is a key facet of such efforts.
© Economist Intelligence Unit Limited 2012
2011 Government E-Payments Adoption Ranking A global index and benchmarking study
40
GEAR rankings now and then In this section we consider some of the key changes in the government e-payments landscape between 2007 and 201132.
Canada conspicuously slides from the number one spot in the 2007 study to 11th position in 2011. It is not that Canada is doing worse, but rather that other countries have surpassed it (see Why 2007
high-achiever Canada lost the lead below). The US is the new leader, supported by improved scores in the infrastructure and B2G categories. The UK maintains its position in second place, while Germany moves up one spot to third in the 2011 rankings. At the other end of the standings there is little change: Nigeria holds steady in 43rd, while Egypt and Ukraine fell one spot to 41st and 42nd respectively. All three countries have a poor showing across all of the categories in the research.
Are governments in 2011 doing things differently from 2007?31
The GEAR study in 2007 examined a number of government e-payment strategies. Have governments in 2011 continued to prioritise these goals? Here is a snapshot of the strategies prescribed in the 2007 GEAR study and an overview of the relevance of these recommendations after four years:
Strategy: Build systems appropriate for the target group, whether citizens or businesses, while striking a balance between accessibility and technological progress.
2011: For policymakers, ensuring that the supply of services is matched by demand is still a challenge. Digitising services can prove to be a costly undertaking, although it often pays dividends as operational and other costs plummet. Citizens and businesses use the Internet when it is useful and provides clear benefi ts. Governments are still learning how to respond.
Strategy: Align the goals of G2C services and C2G services. E-payments need not be just a new type of tax collector.
2011: Progress towards meeting this goal has been limited to date. C2G services for income tax payments have been modernised faster than G2C income tax refunds. Nevertheless, there has been progress in other G2C areas. Approximately 65% of countries have shown an improvement in their provision of unemployment and
welfare benefi ts—an encouraging indication that governments are responding to growing demand for services.
Strategy: Where identity, fraud and documentation considerations preclude full electronic services, supply information, downloadable forms and electronic appointment systems.
2011: Governments must fi nd a balance between offering e-payment services and mitigating security risks. Where governments deem the security risks to be too great, many provide citizens and businesses with the option to book appointments online and download forms. Security systems in many countries continue to improve, although governments still face challenges in managing growing cyber risks.
Strategy: Start with widely used, relatively standardised services: tax payments and refunds, social security contributions and procurement. Diffuse services later to other payment types, such as automotive costs and government loans.
2011: Governments appear to prioritise automating standard services over other e-payment services. The 2011 GEAR study suggests that the number of countries offering e-payment services for tax payments/refunds, social security contributions and procurement is signifi cantly greater than for many other e-payment services.
Strategy: Improve Internet access.
2011: Progress on this front has been tremendous in most countries. This is not surprising given that increasing Internet penetration is a top priority for the majority of governments. Around 85% of countries have succeeded in expanding broadband coverage since 2007.
31. To ensure an accurate comparison between 2007 and 2011, the analysis considers only the 43 countries and the 30 indicators researched in both 2007 and 2011. Please refer to Appendix II for more information on the comparison between 2007 and 2011.
32. Ibid.

© Economist Intelligence Unit Limited 201241
2011 Government E-Payments Adoption Ranking A global index and benchmarking study
A different perspective on cross-time comparisons between the 2007 and 2011 studies comes from looking at countries that received low scores in 2007 and have remained at the bottom of the pack in 2011, irrespective of making absolute improvements. For example, Ukraine found itself ranking last or close to last across all transaction indicators in 2007. Despite some improvements, it found itself in a very similar position in 2011, suggesting not only that it is under-providing electronic services to citizens and businesses, but also that it is slower than other countries in the uptake of e-government initiatives.
The drop in Canada’s score is among a number of standout changes observed between the 2007 and 2011 GEAR studies (see chart Losing ground). China, Hong Kong and Sweden experienced similar declines in their scores. This largely refl ects greater gains made by other countries in the study, as well as the higher standard to which countries were held in 2011.
Why 2007 high-achiever Canada lost the lead
How did Canada fall from fi rst place in 2007 to 11th place in the 2011 GEAR study? Technological advancement has had a signifi cant impact on the methodology and relevance of the GEAR study. This is evidenced by the change in standards for evaluating countries on their level of electronic service provision. The provision of forms for download or user instructions is no longer suffi cient to grant countries top marks. It is therefore not surprising to see a top performer from the 2007 study, Canada, experience a number of lower category scores. However, it is important to keep in mind that Canada may have improved its score on some indicators in absolute terms (for
example, the number of POS terminals per 10,000 people in Canada increased from 176.9 in 2007 to 255.6 in 2011) but experienced a drop relative to the improvements achieved by other countries.
Canada consistently scored substantially higher than the all-country average in both 2007 and 2011; however, its improvements have been slower than those made by other countries (refl ected in its downward movement in normalised score and, subsequently, its ranking in 2011)33. It is important to be mindful that this comparison refl ects relative change in performance and not a deterioration of conditions. Similarly, countries that started off as top performers (scoring top marks across most indicators) could show little improvement owing to the fact that other countries made large gains to catch up to the bar they have set, rather than because they have underperformed.
Source: 2011 GEAR Research.
Cana
da
Chin
a
Hon
g Ko
ng
Swed
en
Losing groundLargest declines in overall score
2007 score2011 score
92.4
60.8
86.184
.6
87.7
53.7
88.983
.4
The US replaces
Canada at the top
33. Please refer to Appendix II for an explanation of the normalisation methodology.

© Economist Intelligence Unit Limited 2012
2011 Government E-Payments Adoption Ranking A global index and benchmarking study
42
A signifi cant number of countries, however, improved their positions. On the upward trajectory in the 2011 GEAR study are six Latin American countries, Indonesia and Saudi Arabia, among others (see chart Improving with time below). These countries have increased their scores across the majority of categories and indicators. Indonesia has improved the most, receiving higher scores in 2011 for every category.
Source: 2011 GEAR Research.
Indo
nesi
a
Mex
ico
Czec
h Re
publ
ic
Braz
il
Cost
a Ri
ca
Saud
i Ara
bia
Vene
zuel
a
Mal
aysi
a
Colo
mbi
a
Turk
ey
Arge
ntin
a
Improving with timeLargest increases in overall score
2007 score2011 score
13.4
48.7
59.2
52.2
41.4 48
.3
21.6
19.5
38.441
.0
68.0
49.5
49.6
31.6
79.6
61.6
61.6
44.9
75.0
28.4
84.6
72.5
Indonesia still ranks low, but improves its overall score
While Indonesia has certainly improved its performance, its rank in the index has remained relatively unchanged. In 2007 Indonesia scored 13.4 and was ranked 42nd out of 43 countries (sharing the bottom with Nigeria and Ukraine). Among the 43 countries researched in both 2007 and 2011, Indonesia scored 41.4 to move up to 37th in 2011. However, with the inclusion of 19 new countries in the latest
study, Indonesia (with a score of 45.7) currently ranks 47th out of 62. This suggests that the inclusion of new countries (some of which have performed worse) helped to prevent Indonesia from ranking at the bottom again. Nevertheless, the country has improved, netting better scores in every category as well as overall. Driving Indonesia’s jump in score is the development of G2C e-payment services, with an emphasis on automating social security, welfare and health benefi ts. Despite still ranking below the overall average of the 62 countries included in this study, Indonesia has nevertheless made notable progress in government e-payments adoption.
© Economist Intelligence Unit Limited 201243
2011 Government E-Payments Adoption Ranking A global index and benchmarking study
The 2011 GEAR study provides a snapshot of the progress that has been made and the opportunities that remain for greater achievement in government e-payments adoption. The staggering pace of
technological advances since 2007 called for countries to be held to a higher standard in the 2011 GEAR study. That standard was met and exceeded by a number of countries. The all countries average rose for most indicators of e-payments adoption. This impressive performance signals that in most cases governments are keeping up with technological developments and are focused on improving e-payment services.
The pace of change and the types of initiatives implemented by governments vary greatly. Early adopters of e-payment services are now pushing the boundaries of e-payment innovation. The South Korean government offers its citizens and businesses more than 150 portals34, through which a variety of transactions are facilitated. Hong Kong continues to blaze the trail with its Octopus smartcard, which can be used to pay mobile-phone bills, buy bus passes and check children in at school.
By and large, countries with high GDP per capita tend to have better technological infrastructure and, unsurprisingly, more resources to invest in e-payment adoption and development. The link between infrastructure and e-payment development has not gone unnoticed. A number of countries are exhibiting grand resourcefulness in utilising the technology at hand. In countries where people often lack access to basic banking services or computers, mobile phones have become a means of making and receiving payments and providing services to citizens. Kenya’s M-PESA is just one standout initiative that takes advantage of mobile-phone technologies, which are typically more widespread and can be as reliable as traditional fi xed-line networks. This is especially true if adequate legislation is in place to help to mitigate the security risks associated with transacting via a mobile phone. Ultimately, a combination of infrastructure and government policy is essential to the improvement of e-payment services.
What’s next for e-payments?
● There will be continued improvements in infrastructure, including broadband and 3G (and, increasingly, 4G) networks. Advances in infrastructure will help to drive uptake of e-payment services.
● Contactless and mobile payments will see huge uptake in the coming years. With more than 5bn mobile-phone users worldwide, mobile contactless payments are likely to boom. However, governments and service providers will need to ensure that the security around these systems is adequate.
Conclusion
34. EIU Digital Economy Rankings 2010 (<http://graphics.eiu.com/upload/EIU_Digital_economy_rankings_2010_FINAL_WEB.pdf>).

© Economist Intelligence Unit Limited 2012
2011 Government E-Payments Adoption Ranking A global index and benchmarking study
44
● The number of individuals and businesses utilising fi nancial services will rise, particularly in the developing world. Access will be boosted as mobile banking services are rolled out. Countries in Africa and Latin America will see particularly strong gains in this area.
● E-payment security will remain an important issue for governments, businesses and citizens. Proven security and recourse measures must be in place for the uptake of e-payments to fl ourish. There is likely to be greater cross-border co-operation in this area.
● There will be a gradual move towards improving existing e-payment services in the areas of tax and benefi ts in those countries that already have systems in place.
● Governments most likely will continue to prioritise automating standard services such as tax payments/refunds and social security contributions over other e-payment services.
● There will continue to be public/private-sector collaboration on e-payment initiatives. Indeed, such collaboration is likely to increase in many countries as some government functions are outsourced to the private sector.
Looking ahead, there may be unexpected innovations in some countries, driven for the most part by advances in the private sector. The onus will be on governments not only to keep up with the private sector in terms of technologies, but also to ensure that adequate regulations are in place to secure transactions. This will be no easy feat. Governments will need to ensure that any proposed regulatory framework surrounding e-payments provides suffi cient defence against escalating cyber risks but, at the same time, does not impede competition and development within the e-payments sphere.
As governments work toward adopting and improving e-payment services, their strategies will almost undoubtedly refl ect each country’s unique infrastructure and social, economic and policy context. No single approach to government e-payments adoption is universal, and no one successful strategy is necessarily scalable. The 2011 GEAR study highlights the diversity of government e-payment systems already in place as well as the plethora of opportunities available to governments for improving e-payment services. In spite of fi nancial diffi culties, growing populations and the prevalence of security risks, governments are showing that they understand the importance of maximising the reach of e-payment services. What remains to be seen are the specifi c paths they will take to implement e-payments and improve adoption.

© Economist Intelligence Unit Limited 201245
2011 Government E-Payments Adoption Ranking A global index and benchmarking study
Argentina 46
Australia 46
Austria 47
Bahrain 47
Brazil 48
Canada 48
Chile 49
China 49
Colombia 50
Costa Rica 50
Czech Republic 51
Denmark 51
Dominican Republic 52
Ecuador 52
Egypt 53
Finland 53
France 54
Germany 54
Hong Kong 55
Hungary 55
India 56
Indonesia 56
Iran 57
Ireland 57
Israel 58
Italy 58
Japan 59
Kazakhstan 59
Kenya 60
Kuwait 60
Malaysia 61
Mexico 61
Morocco 62
Netherlands 62
New Zealand 63
Nigeria 63
Norway 64
Oman 64
Pakistan 65
Peru 65
Philippines 66
Poland 66
Qatar 67
Russia 67
Rwanda 68
Saudi Arabia 68
Singapore 69
South Africa 69
South Korea 70
Spain 70
Sweden 71
Taiwan 71
Thailand 72
Tunisia 72
Turkey 73
Uganda 73
Ukraine 74
United Arab Emirates 74
United Kingdom 75
United States 75
Venezuela 76
Vietnam 76
Appendix I: Country summaries
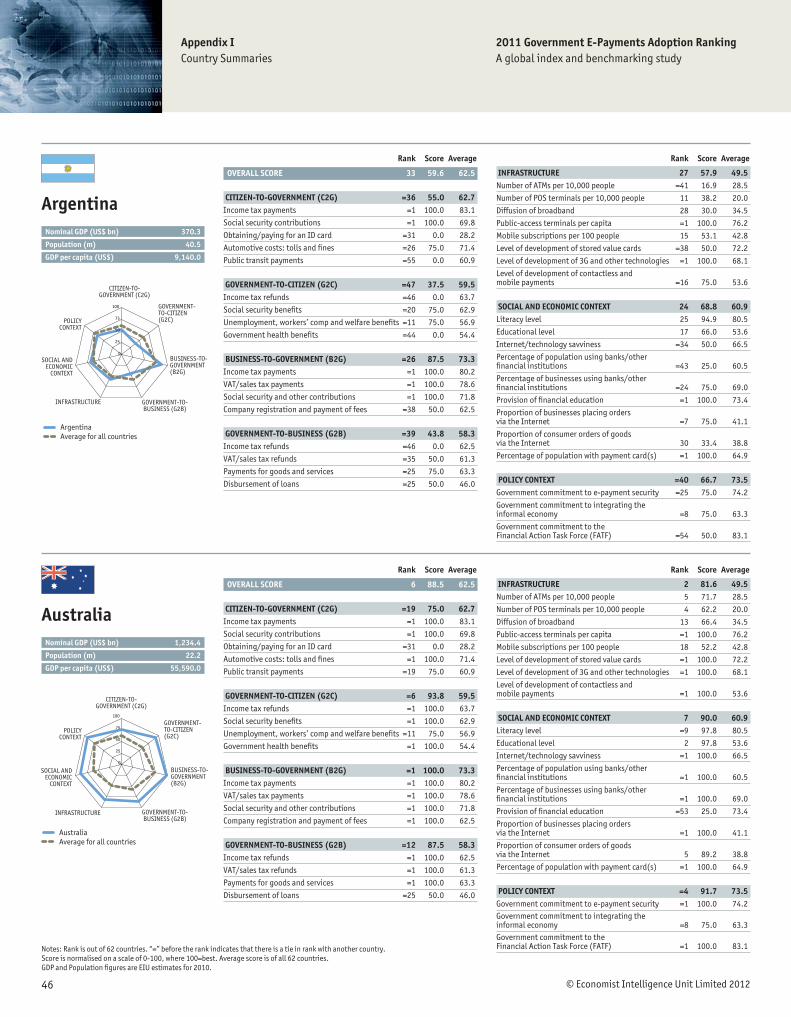
© Economist Intelligence Unit Limited 201246
Appendix ICountry Summaries
Notes: Rank is out of 62 countries. “=” before the rank indicates that there is a tie in rank with another country. Score is normalised on a scale of 0-100, where 100=best. Average score is of all 62 countries. GDP and Population fi gures are EIU estimates for 2010.
2011 Government E-Payments Adoption RankingA global index and benchmarking study
Rank Score Average
OVERALL SCORE 33 59.6 62.5
CITIZEN-TO-GOVERNMENT (C2G) =36 55.0 62.7Income tax payments =1 100.0 83.1
Social security contributions =1 100.0 69.8
Obtaining/paying for an ID card =31 0.0 28.2
Automotive costs: tolls and fi nes =26 75.0 71.4
Public transit payments =55 0.0 60.9
GOVERNMENT-TO-CITIZEN (G2C) =47 37.5 59.5Income tax refunds =46 0.0 63.7
Social security benefi ts =20 75.0 62.9
Unemployment, workers’ comp and welfare benefi ts =11 75.0 56.9
Government health benefi ts =44 0.0 54.4
BUSINESS-TO-GOVERNMENT (B2G) =26 87.5 73.3Income tax payments =1 100.0 80.2
VAT/sales tax payments =1 100.0 78.6
Social security and other contributions =1 100.0 71.8
Company registration and payment of fees =38 50.0 62.5
GOVERNMENT-TO-BUSINESS (G2B) =39 43.8 58.3Income tax refunds =46 0.0 62.5
VAT/sales tax refunds =35 50.0 61.3
Payments for goods and services =25 75.0 63.3
Disbursement of loans =25 50.0 46.0
Rank Score Average
INFRASTRUCTURE 27 57.9 49.5Number of ATMs per 10,000 people =41 16.9 28.5
Number of POS terminals per 10,000 people 11 38.2 20.0
Diffusion of broadband 28 30.0 34.5
Public-access terminals per capita =1 100.0 76.2
Mobile subscriptions per 100 people 15 53.1 42.8
Level of development of stored value cards =38 50.0 72.2
Level of development of 3G and other technologies =1 100.0 68.1
Level of development of contactless and mobile payments =16 75.0 53.6
SOCIAL AND ECONOMIC CONTEXT 24 68.8 60.9Literacy level 25 94.9 80.5
Educational level 17 66.0 53.6
Internet/technology savviness =34 50.0 66.5
Percentage of population using banks/other fi nancial institutions =43 25.0 60.5
Percentage of businesses using banks/other fi nancial institutions =24 75.0 69.0
Provision of fi nancial education =1 100.0 73.4
Proportion of businesses placing orders via the Internet =7 75.0 41.1
Proportion of consumer orders of goods via the Internet 30 33.4 38.8
Percentage of population with payment card(s) =1 100.0 64.9
POLICY CONTEXT =40 66.7 73.5Government commitment to e-payment security =25 75.0 74.2
Government commitment to integrating the informal economy =8 75.0 63.3
Government commitment to the Financial Action Task Force (FATF) =54 50.0 83.1
ArgentinaAverage for all countries
CITIZEN-TO-GOVERNMENT (C2G)
GOVERNMENT-TO-CITIZEN (G2C)
BUSINESS-TO-GOVERNMENT(B2G)
INFRASTRUCTURE
SOCIAL ANDECONOMIC
CONTEXT
POLICYCONTEXT
GOVERNMENT-TO-BUSINESS (G2B)
0
25
50
75
100
Rank Score Average
OVERALL SCORE 6 88.5 62.5
CITIZEN-TO-GOVERNMENT (C2G) =19 75.0 62.7Income tax payments =1 100.0 83.1
Social security contributions =1 100.0 69.8
Obtaining/paying for an ID card =31 0.0 28.2
Automotive costs: tolls and fi nes =1 100.0 71.4
Public transit payments =19 75.0 60.9
GOVERNMENT-TO-CITIZEN (G2C) =6 93.8 59.5Income tax refunds =1 100.0 63.7
Social security benefi ts =1 100.0 62.9
Unemployment, workers’ comp and welfare benefi ts =11 75.0 56.9
Government health benefi ts =1 100.0 54.4
BUSINESS-TO-GOVERNMENT (B2G) =1 100.0 73.3Income tax payments =1 100.0 80.2
VAT/sales tax payments =1 100.0 78.6
Social security and other contributions =1 100.0 71.8
Company registration and payment of fees =1 100.0 62.5
GOVERNMENT-TO-BUSINESS (G2B) =12 87.5 58.3Income tax refunds =1 100.0 62.5
VAT/sales tax refunds =1 100.0 61.3
Payments for goods and services =1 100.0 63.3
Disbursement of loans =25 50.0 46.0
Rank Score Average
INFRASTRUCTURE 2 81.6 49.5Number of ATMs per 10,000 people 5 71.7 28.5
Number of POS terminals per 10,000 people 4 62.2 20.0
Diffusion of broadband 13 66.4 34.5
Public-access terminals per capita =1 100.0 76.2
Mobile subscriptions per 100 people 18 52.2 42.8
Level of development of stored value cards =1 100.0 72.2
Level of development of 3G and other technologies =1 100.0 68.1
Level of development of contactless and mobile payments =1 100.0 53.6
SOCIAL AND ECONOMIC CONTEXT 7 90.0 60.9Literacy level =9 97.8 80.5
Educational level 2 97.8 53.6
Internet/technology savviness =1 100.0 66.5
Percentage of population using banks/other fi nancial institutions =1 100.0 60.5
Percentage of businesses using banks/other fi nancial institutions =1 100.0 69.0
Provision of fi nancial education =53 25.0 73.4
Proportion of businesses placing orders via the Internet =1 100.0 41.1
Proportion of consumer orders of goods via the Internet 5 89.2 38.8
Percentage of population with payment card(s) =1 100.0 64.9
POLICY CONTEXT =4 91.7 73.5Government commitment to e-payment security =1 100.0 74.2Government commitment to integrating the informal economy =8 75.0 63.3Government commitment to the Financial Action Task Force (FATF) =1 100.0 83.1
AustraliaAverage for all countries
CITIZEN-TO-GOVERNMENT (C2G)
GOVERNMENT-TO-CITIZEN (G2C)
BUSINESS-TO-GOVERNMENT(B2G)
INFRASTRUCTURE
SOCIAL ANDECONOMIC
CONTEXT
POLICYCONTEXT
GOVERNMENT-TO-BUSINESS (G2B)
0
25
50
75
100
Argentina Nominal GDP (US$ bn) 370.3
Population (m) 40.5
GDP per capita (US$) 9,140.0
Australia Nominal GDP (US$ bn) 1,234.4
Population (m) 22.2
GDP per capita (US$) 55,590.0

© Economist Intelligence Unit Limited 201247
Notes: Rank is out of 62 countries. “=” before the rank indicates that there is a tie in rank with another country. Score is normalised on a scale of 0-100, where 100=best. Average score is of all 62 countries. GDP and Population fi gures are EIU estimates for 2010.
Appendix ICountry Summaries
2011 Government E-Payments Adoption RankingA global index and benchmarking study
Rank Score Average
OVERALL SCORE 8 88.2 62.5
CITIZEN-TO-GOVERNMENT (C2G) =24 70.0 62.7Income tax payments =1 100.0 83.1
Social security contributions =1 100.0 69.8
Obtaining/paying for an ID card =31 0.0 28.2
Automotive costs: tolls and fi nes =44 50.0 71.4
Public transit payments =1 100.0 60.9
GOVERNMENT-TO-CITIZEN (G2C) =6 93.8 59.5Income tax refunds =1 100.0 63.7
Social security benefi ts =1 100.0 62.9
Unemployment, workers’ comp and welfare benefi ts =11 75.0 56.9
Government health benefi ts =1 100.0 54.4
BUSINESS-TO-GOVERNMENT (B2G) =1 100.0 73.3Income tax payments =1 100.0 80.2
VAT/sales tax payments =1 100.0 78.6
Social security and other contributions =1 100.0 71.8
Company registration and payment of fees =1 100.0 62.5
GOVERNMENT-TO-BUSINESS (G2B) =12 87.5 58.3Income tax refunds =1 100.0 62.5
VAT/sales tax refunds =1 100.0 61.3
Payments for goods and services =1 100.0 63.3
Disbursement of loans =25 50.0 46.0
Rank Score Average
INFRASTRUCTURE 3 80.4 49.5Number of ATMs per 10,000 people 9 54.3 28.5
Number of POS terminals per 10,000 people 3 64.2 20.0
Diffusion of broadband 14 65.8 34.5
Public-access terminals per capita =1 100.0 76.2
Mobile subscriptions per 100 people 8 58.9 42.8
Level of development of stored value cards =1 100.0 72.2
Level of development of 3G and other technologies =1 100.0 68.1
Level of development of contactless and mobile payments =1 100.0 53.6
SOCIAL AND ECONOMIC CONTEXT 11 85.4 60.9Literacy level 24 95.5 80.5
Educational level 22 62.7 53.6
Internet/technology savviness =1 100.0 66.5
Percentage of population using banks/other fi nancial institutions =1 100.0 60.5
Percentage of businesses using banks/other fi nancial institutions =1 100.0 69.0
Provision of fi nancial education =1 100.0 73.4
Proportion of businesses placing orders via the Internet =19 50.0 41.1
Proportion of consumer orders of goods via the Internet 20 60.9 38.8
Percentage of population with payment card(s) =1 100.0 64.9
POLICY CONTEXT =1 100.0 73.5Government commitment to e-payment security =1 100.0 74.2
Government commitment to integrating the informal economy =1 100.0 63.3
Government commitment to the Financial Action Task Force (FATF) =1 100.0 83.1
AustriaAverage for all countries
CITIZEN-TO-GOVERNMENT (C2G)
GOVERNMENT-TO-CITIZEN (G2C)
BUSINESS-TO-GOVERNMENT(B2G)
INFRASTRUCTURE
SOCIAL ANDECONOMIC
CONTEXT
POLICYCONTEXT
GOVERNMENT-TO-BUSINESS (G2B)
100
75
50
25
0
Rank Score Average
OVERALL SCORE 46 46.2 62.5
CITIZEN-TO-GOVERNMENT (C2G) =54 35.0 62.7Income tax payments =60 0.0 83.1
Social security contributions =53 0.0 69.8
Obtaining/paying for an ID card =1 100.0 28.2
Automotive costs: tolls and fi nes =26 75.0 71.4
Public transit payments =55 0.0 60.9
GOVERNMENT-TO-CITIZEN (G2C) =30 56.3 59.5Income tax refunds =46 0.0 63.7
Social security benefi ts =20 75.0 62.9
Unemployment, workers’ comp and welfare benefi ts =1 100.0 56.9
Government health benefi ts =30 50.0 54.4
BUSINESS-TO-GOVERNMENT (B2G) =53 37.5 73.3Income tax payments =60 0.0 80.2
VAT/sales tax payments =1 100.0 78.6
Social security and other contributions =54 0.0 71.8
Company registration and payment of fees =38 50.0 62.5
GOVERNMENT-TO-BUSINESS (G2B) =56 12.5 58.3Income tax refunds =46 0.0 62.5
VAT/sales tax refunds =46 0.0 61.3
Payments for goods and services =34 50.0 63.3
Disbursement of loans =42 0.0 46.0
Rank Score Average
INFRASTRUCTURE 35 44.0 49.5Number of ATMs per 10,000 people 43 14.2 28.5
Number of POS terminals per 10,000 people 30 15.3 20.0
Diffusion of broadband 36 21.1 34.5
Public-access terminals per capita =26 75.0 76.2
Mobile subscriptions per 100 people =19 51.2 42.8
Level of development of stored value cards =38 50.0 72.2
Level of development of 3G and other technologies =1 100.0 68.1
Level of development of contactless and mobile payments =36 25.0 53.6
SOCIAL AND ECONOMIC CONTEXT 35 54.9 60.9Literacy level 43 80.6 80.5
Educational level 32 55.2 53.6
Internet/technology savviness =24 75.0 66.5
Percentage of population using banks/other fi nancial institutions =43 25.0 60.5
Percentage of businesses using banks/other fi nancial institutions =1 100.0 69.0
Provision of fi nancial education =30 75.0 73.4
Proportion of businesses placing orders via the Internet =31 25.0 41.1
Proportion of consumer orders of goods via the Internet =43 8.4 38.8
Percentage of population with payment card(s) =39 50.0 64.9
POLICY CONTEXT =19 83.3 73.5Government commitment to e-payment security =25 75.0 74.2
Government commitment to integrating the informal economy =8 75.0 63.3
Government commitment to the Financial Action Task Force (FATF) =1 100.0 83.1
BahrainAverage for all countries
CITIZEN-TO-GOVERNMENT (C2G)
GOVERNMENT-TO-CITIZEN (G2C)
BUSINESS-TO-GOVERNMENT(B2G)
INFRASTRUCTURE
SOCIAL ANDECONOMIC
CONTEXT
POLICYCONTEXT
GOVERNMENT-TO-BUSINESS (G2B)
100
75
50
25
0
AustriaNominal GDP (US$ bn) 378.6
Population (m) 8.4
GDP per capita (US$) 44,980.0
Bahrain Nominal GDP (US$ bn) 22.9
Population (m) 1.2
GDP per capita (US$) 18,585.6

© Economist Intelligence Unit Limited 201248
Appendix ICountry Summaries
Notes: Rank is out of 62 countries. “=” before the rank indicates that there is a tie in rank with another country. Score is normalised on a scale of 0-100, where 100=best. Average score is of all 62 countries. GDP and Population fi gures are EIU estimates for 2010.
2011 Government E-Payments Adoption RankingA global index and benchmarking study
Rank Score Average
OVERALL SCORE 28 71.7 62.5
CITIZEN-TO-GOVERNMENT (C2G) =28 65.0 62.7Income tax payments =1 100.0 83.1
Social security contributions =41 50.0 69.8
Obtaining/paying for an ID card =24 25.0 28.2
Automotive costs: tolls and fi nes =26 75.0 71.4
Public transit payments =19 75.0 60.9
GOVERNMENT-TO-CITIZEN (G2C) =6 93.8 59.5Income tax refunds =1 100.0 63.7
Social security benefi ts =1 100.0 62.9
Unemployment, workers’ comp and welfare benefi ts =11 75.0 56.9
Government health benefi ts =1 100.0 54.4
BUSINESS-TO-GOVERNMENT (B2G) =33 75.0 73.3Income tax payments =1 100.0 80.2
VAT/sales tax payments =41 75.0 78.6
Social security and other contributions =44 50.0 71.8
Company registration and payment of fees =23 75.0 62.5
GOVERNMENT-TO-BUSINESS (G2B) =21 81.3 58.3Income tax refunds =1 100.0 62.5
VAT/sales tax refunds =35 50.0 61.3
Payments for goods and services =1 100.0 63.3
Disbursement of loans =11 75.0 46.0
Rank Score Average
INFRASTRUCTURE 32 46.5 49.5Number of ATMs per 10,000 people =10 51.1 28.5
Number of POS terminals per 10,000 people 16 34.6 20.0
Diffusion of broadband 38 19.3 34.5
Public-access terminals per capita =26 75.0 76.2
Mobile subscriptions per 100 people 32 42.1 42.8
Level of development of stored value cards =38 50.0 72.2
Level of development of 3G and other technologies =28 75.0 68.1
Level of development of contactless and mobile payments =36 25.0 53.6
SOCIAL AND ECONOMIC CONTEXT 28 65.2 60.9Literacy level 45 77.6 80.5
Educational level 35 52.7 53.6
Internet/technology savviness =34 50.0 66.5
Percentage of population using banks/other fi nancial institutions =31 50.0 60.5
Percentage of businesses using banks/other fi nancial institutions =24 75.0 69.0
Provision of fi nancial education =30 75.0 73.4
Proportion of businesses placing orders via the Internet =7 75.0 41.1
Proportion of consumer orders of goods via the Internet 32 31.2 38.8
Percentage of population with payment card(s) =1 100.0 64.9
POLICY CONTEXT =30 75.0 73.5Government commitment to e-payment security =25 75.0 74.2
Government commitment to integrating the informal economy =36 50.0 63.3
Government commitment to the Financial Action Task Force (FATF) =1 100.0 83.1
BrazilAverage for all countries
CITIZEN-TO-GOVERNMENT (C2G)
GOVERNMENT-TO-CITIZEN (G2C)
BUSINESS-TO-GOVERNMENT(B2G)
INFRASTRUCTURE
SOCIAL ANDECONOMIC
CONTEXT
POLICYCONTEXT
GOVERNMENT-TO-BUSINESS (G2B)
100
75
50
25
0
Rank Score Average
OVERALL SCORE 16 82.5 62.5
CITIZEN-TO-GOVERNMENT (C2G) =12 80.0 62.7Income tax payments =1 100.0 83.1
Social security contributions =1 100.0 69.8
Obtaining/paying for an ID card =31 0.0 28.2
Automotive costs: tolls and fi nes =1 100.0 71.4
Public transit payments =1 100.0 60.9
GOVERNMENT-TO-CITIZEN (G2C) =18 81.3 59.5Income tax refunds =1 100.0 63.7
Social security benefi ts =20 75.0 62.9
Unemployment, workers’ comp and welfare benefi ts =1 100.0 56.9
Government health benefi ts =30 50.0 54.4
BUSINESS-TO-GOVERNMENT (B2G) =1 100.0 73.3Income tax payments =1 100.0 80.2
VAT/sales tax payments =1 100.0 78.6
Social security and other contributions =1 100.0 71.8
Company registration and payment of fees =1 100.0 62.5
GOVERNMENT-TO-BUSINESS (G2B) =26 75.0 58.3Income tax refunds =32 75.0 62.5
VAT/sales tax refunds =32 75.0 61.3
Payments for goods and services =25 75.0 63.3
Disbursement of loans =11 75.0 46.0
Rank Score Average
INFRASTRUCTURE 8 73.3 49.5Number of ATMs per 10,000 people 1 100.0 28.5
Number of POS terminals per 10,000 people 8 39.3 20.0
Diffusion of broadband 9 72.4 34.5
Public-access terminals per capita =1 100.0 76.2
Mobile subscriptions per 100 people 53 24.6 42.8
Level of development of stored value cards =1 100.0 72.2
Level of development of 3G and other technologies =1 100.0 68.1
Level of development of contactless and mobile payments =25 50.0 53.6
SOCIAL AND ECONOMIC CONTEXT 4 93.1 60.9Literacy level =9 97.8 80.5
Educational level 16 67.5 53.6
Internet/technology savviness =1 100.0 66.5Percentage of population using banks/other fi nancial institutions =1 100.0 60.5Percentage of businesses using banks/other fi nancial institutions =1 100.0 69.0
Provision of fi nancial education =1 100.0 73.4Proportion of businesses placing orders via the Internet =1 100.0 41.1Proportion of consumer orders of goods via the Internet 15 72.9 38.8
Percentage of population with payment card(s) =1 100.0 64.9
POLICY CONTEXT =30 75.0 73.5Government commitment to e-payment security =25 75.0 74.2Government commitment to integrating the informal economy =8 75.0 63.3Government commitment to the Financial Action Task Force (FATF) =38 75.0 83.1
CanadaAverage for all countries
CITIZEN-TO-GOVERNMENT (C2G)
GOVERNMENT-TO-CITIZEN (G2C)
BUSINESS-TO-GOVERNMENT(B2G)
INFRASTRUCTURE
SOCIAL ANDECONOMIC
CONTEXT
POLICYCONTEXT
GOVERNMENT-TO-BUSINESS (G2B)
100
75
50
25
0
Brazil Nominal GDP (US$ bn) 2,087.9
Population (m) 190.8
GDP per capita (US$) 10,945.3
Canada Nominal GDP (US$ bn) 1,577.0
Population (m) 34.0
GDP per capita (US$) 46,334.1
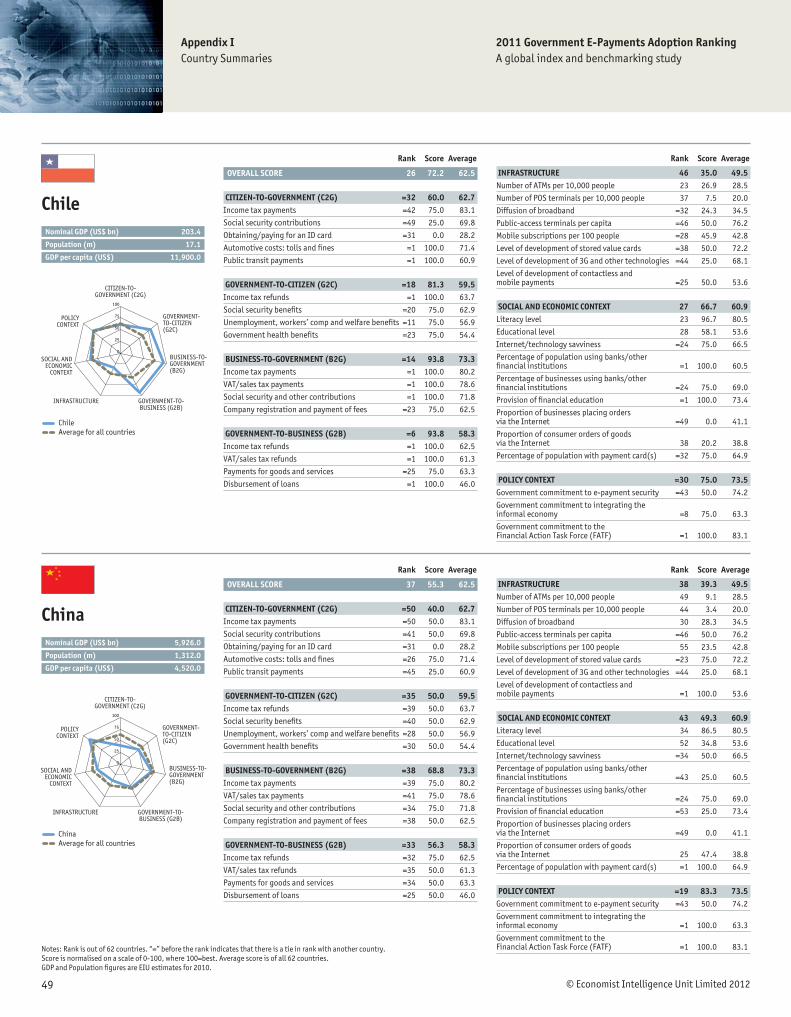
© Economist Intelligence Unit Limited 201249
Notes: Rank is out of 62 countries. “=” before the rank indicates that there is a tie in rank with another country. Score is normalised on a scale of 0-100, where 100=best. Average score is of all 62 countries. GDP and Population fi gures are EIU estimates for 2010.
Appendix ICountry Summaries
2011 Government E-Payments Adoption RankingA global index and benchmarking study
Rank Score Average
OVERALL SCORE 26 72.2 62.5
CITIZEN-TO-GOVERNMENT (C2G) =32 60.0 62.7Income tax payments =42 75.0 83.1
Social security contributions =49 25.0 69.8
Obtaining/paying for an ID card =31 0.0 28.2
Automotive costs: tolls and fi nes =1 100.0 71.4
Public transit payments =1 100.0 60.9
GOVERNMENT-TO-CITIZEN (G2C) =18 81.3 59.5Income tax refunds =1 100.0 63.7
Social security benefi ts =20 75.0 62.9
Unemployment, workers’ comp and welfare benefi ts =11 75.0 56.9
Government health benefi ts =23 75.0 54.4
BUSINESS-TO-GOVERNMENT (B2G) =14 93.8 73.3Income tax payments =1 100.0 80.2
VAT/sales tax payments =1 100.0 78.6
Social security and other contributions =1 100.0 71.8
Company registration and payment of fees =23 75.0 62.5
GOVERNMENT-TO-BUSINESS (G2B) =6 93.8 58.3Income tax refunds =1 100.0 62.5
VAT/sales tax refunds =1 100.0 61.3
Payments for goods and services =25 75.0 63.3
Disbursement of loans =1 100.0 46.0
Rank Score Average
INFRASTRUCTURE 46 35.0 49.5Number of ATMs per 10,000 people 23 26.9 28.5
Number of POS terminals per 10,000 people 37 7.5 20.0
Diffusion of broadband =32 24.3 34.5
Public-access terminals per capita =46 50.0 76.2
Mobile subscriptions per 100 people =28 45.9 42.8
Level of development of stored value cards =38 50.0 72.2
Level of development of 3G and other technologies =44 25.0 68.1
Level of development of contactless and mobile payments =25 50.0 53.6
SOCIAL AND ECONOMIC CONTEXT 27 66.7 60.9Literacy level 23 96.7 80.5
Educational level 28 58.1 53.6
Internet/technology savviness =24 75.0 66.5
Percentage of population using banks/other fi nancial institutions =1 100.0 60.5
Percentage of businesses using banks/other fi nancial institutions =24 75.0 69.0
Provision of fi nancial education =1 100.0 73.4
Proportion of businesses placing orders via the Internet =49 0.0 41.1
Proportion of consumer orders of goods via the Internet 38 20.2 38.8
Percentage of population with payment card(s) =32 75.0 64.9
POLICY CONTEXT =30 75.0 73.5Government commitment to e-payment security =43 50.0 74.2
Government commitment to integrating the informal economy =8 75.0 63.3
Government commitment to the Financial Action Task Force (FATF) =1 100.0 83.1
ChileAverage for all countries
CITIZEN-TO-GOVERNMENT (C2G)
GOVERNMENT-TO-CITIZEN (G2C)
BUSINESS-TO-GOVERNMENT(B2G)
INFRASTRUCTURE
SOCIAL ANDECONOMIC
CONTEXT
POLICYCONTEXT
GOVERNMENT-TO-BUSINESS (G2B)
100
75
50
25
0
Rank Score Average
OVERALL SCORE 37 55.3 62.5
CITIZEN-TO-GOVERNMENT (C2G) =50 40.0 62.7Income tax payments =50 50.0 83.1
Social security contributions =41 50.0 69.8
Obtaining/paying for an ID card =31 0.0 28.2
Automotive costs: tolls and fi nes =26 75.0 71.4
Public transit payments =45 25.0 60.9
GOVERNMENT-TO-CITIZEN (G2C) =35 50.0 59.5Income tax refunds =39 50.0 63.7
Social security benefi ts =40 50.0 62.9
Unemployment, workers’ comp and welfare benefi ts =28 50.0 56.9
Government health benefi ts =30 50.0 54.4
BUSINESS-TO-GOVERNMENT (B2G) =38 68.8 73.3Income tax payments =39 75.0 80.2
VAT/sales tax payments =41 75.0 78.6
Social security and other contributions =34 75.0 71.8
Company registration and payment of fees =38 50.0 62.5
GOVERNMENT-TO-BUSINESS (G2B) =33 56.3 58.3Income tax refunds =32 75.0 62.5
VAT/sales tax refunds =35 50.0 61.3
Payments for goods and services =34 50.0 63.3
Disbursement of loans =25 50.0 46.0
Rank Score Average
INFRASTRUCTURE 38 39.3 49.5Number of ATMs per 10,000 people 49 9.1 28.5
Number of POS terminals per 10,000 people 44 3.4 20.0
Diffusion of broadband 30 28.3 34.5
Public-access terminals per capita =46 50.0 76.2
Mobile subscriptions per 100 people 55 23.5 42.8
Level of development of stored value cards =23 75.0 72.2
Level of development of 3G and other technologies =44 25.0 68.1
Level of development of contactless and mobile payments =1 100.0 53.6
SOCIAL AND ECONOMIC CONTEXT 43 49.3 60.9Literacy level 34 86.5 80.5
Educational level 52 34.8 53.6
Internet/technology savviness =34 50.0 66.5
Percentage of population using banks/other fi nancial institutions =43 25.0 60.5
Percentage of businesses using banks/other fi nancial institutions =24 75.0 69.0
Provision of fi nancial education =53 25.0 73.4
Proportion of businesses placing orders via the Internet =49 0.0 41.1
Proportion of consumer orders of goods via the Internet 25 47.4 38.8
Percentage of population with payment card(s) =1 100.0 64.9
POLICY CONTEXT =19 83.3 73.5Government commitment to e-payment security =43 50.0 74.2
Government commitment to integrating the informal economy =1 100.0 63.3
Government commitment to the Financial Action Task Force (FATF) =1 100.0 83.1
ChinaAverage for all countries
CITIZEN-TO-GOVERNMENT (C2G)
GOVERNMENT-TO-CITIZEN (G2C)
BUSINESS-TO-GOVERNMENT(B2G)
INFRASTRUCTURE
SOCIAL ANDECONOMIC
CONTEXT
POLICYCONTEXT
GOVERNMENT-TO-BUSINESS (G2B)
100
75
50
25
0
ChileNominal GDP (US$ bn) 203.4
Population (m) 17.1
GDP per capita (US$) 11,900.0
China Nominal GDP (US$ bn) 5,926.0
Population (m) 1,312.0
GDP per capita (US$) 4,520.0

© Economist Intelligence Unit Limited 201250
Appendix ICountry Summaries
Notes: Rank is out of 62 countries. “=” before the rank indicates that there is a tie in rank with another country. Score is normalised on a scale of 0-100, where 100=best. Average score is of all 62 countries. GDP and Population fi gures are EIU estimates for 2010.
2011 Government E-Payments Adoption RankingA global index and benchmarking study
Rank Score Average
OVERALL SCORE 41 48.7 62.5
CITIZEN-TO-GOVERNMENT (C2G) =36 55.0 62.7Income tax payments =50 50.0 83.1
Social security contributions =1 100.0 69.8
Obtaining/paying for an ID card =31 0.0 28.2
Automotive costs: tolls and fi nes =1 100.0 71.4
Public transit payments =45 25.0 60.9
GOVERNMENT-TO-CITIZEN (G2C) =52 31.3 59.5Income tax refunds =46 0.0 63.7
Social security benefi ts =51 0.0 62.9
Unemployment, workers’ comp and welfare benefi ts =28 50.0 56.9
Government health benefi ts =23 75.0 54.4
BUSINESS-TO-GOVERNMENT (B2G) =38 68.8 73.3Income tax payments =47 50.0 80.2
VAT/sales tax payments =41 75.0 78.6
Social security and other contributions =1 100.0 71.8
Company registration and payment of fees =38 50.0 62.5
GOVERNMENT-TO-BUSINESS (G2B) =47 25.0 58.3Income tax refunds =46 0.0 62.5
VAT/sales tax refunds =46 0.0 61.3
Payments for goods and services =1 100.0 63.3
Disbursement of loans =42 0.0 46.0
Rank Score Average
INFRASTRUCTURE 51 31.2 49.5Number of ATMs per 10,000 people =44 13.7 28.5
Number of POS terminals per 10,000 people 39 6.8 20.0
Diffusion of broadband 37 19.5 34.5
Public-access terminals per capita =26 75.0 76.2
Mobile subscriptions per 100 people 45 34.7 42.8
Level of development of stored value cards =38 50.0 72.2
Level of development of 3G and other technologies =44 25.0 68.1
Level of development of contactless and mobile payments =36 25.0 53.6
SOCIAL AND ECONOMIC CONTEXT 36 54.7 60.9Literacy level 39 84.8 80.5
Educational level 39 50.3 53.6
Internet/technology savviness =24 75.0 66.5
Percentage of population using banks/other fi nancial institutions =31 50.0 60.5
Percentage of businesses using banks/other fi nancial institutions =24 75.0 69.0
Provision of fi nancial education =30 75.0 73.4
Proportion of businesses placing orders via the Internet =19 50.0 41.1
Proportion of consumer orders of goods via the Internet 46 7.4 38.8
Percentage of population with payment card(s) =45 25.0 64.9
POLICY CONTEXT =30 75.0 73.5Government commitment to e-payment security =25 75.0 74.2
Government commitment to integrating the informal economy =36 50.0 63.3
Government commitment to the Financial Action Task Force (FATF) =1 100.0 83.1
ColombiaAverage for all countries
CITIZEN-TO-GOVERNMENT (C2G)
GOVERNMENT-TO-CITIZEN (G2C)
BUSINESS-TO-GOVERNMENT(B2G)
INFRASTRUCTURE
SOCIAL ANDECONOMIC
CONTEXT
POLICYCONTEXT
GOVERNMENT-TO-BUSINESS (G2B)
100
75
50
25
0
Rank Score Average
OVERALL SCORE 45 47.0 62.5
CITIZEN-TO-GOVERNMENT (C2G) =36 55.0 62.7Income tax payments =42 75.0 83.1
Social security contributions =41 50.0 69.8
Obtaining/paying for an ID card =24 25.0 28.2
Automotive costs: tolls and fi nes =26 75.0 71.4
Public transit payments =36 50.0 60.9
GOVERNMENT-TO-CITIZEN (G2C) =40 43.8 59.5Income tax refunds =46 0.0 63.7
Social security benefi ts =20 75.0 62.9
Unemployment, workers’ comp and welfare benefi ts =28 50.0 56.9
Government health benefi ts =30 50.0 54.4
BUSINESS-TO-GOVERNMENT (B2G) =45 56.3 73.3Income tax payments =39 75.0 80.2
VAT/sales tax payments =41 75.0 78.6
Social security and other contributions =34 75.0 71.8
Company registration and payment of fees =50 0.0 62.5
GOVERNMENT-TO-BUSINESS (G2B) =44 31.3 58.3Income tax refunds =46 0.0 62.5
VAT/sales tax refunds =46 0.0 61.3
Payments for goods and services =34 50.0 63.3
Disbursement of loans =11 75.0 46.0
Rank Score Average
INFRASTRUCTURE 44 35.9 49.5Number of ATMs per 10,000 people 2 83.1 28.5
Number of POS terminals per 10,000 people 22 26.1 20.0
Diffusion of broadband =45 8.6 34.5
Public-access terminals per capita =26 75.0 76.2
Mobile subscriptions per 100 people 57 19.8 42.8
Level of development of stored value cards =38 50.0 72.2
Level of development of 3G and other technologies =44 25.0 68.1
Level of development of contactless and mobile payments =60 0.0 53.6
SOCIAL AND ECONOMIC CONTEXT 45 48.6 60.9Literacy level 29 91.1 80.5
Educational level 51 36.1 53.6
Internet/technology savviness =34 50.0 66.5
Percentage of population using banks/other fi nancial institutions =31 50.0 60.5
Percentage of businesses using banks/other fi nancial institutions =42 50.0 69.0
Provision of fi nancial education =44 50.0 73.4
Proportion of businesses placing orders via the Internet =1 100.0 41.1
Proportion of consumer orders of goods via the Internet 41 10.3 38.8
Percentage of population with payment card(s) =49 0.0 64.9
POLICY CONTEXT =45 58.3 73.5Government commitment to e-payment security =43 50.0 74.2
Government commitment to integrating the informal economy =36 50.0 63.3
Government commitment to the Financial Action Task Force (FATF) =38 75.0 83.1
Costa RicaAverage for all countries
CITIZEN-TO-GOVERNMENT (C2G)
GOVERNMENT-TO-CITIZEN (G2C)
BUSINESS-TO-GOVERNMENT(B2G)
INFRASTRUCTURE
SOCIAL ANDECONOMIC
CONTEXT
POLICYCONTEXT
GOVERNMENT-TO-BUSINESS (G2B)
100
75
50
25
0
Colombia Nominal GDP (US$ bn) 288.7
Population (m) 46.9
GDP per capita (US$) 6,152.5
Costa Rica Nominal GDP (US$ bn) 35.8
Population (m) 4.6
GDP per capita (US$) 7,704.4

© Economist Intelligence Unit Limited 201251
Notes: Rank is out of 62 countries. “=” before the rank indicates that there is a tie in rank with another country. Score is normalised on a scale of 0-100, where 100=best. Average score is of all 62 countries. GDP and Population fi gures are EIU estimates for 2010.
Appendix ICountry Summaries
2011 Government E-Payments Adoption RankingA global index and benchmarking study
Rank Score Average
OVERALL SCORE 14 82.8 62.5
CITIZEN-TO-GOVERNMENT (C2G) =19 75.0 62.7Income tax payments =1 100.0 83.1
Social security contributions =1 100.0 69.8
Obtaining/paying for an ID card =31 0.0 28.2
Automotive costs: tolls and fi nes =26 75.0 71.4
Public transit payments =1 100.0 60.9
GOVERNMENT-TO-CITIZEN (G2C) =6 93.8 59.5Income tax refunds =1 100.0 63.7
Social security benefi ts =1 100.0 62.9
Unemployment, workers’ comp and welfare benefi ts =11 75.0 56.9
Government health benefi ts =1 100.0 54.4
BUSINESS-TO-GOVERNMENT (B2G) =14 93.8 73.3Income tax payments =1 100.0 80.2
VAT/sales tax payments =1 100.0 78.6
Social security and other contributions =1 100.0 71.8
Company registration and payment of fees =23 75.0 62.5
GOVERNMENT-TO-BUSINESS (G2B) =6 93.8 58.3Income tax refunds =1 100.0 62.5
VAT/sales tax refunds =32 75.0 61.3
Payments for goods and services =1 100.0 63.3
Disbursement of loans =1 100.0 46.0
Rank Score Average
INFRASTRUCTURE 22 62.8 49.5Number of ATMs per 10,000 people 38 18.3 28.5
Number of POS terminals per 10,000 people 31 13.4 20.0
Diffusion of broadband 24 43.4 34.5
Public-access terminals per capita =1 100.0 76.2
Mobile subscriptions per 100 people =16 52.6 42.8
Level of development of stored value cards =1 100.0 72.2
Level of development of 3G and other technologies =1 100.0 68.1
Level of development of contactless and mobile payments =16 75.0 53.6
SOCIAL AND ECONOMIC CONTEXT 23 68.9 60.9Literacy level =9 97.8 80.5
Educational level 20 65.0 53.6
Internet/technology savviness =1 100.0 66.5
Percentage of population using banks/other fi nancial institutions =23 75.0 60.5
Percentage of businesses using banks/other fi nancial institutions =1 100.0 69.0
Provision of fi nancial education =53 25.0 73.4
Proportion of businesses placing orders via the Internet =19 50.0 41.1
Proportion of consumer orders of goods via the Internet 31 32.5 38.8
Percentage of population with payment card(s) =32 75.0 64.9
POLICY CONTEXT =4 91.7 73.5Government commitment to e-payment security =1 100.0 74.2
Government commitment to integrating the informal economy =8 75.0 63.3
Government commitment to the Financial Action Task Force (FATF) =1 100.0 83.1
Czech RepublicAverage for all countries
CITIZEN-TO-GOVERNMENT (C2G)
GOVERNMENT-TO-CITIZEN (G2C)
BUSINESS-TO-GOVERNMENT(B2G)
INFRASTRUCTURE
SOCIAL ANDECONOMIC
CONTEXT
POLICYCONTEXT
GOVERNMENT-TO-BUSINESS (G2B)
100
75
50
25
0
Rank Score Average
OVERALL SCORE 9 87.6 62.5
CITIZEN-TO-GOVERNMENT (C2G) =2 95.0 62.7Income tax payments =1 100.0 83.1
Social security contributions =1 100.0 69.8
Obtaining/paying for an ID card =6 75.0 28.2
Automotive costs: tolls and fi nes =1 100.0 71.4
Public transit payments =1 100.0 60.9
GOVERNMENT-TO-CITIZEN (G2C) =6 93.8 59.5Income tax refunds =1 100.0 63.7
Social security benefi ts =20 75.0 62.9
Unemployment, workers’ comp and welfare benefi ts =1 100.0 56.9
Government health benefi ts =1 100.0 54.4
BUSINESS-TO-GOVERNMENT (B2G) =14 93.8 73.3Income tax payments =1 100.0 80.2
VAT/sales tax payments =1 100.0 78.6
Social security and other contributions =1 100.0 71.8
Company registration and payment of fees =23 75.0 62.5
GOVERNMENT-TO-BUSINESS (G2B) =12 87.5 58.3Income tax refunds =1 100.0 62.5
VAT/sales tax refunds =1 100.0 61.3
Payments for goods and services =25 75.0 63.3
Disbursement of loans =11 75.0 46.0
Rank Score Average
INFRASTRUCTURE 25 61.8 49.5Number of ATMs per 10,000 people =27 24.2 28.5
Number of POS terminals per 10,000 people 21 28.9 20.0
Diffusion of broadband 2 85.5 34.5
Public-access terminals per capita =1 100.0 76.2
Mobile subscriptions per 100 people =10 56.0 42.8
Level of development of stored value cards =38 50.0 72.2
Level of development of 3G and other technologies =1 100.0 68.1
Level of development of contactless and mobile payments =25 50.0 53.6
SOCIAL AND ECONOMIC CONTEXT 8 89.9 60.9Literacy level =9 97.8 80.5
Educational level 5 74.5 53.6
Internet/technology savviness =1 100.0 66.5
Percentage of population using banks/other fi nancial institutions =1 100.0 60.5
Percentage of businesses using banks/other fi nancial institutions =1 100.0 69.0
Provision of fi nancial education =1 100.0 73.4
Proportion of businesses placing orders via the Internet =19 50.0 41.1
Proportion of consumer orders of goods via the Internet 6 86.7 38.8
Percentage of population with payment card(s) =1 100.0 64.9
POLICY CONTEXT =4 91.7 73.5Government commitment to e-payment security =1 100.0 74.2
Government commitment to integrating the informal economy =8 75.0 63.3
Government commitment to the Financial Action Task Force (FATF) =1 100.0 83.1
DenmarkAverage for all countries
CITIZEN-TO-GOVERNMENT (C2G)
GOVERNMENT-TO-CITIZEN (G2C)
BUSINESS-TO-GOVERNMENT(B2G)
INFRASTRUCTURE
SOCIAL ANDECONOMIC
CONTEXT
POLICYCONTEXT
GOVERNMENT-TO-BUSINESS (G2B)
100
75
50
25
0
Czech RepublicNominal GDP (US$ bn) 192.0
Population (m) 10.5
GDP per capita (US$) 18,231.6
Denmark Nominal GDP (US$ bn) 309.9
Population (m) 5.6
GDP per capita (US$) 55,800.0

© Economist Intelligence Unit Limited 201252
Appendix ICountry Summaries
Notes: Rank is out of 62 countries. “=” before the rank indicates that there is a tie in rank with another country. Score is normalised on a scale of 0-100, where 100=best. Average score is of all 62 countries. GDP and Population fi gures are EIU estimates for 2010.
2011 Government E-Payments Adoption RankingA global index and benchmarking study
Rank Score Average
OVERALL SCORE 38 54.7 62.5
CITIZEN-TO-GOVERNMENT (C2G) =36 55.0 62.7Income tax payments =1 100.0 83.1
Social security contributions =41 50.0 69.8
Obtaining/paying for an ID card =31 0.0 28.2
Automotive costs: tolls and fi nes =44 50.0 71.4
Public transit payments =19 75.0 60.9
GOVERNMENT-TO-CITIZEN (G2C) =47 37.5 59.5Income tax refunds =1 100.0 63.7
Social security benefi ts =51 0.0 62.9
Unemployment, workers’ comp and welfare benefi ts =28 50.0 56.9
Government health benefi ts =44 0.0 54.4
BUSINESS-TO-GOVERNMENT (B2G) =1 100.0 73.3Income tax payments =1 100.0 80.2
VAT/sales tax payments =1 100.0 78.6
Social security and other contributions =1 100.0 71.8
Company registration and payment of fees =1 100.0 62.5
GOVERNMENT-TO-BUSINESS (G2B) =33 56.3 58.3Income tax refunds =1 100.0 62.5
VAT/sales tax refunds =1 100.0 61.3
Payments for goods and services =48 25.0 63.3
Disbursement of loans =42 0.0 46.0
Rank Score Average
INFRASTRUCTURE 50 32.1 49.5Number of ATMs per 10,000 people 47 12.3 28.5
Number of POS terminals per 10,000 people 42 5.1 20.0
Diffusion of broadband =45 8.6 34.5
Public-access terminals per capita =26 75.0 76.2
Mobile subscriptions per 100 people 50 30.8 42.8
Level of development of stored value cards =38 50.0 72.2
Level of development of 3G and other technologies =44 25.0 68.1
Level of development of contactless and mobile payments =25 50.0 53.6
SOCIAL AND ECONOMIC CONTEXT 50 43.5 60.9Literacy level 49 73.6 80.5
Educational level 48 37.6 53.6
Internet/technology savviness =34 50.0 66.5
Percentage of population using banks/other fi nancial institutions =43 25.0 60.5
Percentage of businesses using banks/other fi nancial institutions =24 75.0 69.0
Provision of fi nancial education =30 75.0 73.4
Proportion of businesses placing orders via the Internet =19 50.0 41.1
Proportion of consumer orders of goods via the Internet =51 4.9 38.8
Percentage of population with payment card(s) =49 0.0 64.9
POLICY CONTEXT =45 58.3 73.5Government commitment to e-payment security =25 75.0 74.2
Government commitment to integrating the informal economy =55 25.0 63.3
Government commitment to the Financial Action Task Force (FATF) =38 75.0 83.1
Dominican RepublicAverage for all countries
CITIZEN-TO-GOVERNMENT (C2G)
GOVERNMENT-TO-CITIZEN (G2C)
BUSINESS-TO-GOVERNMENT(B2G)
INFRASTRUCTURE
SOCIAL ANDECONOMIC
CONTEXT
POLICYCONTEXT
GOVERNMENT-TO-BUSINESS (G2B)
100
75
50
25
0
Rank Score Average
OVERALL SCORE 31 62.1 62.5
CITIZEN-TO-GOVERNMENT (C2G) =28 65.0 62.7Income tax payments =42 75.0 83.1
Social security contributions =1 100.0 69.8
Obtaining/paying for an ID card =31 0.0 28.2
Automotive costs: tolls and fi nes =26 75.0 71.4
Public transit payments =19 75.0 60.9
GOVERNMENT-TO-CITIZEN (G2C) =1 100.0 59.5Income tax refunds =1 100.0 63.7
Social security benefi ts =1 100.0 62.9
Unemployment, workers’ comp and welfare benefi ts =1 100.0 56.9
Government health benefi ts =1 100.0 54.4
BUSINESS-TO-GOVERNMENT (B2G) =14 93.8 73.3Income tax payments =39 75.0 80.2
VAT/sales tax payments =1 100.0 78.6
Social security and other contributions =1 100.0 71.8
Company registration and payment of fees =1 100.0 62.5
GOVERNMENT-TO-BUSINESS (G2B) =30 62.5 58.3Income tax refunds =1 100.0 62.5
VAT/sales tax refunds =1 100.0 61.3
Payments for goods and services =34 50.0 63.3
Disbursement of loans =42 0.0 46.0
Rank Score Average
INFRASTRUCTURE 53 28.2 49.5Number of ATMs per 10,000 people 54 5.9 28.5
Number of POS terminals per 10,000 people 59 0.3 20.0
Diffusion of broadband 50 6.3 34.5
Public-access terminals per capita =46 50.0 76.2
Mobile subscriptions per 100 people 41 37.8 42.8
Level of development of stored value cards =38 50.0 72.2
Level of development of 3G and other technologies =39 50.0 68.1
Level of development of contactless and mobile payments =36 25.0 53.6
SOCIAL AND ECONOMIC CONTEXT 55 35.3 60.9Literacy level 54 64.5 80.5
Educational level 34 52.8 53.6
Internet/technology savviness =51 25.0 66.5
Percentage of population using banks/other fi nancial institutions =31 50.0 60.5
Percentage of businesses using banks/other fi nancial institutions =51 25.0 69.0
Provision of fi nancial education =30 75.0 73.4
Proportion of businesses placing orders via the Internet =31 25.0 41.1
Proportion of consumer orders of goods via the Internet 57 0.6 38.8
Percentage of population with payment card(s) =49 0.0 64.9
POLICY CONTEXT =53 50.0 73.5Government commitment to e-payment security =43 50.0 74.2
Government commitment to integrating the informal economy =36 50.0 63.3
Government commitment to the Financial Action Task Force (FATF) =54 50.0 83.1
EcuadorAverage for all countries
CITIZEN-TO-GOVERNMENT (C2G)
GOVERNMENT-TO-CITIZEN (G2C)
BUSINESS-TO-GOVERNMENT(B2G)
INFRASTRUCTURE
SOCIAL ANDECONOMIC
CONTEXT
POLICYCONTEXT
GOVERNMENT-TO-BUSINESS (G2B)
100
75
50
25
0
Dominican Republic Nominal GDP (US$ bn) 52.1
Population (m) 9.6
GDP per capita (US$) 5,420.0
Ecuador Nominal GDP (US$ bn) 58.0
Population (m) 14.3
GDP per capita (US$) 4,050.0
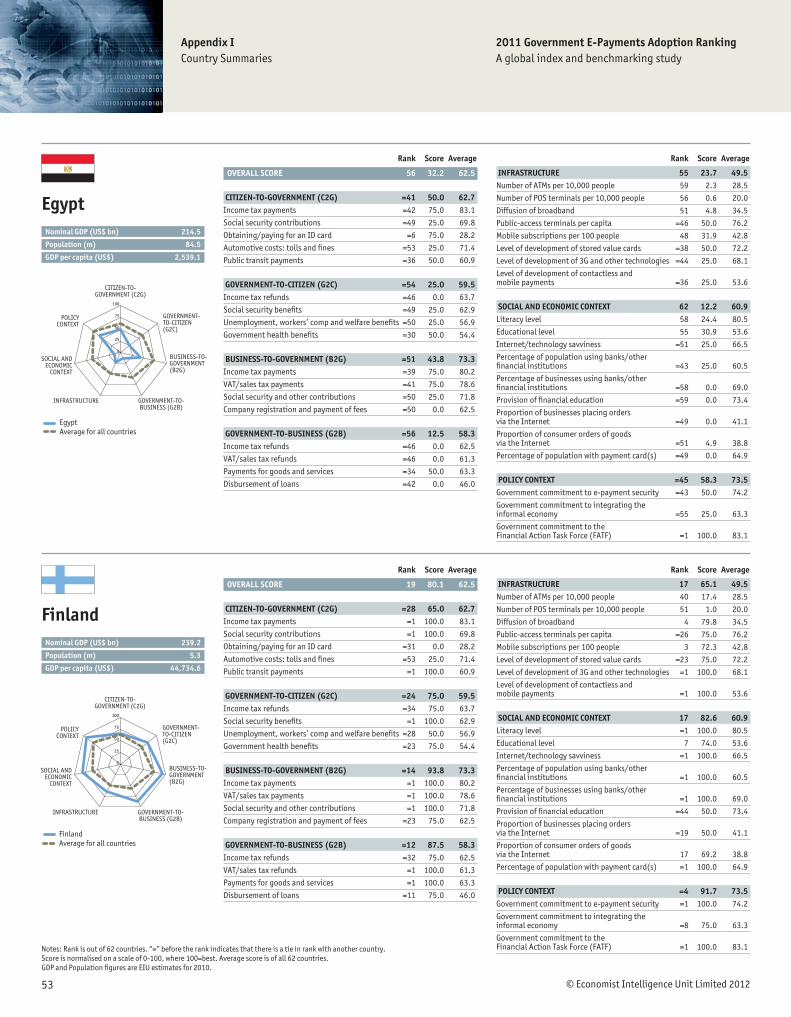
© Economist Intelligence Unit Limited 201253
Notes: Rank is out of 62 countries. “=” before the rank indicates that there is a tie in rank with another country. Score is normalised on a scale of 0-100, where 100=best. Average score is of all 62 countries. GDP and Population fi gures are EIU estimates for 2010.
Appendix ICountry Summaries
2011 Government E-Payments Adoption RankingA global index and benchmarking study
Rank Score Average
OVERALL SCORE 56 32.2 62.5
CITIZEN-TO-GOVERNMENT (C2G) =41 50.0 62.7Income tax payments =42 75.0 83.1
Social security contributions =49 25.0 69.8
Obtaining/paying for an ID card =6 75.0 28.2
Automotive costs: tolls and fi nes =53 25.0 71.4
Public transit payments =36 50.0 60.9
GOVERNMENT-TO-CITIZEN (G2C) =54 25.0 59.5Income tax refunds =46 0.0 63.7
Social security benefi ts =49 25.0 62.9
Unemployment, workers’ comp and welfare benefi ts =50 25.0 56.9
Government health benefi ts =30 50.0 54.4
BUSINESS-TO-GOVERNMENT (B2G) =51 43.8 73.3Income tax payments =39 75.0 80.2
VAT/sales tax payments =41 75.0 78.6
Social security and other contributions =50 25.0 71.8
Company registration and payment of fees =50 0.0 62.5
GOVERNMENT-TO-BUSINESS (G2B) =56 12.5 58.3Income tax refunds =46 0.0 62.5
VAT/sales tax refunds =46 0.0 61.3
Payments for goods and services =34 50.0 63.3
Disbursement of loans =42 0.0 46.0
Rank Score Average
INFRASTRUCTURE 55 23.7 49.5Number of ATMs per 10,000 people 59 2.3 28.5
Number of POS terminals per 10,000 people 56 0.6 20.0
Diffusion of broadband 51 4.8 34.5
Public-access terminals per capita =46 50.0 76.2
Mobile subscriptions per 100 people 48 31.9 42.8
Level of development of stored value cards =38 50.0 72.2
Level of development of 3G and other technologies =44 25.0 68.1
Level of development of contactless and mobile payments =36 25.0 53.6
SOCIAL AND ECONOMIC CONTEXT 62 12.2 60.9Literacy level 58 24.4 80.5
Educational level 55 30.9 53.6
Internet/technology savviness =51 25.0 66.5
Percentage of population using banks/other fi nancial institutions =43 25.0 60.5
Percentage of businesses using banks/other fi nancial institutions =58 0.0 69.0
Provision of fi nancial education =59 0.0 73.4
Proportion of businesses placing orders via the Internet =49 0.0 41.1
Proportion of consumer orders of goods via the Internet =51 4.9 38.8
Percentage of population with payment card(s) =49 0.0 64.9
POLICY CONTEXT =45 58.3 73.5Government commitment to e-payment security =43 50.0 74.2
Government commitment to integrating the informal economy =55 25.0 63.3
Government commitment to the Financial Action Task Force (FATF) =1 100.0 83.1
EgyptAverage for all countries
CITIZEN-TO-GOVERNMENT (C2G)
GOVERNMENT-TO-CITIZEN (G2C)
BUSINESS-TO-GOVERNMENT(B2G)
INFRASTRUCTURE
SOCIAL ANDECONOMIC
CONTEXT
POLICYCONTEXT
GOVERNMENT-TO-BUSINESS (G2B)
100
75
50
25
0
Rank Score Average
OVERALL SCORE 19 80.1 62.5
CITIZEN-TO-GOVERNMENT (C2G) =28 65.0 62.7Income tax payments =1 100.0 83.1
Social security contributions =1 100.0 69.8
Obtaining/paying for an ID card =31 0.0 28.2
Automotive costs: tolls and fi nes =53 25.0 71.4
Public transit payments =1 100.0 60.9
GOVERNMENT-TO-CITIZEN (G2C) =24 75.0 59.5Income tax refunds =34 75.0 63.7
Social security benefi ts =1 100.0 62.9
Unemployment, workers’ comp and welfare benefi ts =28 50.0 56.9
Government health benefi ts =23 75.0 54.4
BUSINESS-TO-GOVERNMENT (B2G) =14 93.8 73.3Income tax payments =1 100.0 80.2
VAT/sales tax payments =1 100.0 78.6
Social security and other contributions =1 100.0 71.8
Company registration and payment of fees =23 75.0 62.5
GOVERNMENT-TO-BUSINESS (G2B) =12 87.5 58.3Income tax refunds =32 75.0 62.5
VAT/sales tax refunds =1 100.0 61.3
Payments for goods and services =1 100.0 63.3
Disbursement of loans =11 75.0 46.0
Rank Score Average
INFRASTRUCTURE 17 65.1 49.5Number of ATMs per 10,000 people 40 17.4 28.5
Number of POS terminals per 10,000 people 51 1.0 20.0
Diffusion of broadband 4 79.8 34.5
Public-access terminals per capita =26 75.0 76.2
Mobile subscriptions per 100 people 3 72.3 42.8
Level of development of stored value cards =23 75.0 72.2
Level of development of 3G and other technologies =1 100.0 68.1
Level of development of contactless and mobile payments =1 100.0 53.6
SOCIAL AND ECONOMIC CONTEXT 17 82.6 60.9Literacy level =1 100.0 80.5
Educational level 7 74.0 53.6
Internet/technology savviness =1 100.0 66.5
Percentage of population using banks/other fi nancial institutions =1 100.0 60.5
Percentage of businesses using banks/other fi nancial institutions =1 100.0 69.0
Provision of fi nancial education =44 50.0 73.4
Proportion of businesses placing orders via the Internet =19 50.0 41.1
Proportion of consumer orders of goods via the Internet 17 69.2 38.8
Percentage of population with payment card(s) =1 100.0 64.9
POLICY CONTEXT =4 91.7 73.5Government commitment to e-payment security =1 100.0 74.2
Government commitment to integrating the informal economy =8 75.0 63.3
Government commitment to the Financial Action Task Force (FATF) =1 100.0 83.1
FinlandAverage for all countries
CITIZEN-TO-GOVERNMENT (C2G)
GOVERNMENT-TO-CITIZEN (G2C)
BUSINESS-TO-GOVERNMENT(B2G)
INFRASTRUCTURE
SOCIAL ANDECONOMIC
CONTEXT
POLICYCONTEXT
GOVERNMENT-TO-BUSINESS (G2B)
100
75
50
25
0
EgyptNominal GDP (US$ bn) 214.5
Population (m) 84.5
GDP per capita (US$) 2,539.1
Finland Nominal GDP (US$ bn) 239.2
Population (m) 5.3
GDP per capita (US$) 44,734.6
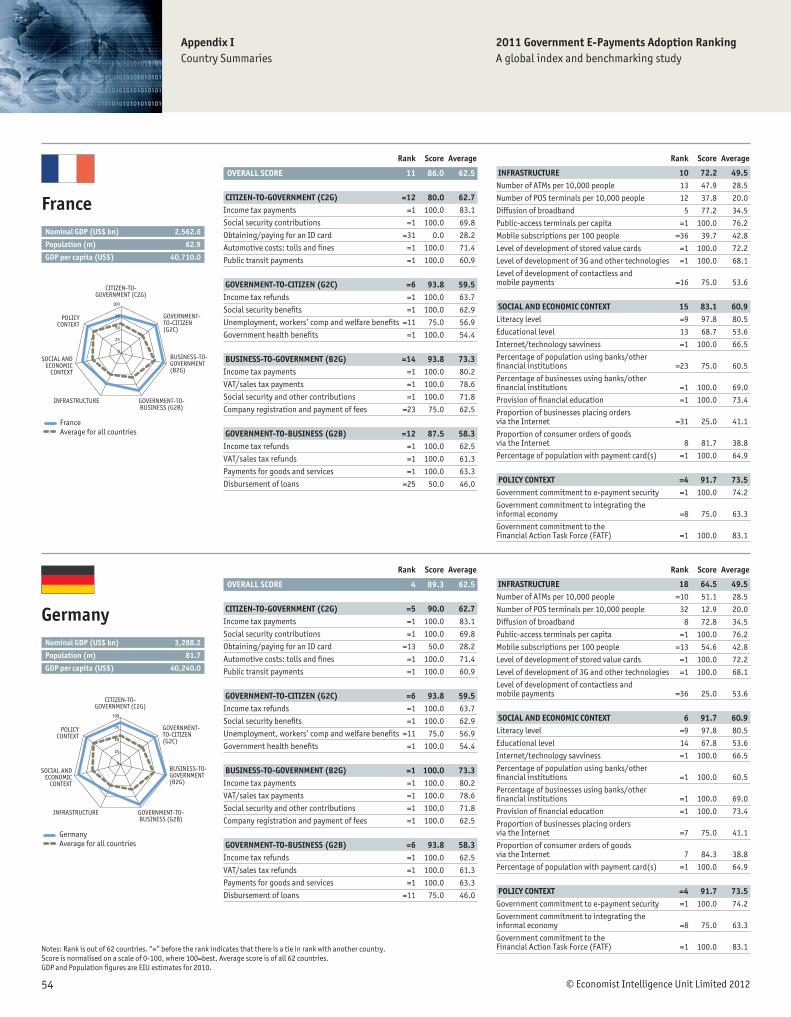
© Economist Intelligence Unit Limited 201254
Appendix ICountry Summaries
Notes: Rank is out of 62 countries. “=” before the rank indicates that there is a tie in rank with another country. Score is normalised on a scale of 0-100, where 100=best. Average score is of all 62 countries. GDP and Population fi gures are EIU estimates for 2010.
2011 Government E-Payments Adoption RankingA global index and benchmarking study
Rank Score Average
OVERALL SCORE 11 86.0 62.5
CITIZEN-TO-GOVERNMENT (C2G) =12 80.0 62.7Income tax payments =1 100.0 83.1
Social security contributions =1 100.0 69.8
Obtaining/paying for an ID card =31 0.0 28.2
Automotive costs: tolls and fi nes =1 100.0 71.4
Public transit payments =1 100.0 60.9
GOVERNMENT-TO-CITIZEN (G2C) =6 93.8 59.5Income tax refunds =1 100.0 63.7
Social security benefi ts =1 100.0 62.9
Unemployment, workers’ comp and welfare benefi ts =11 75.0 56.9
Government health benefi ts =1 100.0 54.4
BUSINESS-TO-GOVERNMENT (B2G) =14 93.8 73.3Income tax payments =1 100.0 80.2
VAT/sales tax payments =1 100.0 78.6
Social security and other contributions =1 100.0 71.8
Company registration and payment of fees =23 75.0 62.5
GOVERNMENT-TO-BUSINESS (G2B) =12 87.5 58.3Income tax refunds =1 100.0 62.5
VAT/sales tax refunds =1 100.0 61.3
Payments for goods and services =1 100.0 63.3
Disbursement of loans =25 50.0 46.0
Rank Score Average
INFRASTRUCTURE 10 72.2 49.5Number of ATMs per 10,000 people 13 47.9 28.5
Number of POS terminals per 10,000 people 12 37.8 20.0
Diffusion of broadband 5 77.2 34.5
Public-access terminals per capita =1 100.0 76.2
Mobile subscriptions per 100 people =36 39.7 42.8
Level of development of stored value cards =1 100.0 72.2
Level of development of 3G and other technologies =1 100.0 68.1
Level of development of contactless and mobile payments =16 75.0 53.6
SOCIAL AND ECONOMIC CONTEXT 15 83.1 60.9Literacy level =9 97.8 80.5
Educational level 13 68.7 53.6
Internet/technology savviness =1 100.0 66.5
Percentage of population using banks/other fi nancial institutions =23 75.0 60.5
Percentage of businesses using banks/other fi nancial institutions =1 100.0 69.0
Provision of fi nancial education =1 100.0 73.4
Proportion of businesses placing orders via the Internet =31 25.0 41.1
Proportion of consumer orders of goods via the Internet 8 81.7 38.8
Percentage of population with payment card(s) =1 100.0 64.9
POLICY CONTEXT =4 91.7 73.5Government commitment to e-payment security =1 100.0 74.2
Government commitment to integrating the informal economy =8 75.0 63.3
Government commitment to the Financial Action Task Force (FATF) =1 100.0 83.1
FranceAverage for all countries
CITIZEN-TO-GOVERNMENT (C2G)
GOVERNMENT-TO-CITIZEN (G2C)
BUSINESS-TO-GOVERNMENT(B2G)
INFRASTRUCTURE
SOCIAL ANDECONOMIC
CONTEXT
POLICYCONTEXT
GOVERNMENT-TO-BUSINESS (G2B)
100
75
50
25
0
Rank Score Average
OVERALL SCORE 4 89.3 62.5
CITIZEN-TO-GOVERNMENT (C2G) =5 90.0 62.7Income tax payments =1 100.0 83.1
Social security contributions =1 100.0 69.8
Obtaining/paying for an ID card =13 50.0 28.2
Automotive costs: tolls and fi nes =1 100.0 71.4
Public transit payments =1 100.0 60.9
GOVERNMENT-TO-CITIZEN (G2C) =6 93.8 59.5Income tax refunds =1 100.0 63.7
Social security benefi ts =1 100.0 62.9
Unemployment, workers’ comp and welfare benefi ts =11 75.0 56.9
Government health benefi ts =1 100.0 54.4
BUSINESS-TO-GOVERNMENT (B2G) =1 100.0 73.3Income tax payments =1 100.0 80.2
VAT/sales tax payments =1 100.0 78.6
Social security and other contributions =1 100.0 71.8
Company registration and payment of fees =1 100.0 62.5
GOVERNMENT-TO-BUSINESS (G2B) =6 93.8 58.3Income tax refunds =1 100.0 62.5
VAT/sales tax refunds =1 100.0 61.3
Payments for goods and services =1 100.0 63.3
Disbursement of loans =11 75.0 46.0
Rank Score Average
INFRASTRUCTURE 18 64.5 49.5Number of ATMs per 10,000 people =10 51.1 28.5
Number of POS terminals per 10,000 people 32 12.9 20.0
Diffusion of broadband 8 72.8 34.5
Public-access terminals per capita =1 100.0 76.2
Mobile subscriptions per 100 people =13 54.6 42.8
Level of development of stored value cards =1 100.0 72.2
Level of development of 3G and other technologies =1 100.0 68.1
Level of development of contactless and mobile payments =36 25.0 53.6
SOCIAL AND ECONOMIC CONTEXT 6 91.7 60.9Literacy level =9 97.8 80.5
Educational level 14 67.8 53.6
Internet/technology savviness =1 100.0 66.5
Percentage of population using banks/other fi nancial institutions =1 100.0 60.5
Percentage of businesses using banks/other fi nancial institutions =1 100.0 69.0
Provision of fi nancial education =1 100.0 73.4
Proportion of businesses placing orders via the Internet =7 75.0 41.1
Proportion of consumer orders of goods via the Internet 7 84.3 38.8
Percentage of population with payment card(s) =1 100.0 64.9
POLICY CONTEXT =4 91.7 73.5Government commitment to e-payment security =1 100.0 74.2
Government commitment to integrating the informal economy =8 75.0 63.3
Government commitment to the Financial Action Task Force (FATF) =1 100.0 83.1
GermanyAverage for all countries
CITIZEN-TO-GOVERNMENT (C2G)
GOVERNMENT-TO-CITIZEN (G2C)
BUSINESS-TO-GOVERNMENT(B2G)
INFRASTRUCTURE
SOCIAL ANDECONOMIC
CONTEXT
POLICYCONTEXT
GOVERNMENT-TO-BUSINESS (G2B)
100
75
50
25
0
France Nominal GDP (US$ bn) 2,562.6
Population (m) 62.9
GDP per capita (US$) 40,710.0
Germany Nominal GDP (US$ bn) 3,288.2
Population (m) 81.7
GDP per capita (US$) 40,240.0

© Economist Intelligence Unit Limited 201255
Notes: Rank is out of 62 countries. “=” before the rank indicates that there is a tie in rank with another country. Score is normalised on a scale of 0-100, where 100=best. Average score is of all 62 countries. GDP and Population fi gures are EIU estimates for 2010.
Appendix ICountry Summaries
2011 Government E-Payments Adoption RankingA global index and benchmarking study
Rank Score Average
OVERALL SCORE 15 82.7 62.5
CITIZEN-TO-GOVERNMENT (C2G) 1 100.0 62.7Income tax payments =1 100.0 83.1
Social security contributions =1 100.0 69.8
Obtaining/paying for an ID card =1 100.0 28.2
Automotive costs: tolls and fi nes =1 100.0 71.4
Public transit payments =1 100.0 60.9
GOVERNMENT-TO-CITIZEN (G2C) =14 87.5 59.5Income tax refunds =34 75.0 63.7
Social security benefi ts =1 100.0 62.9
Unemployment, workers’ comp and welfare benefi ts =1 100.0 56.9
Government health benefi ts =23 75.0 54.4
BUSINESS-TO-GOVERNMENT (B2G) =14 93.8 73.3Income tax payments =39 75.0 80.2
VAT/sales tax payments =1 100.0 78.6
Social security and other contributions =1 100.0 71.8
Company registration and payment of fees =1 100.0 62.5
GOVERNMENT-TO-BUSINESS (G2B) =37 50.0 58.3Income tax refunds =46 0.0 62.5
VAT/sales tax refunds =46 0.0 61.3
Payments for goods and services =1 100.0 63.3
Disbursement of loans =1 100.0 46.0
Rank Score Average
INFRASTRUCTURE 9 73.0 49.5Number of ATMs per 10,000 people 39 17.8 28.5
Number of POS terminals per 10,000 people 9 38.8 20.0
Diffusion of broadband 12 68.9 34.5
Public-access terminals per capita =1 100.0 76.2
Mobile subscriptions per 100 people 9 58.4 42.8
Level of development of stored value cards =1 100.0 72.2
Level of development of 3G and other technologies =1 100.0 68.1
Level of development of contactless and mobile payments =1 100.0 53.6
SOCIAL AND ECONOMIC CONTEXT 16 82.7 60.9Literacy level 36 85.4 80.5
Educational level 18 65.8 53.6
Internet/technology savviness =1 100.0 66.5
Percentage of population using banks/other fi nancial institutions =1 100.0 60.5
Percentage of businesses using banks/other fi nancial institutions =1 100.0 69.0
Provision of fi nancial education =1 100.0 73.4
Proportion of businesses placing orders via the Internet =31 25.0 41.1
Proportion of consumer orders of goods via the Internet 18 68.3 38.8
Percentage of population with payment card(s) =1 100.0 64.9
POLICY CONTEXT =4 91.7 73.5Government commitment to e-payment security =1 100.0 74.2
Government commitment to integrating the informal economy =8 75.0 63.3
Government commitment to the Financial Action Task Force (FATF) =1 100.0 83.1
Hong KongAverage for all countries
CITIZEN-TO-GOVERNMENT (C2G)
GOVERNMENT-TO-CITIZEN (G2C)
BUSINESS-TO-GOVERNMENT(B2G)
INFRASTRUCTURE
SOCIAL ANDECONOMIC
CONTEXT
POLICYCONTEXT
GOVERNMENT-TO-BUSINESS (G2B)
100
75
50
25
0
Rank Score Average
OVERALL SCORE 20 79.1 62.5
CITIZEN-TO-GOVERNMENT (C2G) =12 80.0 62.7Income tax payments =1 100.0 83.1
Social security contributions =1 100.0 69.8
Obtaining/paying for an ID card =13 50.0 28.2
Automotive costs: tolls and fi nes =1 100.0 71.4
Public transit payments =36 50.0 60.9
GOVERNMENT-TO-CITIZEN (G2C) =24 75.0 59.5Income tax refunds =1 100.0 63.7
Social security benefi ts =20 75.0 62.9
Unemployment, workers’ comp and welfare benefi ts =11 75.0 56.9
Government health benefi ts =30 50.0 54.4
BUSINESS-TO-GOVERNMENT (B2G) =14 93.8 73.3Income tax payments =1 100.0 80.2
VAT/sales tax payments =1 100.0 78.6
Social security and other contributions =1 100.0 71.8
Company registration and payment of fees =23 75.0 62.5
GOVERNMENT-TO-BUSINESS (G2B) =21 81.3 58.3Income tax refunds =1 100.0 62.5
VAT/sales tax refunds =1 100.0 61.3
Payments for goods and services =34 50.0 63.3
Disbursement of loans =11 75.0 46.0
Rank Score Average
INFRASTRUCTURE 19 64.3 49.5Number of ATMs per 10,000 people 25 25.6 28.5
Number of POS terminals per 10,000 people 33 12.8 20.0
Diffusion of broadband 20 54.2 34.5
Public-access terminals per capita =1 100.0 76.2
Mobile subscriptions per 100 people 27 46.9 42.8
Level of development of stored value cards =23 75.0 72.2
Level of development of 3G and other technologies =1 100.0 68.1
Level of development of contactless and mobile payments =1 100.0 53.6
SOCIAL AND ECONOMIC CONTEXT 26 67.6 60.9Literacy level 8 98.6 80.5
Educational level 24 62.3 53.6
Internet/technology savviness =24 75.0 66.5
Percentage of population using banks/other fi nancial institutions =1 100.0 60.5
Percentage of businesses using banks/other fi nancial institutions =24 75.0 69.0
Provision of fi nancial education =1 100.0 73.4
Proportion of businesses placing orders via the Internet =49 0.0 41.1
Proportion of consumer orders of goods via the Internet 37 22.5 38.8
Percentage of population with payment card(s) =32 75.0 64.9
POLICY CONTEXT =4 91.7 73.5Government commitment to e-payment security =1 100.0 74.2
Government commitment to integrating the informal economy =8 75.0 63.3
Government commitment to the Financial Action Task Force (FATF) =1 100.0 83.1
HungaryAverage for all countries
CITIZEN-TO-GOVERNMENT (C2G)
GOVERNMENT-TO-CITIZEN (G2C)
BUSINESS-TO-GOVERNMENT(B2G)
INFRASTRUCTURE
SOCIAL ANDECONOMIC
CONTEXT
POLICYCONTEXT
GOVERNMENT-TO-BUSINESS (G2B)
100
75
50
25
0
Hong Kong Nominal GDP (US$ bn) 224.5
Population (m) 7.1
GDP per capita (US$) 31,660.0
Hungary Nominal GDP (US$ bn) 130.4
Population (m) 10.0
GDP per capita (US$) 13,023.9
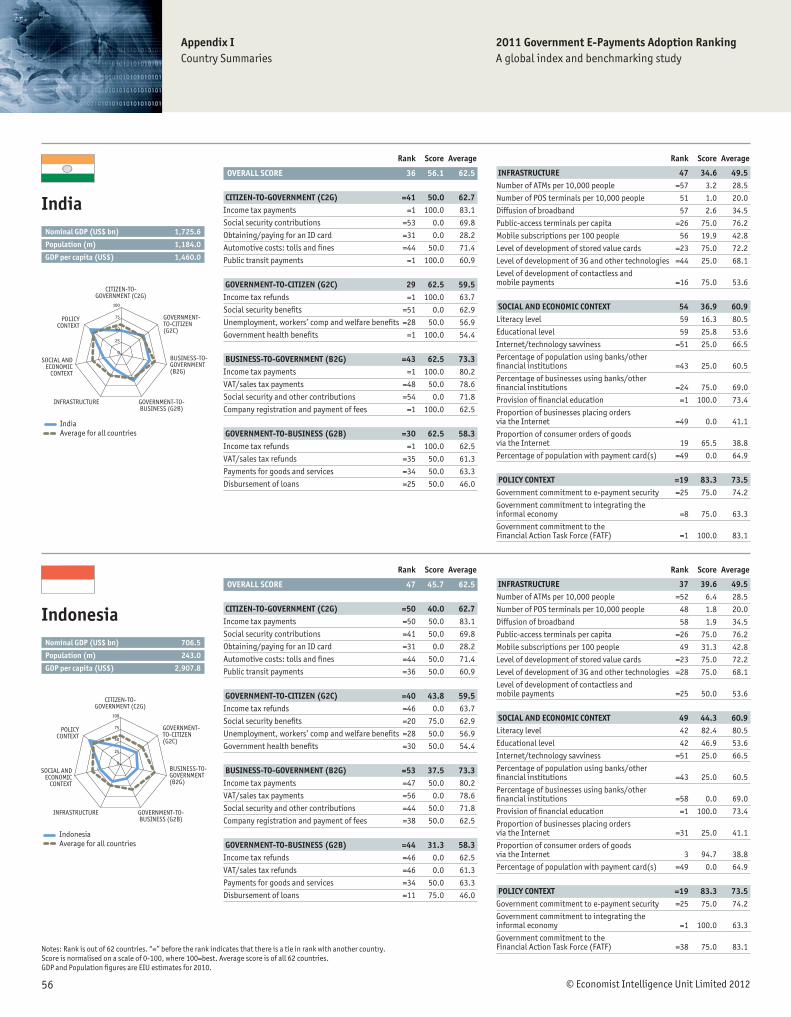
© Economist Intelligence Unit Limited 201256
Appendix ICountry Summaries
Notes: Rank is out of 62 countries. “=” before the rank indicates that there is a tie in rank with another country. Score is normalised on a scale of 0-100, where 100=best. Average score is of all 62 countries. GDP and Population fi gures are EIU estimates for 2010.
2011 Government E-Payments Adoption RankingA global index and benchmarking study
Rank Score Average
OVERALL SCORE 36 56.1 62.5
CITIZEN-TO-GOVERNMENT (C2G) =41 50.0 62.7Income tax payments =1 100.0 83.1
Social security contributions =53 0.0 69.8
Obtaining/paying for an ID card =31 0.0 28.2
Automotive costs: tolls and fi nes =44 50.0 71.4
Public transit payments =1 100.0 60.9
GOVERNMENT-TO-CITIZEN (G2C) 29 62.5 59.5Income tax refunds =1 100.0 63.7
Social security benefi ts =51 0.0 62.9
Unemployment, workers’ comp and welfare benefi ts =28 50.0 56.9
Government health benefi ts =1 100.0 54.4
BUSINESS-TO-GOVERNMENT (B2G) =43 62.5 73.3Income tax payments =1 100.0 80.2
VAT/sales tax payments =48 50.0 78.6
Social security and other contributions =54 0.0 71.8
Company registration and payment of fees =1 100.0 62.5
GOVERNMENT-TO-BUSINESS (G2B) =30 62.5 58.3Income tax refunds =1 100.0 62.5
VAT/sales tax refunds =35 50.0 61.3
Payments for goods and services =34 50.0 63.3
Disbursement of loans =25 50.0 46.0
Rank Score Average
INFRASTRUCTURE 47 34.6 49.5Number of ATMs per 10,000 people =57 3.2 28.5
Number of POS terminals per 10,000 people 51 1.0 20.0
Diffusion of broadband 57 2.6 34.5
Public-access terminals per capita =26 75.0 76.2
Mobile subscriptions per 100 people 56 19.9 42.8
Level of development of stored value cards =23 75.0 72.2
Level of development of 3G and other technologies =44 25.0 68.1
Level of development of contactless and mobile payments =16 75.0 53.6
SOCIAL AND ECONOMIC CONTEXT 54 36.9 60.9Literacy level 59 16.3 80.5
Educational level 59 25.8 53.6
Internet/technology savviness =51 25.0 66.5
Percentage of population using banks/other fi nancial institutions =43 25.0 60.5
Percentage of businesses using banks/other fi nancial institutions =24 75.0 69.0
Provision of fi nancial education =1 100.0 73.4
Proportion of businesses placing orders via the Internet =49 0.0 41.1
Proportion of consumer orders of goods via the Internet 19 65.5 38.8
Percentage of population with payment card(s) =49 0.0 64.9
POLICY CONTEXT =19 83.3 73.5Government commitment to e-payment security =25 75.0 74.2
Government commitment to integrating the informal economy =8 75.0 63.3
Government commitment to the Financial Action Task Force (FATF) =1 100.0 83.1
IndiaAverage for all countries
CITIZEN-TO-GOVERNMENT (C2G)
GOVERNMENT-TO-CITIZEN (G2C)
BUSINESS-TO-GOVERNMENT(B2G)
INFRASTRUCTURE
SOCIAL ANDECONOMIC
CONTEXT
POLICYCONTEXT
GOVERNMENT-TO-BUSINESS (G2B)
100
75
50
25
0
Rank Score Average
OVERALL SCORE 47 45.7 62.5
CITIZEN-TO-GOVERNMENT (C2G) =50 40.0 62.7Income tax payments =50 50.0 83.1
Social security contributions =41 50.0 69.8
Obtaining/paying for an ID card =31 0.0 28.2
Automotive costs: tolls and fi nes =44 50.0 71.4
Public transit payments =36 50.0 60.9
GOVERNMENT-TO-CITIZEN (G2C) =40 43.8 59.5Income tax refunds =46 0.0 63.7
Social security benefi ts =20 75.0 62.9
Unemployment, workers’ comp and welfare benefi ts =28 50.0 56.9
Government health benefi ts =30 50.0 54.4
BUSINESS-TO-GOVERNMENT (B2G) =53 37.5 73.3Income tax payments =47 50.0 80.2
VAT/sales tax payments =56 0.0 78.6
Social security and other contributions =44 50.0 71.8
Company registration and payment of fees =38 50.0 62.5
GOVERNMENT-TO-BUSINESS (G2B) =44 31.3 58.3Income tax refunds =46 0.0 62.5
VAT/sales tax refunds =46 0.0 61.3
Payments for goods and services =34 50.0 63.3
Disbursement of loans =11 75.0 46.0
Rank Score Average
INFRASTRUCTURE 37 39.6 49.5Number of ATMs per 10,000 people =52 6.4 28.5
Number of POS terminals per 10,000 people 48 1.8 20.0
Diffusion of broadband 58 1.9 34.5
Public-access terminals per capita =26 75.0 76.2
Mobile subscriptions per 100 people 49 31.3 42.8
Level of development of stored value cards =23 75.0 72.2
Level of development of 3G and other technologies =28 75.0 68.1
Level of development of contactless and mobile payments =25 50.0 53.6
SOCIAL AND ECONOMIC CONTEXT 49 44.3 60.9Literacy level 42 82.4 80.5
Educational level 42 46.9 53.6
Internet/technology savviness =51 25.0 66.5
Percentage of population using banks/other fi nancial institutions =43 25.0 60.5
Percentage of businesses using banks/other fi nancial institutions =58 0.0 69.0
Provision of fi nancial education =1 100.0 73.4
Proportion of businesses placing orders via the Internet =31 25.0 41.1
Proportion of consumer orders of goods via the Internet 3 94.7 38.8
Percentage of population with payment card(s) =49 0.0 64.9
POLICY CONTEXT =19 83.3 73.5Government commitment to e-payment security =25 75.0 74.2
Government commitment to integrating the informal economy =1 100.0 63.3
Government commitment to the Financial Action Task Force (FATF) =38 75.0 83.1
IndonesiaAverage for all countries
CITIZEN-TO-GOVERNMENT (C2G)
GOVERNMENT-TO-CITIZEN (G2C)
BUSINESS-TO-GOVERNMENT(B2G)
INFRASTRUCTURE
SOCIAL ANDECONOMIC
CONTEXT
POLICYCONTEXT
GOVERNMENT-TO-BUSINESS (G2B)
100
75
50
25
0
India Nominal GDP (US$ bn) 1,725.6
Population (m) 1,184.0
GDP per capita (US$) 1,460.0
Indonesia Nominal GDP (US$ bn) 706.5
Population (m) 243.0
GDP per capita (US$) 2,907.8

© Economist Intelligence Unit Limited 201257
Notes: Rank is out of 62 countries. “=” before the rank indicates that there is a tie in rank with another country. Score is normalised on a scale of 0-100, where 100=best. Average score is of all 62 countries. GDP and Population fi gures are EIU estimates for 2010.
Appendix ICountry Summaries
2011 Government E-Payments Adoption RankingA global index and benchmarking study
Rank Score Average
OVERALL SCORE 59 29.7 62.5
CITIZEN-TO-GOVERNMENT (C2G) =60 30.0 62.7Income tax payments =58 25.0 83.1
Social security contributions =49 25.0 69.8
Obtaining/paying for an ID card =24 25.0 28.2
Automotive costs: tolls and fi nes =26 75.0 71.4
Public transit payments =55 0.0 60.9
GOVERNMENT-TO-CITIZEN (G2C) =58 0.0 59.5Income tax refunds =46 0.0 63.7
Social security benefi ts =51 0.0 62.9
Unemployment, workers’ comp and welfare benefi ts =56 0.0 56.9
Government health benefi ts =44 0.0 54.4
BUSINESS-TO-GOVERNMENT (B2G) =56 31.3 73.3Income tax payments =57 25.0 80.2
VAT/sales tax payments =1 100.0 78.6
Social security and other contributions =54 0.0 71.8
Company registration and payment of fees =50 0.0 62.5
GOVERNMENT-TO-BUSINESS (G2B) =52 18.8 58.3Income tax refunds =46 0.0 62.5
VAT/sales tax refunds =43 25.0 61.3
Payments for goods and services =34 50.0 63.3
Disbursement of loans =42 0.0 46.0
Rank Score Average
INFRASTRUCTURE 54 26.2 49.5Number of ATMs per 10,000 people =44 13.7 28.5
Number of POS terminals per 10,000 people 20 31.4 20.0
Diffusion of broadband 52 3.5 34.5
Public-access terminals per capita =46 50.0 76.2
Mobile subscriptions per 100 people 42 35.9 42.8
Level of development of stored value cards =38 50.0 72.2
Level of development of 3G and other technologies =44 25.0 68.1
Level of development of contactless and mobile payments =60 0.0 53.6
SOCIAL AND ECONOMIC CONTEXT 31 60.3 60.9Literacy level 53 66.3 80.5
Educational level 43 43.4 53.6
Internet/technology savviness =34 50.0 66.5
Percentage of population using banks/other fi nancial institutions =1 100.0 60.5
Percentage of businesses using banks/other fi nancial institutions =1 100.0 69.0
Provision of fi nancial education =30 75.0 73.4
Proportion of businesses placing orders via the Internet =49 0.0 41.1
Proportion of consumer orders of goods via the Internet 45 7.8 38.8
Percentage of population with payment card(s) =1 100.0 64.9
POLICY CONTEXT =57 41.7 73.5Government commitment to e-payment security =58 25.0 74.2
Government commitment to integrating the informal economy =1 100.0 63.3
Government commitment to the Financial Action Task Force (FATF) =60 0.0 83.1
IranAverage for all countries
CITIZEN-TO-GOVERNMENT (C2G)
GOVERNMENT-TO-CITIZEN (G2C)
BUSINESS-TO-GOVERNMENT(B2G)
INFRASTRUCTURE
SOCIAL ANDECONOMIC
CONTEXT
POLICYCONTEXT
GOVERNMENT-TO-BUSINESS (G2B)
100
75
50
25
0
Rank Score Average
OVERALL SCORE 17 81.3 62.5
CITIZEN-TO-GOVERNMENT (C2G) =19 75.0 62.7Income tax payments =1 100.0 83.1
Social security contributions =1 100.0 69.8
Obtaining/paying for an ID card =31 0.0 28.2
Automotive costs: tolls and fi nes =26 75.0 71.4
Public transit payments =1 100.0 60.9
GOVERNMENT-TO-CITIZEN (G2C) =30 56.3 59.5Income tax refunds =1 100.0 63.7
Social security benefi ts =51 0.0 62.9
Unemployment, workers’ comp and welfare benefi ts =50 25.0 56.9
Government health benefi ts =1 100.0 54.4
BUSINESS-TO-GOVERNMENT (B2G) =26 87.5 73.3Income tax payments =39 75.0 80.2
VAT/sales tax payments =41 75.0 78.6
Social security and other contributions =1 100.0 71.8
Company registration and payment of fees =1 100.0 62.5
GOVERNMENT-TO-BUSINESS (G2B) =1 100.0 58.3Income tax refunds =1 100.0 62.5
VAT/sales tax refunds =1 100.0 61.3
Payments for goods and services =1 100.0 63.3
Disbursement of loans =1 100.0 46.0
Rank Score Average
INFRASTRUCTURE 7 74.1 49.5Number of ATMs per 10,000 people 17 43.8 28.5
Number of POS terminals per 10,000 people 15 34.7 20.0
Diffusion of broadband 15 63.8 34.5
Public-access terminals per capita =1 100.0 76.2
Mobile subscriptions per 100 people =22 50.2 42.8
Level of development of stored value cards =1 100.0 72.2
Level of development of 3G and other technologies =1 100.0 68.1
Level of development of contactless and mobile payments =1 100.0 53.6
SOCIAL AND ECONOMIC CONTEXT 13 84.9 60.9Literacy level =9 97.8 80.5
Educational level 3 83.3 53.6
Internet/technology savviness =1 100.0 66.5
Percentage of population using banks/other fi nancial institutions =1 100.0 60.5
Percentage of businesses using banks/other fi nancial institutions =1 100.0 69.0
Provision of fi nancial education =44 50.0 73.4
Proportion of businesses placing orders via the Internet =7 75.0 41.1
Proportion of consumer orders of goods via the Internet 21 57.9 38.8
Percentage of population with payment card(s) =1 100.0 64.9
POLICY CONTEXT =4 91.7 73.5Government commitment to e-payment security =1 100.0 74.2
Government commitment to integrating the informal economy =8 75.0 63.3
Government commitment to the Financial Action Task Force (FATF) =1 100.0 83.1
IrelandAverage for all countries
CITIZEN-TO-GOVERNMENT (C2G)
GOVERNMENT-TO-CITIZEN (G2C)
BUSINESS-TO-GOVERNMENT(B2G)
INFRASTRUCTURE
SOCIAL ANDECONOMIC
CONTEXT
POLICYCONTEXT
GOVERNMENT-TO-BUSINESS (G2B)
100
75
50
25
0
Iran Nominal GDP (US$ bn) 418.3
Population (m) 75.1
GDP per capita (US$) 5,570.0
Ireland Nominal GDP (US$ bn) 207.1
Population (m) 4.2
GDP per capita (US$) 49,660.0

© Economist Intelligence Unit Limited 201258
Appendix ICountry Summaries
Notes: Rank is out of 62 countries. “=” before the rank indicates that there is a tie in rank with another country. Score is normalised on a scale of 0-100, where 100=best. Average score is of all 62 countries. GDP and Population fi gures are EIU estimates for 2010.
2011 Government E-Payments Adoption RankingA global index and benchmarking study
Rank Score Average
OVERALL SCORE 18 80.5 62.5
CITIZEN-TO-GOVERNMENT (C2G) =2 95.0 62.7Income tax payments =1 100.0 83.1
Social security contributions =1 100.0 69.8
Obtaining/paying for an ID card =6 75.0 28.2
Automotive costs: tolls and fi nes =1 100.0 71.4
Public transit payments =1 100.0 60.9
GOVERNMENT-TO-CITIZEN (G2C) =18 81.3 59.5Income tax refunds =1 100.0 63.7
Social security benefi ts =20 75.0 62.9
Unemployment, workers’ comp and welfare benefi ts =11 75.0 56.9
Government health benefi ts =23 75.0 54.4
BUSINESS-TO-GOVERNMENT (B2G) =1 100.0 73.3Income tax payments =1 100.0 80.2
VAT/sales tax payments =1 100.0 78.6
Social security and other contributions =1 100.0 71.8
Company registration and payment of fees =1 100.0 62.5
GOVERNMENT-TO-BUSINESS (G2B) =26 75.0 58.3Income tax refunds =1 100.0 62.5
VAT/sales tax refunds =1 100.0 61.3
Payments for goods and services =54 0.0 63.3
Disbursement of loans =1 100.0 46.0
Rank Score Average
INFRASTRUCTURE 24 62.3 49.5Number of ATMs per 10,000 people 14 47.5 28.5
Number of POS terminals per 10,000 people 24 21.9 20.0
Diffusion of broadband 21 53.5 34.5
Public-access terminals per capita =1 100.0 76.2
Mobile subscriptions per 100 people =22 50.2 42.8
Level of development of stored value cards =1 100.0 72.2
Level of development of 3G and other technologies =1 100.0 68.1
Level of development of contactless and mobile payments =36 25.0 53.6
SOCIAL AND ECONOMIC CONTEXT 21 75.1 60.9Literacy level 27 93.5 80.5
Educational level 21 64.4 53.6
Internet/technology savviness =1 100.0 66.5
Percentage of population using banks/other fi nancial institutions =31 50.0 60.5
Percentage of businesses using banks/other fi nancial institutions =24 75.0 69.0
Provision of fi nancial education =30 75.0 73.4
Proportion of businesses placing orders via the Internet =7 75.0 41.1
Proportion of consumer orders of goods via the Internet 27 42.8 38.8
Percentage of population with payment card(s) =1 100.0 64.9
POLICY CONTEXT =30 75.0 73.5Government commitment to e-payment security =25 75.0 74.2
Government commitment to integrating the informal economy =36 50.0 63.3
Government commitment to the Financial Action Task Force (FATF) =1 100.0 83.1
IsraelAverage for all countries
CITIZEN-TO-GOVERNMENT (C2G)
GOVERNMENT-TO-CITIZEN (G2C)
BUSINESS-TO-GOVERNMENT(B2G)
INFRASTRUCTURE
SOCIAL ANDECONOMIC
CONTEXT
POLICYCONTEXT
GOVERNMENT-TO-BUSINESS (G2B)
100
75
50
25
0
Rank Score Average
OVERALL SCORE 23 78.0 62.5
CITIZEN-TO-GOVERNMENT (C2G) =12 80.0 62.7Income tax payments =1 100.0 83.1
Social security contributions =1 100.0 69.8
Obtaining/paying for an ID card =31 0.0 28.2
Automotive costs: tolls and fi nes =1 100.0 71.4
Public transit payments =1 100.0 60.9
GOVERNMENT-TO-CITIZEN (G2C) =18 81.3 59.5Income tax refunds =1 100.0 63.7
Social security benefi ts =20 75.0 62.9
Unemployment, workers’ comp and welfare benefi ts =28 50.0 56.9
Government health benefi ts =1 100.0 54.4
BUSINESS-TO-GOVERNMENT (B2G) =14 93.8 73.3Income tax payments =1 100.0 80.2
VAT/sales tax payments =1 100.0 78.6
Social security and other contributions =1 100.0 71.8
Company registration and payment of fees =23 75.0 62.5
GOVERNMENT-TO-BUSINESS (G2B) =12 87.5 58.3Income tax refunds =1 100.0 62.5
VAT/sales tax refunds =1 100.0 61.3
Payments for goods and services =1 100.0 63.3
Disbursement of loans =25 50.0 46.0
Rank Score Average
INFRASTRUCTURE 15 68.0 49.5Number of ATMs per 10,000 people 16 44.7 28.5
Number of POS terminals per 10,000 people 18 32.2 20.0
Diffusion of broadband 19 54.8 34.5
Public-access terminals per capita =1 100.0 76.2
Mobile subscriptions per 100 people 5 62.2 42.8
Level of development of stored value cards =1 100.0 72.2
Level of development of 3G and other technologies =1 100.0 68.1
Level of development of contactless and mobile payments =25 50.0 53.6
SOCIAL AND ECONOMIC CONTEXT 25 68.7 60.9Literacy level 22 97.5 80.5
Educational level 10 70.3 53.6
Internet/technology savviness =24 75.0 66.5
Percentage of population using banks/other fi nancial institutions =31 50.0 60.5
Percentage of businesses using banks/other fi nancial institutions =24 75.0 69.0
Provision of fi nancial education =1 100.0 73.4
Proportion of businesses placing orders via the Internet =31 25.0 41.1
Proportion of consumer orders of goods via the Internet 36 25.7 38.8
Percentage of population with payment card(s) =1 100.0 64.9
POLICY CONTEXT =40 66.7 73.5Government commitment to e-payment security =43 50.0 74.2
Government commitment to integrating the informal economy =36 50.0 63.3
Government commitment to the Financial Action Task Force (FATF) =1 100.0 83.1
ItalyAverage for all countries
CITIZEN-TO-GOVERNMENT (C2G)
GOVERNMENT-TO-CITIZEN (G2C)
BUSINESS-TO-GOVERNMENT(B2G)
INFRASTRUCTURE
SOCIAL ANDECONOMIC
CONTEXT
POLICYCONTEXT
GOVERNMENT-TO-BUSINESS (G2B)
100
75
50
25
0
Israel Nominal GDP (US$ bn) 217.8
Population (m) 7.6
GDP per capita (US$) 28,568.8
Italy Nominal GDP (US$ bn) 2,054.6
Population (m) 60.1
GDP per capita (US$) 33,930.0
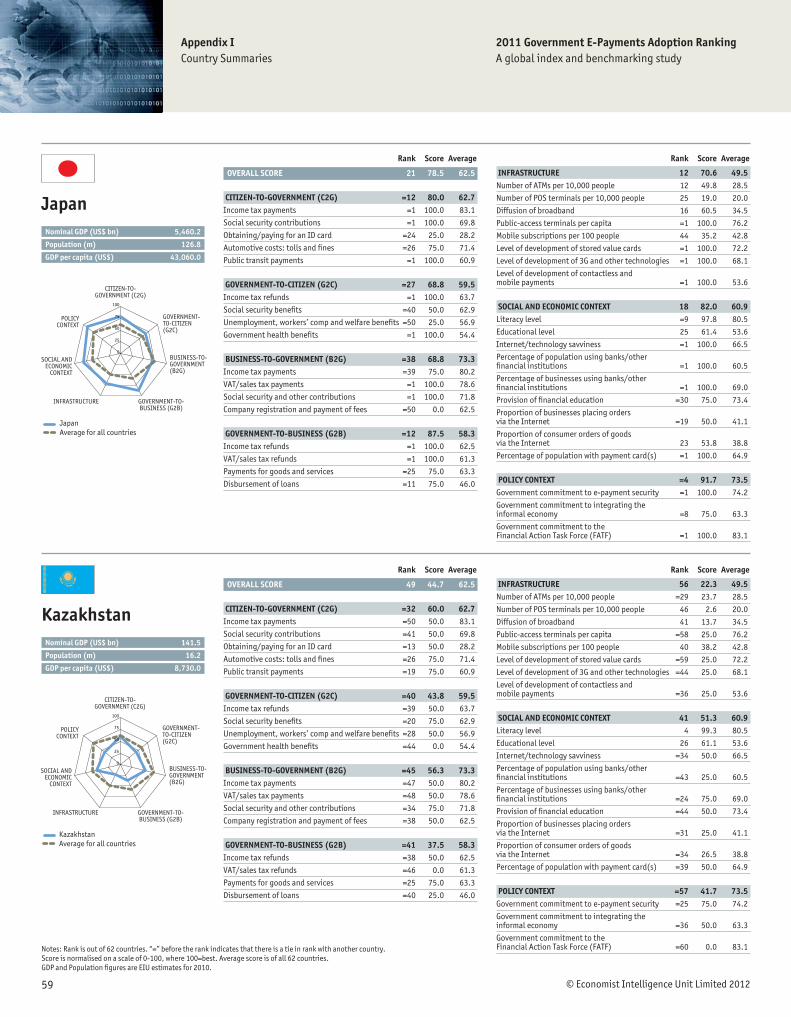
© Economist Intelligence Unit Limited 201259
Notes: Rank is out of 62 countries. “=” before the rank indicates that there is a tie in rank with another country. Score is normalised on a scale of 0-100, where 100=best. Average score is of all 62 countries. GDP and Population fi gures are EIU estimates for 2010.
Appendix ICountry Summaries
2011 Government E-Payments Adoption RankingA global index and benchmarking study
Rank Score Average
OVERALL SCORE 21 78.5 62.5
CITIZEN-TO-GOVERNMENT (C2G) =12 80.0 62.7Income tax payments =1 100.0 83.1
Social security contributions =1 100.0 69.8
Obtaining/paying for an ID card =24 25.0 28.2
Automotive costs: tolls and fi nes =26 75.0 71.4
Public transit payments =1 100.0 60.9
GOVERNMENT-TO-CITIZEN (G2C) =27 68.8 59.5Income tax refunds =1 100.0 63.7
Social security benefi ts =40 50.0 62.9
Unemployment, workers’ comp and welfare benefi ts =50 25.0 56.9
Government health benefi ts =1 100.0 54.4
BUSINESS-TO-GOVERNMENT (B2G) =38 68.8 73.3Income tax payments =39 75.0 80.2
VAT/sales tax payments =1 100.0 78.6
Social security and other contributions =1 100.0 71.8
Company registration and payment of fees =50 0.0 62.5
GOVERNMENT-TO-BUSINESS (G2B) =12 87.5 58.3Income tax refunds =1 100.0 62.5
VAT/sales tax refunds =1 100.0 61.3
Payments for goods and services =25 75.0 63.3
Disbursement of loans =11 75.0 46.0
Rank Score Average
INFRASTRUCTURE 12 70.6 49.5Number of ATMs per 10,000 people 12 49.8 28.5
Number of POS terminals per 10,000 people 25 19.0 20.0
Diffusion of broadband 16 60.5 34.5
Public-access terminals per capita =1 100.0 76.2
Mobile subscriptions per 100 people 44 35.2 42.8
Level of development of stored value cards =1 100.0 72.2
Level of development of 3G and other technologies =1 100.0 68.1
Level of development of contactless and mobile payments =1 100.0 53.6
SOCIAL AND ECONOMIC CONTEXT 18 82.0 60.9Literacy level =9 97.8 80.5
Educational level 25 61.4 53.6
Internet/technology savviness =1 100.0 66.5
Percentage of population using banks/other fi nancial institutions =1 100.0 60.5
Percentage of businesses using banks/other fi nancial institutions =1 100.0 69.0
Provision of fi nancial education =30 75.0 73.4
Proportion of businesses placing orders via the Internet =19 50.0 41.1
Proportion of consumer orders of goods via the Internet 23 53.8 38.8
Percentage of population with payment card(s) =1 100.0 64.9
POLICY CONTEXT =4 91.7 73.5Government commitment to e-payment security =1 100.0 74.2
Government commitment to integrating the informal economy =8 75.0 63.3
Government commitment to the Financial Action Task Force (FATF) =1 100.0 83.1
JapanAverage for all countries
CITIZEN-TO-GOVERNMENT (C2G)
GOVERNMENT-TO-CITIZEN (G2C)
BUSINESS-TO-GOVERNMENT(B2G)
INFRASTRUCTURE
SOCIAL ANDECONOMIC
CONTEXT
POLICYCONTEXT
GOVERNMENT-TO-BUSINESS (G2B)
100
75
50
25
0
Rank Score Average
OVERALL SCORE 49 44.7 62.5
CITIZEN-TO-GOVERNMENT (C2G) =32 60.0 62.7Income tax payments =50 50.0 83.1
Social security contributions =41 50.0 69.8
Obtaining/paying for an ID card =13 50.0 28.2
Automotive costs: tolls and fi nes =26 75.0 71.4
Public transit payments =19 75.0 60.9
GOVERNMENT-TO-CITIZEN (G2C) =40 43.8 59.5Income tax refunds =39 50.0 63.7
Social security benefi ts =20 75.0 62.9
Unemployment, workers’ comp and welfare benefi ts =28 50.0 56.9
Government health benefi ts =44 0.0 54.4
BUSINESS-TO-GOVERNMENT (B2G) =45 56.3 73.3Income tax payments =47 50.0 80.2
VAT/sales tax payments =48 50.0 78.6
Social security and other contributions =34 75.0 71.8
Company registration and payment of fees =38 50.0 62.5
GOVERNMENT-TO-BUSINESS (G2B) =41 37.5 58.3Income tax refunds =38 50.0 62.5
VAT/sales tax refunds =46 0.0 61.3
Payments for goods and services =25 75.0 63.3
Disbursement of loans =40 25.0 46.0
Rank Score Average
INFRASTRUCTURE 56 22.3 49.5Number of ATMs per 10,000 people =29 23.7 28.5
Number of POS terminals per 10,000 people 46 2.6 20.0
Diffusion of broadband 41 13.7 34.5
Public-access terminals per capita =58 25.0 76.2
Mobile subscriptions per 100 people 40 38.2 42.8
Level of development of stored value cards =59 25.0 72.2
Level of development of 3G and other technologies =44 25.0 68.1
Level of development of contactless and mobile payments =36 25.0 53.6
SOCIAL AND ECONOMIC CONTEXT 41 51.3 60.9Literacy level 4 99.3 80.5
Educational level 26 61.1 53.6
Internet/technology savviness =34 50.0 66.5
Percentage of population using banks/other fi nancial institutions =43 25.0 60.5
Percentage of businesses using banks/other fi nancial institutions =24 75.0 69.0
Provision of fi nancial education =44 50.0 73.4
Proportion of businesses placing orders via the Internet =31 25.0 41.1
Proportion of consumer orders of goods via the Internet =34 26.5 38.8
Percentage of population with payment card(s) =39 50.0 64.9
POLICY CONTEXT =57 41.7 73.5Government commitment to e-payment security =25 75.0 74.2
Government commitment to integrating the informal economy =36 50.0 63.3
Government commitment to the Financial Action Task Force (FATF) =60 0.0 83.1
KazakhstanAverage for all countries
CITIZEN-TO-GOVERNMENT (C2G)
GOVERNMENT-TO-CITIZEN (G2C)
BUSINESS-TO-GOVERNMENT(B2G)
INFRASTRUCTURE
SOCIAL ANDECONOMIC
CONTEXT
POLICYCONTEXT
GOVERNMENT-TO-BUSINESS (G2B)
100
75
50
25
0
JapanNominal GDP (US$ bn) 5,460.2
Population (m) 126.8
GDP per capita (US$) 43,060.0
Kazakhstan Nominal GDP (US$ bn) 141.5
Population (m) 16.2
GDP per capita (US$) 8,730.0

© Economist Intelligence Unit Limited 201260
Appendix ICountry Summaries
Notes: Rank is out of 62 countries. “=” before the rank indicates that there is a tie in rank with another country. Score is normalised on a scale of 0-100, where 100=best. Average score is of all 62 countries. GDP and Population fi gures are EIU estimates for 2010.
2011 Government E-Payments Adoption RankingA global index and benchmarking study
Rank Score Average
OVERALL SCORE 58 30.3 62.5
CITIZEN-TO-GOVERNMENT (C2G) =54 35.0 62.7Income tax payments =42 75.0 83.1
Social security contributions =1 100.0 69.8
Obtaining/paying for an ID card =31 0.0 28.2
Automotive costs: tolls and fi nes =58 0.0 71.4
Public transit payments =55 0.0 60.9
GOVERNMENT-TO-CITIZEN (G2C) =40 43.8 59.5Income tax refunds =46 0.0 63.7
Social security benefi ts =40 50.0 62.9
Unemployment, workers’ comp and welfare benefi ts =50 25.0 56.9
Government health benefi ts =1 100.0 54.4
BUSINESS-TO-GOVERNMENT (B2G) =53 37.5 73.3Income tax payments =47 50.0 80.2
VAT/sales tax payments =54 25.0 78.6
Social security and other contributions =34 75.0 71.8
Company registration and payment of fees =50 0.0 62.5
GOVERNMENT-TO-BUSINESS (G2B) =52 18.8 58.3Income tax refunds =32 75.0 62.5
VAT/sales tax refunds =46 0.0 61.3
Payments for goods and services =54 0.0 63.3
Disbursement of loans =42 0.0 46.0
Rank Score Average
INFRASTRUCTURE 58 21.6 49.5Number of ATMs per 10,000 people 56 3.7 28.5
Number of POS terminals per 10,000 people 56 0.6 20.0
Diffusion of broadband =61 0.0 34.5
Public-access terminals per capita =58 25.0 76.2
Mobile subscriptions per 100 people 59 18.7 42.8
Level of development of stored value cards =59 25.0 72.2
Level of development of 3G and other technologies =44 25.0 68.1
Level of development of contactless and mobile payments =16 75.0 53.6
SOCIAL AND ECONOMIC CONTEXT 57 22.3 60.9Literacy level 50 70.8 80.5
Educational level 56 30.3 53.6
Internet/technology savviness =60 0.0 66.5
Percentage of population using banks/other fi nancial institutions =57 0.0 60.5
Percentage of businesses using banks/other fi nancial institutions =58 0.0 69.0
Provision of fi nancial education =59 0.0 73.4
Proportion of businesses placing orders via the Internet =49 0.0 41.1
Proportion of consumer orders of goods via the Internet =59 0.0 38.8
Percentage of population with payment card(s) =1 100.0 64.9
POLICY CONTEXT 61 33.3 73.5Government commitment to e-payment security =58 25.0 74.2
Government commitment to integrating the informal economy =8 75.0 63.3
Government commitment to the Financial Action Task Force (FATF) =60 0.0 83.1
KenyaAverage for all countries
CITIZEN-TO-GOVERNMENT (C2G)
GOVERNMENT-TO-CITIZEN (G2C)
BUSINESS-TO-GOVERNMENT(B2G)
INFRASTRUCTURE
SOCIAL ANDECONOMIC
CONTEXT
POLICYCONTEXT
GOVERNMENT-TO-BUSINESS (G2B)
100
75
50
25
0
Rank Score Average
OVERALL SCORE 55 33.4 62.5
CITIZEN-TO-GOVERNMENT (C2G) =41 50.0 62.7Income tax payments =1 100.0 83.1
Social security contributions =53 0.0 69.8
Obtaining/paying for an ID card =13 50.0 28.2
Automotive costs: tolls and fi nes =1 100.0 71.4
Public transit payments =55 0.0 60.9
GOVERNMENT-TO-CITIZEN (G2C) =58 0.0 59.5Income tax refunds =46 0.0 63.7
Social security benefi ts =51 0.0 62.9
Unemployment, workers’ comp and welfare benefi ts =56 0.0 56.9
Government health benefi ts =44 0.0 54.4
BUSINESS-TO-GOVERNMENT (B2G) =58 25.0 73.3Income tax payments =1 100.0 80.2
VAT/sales tax payments =56 0.0 78.6
Social security and other contributions =54 0.0 71.8
Company registration and payment of fees =50 0.0 62.5
GOVERNMENT-TO-BUSINESS (G2B) =56 12.5 58.3Income tax refunds =46 0.0 62.5
VAT/sales tax refunds =46 0.0 61.3
Payments for goods and services =34 50.0 63.3
Disbursement of loans =42 0.0 46.0
Rank Score Average
INFRASTRUCTURE 43 36.8 49.5Number of ATMs per 10,000 people =27 24.2 28.5
Number of POS terminals per 10,000 people 29 16.0 20.0
Diffusion of broadband =53 3.3 34.5
Public-access terminals per capita =26 75.0 76.2
Mobile subscriptions per 100 people 21 50.7 42.8
Level of development of stored value cards =23 75.0 72.2
Level of development of 3G and other technologies =44 25.0 68.1
Level of development of contactless and mobile payments =36 25.0 53.6
SOCIAL AND ECONOMIC CONTEXT 32 59.6 60.9Literacy level 35 86.3 80.5
Educational level 45 41.8 53.6
Internet/technology savviness =34 50.0 66.5
Percentage of population using banks/other fi nancial institutions =1 100.0 60.5
Percentage of businesses using banks/other fi nancial institutions =24 75.0 69.0
Provision of fi nancial education =44 50.0 73.4
Proportion of businesses placing orders via the Internet =19 50.0 41.1
Proportion of consumer orders of goods via the Internet =43 8.4 38.8
Percentage of population with payment card(s) =32 75.0 64.9
POLICY CONTEXT =53 50.0 73.5Government commitment to e-payment security =58 25.0 74.2
Government commitment to integrating the informal economy =8 75.0 63.3
Government commitment to the Financial Action Task Force (FATF) =54 50.0 83.1
KuwaitAverage for all countries
CITIZEN-TO-GOVERNMENT (C2G)
GOVERNMENT-TO-CITIZEN (G2C)
BUSINESS-TO-GOVERNMENT(B2G)
INFRASTRUCTURE
SOCIAL ANDECONOMIC
CONTEXT
POLICYCONTEXT
GOVERNMENT-TO-BUSINESS (G2B)
100
75
50
25
0
Kenya Nominal GDP (US$ bn) 30.9
Population (m) 40.5
GDP per capita (US$) 763.0
Kuwait Nominal GDP (US$ bn) 124.3
Population (m) 3.6
GDP per capita (US$) 34,730.0

© Economist Intelligence Unit Limited 201261
Notes: Rank is out of 62 countries. “=” before the rank indicates that there is a tie in rank with another country. Score is normalised on a scale of 0-100, where 100=best. Average score is of all 62 countries. GDP and Population fi gures are EIU estimates for 2010.
Appendix ICountry Summaries
2011 Government E-Payments Adoption RankingA global index and benchmarking study
Rank Score Average
OVERALL SCORE 29 69.3 62.5
CITIZEN-TO-GOVERNMENT (C2G) =19 75.0 62.7Income tax payments =1 100.0 83.1
Social security contributions =34 75.0 69.8
Obtaining/paying for an ID card =13 50.0 28.2
Automotive costs: tolls and fi nes =26 75.0 71.4
Public transit payments =19 75.0 60.9
GOVERNMENT-TO-CITIZEN (G2C) =30 56.3 59.5Income tax refunds =1 100.0 63.7
Social security benefi ts =20 75.0 62.9
Unemployment, workers’ comp and welfare benefi ts =28 50.0 56.9
Government health benefi ts =44 0.0 54.4
BUSINESS-TO-GOVERNMENT (B2G) =33 75.0 73.3Income tax payments =1 100.0 80.2
VAT/sales tax payments =1 100.0 78.6
Social security and other contributions =54 0.0 71.8
Company registration and payment of fees =1 100.0 62.5
GOVERNMENT-TO-BUSINESS (G2B) =30 62.5 58.3Income tax refunds =1 100.0 62.5
VAT/sales tax refunds =46 0.0 61.3
Payments for goods and services =1 100.0 63.3
Disbursement of loans =25 50.0 46.0
Rank Score Average
INFRASTRUCTURE 20 63.2 49.5Number of ATMs per 10,000 people 26 24.7 28.5
Number of POS terminals per 10,000 people 28 16.3 20.0
Diffusion of broadband =32 24.3 34.5
Public-access terminals per capita =1 100.0 76.2
Mobile subscriptions per 100 people =33 40.6 42.8
Level of development of stored value cards =1 100.0 72.2
Level of development of 3G and other technologies =1 100.0 68.1
Level of development of contactless and mobile payments =1 100.0 53.6
SOCIAL AND ECONOMIC CONTEXT 22 69.7 60.9Literacy level 41 83.0 80.5
Educational level 44 42.5 53.6
Internet/technology savviness =24 75.0 66.5
Percentage of population using banks/other fi nancial institutions =23 75.0 60.5
Percentage of businesses using banks/other fi nancial institutions =42 50.0 69.0
Provision of fi nancial education =1 100.0 73.4
Proportion of businesses placing orders via the Internet =31 25.0 41.1
Proportion of consumer orders of goods via the Internet 12 76.6 38.8
Percentage of population with payment card(s) =1 100.0 64.9
POLICY CONTEXT =19 83.3 73.5Government commitment to e-payment security =25 75.0 74.2
Government commitment to integrating the informal economy =8 75.0 63.3
Government commitment to the Financial Action Task Force (FATF) =1 100.0 83.1
MalaysiaAverage for all countries
CITIZEN-TO-GOVERNMENT (C2G)
GOVERNMENT-TO-CITIZEN (G2C)
BUSINESS-TO-GOVERNMENT(B2G)
INFRASTRUCTURE
SOCIAL ANDECONOMIC
CONTEXT
POLICYCONTEXT
GOVERNMENT-TO-BUSINESS (G2B)
100
75
50
25
0
Rank Score Average
OVERALL SCORE 27 72.1 62.5
CITIZEN-TO-GOVERNMENT (C2G) =5 90.0 62.7Income tax payments =1 100.0 83.1
Social security contributions =1 100.0 69.8
Obtaining/paying for an ID card =1 100.0 28.2
Automotive costs: tolls and fi nes =1 100.0 71.4
Public transit payments =36 50.0 60.9
GOVERNMENT-TO-CITIZEN (G2C) =35 50.0 59.5Income tax refunds =1 100.0 63.7
Social security benefi ts =40 50.0 62.9
Unemployment, workers’ comp and welfare benefi ts =28 50.0 56.9
Government health benefi ts =44 0.0 54.4
BUSINESS-TO-GOVERNMENT (B2G) =14 93.8 73.3Income tax payments =1 100.0 80.2
VAT/sales tax payments =1 100.0 78.6
Social security and other contributions =1 100.0 71.8
Company registration and payment of fees =23 75.0 62.5
GOVERNMENT-TO-BUSINESS (G2B) =12 87.5 58.3Income tax refunds =1 100.0 62.5
VAT/sales tax refunds =1 100.0 61.3
Payments for goods and services =1 100.0 63.3
Disbursement of loans =25 50.0 46.0
Rank Score Average
INFRASTRUCTURE 31 47.8 49.5Number of ATMs per 10,000 people 34 20.5 28.5
Number of POS terminals per 10,000 people 35 9.1 20.0
Diffusion of broadband 29 28.5 34.5
Public-access terminals per capita =1 100.0 76.2
Mobile subscriptions per 100 people 53 24.6 42.8
Level of development of stored value cards =23 75.0 72.2
Level of development of 3G and other technologies =28 75.0 68.1
Level of development of contactless and mobile payments =25 50.0 53.6
SOCIAL AND ECONOMIC CONTEXT 40 52.0 60.9Literacy level 38 85.3 80.5
Educational level 36 52.5 53.6
Internet/technology savviness =34 50.0 66.5
Percentage of population using banks/other fi nancial institutions =31 50.0 60.5
Percentage of businesses using banks/other fi nancial institutions =51 25.0 69.0
Provision of fi nancial education =1 100.0 73.4
Proportion of businesses placing orders via the Internet =31 25.0 41.1
Proportion of consumer orders of goods via the Internet =51 4.9 38.8
Percentage of population with payment card(s) =32 75.0 64.9
POLICY CONTEXT =19 83.3 73.5Government commitment to e-payment security =25 75.0 74.2
Government commitment to integrating the informal economy =8 75.0 63.3
Government commitment to the Financial Action Task Force (FATF) =1 100.0 83.1
MexicoAverage for all countries
CITIZEN-TO-GOVERNMENT (C2G)
GOVERNMENT-TO-CITIZEN (G2C)
BUSINESS-TO-GOVERNMENT(B2G)
INFRASTRUCTURE
SOCIAL ANDECONOMIC
CONTEXT
POLICYCONTEXT
GOVERNMENT-TO-BUSINESS (G2B)
100
75
50
25
0
Malaysia Nominal GDP (US$ bn) 237.8
Population (m) 28.3
GDP per capita (US$) 8,417.6
Mexico Nominal GDP (US$ bn) 1,034.3
Population (m) 112.5
GDP per capita (US$) 9,196.3

© Economist Intelligence Unit Limited 201262
Appendix ICountry Summaries
Notes: Rank is out of 62 countries. “=” before the rank indicates that there is a tie in rank with another country. Score is normalised on a scale of 0-100, where 100=best. Average score is of all 62 countries. GDP and Population fi gures are EIU estimates for 2010.
2011 Government E-Payments Adoption RankingA global index and benchmarking study
Rank Score Average
OVERALL SCORE 52 40.2 62.5
CITIZEN-TO-GOVERNMENT (C2G) =54 35.0 62.7Income tax payments =58 25.0 83.1
Social security contributions =1 100.0 69.8
Obtaining/paying for an ID card =31 0.0 28.2
Automotive costs: tolls and fi nes =44 50.0 71.4
Public transit payments =55 0.0 60.9
GOVERNMENT-TO-CITIZEN (G2C) =27 68.8 59.5Income tax refunds =43 25.0 63.7
Social security benefi ts =20 75.0 62.9
Unemployment, workers’ comp and welfare benefi ts =11 75.0 56.9
Government health benefi ts =1 100.0 54.4
BUSINESS-TO-GOVERNMENT (B2G) =51 43.8 73.3Income tax payments =57 25.0 80.2
VAT/sales tax payments =54 25.0 78.6
Social security and other contributions =1 100.0 71.8
Company registration and payment of fees =48 25.0 62.5
GOVERNMENT-TO-BUSINESS (G2B) =47 25.0 58.3Income tax refunds =43 25.0 62.5
VAT/sales tax refunds =43 25.0 61.3
Payments for goods and services =48 25.0 63.3
Disbursement of loans =40 25.0 46.0
Rank Score Average
INFRASTRUCTURE 48 33.1 49.5Number of ATMs per 10,000 people 50 8.7 28.5
Number of POS terminals per 10,000 people 50 1.4 20.0
Diffusion of broadband =53 3.3 34.5
Public-access terminals per capita =26 75.0 76.2
Mobile subscriptions per 100 people 52 26.3 42.8
Level of development of stored value cards =38 50.0 72.2
Level of development of 3G and other technologies =28 75.0 68.1
Level of development of contactless and mobile payments =36 25.0 53.6
SOCIAL AND ECONOMIC CONTEXT 56 25.9 60.9Literacy level 61 1.3 80.5
Educational level 60 25.4 53.6
Internet/technology savviness =34 50.0 66.5
Percentage of population using banks/other fi nancial institutions =43 25.0 60.5
Percentage of businesses using banks/other fi nancial institutions =51 25.0 69.0
Provision of fi nancial education =1 100.0 73.4
Proportion of businesses placing orders via the Internet =49 0.0 41.1
Proportion of consumer orders of goods via the Internet 48 6.5 38.8
Percentage of population with payment card(s) =49 0.0 64.9
POLICY CONTEXT =53 50.0 73.5Government commitment to e-payment security =43 50.0 74.2
Government commitment to integrating the informal economy =36 50.0 63.3
Government commitment to the Financial Action Task Force (FATF) =54 50.0 83.1
MoroccoAverage for all countries
CITIZEN-TO-GOVERNMENT (C2G)
GOVERNMENT-TO-CITIZEN (G2C)
BUSINESS-TO-GOVERNMENT(B2G)
INFRASTRUCTURE
SOCIAL ANDECONOMIC
CONTEXT
POLICYCONTEXT
GOVERNMENT-TO-BUSINESS (G2B)
100
75
50
25
0
Rank Score Average
OVERALL SCORE 12 85.0 62.5
CITIZEN-TO-GOVERNMENT (C2G) =24 70.0 62.7Income tax payments =1 100.0 83.1
Social security contributions =1 100.0 69.8
Obtaining/paying for an ID card =31 0.0 28.2
Automotive costs: tolls and fi nes =26 75.0 71.4
Public transit payments =19 75.0 60.9
GOVERNMENT-TO-CITIZEN (G2C) =6 93.8 59.5Income tax refunds =1 100.0 63.7
Social security benefi ts =1 100.0 62.9
Unemployment, workers’ comp and welfare benefi ts =11 75.0 56.9
Government health benefi ts =1 100.0 54.4
BUSINESS-TO-GOVERNMENT (B2G) =26 87.5 73.3Income tax payments =1 100.0 80.2
VAT/sales tax payments =1 100.0 78.6
Social security and other contributions =1 100.0 71.8
Company registration and payment of fees =38 50.0 62.5
GOVERNMENT-TO-BUSINESS (G2B) =1 100.0 58.3Income tax refunds =1 100.0 62.5
VAT/sales tax refunds =1 100.0 61.3
Payments for goods and services =1 100.0 63.3
Disbursement of loans =1 100.0 46.0
Rank Score Average
INFRASTRUCTURE 21 62.9 49.5Number of ATMs per 10,000 people 22 29.2 28.5
Number of POS terminals per 10,000 people 13 36.1 20.0
Diffusion of broadband 3 83.3 34.5
Public-access terminals per capita =26 75.0 76.2
Mobile subscriptions per 100 people =13 54.6 42.8
Level of development of stored value cards =1 100.0 72.2
Level of development of 3G and other technologies =1 100.0 68.1
Level of development of contactless and mobile payments =36 25.0 53.6
SOCIAL AND ECONOMIC CONTEXT 9 89.1 60.9Literacy level =9 97.8 80.5
Educational level 8 73.5 53.6
Internet/technology savviness =1 100.0 66.5
Percentage of population using banks/other fi nancial institutions =23 75.0 60.5
Percentage of businesses using banks/other fi nancial institutions =1 100.0 69.0
Provision of fi nancial education =1 100.0 73.4
Proportion of businesses placing orders via the Internet =7 75.0 41.1
Proportion of consumer orders of goods via the Internet 9 80.9 38.8
Percentage of population with payment card(s) =1 100.0 64.9
POLICY CONTEXT =4 91.7 73.5Government commitment to e-payment security =1 100.0 74.2
Government commitment to integrating the informal economy =8 75.0 63.3
Government commitment to the Financial Action Task Force (FATF) =1 100.0 83.1
NetherlandsAverage for all countries
CITIZEN-TO-GOVERNMENT (C2G)
GOVERNMENT-TO-CITIZEN (G2C)
BUSINESS-TO-GOVERNMENT(B2G)
INFRASTRUCTURE
SOCIAL ANDECONOMIC
CONTEXT
POLICYCONTEXT
GOVERNMENT-TO-BUSINESS (G2B)
100
75
50
25
0
Morocco Nominal GDP (US$ bn) 90.8
Population (m) 32.4
GDP per capita (US$) 2,804.3
Netherlands Nominal GDP (US$ bn) 781.1
Population (m) 16.6
GDP per capita (US$) 47,124.1
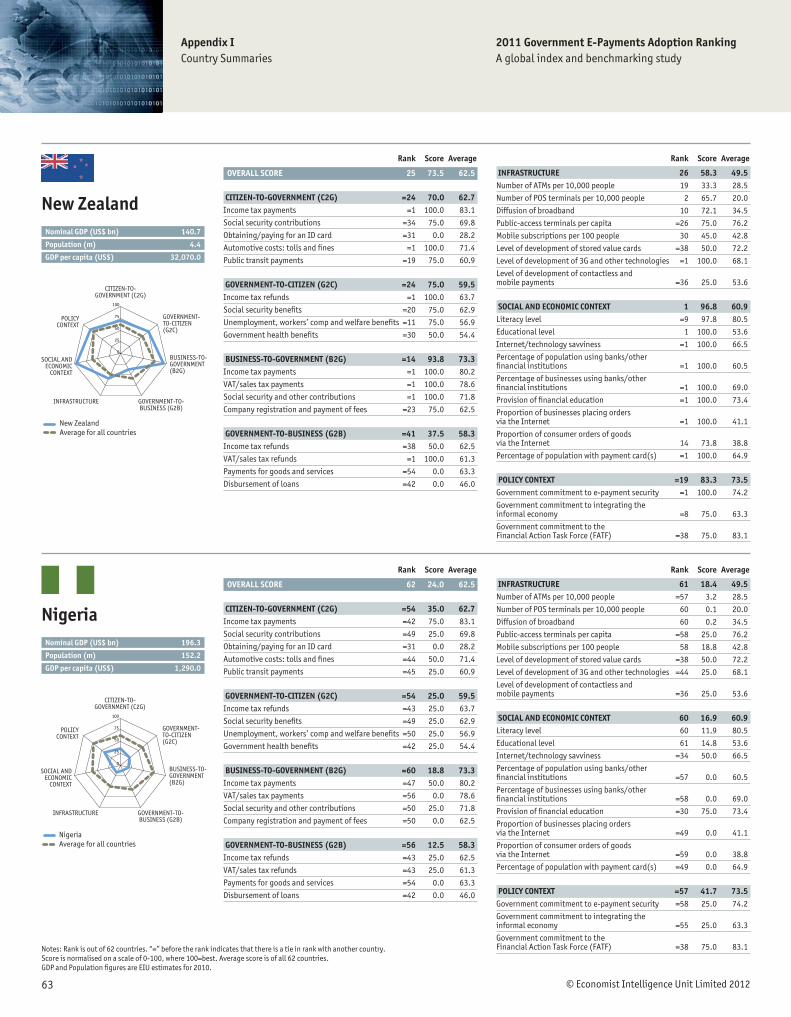
© Economist Intelligence Unit Limited 201263
Notes: Rank is out of 62 countries. “=” before the rank indicates that there is a tie in rank with another country. Score is normalised on a scale of 0-100, where 100=best. Average score is of all 62 countries. GDP and Population fi gures are EIU estimates for 2010.
Appendix ICountry Summaries
2011 Government E-Payments Adoption RankingA global index and benchmarking study
Rank Score Average
OVERALL SCORE 25 73.5 62.5
CITIZEN-TO-GOVERNMENT (C2G) =24 70.0 62.7Income tax payments =1 100.0 83.1
Social security contributions =34 75.0 69.8
Obtaining/paying for an ID card =31 0.0 28.2
Automotive costs: tolls and fi nes =1 100.0 71.4
Public transit payments =19 75.0 60.9
GOVERNMENT-TO-CITIZEN (G2C) =24 75.0 59.5Income tax refunds =1 100.0 63.7
Social security benefi ts =20 75.0 62.9
Unemployment, workers’ comp and welfare benefi ts =11 75.0 56.9
Government health benefi ts =30 50.0 54.4
BUSINESS-TO-GOVERNMENT (B2G) =14 93.8 73.3Income tax payments =1 100.0 80.2
VAT/sales tax payments =1 100.0 78.6
Social security and other contributions =1 100.0 71.8
Company registration and payment of fees =23 75.0 62.5
GOVERNMENT-TO-BUSINESS (G2B) =41 37.5 58.3Income tax refunds =38 50.0 62.5
VAT/sales tax refunds =1 100.0 61.3
Payments for goods and services =54 0.0 63.3
Disbursement of loans =42 0.0 46.0
Rank Score Average
INFRASTRUCTURE 26 58.3 49.5Number of ATMs per 10,000 people 19 33.3 28.5
Number of POS terminals per 10,000 people 2 65.7 20.0
Diffusion of broadband 10 72.1 34.5
Public-access terminals per capita =26 75.0 76.2
Mobile subscriptions per 100 people 30 45.0 42.8
Level of development of stored value cards =38 50.0 72.2
Level of development of 3G and other technologies =1 100.0 68.1
Level of development of contactless and mobile payments =36 25.0 53.6
SOCIAL AND ECONOMIC CONTEXT 1 96.8 60.9Literacy level =9 97.8 80.5
Educational level 1 100.0 53.6
Internet/technology savviness =1 100.0 66.5
Percentage of population using banks/other fi nancial institutions =1 100.0 60.5
Percentage of businesses using banks/other fi nancial institutions =1 100.0 69.0
Provision of fi nancial education =1 100.0 73.4
Proportion of businesses placing orders via the Internet =1 100.0 41.1
Proportion of consumer orders of goods via the Internet 14 73.8 38.8
Percentage of population with payment card(s) =1 100.0 64.9
POLICY CONTEXT =19 83.3 73.5Government commitment to e-payment security =1 100.0 74.2
Government commitment to integrating the informal economy =8 75.0 63.3
Government commitment to the Financial Action Task Force (FATF) =38 75.0 83.1
New ZealandAverage for all countries
CITIZEN-TO-GOVERNMENT (C2G)
GOVERNMENT-TO-CITIZEN (G2C)
BUSINESS-TO-GOVERNMENT(B2G)
INFRASTRUCTURE
SOCIAL ANDECONOMIC
CONTEXT
POLICYCONTEXT
GOVERNMENT-TO-BUSINESS (G2B)
100
75
50
25
0
Rank Score Average
OVERALL SCORE 62 24.0 62.5
CITIZEN-TO-GOVERNMENT (C2G) =54 35.0 62.7Income tax payments =42 75.0 83.1
Social security contributions =49 25.0 69.8
Obtaining/paying for an ID card =31 0.0 28.2
Automotive costs: tolls and fi nes =44 50.0 71.4
Public transit payments =45 25.0 60.9
GOVERNMENT-TO-CITIZEN (G2C) =54 25.0 59.5Income tax refunds =43 25.0 63.7
Social security benefi ts =49 25.0 62.9
Unemployment, workers’ comp and welfare benefi ts =50 25.0 56.9
Government health benefi ts =42 25.0 54.4
BUSINESS-TO-GOVERNMENT (B2G) =60 18.8 73.3Income tax payments =47 50.0 80.2
VAT/sales tax payments =56 0.0 78.6
Social security and other contributions =50 25.0 71.8
Company registration and payment of fees =50 0.0 62.5
GOVERNMENT-TO-BUSINESS (G2B) =56 12.5 58.3Income tax refunds =43 25.0 62.5
VAT/sales tax refunds =43 25.0 61.3
Payments for goods and services =54 0.0 63.3
Disbursement of loans =42 0.0 46.0
Rank Score Average
INFRASTRUCTURE 61 18.4 49.5Number of ATMs per 10,000 people =57 3.2 28.5
Number of POS terminals per 10,000 people 60 0.1 20.0
Diffusion of broadband 60 0.2 34.5
Public-access terminals per capita =58 25.0 76.2
Mobile subscriptions per 100 people 58 18.8 42.8
Level of development of stored value cards =38 50.0 72.2
Level of development of 3G and other technologies =44 25.0 68.1
Level of development of contactless and mobile payments =36 25.0 53.6
SOCIAL AND ECONOMIC CONTEXT 60 16.9 60.9Literacy level 60 11.9 80.5
Educational level 61 14.8 53.6
Internet/technology savviness =34 50.0 66.5
Percentage of population using banks/other fi nancial institutions =57 0.0 60.5
Percentage of businesses using banks/other fi nancial institutions =58 0.0 69.0
Provision of fi nancial education =30 75.0 73.4
Proportion of businesses placing orders via the Internet =49 0.0 41.1
Proportion of consumer orders of goods via the Internet =59 0.0 38.8
Percentage of population with payment card(s) =49 0.0 64.9
POLICY CONTEXT =57 41.7 73.5Government commitment to e-payment security =58 25.0 74.2
Government commitment to integrating the informal economy =55 25.0 63.3
Government commitment to the Financial Action Task Force (FATF) =38 75.0 83.1
NigeriaAverage for all countries
CITIZEN-TO-GOVERNMENT (C2G)
GOVERNMENT-TO-CITIZEN (G2C)
BUSINESS-TO-GOVERNMENT(B2G)
INFRASTRUCTURE
SOCIAL ANDECONOMIC
CONTEXT
POLICYCONTEXT
GOVERNMENT-TO-BUSINESS (G2B)
100
75
50
25
0
New ZealandNominal GDP (US$ bn) 140.7
Population (m) 4.4
GDP per capita (US$) 32,070.0
Nigeria Nominal GDP (US$ bn) 196.3
Population (m) 152.2
GDP per capita (US$) 1,290.0
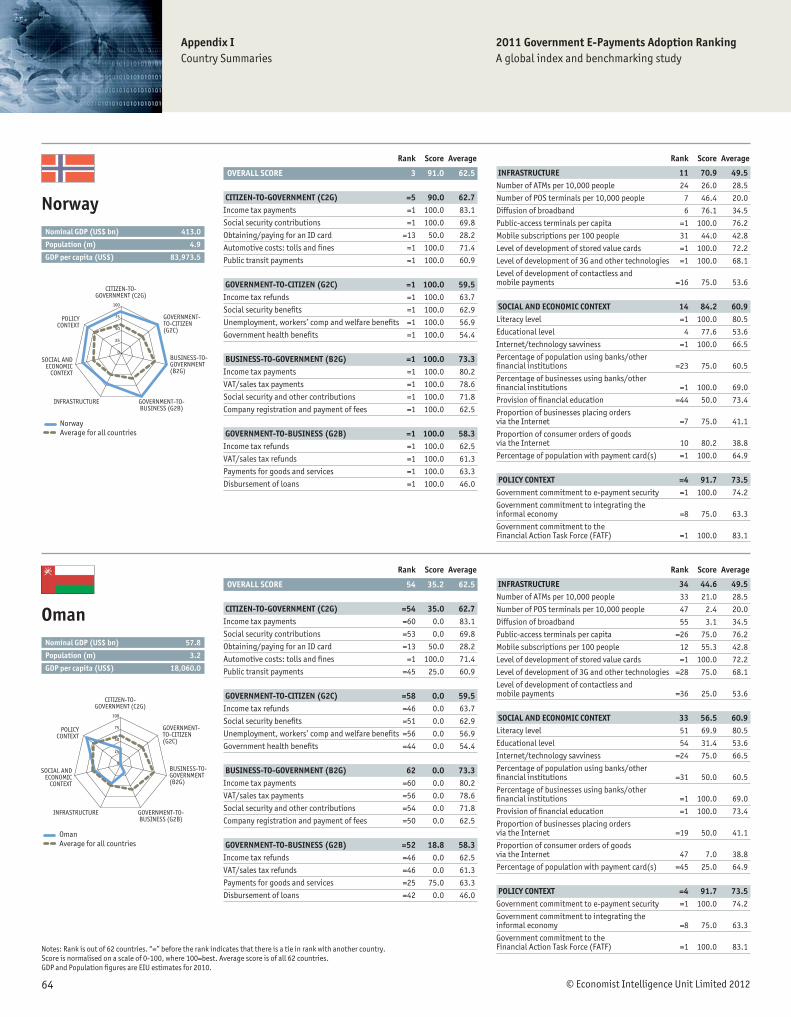
© Economist Intelligence Unit Limited 201264
Appendix ICountry Summaries
Notes: Rank is out of 62 countries. “=” before the rank indicates that there is a tie in rank with another country. Score is normalised on a scale of 0-100, where 100=best. Average score is of all 62 countries. GDP and Population fi gures are EIU estimates for 2010.
2011 Government E-Payments Adoption RankingA global index and benchmarking study
Rank Score Average
OVERALL SCORE 3 91.0 62.5
CITIZEN-TO-GOVERNMENT (C2G) =5 90.0 62.7Income tax payments =1 100.0 83.1
Social security contributions =1 100.0 69.8
Obtaining/paying for an ID card =13 50.0 28.2
Automotive costs: tolls and fi nes =1 100.0 71.4
Public transit payments =1 100.0 60.9
GOVERNMENT-TO-CITIZEN (G2C) =1 100.0 59.5Income tax refunds =1 100.0 63.7
Social security benefi ts =1 100.0 62.9
Unemployment, workers’ comp and welfare benefi ts =1 100.0 56.9
Government health benefi ts =1 100.0 54.4
BUSINESS-TO-GOVERNMENT (B2G) =1 100.0 73.3Income tax payments =1 100.0 80.2
VAT/sales tax payments =1 100.0 78.6
Social security and other contributions =1 100.0 71.8
Company registration and payment of fees =1 100.0 62.5
GOVERNMENT-TO-BUSINESS (G2B) =1 100.0 58.3Income tax refunds =1 100.0 62.5
VAT/sales tax refunds =1 100.0 61.3
Payments for goods and services =1 100.0 63.3
Disbursement of loans =1 100.0 46.0
Rank Score Average
INFRASTRUCTURE 11 70.9 49.5Number of ATMs per 10,000 people 24 26.0 28.5
Number of POS terminals per 10,000 people 7 46.4 20.0
Diffusion of broadband 6 76.1 34.5
Public-access terminals per capita =1 100.0 76.2
Mobile subscriptions per 100 people 31 44.0 42.8
Level of development of stored value cards =1 100.0 72.2
Level of development of 3G and other technologies =1 100.0 68.1
Level of development of contactless and mobile payments =16 75.0 53.6
SOCIAL AND ECONOMIC CONTEXT 14 84.2 60.9Literacy level =1 100.0 80.5
Educational level 4 77.6 53.6
Internet/technology savviness =1 100.0 66.5
Percentage of population using banks/other fi nancial institutions =23 75.0 60.5
Percentage of businesses using banks/other fi nancial institutions =1 100.0 69.0
Provision of fi nancial education =44 50.0 73.4
Proportion of businesses placing orders via the Internet =7 75.0 41.1
Proportion of consumer orders of goods via the Internet 10 80.2 38.8
Percentage of population with payment card(s) =1 100.0 64.9
POLICY CONTEXT =4 91.7 73.5Government commitment to e-payment security =1 100.0 74.2
Government commitment to integrating the informal economy =8 75.0 63.3
Government commitment to the Financial Action Task Force (FATF) =1 100.0 83.1
NorwayAverage for all countries
CITIZEN-TO-GOVERNMENT (C2G)
GOVERNMENT-TO-CITIZEN (G2C)
BUSINESS-TO-GOVERNMENT(B2G)
INFRASTRUCTURE
SOCIAL ANDECONOMIC
CONTEXT
POLICYCONTEXT
GOVERNMENT-TO-BUSINESS (G2B)
100
75
50
25
0
Rank Score Average
OVERALL SCORE 54 35.2 62.5
CITIZEN-TO-GOVERNMENT (C2G) =54 35.0 62.7Income tax payments =60 0.0 83.1
Social security contributions =53 0.0 69.8
Obtaining/paying for an ID card =13 50.0 28.2
Automotive costs: tolls and fi nes =1 100.0 71.4
Public transit payments =45 25.0 60.9
GOVERNMENT-TO-CITIZEN (G2C) =58 0.0 59.5Income tax refunds =46 0.0 63.7
Social security benefi ts =51 0.0 62.9
Unemployment, workers’ comp and welfare benefi ts =56 0.0 56.9
Government health benefi ts =44 0.0 54.4
BUSINESS-TO-GOVERNMENT (B2G) 62 0.0 73.3Income tax payments =60 0.0 80.2
VAT/sales tax payments =56 0.0 78.6
Social security and other contributions =54 0.0 71.8
Company registration and payment of fees =50 0.0 62.5
GOVERNMENT-TO-BUSINESS (G2B) =52 18.8 58.3Income tax refunds =46 0.0 62.5
VAT/sales tax refunds =46 0.0 61.3
Payments for goods and services =25 75.0 63.3
Disbursement of loans =42 0.0 46.0
Rank Score Average
INFRASTRUCTURE 34 44.6 49.5Number of ATMs per 10,000 people 33 21.0 28.5
Number of POS terminals per 10,000 people 47 2.4 20.0
Diffusion of broadband 55 3.1 34.5
Public-access terminals per capita =26 75.0 76.2
Mobile subscriptions per 100 people 12 55.3 42.8
Level of development of stored value cards =1 100.0 72.2
Level of development of 3G and other technologies =28 75.0 68.1
Level of development of contactless and mobile payments =36 25.0 53.6
SOCIAL AND ECONOMIC CONTEXT 33 56.5 60.9Literacy level 51 69.9 80.5
Educational level 54 31.4 53.6
Internet/technology savviness =24 75.0 66.5
Percentage of population using banks/other fi nancial institutions =31 50.0 60.5
Percentage of businesses using banks/other fi nancial institutions =1 100.0 69.0
Provision of fi nancial education =1 100.0 73.4
Proportion of businesses placing orders via the Internet =19 50.0 41.1
Proportion of consumer orders of goods via the Internet 47 7.0 38.8
Percentage of population with payment card(s) =45 25.0 64.9
POLICY CONTEXT =4 91.7 73.5Government commitment to e-payment security =1 100.0 74.2
Government commitment to integrating the informal economy =8 75.0 63.3
Government commitment to the Financial Action Task Force (FATF) =1 100.0 83.1
OmanAverage for all countries
CITIZEN-TO-GOVERNMENT (C2G)
GOVERNMENT-TO-CITIZEN (G2C)
BUSINESS-TO-GOVERNMENT(B2G)
INFRASTRUCTURE
SOCIAL ANDECONOMIC
CONTEXT
POLICYCONTEXT
GOVERNMENT-TO-BUSINESS (G2B)
100
75
50
25
0
Norway Nominal GDP (US$ bn) 413.0
Population (m) 4.9
GDP per capita (US$) 83,973.5
Oman Nominal GDP (US$ bn) 57.8
Population (m) 3.2
GDP per capita (US$) 18,060.0

© Economist Intelligence Unit Limited 201265
Notes: Rank is out of 62 countries. “=” before the rank indicates that there is a tie in rank with another country. Score is normalised on a scale of 0-100, where 100=best. Average score is of all 62 countries. GDP and Population fi gures are EIU estimates for 2010.
Appendix ICountry Summaries
2011 Government E-Payments Adoption RankingA global index and benchmarking study
Rank Score Average
OVERALL SCORE 47 45.7 62.5
CITIZEN-TO-GOVERNMENT (C2G) =47 45.0 62.7Income tax payments =1 100.0 83.1
Social security contributions =53 0.0 69.8
Obtaining/paying for an ID card =13 50.0 28.2
Automotive costs: tolls and fi nes =26 75.0 71.4
Public transit payments =55 0.0 60.9
GOVERNMENT-TO-CITIZEN (G2C) =35 50.0 59.5Income tax refunds =1 100.0 63.7
Social security benefi ts =40 50.0 62.9
Unemployment, workers’ comp and welfare benefi ts =28 50.0 56.9
Government health benefi ts =44 0.0 54.4
BUSINESS-TO-GOVERNMENT (B2G) =33 75.0 73.3Income tax payments =1 100.0 80.2
VAT/sales tax payments =1 100.0 78.6
Social security and other contributions =54 0.0 71.8
Company registration and payment of fees =1 100.0 62.5
GOVERNMENT-TO-BUSINESS (G2B) =33 56.3 58.3Income tax refunds =1 100.0 62.5
VAT/sales tax refunds =1 100.0 61.3
Payments for goods and services =48 25.0 63.3
Disbursement of loans =42 0.0 46.0
Rank Score Average
INFRASTRUCTURE 58 21.6 49.5Number of ATMs per 10,000 people 60 1.8 28.5
Number of POS terminals per 10,000 people 54 0.7 20.0
Diffusion of broadband 59 1.7 34.5
Public-access terminals per capita =46 50.0 76.2
Mobile subscriptions per 100 people 60 18.3 42.8
Level of development of stored value cards =23 75.0 72.2
Level of development of 3G and other technologies 62 0.0 68.1
Level of development of contactless and mobile payments =36 25.0 53.6
SOCIAL AND ECONOMIC CONTEXT 61 14.1 60.9Literacy level 62 0.0 80.5
Educational level 62 0.0 53.6
Internet/technology savviness =51 25.0 66.5
Percentage of population using banks/other fi nancial institutions =57 0.0 60.5
Percentage of businesses using banks/other fi nancial institutions =58 0.0 69.0
Provision of fi nancial education =1 100.0 73.4
Proportion of businesses placing orders via the Internet =49 0.0 41.1
Proportion of consumer orders of goods via the Internet 55 1.7 38.8
Percentage of population with payment card(s) =49 0.0 64.9
POLICY CONTEXT =45 58.3 73.5Government commitment to e-payment security =43 50.0 74.2
Government commitment to integrating the informal economy =36 50.0 63.3
Government commitment to the Financial Action Task Force (FATF) =38 75.0 83.1
PakistanAverage for all countries
CITIZEN-TO-GOVERNMENT (C2G)
GOVERNMENT-TO-CITIZEN (G2C)
BUSINESS-TO-GOVERNMENT(B2G)
INFRASTRUCTURE
SOCIAL ANDECONOMIC
CONTEXT
POLICYCONTEXT
GOVERNMENT-TO-BUSINESS (G2B)
100
75
50
25
0
Rank Score Average
OVERALL SCORE 34 57.7 62.5
CITIZEN-TO-GOVERNMENT (C2G) =36 55.0 62.7Income tax payments =1 100.0 83.1
Social security contributions =1 100.0 69.8
Obtaining/paying for an ID card =31 0.0 28.2
Automotive costs: tolls and fi nes =53 25.0 71.4
Public transit payments =36 50.0 60.9
GOVERNMENT-TO-CITIZEN (G2C) =47 37.5 59.5Income tax refunds =1 100.0 63.7
Social security benefi ts =51 0.0 62.9
Unemployment, workers’ comp and welfare benefi ts =28 50.0 56.9
Government health benefi ts =44 0.0 54.4
BUSINESS-TO-GOVERNMENT (B2G) =1 100.0 73.3Income tax payments =1 100.0 80.2
VAT/sales tax payments =1 100.0 78.6
Social security and other contributions =1 100.0 71.8
Company registration and payment of fees =1 100.0 62.5
GOVERNMENT-TO-BUSINESS (G2B) =21 81.3 58.3Income tax refunds =1 100.0 62.5
VAT/sales tax refunds =1 100.0 61.3
Payments for goods and services =34 50.0 63.3
Disbursement of loans =11 75.0 46.0
Rank Score Average
INFRASTRUCTURE 49 32.2 49.5Number of ATMs per 10,000 people 48 10.0 28.5
Number of POS terminals per 10,000 people 53 0.8 20.0
Diffusion of broadband 47 8.0 34.5
Public-access terminals per capita =46 50.0 76.2
Mobile subscriptions per 100 people =38 38.7 42.8
Level of development of stored value cards =38 50.0 72.2
Level of development of 3G and other technologies =44 25.0 68.1
Level of development of contactless and mobile payments =16 75.0 53.6
SOCIAL AND ECONOMIC CONTEXT 52 39.6 60.9Literacy level 47 76.6 80.5
Educational level 37 51.5 53.6
Internet/technology savviness =34 50.0 66.5
Percentage of population using banks/other fi nancial institutions =31 50.0 60.5
Percentage of businesses using banks/other fi nancial institutions =51 25.0 69.0
Provision of fi nancial education =1 100.0 73.4
Proportion of businesses placing orders via the Internet =49 0.0 41.1
Proportion of consumer orders of goods via the Internet 54 3.1 38.8
Percentage of population with payment card(s) =49 0.0 64.9
POLICY CONTEXT =45 58.3 73.5Government commitment to e-payment security =43 50.0 74.2
Government commitment to integrating the informal economy =55 25.0 63.3
Government commitment to the Financial Action Task Force (FATF) =1 100.0 83.1
PeruAverage for all countries
CITIZEN-TO-GOVERNMENT (C2G)
GOVERNMENT-TO-CITIZEN (G2C)
BUSINESS-TO-GOVERNMENT(B2G)
INFRASTRUCTURE
SOCIAL ANDECONOMIC
CONTEXT
POLICYCONTEXT
GOVERNMENT-TO-BUSINESS (G2B)
100
75
50
25
0
Pakistan Nominal GDP (US$ bn) 176.8
Population (m) 185.5
GDP per capita (US$) 956.6
Peru Nominal GDP (US$ bn) 153.8
Population (m) 30.0
GDP per capita (US$) 5,140.0
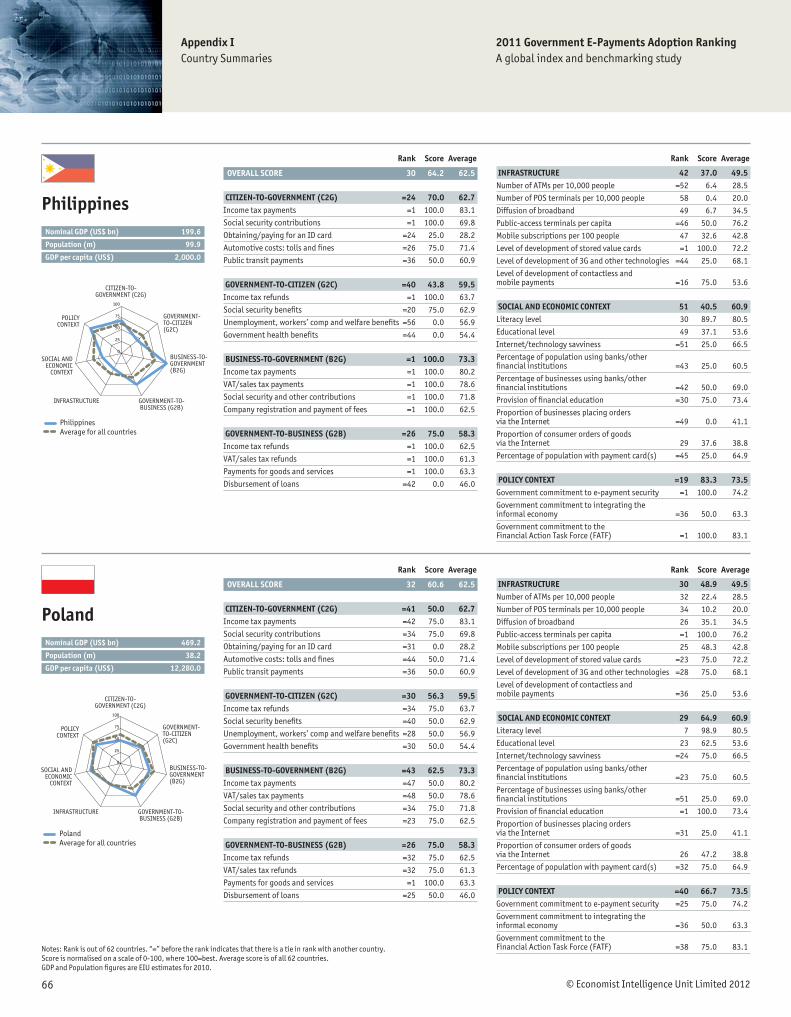
© Economist Intelligence Unit Limited 201266
Appendix ICountry Summaries
Notes: Rank is out of 62 countries. “=” before the rank indicates that there is a tie in rank with another country. Score is normalised on a scale of 0-100, where 100=best. Average score is of all 62 countries. GDP and Population fi gures are EIU estimates for 2010.
2011 Government E-Payments Adoption RankingA global index and benchmarking study
Rank Score Average
OVERALL SCORE 30 64.2 62.5
CITIZEN-TO-GOVERNMENT (C2G) =24 70.0 62.7Income tax payments =1 100.0 83.1
Social security contributions =1 100.0 69.8
Obtaining/paying for an ID card =24 25.0 28.2
Automotive costs: tolls and fi nes =26 75.0 71.4
Public transit payments =36 50.0 60.9
GOVERNMENT-TO-CITIZEN (G2C) =40 43.8 59.5Income tax refunds =1 100.0 63.7
Social security benefi ts =20 75.0 62.9
Unemployment, workers’ comp and welfare benefi ts =56 0.0 56.9
Government health benefi ts =44 0.0 54.4
BUSINESS-TO-GOVERNMENT (B2G) =1 100.0 73.3Income tax payments =1 100.0 80.2
VAT/sales tax payments =1 100.0 78.6
Social security and other contributions =1 100.0 71.8
Company registration and payment of fees =1 100.0 62.5
GOVERNMENT-TO-BUSINESS (G2B) =26 75.0 58.3Income tax refunds =1 100.0 62.5
VAT/sales tax refunds =1 100.0 61.3
Payments for goods and services =1 100.0 63.3
Disbursement of loans =42 0.0 46.0
Rank Score Average
INFRASTRUCTURE 42 37.0 49.5Number of ATMs per 10,000 people =52 6.4 28.5
Number of POS terminals per 10,000 people 58 0.4 20.0
Diffusion of broadband 49 6.7 34.5
Public-access terminals per capita =46 50.0 76.2
Mobile subscriptions per 100 people 47 32.6 42.8
Level of development of stored value cards =1 100.0 72.2
Level of development of 3G and other technologies =44 25.0 68.1
Level of development of contactless and mobile payments =16 75.0 53.6
SOCIAL AND ECONOMIC CONTEXT 51 40.5 60.9Literacy level 30 89.7 80.5
Educational level 49 37.1 53.6
Internet/technology savviness =51 25.0 66.5
Percentage of population using banks/other fi nancial institutions =43 25.0 60.5
Percentage of businesses using banks/other fi nancial institutions =42 50.0 69.0
Provision of fi nancial education =30 75.0 73.4
Proportion of businesses placing orders via the Internet =49 0.0 41.1
Proportion of consumer orders of goods via the Internet 29 37.6 38.8
Percentage of population with payment card(s) =45 25.0 64.9
POLICY CONTEXT =19 83.3 73.5Government commitment to e-payment security =1 100.0 74.2
Government commitment to integrating the informal economy =36 50.0 63.3
Government commitment to the Financial Action Task Force (FATF) =1 100.0 83.1
PhilippinesAverage for all countries
CITIZEN-TO-GOVERNMENT (C2G)
GOVERNMENT-TO-CITIZEN (G2C)
BUSINESS-TO-GOVERNMENT(B2G)
INFRASTRUCTURE
SOCIAL ANDECONOMIC
CONTEXT
POLICYCONTEXT
GOVERNMENT-TO-BUSINESS (G2B)
100
75
50
25
0
Rank Score Average
OVERALL SCORE 32 60.6 62.5
CITIZEN-TO-GOVERNMENT (C2G) =41 50.0 62.7Income tax payments =42 75.0 83.1
Social security contributions =34 75.0 69.8
Obtaining/paying for an ID card =31 0.0 28.2
Automotive costs: tolls and fi nes =44 50.0 71.4
Public transit payments =36 50.0 60.9
GOVERNMENT-TO-CITIZEN (G2C) =30 56.3 59.5Income tax refunds =34 75.0 63.7
Social security benefi ts =40 50.0 62.9
Unemployment, workers’ comp and welfare benefi ts =28 50.0 56.9
Government health benefi ts =30 50.0 54.4
BUSINESS-TO-GOVERNMENT (B2G) =43 62.5 73.3Income tax payments =47 50.0 80.2
VAT/sales tax payments =48 50.0 78.6
Social security and other contributions =34 75.0 71.8
Company registration and payment of fees =23 75.0 62.5
GOVERNMENT-TO-BUSINESS (G2B) =26 75.0 58.3Income tax refunds =32 75.0 62.5
VAT/sales tax refunds =32 75.0 61.3
Payments for goods and services =1 100.0 63.3
Disbursement of loans =25 50.0 46.0
Rank Score Average
INFRASTRUCTURE 30 48.9 49.5Number of ATMs per 10,000 people 32 22.4 28.5
Number of POS terminals per 10,000 people 34 10.2 20.0
Diffusion of broadband 26 35.1 34.5
Public-access terminals per capita =1 100.0 76.2
Mobile subscriptions per 100 people 25 48.3 42.8
Level of development of stored value cards =23 75.0 72.2
Level of development of 3G and other technologies =28 75.0 68.1
Level of development of contactless and mobile payments =36 25.0 53.6
SOCIAL AND ECONOMIC CONTEXT 29 64.9 60.9Literacy level 7 98.9 80.5
Educational level 23 62.5 53.6
Internet/technology savviness =24 75.0 66.5
Percentage of population using banks/other fi nancial institutions =23 75.0 60.5
Percentage of businesses using banks/other fi nancial institutions =51 25.0 69.0
Provision of fi nancial education =1 100.0 73.4
Proportion of businesses placing orders via the Internet =31 25.0 41.1
Proportion of consumer orders of goods via the Internet 26 47.2 38.8
Percentage of population with payment card(s) =32 75.0 64.9
POLICY CONTEXT =40 66.7 73.5Government commitment to e-payment security =25 75.0 74.2
Government commitment to integrating the informal economy =36 50.0 63.3
Government commitment to the Financial Action Task Force (FATF) =38 75.0 83.1
PolandAverage for all countries
CITIZEN-TO-GOVERNMENT (C2G)
GOVERNMENT-TO-CITIZEN (G2C)
BUSINESS-TO-GOVERNMENT(B2G)
INFRASTRUCTURE
SOCIAL ANDECONOMIC
CONTEXT
POLICYCONTEXT
GOVERNMENT-TO-BUSINESS (G2B)
100
75
50
25
0
Philippines Nominal GDP (US$ bn) 199.6
Population (m) 99.9
GDP per capita (US$) 2,000.0
Poland Nominal GDP (US$ bn) 469.2
Population (m) 38.2
GDP per capita (US$) 12,280.0

© Economist Intelligence Unit Limited 201267
Notes: Rank is out of 62 countries. “=” before the rank indicates that there is a tie in rank with another country. Score is normalised on a scale of 0-100, where 100=best. Average score is of all 62 countries. GDP and Population fi gures are EIU estimates for 2010.
Appendix ICountry Summaries
2011 Government E-Payments Adoption RankingA global index and benchmarking study
Rank Score Average
OVERALL SCORE 50 44.0 62.5
CITIZEN-TO-GOVERNMENT (C2G) =32 60.0 62.7Income tax payments =1 100.0 83.1
Social security contributions =53 0.0 69.8
Obtaining/paying for an ID card =1 100.0 28.2
Automotive costs: tolls and fi nes =1 100.0 71.4
Public transit payments =55 0.0 60.9
GOVERNMENT-TO-CITIZEN (G2C) 57 12.5 59.5Income tax refunds =46 0.0 63.7
Social security benefi ts =51 0.0 62.9
Unemployment, workers’ comp and welfare benefi ts =56 0.0 56.9
Government health benefi ts =30 50.0 54.4
BUSINESS-TO-GOVERNMENT (B2G) =58 25.0 73.3Income tax payments =1 100.0 80.2
VAT/sales tax payments =56 0.0 78.6
Social security and other contributions =54 0.0 71.8
Company registration and payment of fees =50 0.0 62.5
GOVERNMENT-TO-BUSINESS (G2B) =44 31.3 58.3Income tax refunds =46 0.0 62.5
VAT/sales tax refunds =46 0.0 61.3
Payments for goods and services =25 75.0 63.3
Disbursement of loans =25 50.0 46.0
Rank Score Average
INFRASTRUCTURE 29 49.7 49.5Number of ATMs per 10,000 people 37 19.6 28.5
Number of POS terminals per 10,000 people 36 7.6 20.0
Diffusion of broadband 35 22.6 34.5
Public-access terminals per capita =26 75.0 76.2
Mobile subscriptions per 100 people 2 72.5 42.8
Level of development of stored value cards =23 75.0 72.2
Level of development of 3G and other technologies =1 100.0 68.1
Level of development of contactless and mobile payments =36 25.0 53.6
SOCIAL AND ECONOMIC CONTEXT 47 46.4 60.9Literacy level 32 88.1 80.5
Educational level 47 38.1 53.6
Internet/technology savviness =24 75.0 66.5
Percentage of population using banks/other fi nancial institutions =43 25.0 60.5
Percentage of businesses using banks/other fi nancial institutions =1 100.0 69.0
Provision of fi nancial education =59 0.0 73.4
Proportion of businesses placing orders via the Internet =7 75.0 41.1
Proportion of consumer orders of goods via the Internet 39 16.7 38.8
Percentage of population with payment card(s) =49 0.0 64.9
POLICY CONTEXT =19 83.3 73.5Government commitment to e-payment security =1 100.0 74.2
Government commitment to integrating the informal economy =8 75.0 63.3
Government commitment to the Financial Action Task Force (FATF) =38 75.0 83.1
QatarAverage for all countries
CITIZEN-TO-GOVERNMENT (C2G)
GOVERNMENT-TO-CITIZEN (G2C)
BUSINESS-TO-GOVERNMENT(B2G)
INFRASTRUCTURE
SOCIAL ANDECONOMIC
CONTEXT
POLICYCONTEXT
GOVERNMENT-TO-BUSINESS (G2B)
100
75
50
25
0
Rank Score Average
OVERALL SCORE 40 50.1 62.5
CITIZEN-TO-GOVERNMENT (C2G) =41 50.0 62.7Income tax payments =50 50.0 83.1
Social security contributions =1 100.0 69.8
Obtaining/paying for an ID card =31 0.0 28.2
Automotive costs: tolls and fi nes =53 25.0 71.4
Public transit payments =19 75.0 60.9
GOVERNMENT-TO-CITIZEN (G2C) =47 37.5 59.5Income tax refunds =46 0.0 63.7
Social security benefi ts =20 75.0 62.9
Unemployment, workers’ comp and welfare benefi ts =11 75.0 56.9
Government health benefi ts =44 0.0 54.4
BUSINESS-TO-GOVERNMENT (B2G) =49 50.0 73.3Income tax payments =47 50.0 80.2
VAT/sales tax payments =48 50.0 78.6
Social security and other contributions =44 50.0 71.8
Company registration and payment of fees =38 50.0 62.5
GOVERNMENT-TO-BUSINESS (G2B) =33 56.3 58.3Income tax refunds =38 50.0 62.5
VAT/sales tax refunds =35 50.0 61.3
Payments for goods and services =25 75.0 63.3
Disbursement of loans =25 50.0 46.0
Rank Score Average
INFRASTRUCTURE 33 45.4 49.5Number of ATMs per 10,000 people 18 35.2 28.5
Number of POS terminals per 10,000 people 43 4.5 20.0
Diffusion of broadband 31 27.9 34.5
Public-access terminals per capita =26 75.0 76.2
Mobile subscriptions per 100 people 4 70.9 42.8
Level of development of stored value cards =38 50.0 72.2
Level of development of 3G and other technologies =28 75.0 68.1
Level of development of contactless and mobile payments =36 25.0 53.6
SOCIAL AND ECONOMIC CONTEXT 38 53.5 60.9Literacy level 6 99.0 80.5
Educational level 33 53.6 53.6
Internet/technology savviness =34 50.0 66.5
Percentage of population using banks/other fi nancial institutions =43 25.0 60.5
Percentage of businesses using banks/other fi nancial institutions =42 50.0 69.0
Provision of fi nancial education =30 75.0 73.4
Proportion of businesses placing orders via the Internet =31 25.0 41.1
Proportion of consumer orders of goods via the Internet 33 29.1 38.8
Percentage of population with payment card(s) =32 75.0 64.9
POLICY CONTEXT =45 58.3 73.5Government commitment to e-payment security =43 50.0 74.2
Government commitment to integrating the informal economy =55 25.0 63.3
Government commitment to the Financial Action Task Force (FATF) =1 100.0 83.1
RussiaAverage for all countries
CITIZEN-TO-GOVERNMENT (C2G)
GOVERNMENT-TO-CITIZEN (G2C)
BUSINESS-TO-GOVERNMENT(B2G)
INFRASTRUCTURE
SOCIAL ANDECONOMIC
CONTEXT
POLICYCONTEXT
GOVERNMENT-TO-BUSINESS (G2B)
100
75
50
25
0
Qatar Nominal GDP (US$ bn) 128.1
Population (m) 1.7
GDP per capita (US$) 74,760.0
Russia Nominal GDP (US$ bn) 1,479.4
Population (m) 141.7
GDP per capita (US$) 10,441.2
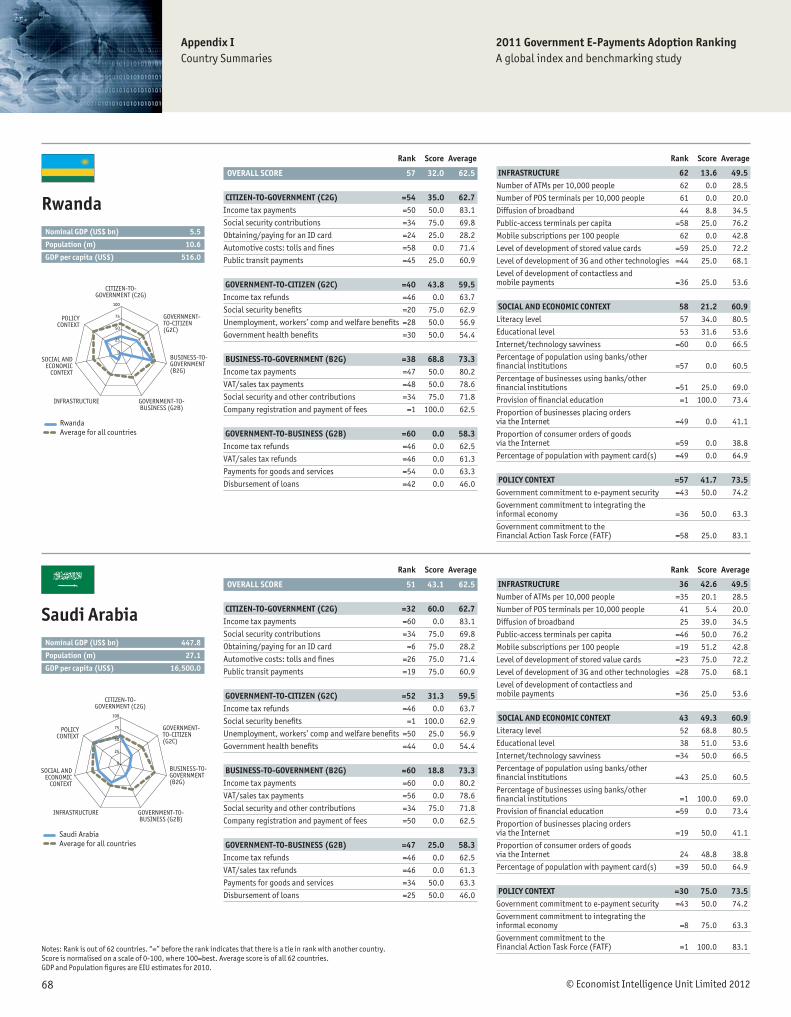
© Economist Intelligence Unit Limited 201268
Appendix ICountry Summaries
Notes: Rank is out of 62 countries. “=” before the rank indicates that there is a tie in rank with another country. Score is normalised on a scale of 0-100, where 100=best. Average score is of all 62 countries. GDP and Population fi gures are EIU estimates for 2010.
2011 Government E-Payments Adoption RankingA global index and benchmarking study
Rank Score Average
OVERALL SCORE 57 32.0 62.5
CITIZEN-TO-GOVERNMENT (C2G) =54 35.0 62.7Income tax payments =50 50.0 83.1
Social security contributions =34 75.0 69.8
Obtaining/paying for an ID card =24 25.0 28.2
Automotive costs: tolls and fi nes =58 0.0 71.4
Public transit payments =45 25.0 60.9
GOVERNMENT-TO-CITIZEN (G2C) =40 43.8 59.5Income tax refunds =46 0.0 63.7
Social security benefi ts =20 75.0 62.9
Unemployment, workers’ comp and welfare benefi ts =28 50.0 56.9
Government health benefi ts =30 50.0 54.4
BUSINESS-TO-GOVERNMENT (B2G) =38 68.8 73.3Income tax payments =47 50.0 80.2
VAT/sales tax payments =48 50.0 78.6
Social security and other contributions =34 75.0 71.8
Company registration and payment of fees =1 100.0 62.5
GOVERNMENT-TO-BUSINESS (G2B) =60 0.0 58.3Income tax refunds =46 0.0 62.5
VAT/sales tax refunds =46 0.0 61.3
Payments for goods and services =54 0.0 63.3
Disbursement of loans =42 0.0 46.0
Rank Score Average
INFRASTRUCTURE 62 13.6 49.5Number of ATMs per 10,000 people 62 0.0 28.5
Number of POS terminals per 10,000 people 61 0.0 20.0
Diffusion of broadband 44 8.8 34.5
Public-access terminals per capita =58 25.0 76.2
Mobile subscriptions per 100 people 62 0.0 42.8
Level of development of stored value cards =59 25.0 72.2
Level of development of 3G and other technologies =44 25.0 68.1
Level of development of contactless and mobile payments =36 25.0 53.6
SOCIAL AND ECONOMIC CONTEXT 58 21.2 60.9Literacy level 57 34.0 80.5
Educational level 53 31.6 53.6
Internet/technology savviness =60 0.0 66.5
Percentage of population using banks/other fi nancial institutions =57 0.0 60.5
Percentage of businesses using banks/other fi nancial institutions =51 25.0 69.0
Provision of fi nancial education =1 100.0 73.4
Proportion of businesses placing orders via the Internet =49 0.0 41.1
Proportion of consumer orders of goods via the Internet =59 0.0 38.8
Percentage of population with payment card(s) =49 0.0 64.9
POLICY CONTEXT =57 41.7 73.5Government commitment to e-payment security =43 50.0 74.2
Government commitment to integrating the informal economy =36 50.0 63.3
Government commitment to the Financial Action Task Force (FATF) =58 25.0 83.1
RwandaAverage for all countries
CITIZEN-TO-GOVERNMENT (C2G)
GOVERNMENT-TO-CITIZEN (G2C)
BUSINESS-TO-GOVERNMENT(B2G)
INFRASTRUCTURE
SOCIAL ANDECONOMIC
CONTEXT
POLICYCONTEXT
GOVERNMENT-TO-BUSINESS (G2B)
100
75
50
25
0
Rank Score Average
OVERALL SCORE 51 43.1 62.5
CITIZEN-TO-GOVERNMENT (C2G) =32 60.0 62.7Income tax payments =60 0.0 83.1
Social security contributions =34 75.0 69.8
Obtaining/paying for an ID card =6 75.0 28.2
Automotive costs: tolls and fi nes =26 75.0 71.4
Public transit payments =19 75.0 60.9
GOVERNMENT-TO-CITIZEN (G2C) =52 31.3 59.5Income tax refunds =46 0.0 63.7
Social security benefi ts =1 100.0 62.9
Unemployment, workers’ comp and welfare benefi ts =50 25.0 56.9
Government health benefi ts =44 0.0 54.4
BUSINESS-TO-GOVERNMENT (B2G) =60 18.8 73.3Income tax payments =60 0.0 80.2
VAT/sales tax payments =56 0.0 78.6
Social security and other contributions =34 75.0 71.8
Company registration and payment of fees =50 0.0 62.5
GOVERNMENT-TO-BUSINESS (G2B) =47 25.0 58.3Income tax refunds =46 0.0 62.5
VAT/sales tax refunds =46 0.0 61.3
Payments for goods and services =34 50.0 63.3
Disbursement of loans =25 50.0 46.0
Rank Score Average
INFRASTRUCTURE 36 42.6 49.5Number of ATMs per 10,000 people =35 20.1 28.5
Number of POS terminals per 10,000 people 41 5.4 20.0
Diffusion of broadband 25 39.0 34.5
Public-access terminals per capita =46 50.0 76.2
Mobile subscriptions per 100 people =19 51.2 42.8
Level of development of stored value cards =23 75.0 72.2
Level of development of 3G and other technologies =28 75.0 68.1
Level of development of contactless and mobile payments =36 25.0 53.6
SOCIAL AND ECONOMIC CONTEXT 43 49.3 60.9Literacy level 52 68.8 80.5
Educational level 38 51.0 53.6
Internet/technology savviness =34 50.0 66.5
Percentage of population using banks/other fi nancial institutions =43 25.0 60.5
Percentage of businesses using banks/other fi nancial institutions =1 100.0 69.0
Provision of fi nancial education =59 0.0 73.4
Proportion of businesses placing orders via the Internet =19 50.0 41.1
Proportion of consumer orders of goods via the Internet 24 48.8 38.8
Percentage of population with payment card(s) =39 50.0 64.9
POLICY CONTEXT =30 75.0 73.5Government commitment to e-payment security =43 50.0 74.2
Government commitment to integrating the informal economy =8 75.0 63.3
Government commitment to the Financial Action Task Force (FATF) =1 100.0 83.1
Saudi ArabiaAverage for all countries
CITIZEN-TO-GOVERNMENT (C2G)
GOVERNMENT-TO-CITIZEN (G2C)
BUSINESS-TO-GOVERNMENT(B2G)
INFRASTRUCTURE
SOCIAL ANDECONOMIC
CONTEXT
POLICYCONTEXT
GOVERNMENT-TO-BUSINESS (G2B)
100
75
50
25
0
Rwanda Nominal GDP (US$ bn) 5.5
Population (m) 10.6
GDP per capita (US$) 516.0
Saudi Arabia Nominal GDP (US$ bn) 447.8
Population (m) 27.1
GDP per capita (US$) 16,500.0
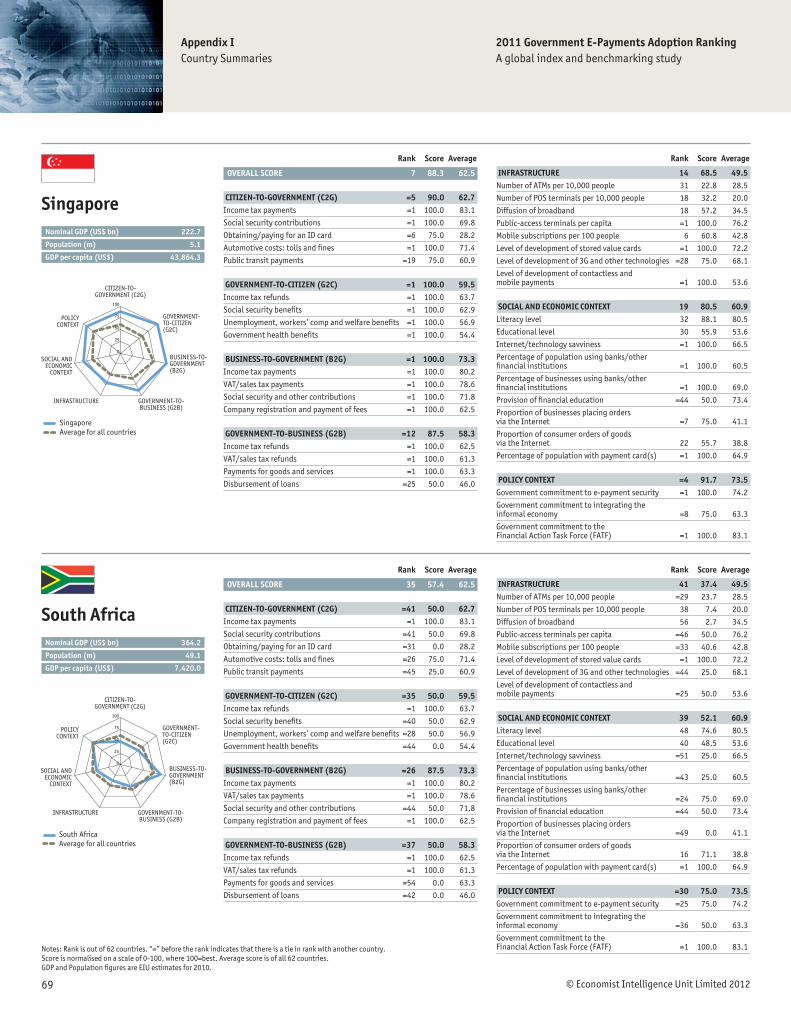
© Economist Intelligence Unit Limited 201269
Notes: Rank is out of 62 countries. “=” before the rank indicates that there is a tie in rank with another country. Score is normalised on a scale of 0-100, where 100=best. Average score is of all 62 countries. GDP and Population fi gures are EIU estimates for 2010.
Appendix ICountry Summaries
2011 Government E-Payments Adoption RankingA global index and benchmarking study
Rank Score Average
OVERALL SCORE 7 88.3 62.5
CITIZEN-TO-GOVERNMENT (C2G) =5 90.0 62.7Income tax payments =1 100.0 83.1
Social security contributions =1 100.0 69.8
Obtaining/paying for an ID card =6 75.0 28.2
Automotive costs: tolls and fi nes =1 100.0 71.4
Public transit payments =19 75.0 60.9
GOVERNMENT-TO-CITIZEN (G2C) =1 100.0 59.5Income tax refunds =1 100.0 63.7
Social security benefi ts =1 100.0 62.9
Unemployment, workers’ comp and welfare benefi ts =1 100.0 56.9
Government health benefi ts =1 100.0 54.4
BUSINESS-TO-GOVERNMENT (B2G) =1 100.0 73.3Income tax payments =1 100.0 80.2
VAT/sales tax payments =1 100.0 78.6
Social security and other contributions =1 100.0 71.8
Company registration and payment of fees =1 100.0 62.5
GOVERNMENT-TO-BUSINESS (G2B) =12 87.5 58.3Income tax refunds =1 100.0 62.5
VAT/sales tax refunds =1 100.0 61.3
Payments for goods and services =1 100.0 63.3
Disbursement of loans =25 50.0 46.0
Rank Score Average
INFRASTRUCTURE 14 68.5 49.5Number of ATMs per 10,000 people 31 22.8 28.5
Number of POS terminals per 10,000 people 18 32.2 20.0
Diffusion of broadband 18 57.2 34.5
Public-access terminals per capita =1 100.0 76.2
Mobile subscriptions per 100 people 6 60.8 42.8
Level of development of stored value cards =1 100.0 72.2
Level of development of 3G and other technologies =28 75.0 68.1
Level of development of contactless and mobile payments =1 100.0 53.6
SOCIAL AND ECONOMIC CONTEXT 19 80.5 60.9Literacy level 32 88.1 80.5
Educational level 30 55.9 53.6
Internet/technology savviness =1 100.0 66.5
Percentage of population using banks/other fi nancial institutions =1 100.0 60.5
Percentage of businesses using banks/other fi nancial institutions =1 100.0 69.0
Provision of fi nancial education =44 50.0 73.4
Proportion of businesses placing orders via the Internet =7 75.0 41.1
Proportion of consumer orders of goods via the Internet 22 55.7 38.8
Percentage of population with payment card(s) =1 100.0 64.9
POLICY CONTEXT =4 91.7 73.5Government commitment to e-payment security =1 100.0 74.2
Government commitment to integrating the informal economy =8 75.0 63.3
Government commitment to the Financial Action Task Force (FATF) =1 100.0 83.1
SingaporeAverage for all countries
CITIZEN-TO-GOVERNMENT (C2G)
GOVERNMENT-TO-CITIZEN (G2C)
BUSINESS-TO-GOVERNMENT(B2G)
INFRASTRUCTURE
SOCIAL ANDECONOMIC
CONTEXT
POLICYCONTEXT
GOVERNMENT-TO-BUSINESS (G2B)
100
75
50
25
0
Rank Score Average
OVERALL SCORE 35 57.4 62.5
CITIZEN-TO-GOVERNMENT (C2G) =41 50.0 62.7Income tax payments =1 100.0 83.1
Social security contributions =41 50.0 69.8
Obtaining/paying for an ID card =31 0.0 28.2
Automotive costs: tolls and fi nes =26 75.0 71.4
Public transit payments =45 25.0 60.9
GOVERNMENT-TO-CITIZEN (G2C) =35 50.0 59.5Income tax refunds =1 100.0 63.7
Social security benefi ts =40 50.0 62.9
Unemployment, workers’ comp and welfare benefi ts =28 50.0 56.9
Government health benefi ts =44 0.0 54.4
BUSINESS-TO-GOVERNMENT (B2G) =26 87.5 73.3Income tax payments =1 100.0 80.2
VAT/sales tax payments =1 100.0 78.6
Social security and other contributions =44 50.0 71.8
Company registration and payment of fees =1 100.0 62.5
GOVERNMENT-TO-BUSINESS (G2B) =37 50.0 58.3Income tax refunds =1 100.0 62.5
VAT/sales tax refunds =1 100.0 61.3
Payments for goods and services =54 0.0 63.3
Disbursement of loans =42 0.0 46.0
Rank Score Average
INFRASTRUCTURE 41 37.4 49.5Number of ATMs per 10,000 people =29 23.7 28.5
Number of POS terminals per 10,000 people 38 7.4 20.0
Diffusion of broadband 56 2.7 34.5
Public-access terminals per capita =46 50.0 76.2
Mobile subscriptions per 100 people =33 40.6 42.8
Level of development of stored value cards =1 100.0 72.2
Level of development of 3G and other technologies =44 25.0 68.1
Level of development of contactless and mobile payments =25 50.0 53.6
SOCIAL AND ECONOMIC CONTEXT 39 52.1 60.9Literacy level 48 74.6 80.5
Educational level 40 48.5 53.6
Internet/technology savviness =51 25.0 66.5
Percentage of population using banks/other fi nancial institutions =43 25.0 60.5
Percentage of businesses using banks/other fi nancial institutions =24 75.0 69.0
Provision of fi nancial education =44 50.0 73.4
Proportion of businesses placing orders via the Internet =49 0.0 41.1
Proportion of consumer orders of goods via the Internet 16 71.1 38.8
Percentage of population with payment card(s) =1 100.0 64.9
POLICY CONTEXT =30 75.0 73.5Government commitment to e-payment security =25 75.0 74.2
Government commitment to integrating the informal economy =36 50.0 63.3
Government commitment to the Financial Action Task Force (FATF) =1 100.0 83.1
South AfricaAverage for all countries
CITIZEN-TO-GOVERNMENT (C2G)
GOVERNMENT-TO-CITIZEN (G2C)
BUSINESS-TO-GOVERNMENT(B2G)
INFRASTRUCTURE
SOCIAL ANDECONOMIC
CONTEXT
POLICYCONTEXT
GOVERNMENT-TO-BUSINESS (G2B)
100
75
50
25
0
Singapore Nominal GDP (US$ bn) 222.7
Population (m) 5.1
GDP per capita (US$) 43,864.3
South Africa Nominal GDP (US$ bn) 364.2
Population (m) 49.1
GDP per capita (US$) 7,420.0

© Economist Intelligence Unit Limited 201270
Appendix ICountry Summaries
Notes: Rank is out of 62 countries. “=” before the rank indicates that there is a tie in rank with another country. Score is normalised on a scale of 0-100, where 100=best. Average score is of all 62 countries. GDP and Population fi gures are EIU estimates for 2010.
2011 Government E-Payments Adoption RankingA global index and benchmarking study
Rank Score Average
OVERALL SCORE 5 88.6 62.5
CITIZEN-TO-GOVERNMENT (C2G) =5 90.0 62.7Income tax payments =1 100.0 83.1
Social security contributions =1 100.0 69.8
Obtaining/paying for an ID card =13 50.0 28.2
Automotive costs: tolls and fi nes =1 100.0 71.4
Public transit payments =1 100.0 60.9
GOVERNMENT-TO-CITIZEN (G2C) =1 100.0 59.5Income tax refunds =1 100.0 63.7
Social security benefi ts =1 100.0 62.9
Unemployment, workers’ comp and welfare benefi ts =1 100.0 56.9
Government health benefi ts =1 100.0 54.4
BUSINESS-TO-GOVERNMENT (B2G) =33 75.0 73.3Income tax payments =1 100.0 80.2
VAT/sales tax payments =1 100.0 78.6
Social security and other contributions =1 100.0 71.8
Company registration and payment of fees =50 0.0 62.5
GOVERNMENT-TO-BUSINESS (G2B) =1 100.0 58.3Income tax refunds =1 100.0 62.5
VAT/sales tax refunds =1 100.0 61.3
Payments for goods and services =1 100.0 63.3
Disbursement of loans =1 100.0 46.0
Rank Score Average
INFRASTRUCTURE 1 82.7 49.5Number of ATMs per 10,000 people 4 73.1 28.5
Number of POS terminals per 10,000 people 1 100.0 20.0
Diffusion of broadband 7 75.0 34.5
Public-access terminals per capita =1 100.0 76.2
Mobile subscriptions per 100 people =38 38.7 42.8
Level of development of stored value cards =23 75.0 72.2
Level of development of 3G and other technologies =1 100.0 68.1
Level of development of contactless and mobile payments =1 100.0 53.6
SOCIAL AND ECONOMIC CONTEXT 10 88.9 60.9Literacy level 1 100.0 80.5
Educational level 6 74.4 53.6
Internet/technology savviness =1 100.0 66.5
Percentage of population using banks/other fi nancial institutions =1 100.0 60.5
Percentage of businesses using banks/other fi nancial institutions =24 75.0 69.0
Provision of fi nancial education =1 100.0 73.4
Proportion of businesses placing orders via the Internet =7 75.0 41.1
Proportion of consumer orders of goods via the Internet 13 76.1 38.8
Percentage of population with payment card(s) =1 100.0 64.9
POLICY CONTEXT =19 83.3 73.5Government commitment to e-payment security =1 100.0 74.2
Government commitment to integrating the informal economy =8 75.0 63.3
Government commitment to the Financial Action Task Force (FATF) =38 75.0 83.1
South KoreaAverage for all countries
CITIZEN-TO-GOVERNMENT (C2G)
GOVERNMENT-TO-CITIZEN (G2C)
BUSINESS-TO-GOVERNMENT(B2G)
INFRASTRUCTURE
SOCIAL ANDECONOMIC
CONTEXT
POLICYCONTEXT
GOVERNMENT-TO-BUSINESS (G2B)
100
75
50
25
0
Rank Score Average
OVERALL SCORE 22 78.1 62.5
CITIZEN-TO-GOVERNMENT (C2G) =19 75.0 62.7Income tax payments =1 100.0 83.1
Social security contributions =1 100.0 69.8
Obtaining/paying for an ID card =31 0.0 28.2
Automotive costs: tolls and fi nes =1 100.0 71.4
Public transit payments =19 75.0 60.9
GOVERNMENT-TO-CITIZEN (G2C) =18 81.3 59.5Income tax refunds =34 75.0 63.7
Social security benefi ts =1 100.0 62.9
Unemployment, workers’ comp and welfare benefi ts =28 50.0 56.9
Government health benefi ts =1 100.0 54.4
BUSINESS-TO-GOVERNMENT (B2G) =26 87.5 73.3Income tax payments =39 75.0 80.2
VAT/sales tax payments =1 100.0 78.6
Social security and other contributions =1 100.0 71.8
Company registration and payment of fees =23 75.0 62.5
GOVERNMENT-TO-BUSINESS (G2B) =21 81.3 58.3Income tax refunds =1 100.0 62.5
VAT/sales tax refunds =1 100.0 61.3
Payments for goods and services =34 50.0 63.3
Disbursement of loans =11 75.0 46.0
Rank Score Average
INFRASTRUCTURE 22 62.8 49.5Number of ATMs per 10,000 people 6 70.8 28.5
Number of POS terminals per 10,000 people 5 57.1 20.0
Diffusion of broadband 22 50.9 34.5
Public-access terminals per capita =26 75.0 76.2
Mobile subscriptions per 100 people 24 48.8 42.8
Level of development of stored value cards =23 75.0 72.2
Level of development of 3G and other technologies =1 100.0 68.1
Level of development of contactless and mobile payments =36 25.0 53.6
SOCIAL AND ECONOMIC CONTEXT 20 75.5 60.9Literacy level 26 94.8 80.5
Educational level 9 72.1 53.6
Internet/technology savviness =1 100.0 66.5
Percentage of population using banks/other fi nancial institutions =1 100.0 60.5
Percentage of businesses using banks/other fi nancial institutions =24 75.0 69.0
Provision of fi nancial education =30 75.0 73.4
Proportion of businesses placing orders via the Internet =31 25.0 41.1
Proportion of consumer orders of goods via the Internet 28 37.8 38.8
Percentage of population with payment card(s) =1 100.0 64.9
POLICY CONTEXT =19 83.3 73.5Government commitment to e-payment security =1 100.0 74.2
Government commitment to integrating the informal economy =36 50.0 63.3
Government commitment to the Financial Action Task Force (FATF) =1 100.0 83.1
SpainAverage for all countries
CITIZEN-TO-GOVERNMENT (C2G)
GOVERNMENT-TO-CITIZEN (G2C)
BUSINESS-TO-GOVERNMENT(B2G)
INFRASTRUCTURE
SOCIAL ANDECONOMIC
CONTEXT
POLICYCONTEXT
GOVERNMENT-TO-BUSINESS (G2B)
100
75
50
25
0
South Korea Nominal GDP (US$ bn) 1,014.5
Population (m) 49.5
GDP per capita (US$) 20,490.0
Spain Nominal GDP (US$ bn) 1,409.9
Population (m) 45.9
GDP per capita (US$) 30,700.0

© Economist Intelligence Unit Limited 201271
Notes: Rank is out of 62 countries. “=” before the rank indicates that there is a tie in rank with another country. Score is normalised on a scale of 0-100, where 100=best. Average score is of all 62 countries. GDP and Population fi gures are EIU estimates for 2010.
Appendix ICountry Summaries
2011 Government E-Payments Adoption RankingA global index and benchmarking study
Rank Score Average
OVERALL SCORE 10 86.4 62.5
CITIZEN-TO-GOVERNMENT (C2G) =5 90.0 62.7Income tax payments =1 100.0 83.1
Social security contributions =1 100.0 69.8
Obtaining/paying for an ID card =6 75.0 28.2
Automotive costs: tolls and fi nes =1 100.0 71.4
Public transit payments =19 75.0 60.9
GOVERNMENT-TO-CITIZEN (G2C) =1 100.0 59.5Income tax refunds =1 100.0 63.7
Social security benefi ts =1 100.0 62.9
Unemployment, workers’ comp and welfare benefi ts =1 100.0 56.9
Government health benefi ts =1 100.0 54.4
BUSINESS-TO-GOVERNMENT (B2G) =31 81.3 73.3Income tax payments =47 50.0 80.2
VAT/sales tax payments =1 100.0 78.6
Social security and other contributions =34 75.0 71.8
Company registration and payment of fees =1 100.0 62.5
GOVERNMENT-TO-BUSINESS (G2B) =21 81.3 58.3Income tax refunds =1 100.0 62.5
VAT/sales tax refunds =1 100.0 61.3
Payments for goods and services =34 50.0 63.3
Disbursement of loans =11 75.0 46.0
Rank Score Average
INFRASTRUCTURE 6 75.7 49.5Number of ATMs per 10,000 people =41 16.9 28.5
Number of POS terminals per 10,000 people 17 32.7 20.0
Diffusion of broadband 1 100.0 34.5
Public-access terminals per capita =1 100.0 76.2
Mobile subscriptions per 100 people =10 56.0 42.8
Level of development of stored value cards =1 100.0 72.2
Level of development of 3G and other technologies =1 100.0 68.1
Level of development of contactless and mobile payments =1 100.0 53.6
SOCIAL AND ECONOMIC CONTEXT 12 85.0 60.9Literacy level =9 97.8 80.5
Educational level 19 65.5 53.6
Internet/technology savviness =1 100.0 66.5
Percentage of population using banks/other fi nancial institutions =1 100.0 60.5
Percentage of businesses using banks/other fi nancial institutions =1 100.0 69.0
Provision of fi nancial education =44 50.0 73.4
Proportion of businesses placing orders via the Internet =7 75.0 41.1
Proportion of consumer orders of goods via the Internet 11 76.7 38.8
Percentage of population with payment card(s) =1 100.0 64.9
POLICY CONTEXT =4 91.7 73.5Government commitment to e-payment security =1 100.0 74.2
Government commitment to integrating the informal economy =8 75.0 63.3
Government commitment to the Financial Action Task Force (FATF) =1 100.0 83.1
SwedenAverage for all countries
CITIZEN-TO-GOVERNMENT (C2G)
GOVERNMENT-TO-CITIZEN (G2C)
BUSINESS-TO-GOVERNMENT(B2G)
INFRASTRUCTURE
SOCIAL ANDECONOMIC
CONTEXT
POLICYCONTEXT
GOVERNMENT-TO-BUSINESS (G2B)
100
75
50
25
0
Rank Score Average
OVERALL SCORE 13 84.4 62.5
CITIZEN-TO-GOVERNMENT (C2G) =12 80.0 62.7Income tax payments =1 100.0 83.1
Social security contributions =1 100.0 69.8
Obtaining/paying for an ID card =31 0.0 28.2
Automotive costs: tolls and fi nes =1 100.0 71.4
Public transit payments =1 100.0 60.9
GOVERNMENT-TO-CITIZEN (G2C) =18 81.3 59.5Income tax refunds =1 100.0 63.7
Social security benefi ts =20 75.0 62.9
Unemployment, workers’ comp and welfare benefi ts =11 75.0 56.9
Government health benefi ts =23 75.0 54.4
BUSINESS-TO-GOVERNMENT (B2G) =1 100.0 73.3Income tax payments =1 100.0 80.2
VAT/sales tax payments =1 100.0 78.6
Social security and other contributions =1 100.0 71.8
Company registration and payment of fees =1 100.0 62.5
GOVERNMENT-TO-BUSINESS (G2B) =6 93.8 58.3Income tax refunds =1 100.0 62.5
VAT/sales tax refunds =1 100.0 61.3
Payments for goods and services =1 100.0 63.3
Disbursement of loans =11 75.0 46.0
Rank Score Average
INFRASTRUCTURE 13 68.7 49.5Number of ATMs per 10,000 people 7 60.7 28.5
Number of POS terminals per 10,000 people 26 17.6 20.0
Diffusion of broadband 23 50.4 34.5
Public-access terminals per capita =1 100.0 76.2
Mobile subscriptions per 100 people =28 45.9 42.8
Level of development of stored value cards =23 75.0 72.2
Level of development of 3G and other technologies =1 100.0 68.1
Level of development of contactless and mobile payments =1 100.0 53.6
SOCIAL AND ECONOMIC CONTEXT 5 91.9 60.9Literacy level 28 91.2 80.5
Educational level 11 69.3 53.6
Internet/technology savviness =1 100.0 66.5
Percentage of population using banks/other fi nancial institutions =1 100.0 60.5
Percentage of businesses using banks/other fi nancial institutions =24 75.0 69.0
Provision of fi nancial education =1 100.0 73.4
Proportion of businesses placing orders via the Internet =1 100.0 41.1
Proportion of consumer orders of goods via the Internet 4 92.0 38.8
Percentage of population with payment card(s) =1 100.0 64.9
POLICY CONTEXT =30 75.0 73.5Government commitment to e-payment security =1 100.0 74.2
Government commitment to integrating the informal economy =36 50.0 63.3
Government commitment to the Financial Action Task Force (FATF) =38 75.0 83.1
TaiwanAverage for all countries
CITIZEN-TO-GOVERNMENT (C2G)
GOVERNMENT-TO-CITIZEN (G2C)
BUSINESS-TO-GOVERNMENT(B2G)
INFRASTRUCTURE
SOCIAL ANDECONOMIC
CONTEXT
POLICYCONTEXT
GOVERNMENT-TO-BUSINESS (G2B)
100
75
50
25
0
SwedenNominal GDP (US$ bn) 458.9
Population (m) 9.4
GDP per capita (US$) 48,753.8
Taiwan Nominal GDP (US$ bn) 429.8
Population (m) 23.2
GDP per capita (US$) 18,550.0
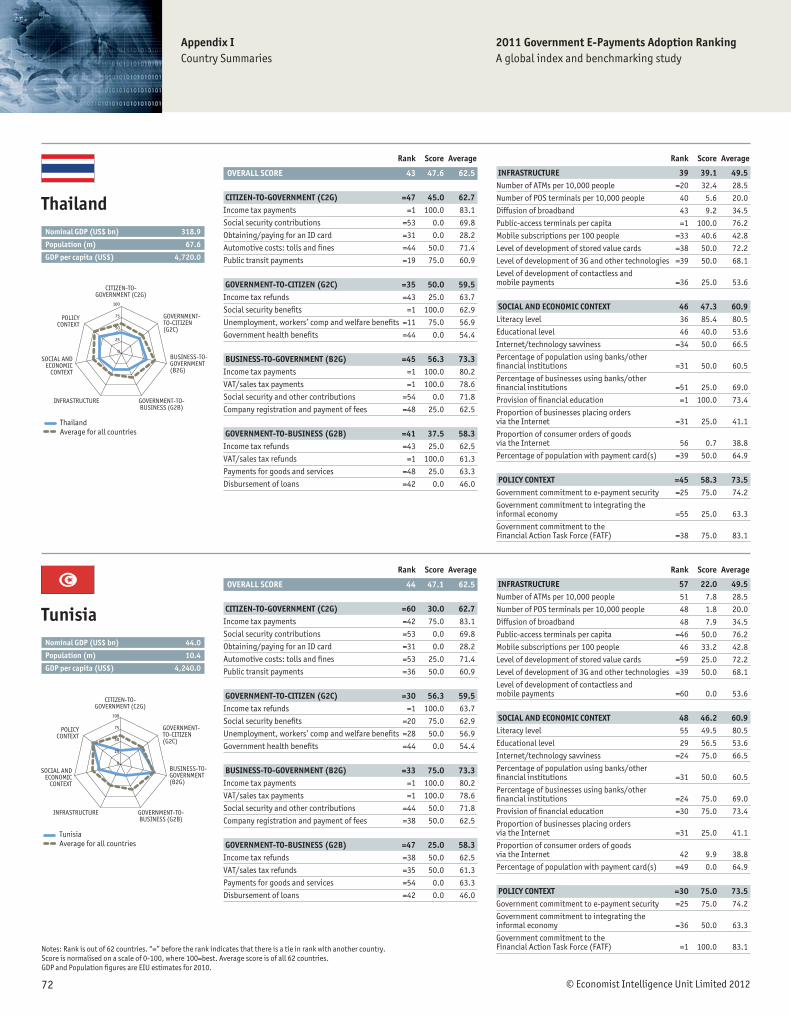
© Economist Intelligence Unit Limited 201272
Appendix ICountry Summaries
Notes: Rank is out of 62 countries. “=” before the rank indicates that there is a tie in rank with another country. Score is normalised on a scale of 0-100, where 100=best. Average score is of all 62 countries. GDP and Population fi gures are EIU estimates for 2010.
2011 Government E-Payments Adoption RankingA global index and benchmarking study
Rank Score Average
OVERALL SCORE 43 47.6 62.5
CITIZEN-TO-GOVERNMENT (C2G) =47 45.0 62.7Income tax payments =1 100.0 83.1
Social security contributions =53 0.0 69.8
Obtaining/paying for an ID card =31 0.0 28.2
Automotive costs: tolls and fi nes =44 50.0 71.4
Public transit payments =19 75.0 60.9
GOVERNMENT-TO-CITIZEN (G2C) =35 50.0 59.5Income tax refunds =43 25.0 63.7
Social security benefi ts =1 100.0 62.9
Unemployment, workers’ comp and welfare benefi ts =11 75.0 56.9
Government health benefi ts =44 0.0 54.4
BUSINESS-TO-GOVERNMENT (B2G) =45 56.3 73.3Income tax payments =1 100.0 80.2
VAT/sales tax payments =1 100.0 78.6
Social security and other contributions =54 0.0 71.8
Company registration and payment of fees =48 25.0 62.5
GOVERNMENT-TO-BUSINESS (G2B) =41 37.5 58.3Income tax refunds =43 25.0 62.5
VAT/sales tax refunds =1 100.0 61.3
Payments for goods and services =48 25.0 63.3
Disbursement of loans =42 0.0 46.0
Rank Score Average
INFRASTRUCTURE 39 39.1 49.5Number of ATMs per 10,000 people =20 32.4 28.5
Number of POS terminals per 10,000 people 40 5.6 20.0
Diffusion of broadband 43 9.2 34.5
Public-access terminals per capita =1 100.0 76.2
Mobile subscriptions per 100 people =33 40.6 42.8
Level of development of stored value cards =38 50.0 72.2
Level of development of 3G and other technologies =39 50.0 68.1
Level of development of contactless and mobile payments =36 25.0 53.6
SOCIAL AND ECONOMIC CONTEXT 46 47.3 60.9Literacy level 36 85.4 80.5
Educational level 46 40.0 53.6
Internet/technology savviness =34 50.0 66.5
Percentage of population using banks/other fi nancial institutions =31 50.0 60.5
Percentage of businesses using banks/other fi nancial institutions =51 25.0 69.0
Provision of fi nancial education =1 100.0 73.4
Proportion of businesses placing orders via the Internet =31 25.0 41.1
Proportion of consumer orders of goods via the Internet 56 0.7 38.8
Percentage of population with payment card(s) =39 50.0 64.9
POLICY CONTEXT =45 58.3 73.5Government commitment to e-payment security =25 75.0 74.2
Government commitment to integrating the informal economy =55 25.0 63.3
Government commitment to the Financial Action Task Force (FATF) =38 75.0 83.1
ThailandAverage for all countries
CITIZEN-TO-GOVERNMENT (C2G)
GOVERNMENT-TO-CITIZEN (G2C)
BUSINESS-TO-GOVERNMENT(B2G)
INFRASTRUCTURE
SOCIAL ANDECONOMIC
CONTEXT
POLICYCONTEXT
GOVERNMENT-TO-BUSINESS (G2B)
100
75
50
25
0
Rank Score Average
OVERALL SCORE 44 47.1 62.5
CITIZEN-TO-GOVERNMENT (C2G) =60 30.0 62.7Income tax payments =42 75.0 83.1
Social security contributions =53 0.0 69.8
Obtaining/paying for an ID card =31 0.0 28.2
Automotive costs: tolls and fi nes =53 25.0 71.4
Public transit payments =36 50.0 60.9
GOVERNMENT-TO-CITIZEN (G2C) =30 56.3 59.5Income tax refunds =1 100.0 63.7
Social security benefi ts =20 75.0 62.9
Unemployment, workers’ comp and welfare benefi ts =28 50.0 56.9
Government health benefi ts =44 0.0 54.4
BUSINESS-TO-GOVERNMENT (B2G) =33 75.0 73.3Income tax payments =1 100.0 80.2
VAT/sales tax payments =1 100.0 78.6
Social security and other contributions =44 50.0 71.8
Company registration and payment of fees =38 50.0 62.5
GOVERNMENT-TO-BUSINESS (G2B) =47 25.0 58.3Income tax refunds =38 50.0 62.5
VAT/sales tax refunds =35 50.0 61.3
Payments for goods and services =54 0.0 63.3
Disbursement of loans =42 0.0 46.0
Rank Score Average
INFRASTRUCTURE 57 22.0 49.5Number of ATMs per 10,000 people 51 7.8 28.5
Number of POS terminals per 10,000 people 48 1.8 20.0
Diffusion of broadband 48 7.9 34.5
Public-access terminals per capita =46 50.0 76.2
Mobile subscriptions per 100 people 46 33.2 42.8
Level of development of stored value cards =59 25.0 72.2
Level of development of 3G and other technologies =39 50.0 68.1
Level of development of contactless and mobile payments =60 0.0 53.6
SOCIAL AND ECONOMIC CONTEXT 48 46.2 60.9Literacy level 55 49.5 80.5
Educational level 29 56.5 53.6
Internet/technology savviness =24 75.0 66.5
Percentage of population using banks/other fi nancial institutions =31 50.0 60.5
Percentage of businesses using banks/other fi nancial institutions =24 75.0 69.0
Provision of fi nancial education =30 75.0 73.4
Proportion of businesses placing orders via the Internet =31 25.0 41.1
Proportion of consumer orders of goods via the Internet 42 9.9 38.8
Percentage of population with payment card(s) =49 0.0 64.9
POLICY CONTEXT =30 75.0 73.5Government commitment to e-payment security =25 75.0 74.2
Government commitment to integrating the informal economy =36 50.0 63.3
Government commitment to the Financial Action Task Force (FATF) =1 100.0 83.1
TunisiaAverage for all countries
CITIZEN-TO-GOVERNMENT (C2G)
GOVERNMENT-TO-CITIZEN (G2C)
BUSINESS-TO-GOVERNMENT(B2G)
INFRASTRUCTURE
SOCIAL ANDECONOMIC
CONTEXT
POLICYCONTEXT
GOVERNMENT-TO-BUSINESS (G2B)
100
75
50
25
0
Thailand Nominal GDP (US$ bn) 318.9
Population (m) 67.6
GDP per capita (US$) 4,720.0
Tunisia Nominal GDP (US$ bn) 44.0
Population (m) 10.4
GDP per capita (US$) 4,240.0

© Economist Intelligence Unit Limited 201273
Notes: Rank is out of 62 countries. “=” before the rank indicates that there is a tie in rank with another country. Score is normalised on a scale of 0-100, where 100=best. Average score is of all 62 countries. GDP and Population fi gures are EIU estimates for 2010.
Appendix ICountry Summaries
2011 Government E-Payments Adoption RankingA global index and benchmarking study
Rank Score Average
OVERALL SCORE 24 74.6 62.5
CITIZEN-TO-GOVERNMENT (C2G) =12 80.0 62.7Income tax payments =1 100.0 83.1
Social security contributions =1 100.0 69.8
Obtaining/paying for an ID card =24 25.0 28.2
Automotive costs: tolls and fi nes =1 100.0 71.4
Public transit payments =19 75.0 60.9
GOVERNMENT-TO-CITIZEN (G2C) =14 87.5 59.5Income tax refunds =34 75.0 63.7
Social security benefi ts =20 75.0 62.9
Unemployment, workers’ comp and welfare benefi ts =1 100.0 56.9
Government health benefi ts =1 100.0 54.4
BUSINESS-TO-GOVERNMENT (B2G) =14 93.8 73.3Income tax payments =1 100.0 80.2
VAT/sales tax payments =1 100.0 78.6
Social security and other contributions =1 100.0 71.8
Company registration and payment of fees =23 75.0 62.5
GOVERNMENT-TO-BUSINESS (G2B) =6 93.8 58.3Income tax refunds =32 75.0 62.5
VAT/sales tax refunds =1 100.0 61.3
Payments for goods and services =1 100.0 63.3
Disbursement of loans =1 100.0 46.0
Rank Score Average
INFRASTRUCTURE 28 49.9 49.5Number of ATMs per 10,000 people =35 20.1 28.5
Number of POS terminals per 10,000 people 6 49.7 20.0
Diffusion of broadband =32 24.3 34.5
Public-access terminals per capita =26 75.0 76.2
Mobile subscriptions per 100 people 51 29.7 42.8
Level of development of stored value cards =23 75.0 72.2
Level of development of 3G and other technologies =28 75.0 68.1
Level of development of contactless and mobile payments =25 50.0 53.6
SOCIAL AND ECONOMIC CONTEXT 42 50.7 60.9Literacy level 44 79.4 80.5
Educational level 50 36.7 53.6
Internet/technology savviness =34 50.0 66.5
Percentage of population using banks/other fi nancial institutions =23 75.0 60.5
Percentage of businesses using banks/other fi nancial institutions =42 50.0 69.0
Provision of fi nancial education =53 25.0 73.4
Proportion of businesses placing orders via the Internet =31 25.0 41.1
Proportion of consumer orders of goods via the Internet 40 15.3 38.8
Percentage of population with payment card(s) =1 100.0 64.9
POLICY CONTEXT =40 66.7 73.5Government commitment to e-payment security =25 75.0 74.2
Government commitment to integrating the informal economy =36 50.0 63.3
Government commitment to the Financial Action Task Force (FATF) =38 75.0 83.1
TurkeyAverage for all countries
CITIZEN-TO-GOVERNMENT (C2G)
GOVERNMENT-TO-CITIZEN (G2C)
BUSINESS-TO-GOVERNMENT(B2G)
INFRASTRUCTURE
SOCIAL ANDECONOMIC
CONTEXT
POLICYCONTEXT
GOVERNMENT-TO-BUSINESS (G2B)
100
75
50
25
0
Rank Score Average
OVERALL SCORE 61 26.8 62.5
CITIZEN-TO-GOVERNMENT (C2G) =50 40.0 62.7Income tax payments =1 100.0 83.1
Social security contributions =34 75.0 69.8
Obtaining/paying for an ID card =31 0.0 28.2
Automotive costs: tolls and fi nes =58 0.0 71.4
Public transit payments =45 25.0 60.9
GOVERNMENT-TO-CITIZEN (G2C) =54 25.0 59.5Income tax refunds =39 50.0 63.7
Social security benefi ts =51 0.0 62.9
Unemployment, workers’ comp and welfare benefi ts =28 50.0 56.9
Government health benefi ts =44 0.0 54.4
BUSINESS-TO-GOVERNMENT (B2G) =38 68.8 73.3Income tax payments =1 100.0 80.2
VAT/sales tax payments =1 100.0 78.6
Social security and other contributions =34 75.0 71.8
Company registration and payment of fees =50 0.0 62.5
GOVERNMENT-TO-BUSINESS (G2B) =60 0.0 58.3Income tax refunds =46 0.0 62.5
VAT/sales tax refunds =46 0.0 61.3
Payments for goods and services =54 0.0 63.3
Disbursement of loans =42 0.0 46.0
Rank Score Average
INFRASTRUCTURE 60 19.2 49.5Number of ATMs per 10,000 people 61 1.4 28.5
Number of POS terminals per 10,000 people 61 0.0 20.0
Diffusion of broadband =61 0.0 34.5
Public-access terminals per capita =58 25.0 76.2
Mobile subscriptions per 100 people 61 2.1 42.8
Level of development of stored value cards =38 50.0 72.2
Level of development of 3G and other technologies =44 25.0 68.1
Level of development of contactless and mobile payments =25 50.0 53.6
SOCIAL AND ECONOMIC CONTEXT 59 18.3 60.9Literacy level 56 35.6 80.5
Educational level 57 29.0 53.6
Internet/technology savviness =60 0.0 66.5
Percentage of population using banks/other fi nancial institutions =57 0.0 60.5
Percentage of businesses using banks/other fi nancial institutions =42 50.0 69.0
Provision of fi nancial education =53 25.0 73.4
Proportion of businesses placing orders via the Internet =31 25.0 41.1
Proportion of consumer orders of goods via the Internet =59 0.0 38.8
Percentage of population with payment card(s) =49 0.0 64.9
POLICY CONTEXT 62 16.7 73.5Government commitment to e-payment security 62 0.0 74.2
Government commitment to integrating the informal economy =55 25.0 63.3
Government commitment to the Financial Action Task Force (FATF) =58 25.0 83.1
UgandaAverage for all countries
CITIZEN-TO-GOVERNMENT (C2G)
GOVERNMENT-TO-CITIZEN (G2C)
BUSINESS-TO-GOVERNMENT(B2G)
INFRASTRUCTURE
SOCIAL ANDECONOMIC
CONTEXT
POLICYCONTEXT
GOVERNMENT-TO-BUSINESS (G2B)
100
75
50
25
0
TurkeyNominal GDP (US$ bn) 735.3
Population (m) 73.3
GDP per capita (US$) 10,030.0
Uganda Nominal GDP (US$ bn) 17.0
Population (m) 33.8
GDP per capita (US$) 503.7
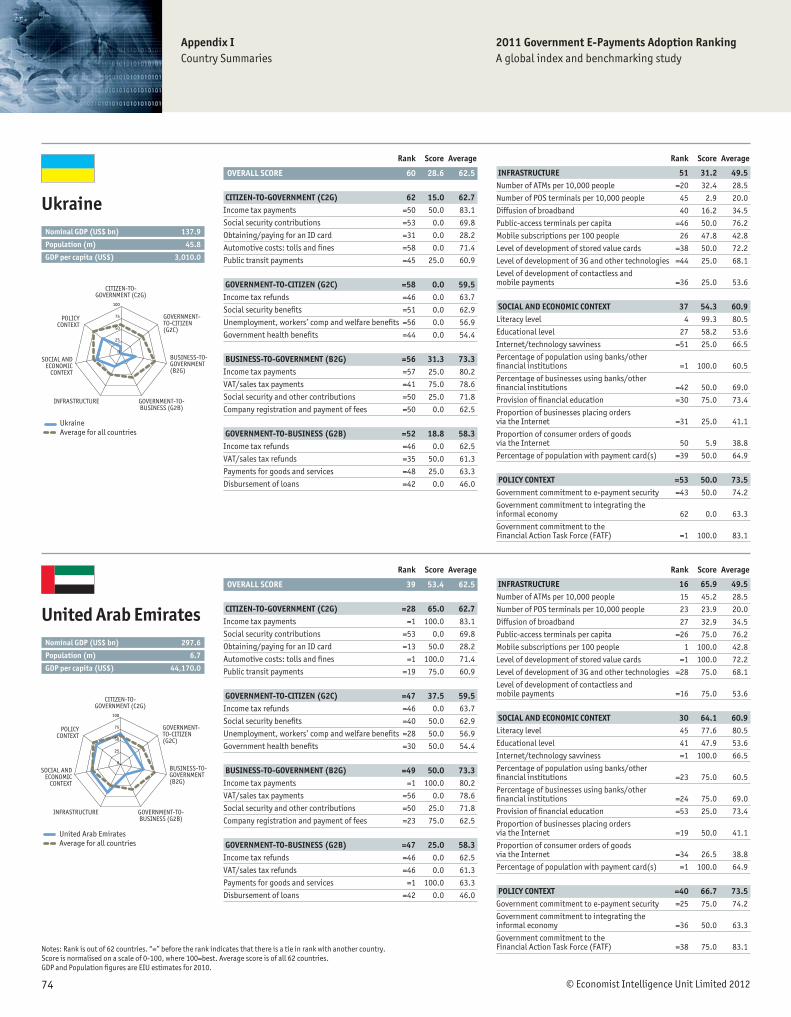
© Economist Intelligence Unit Limited 201274
Appendix ICountry Summaries
Notes: Rank is out of 62 countries. “=” before the rank indicates that there is a tie in rank with another country. Score is normalised on a scale of 0-100, where 100=best. Average score is of all 62 countries. GDP and Population fi gures are EIU estimates for 2010.
2011 Government E-Payments Adoption RankingA global index and benchmarking study
Rank Score Average
OVERALL SCORE 60 28.6 62.5
CITIZEN-TO-GOVERNMENT (C2G) 62 15.0 62.7Income tax payments =50 50.0 83.1
Social security contributions =53 0.0 69.8
Obtaining/paying for an ID card =31 0.0 28.2
Automotive costs: tolls and fi nes =58 0.0 71.4
Public transit payments =45 25.0 60.9
GOVERNMENT-TO-CITIZEN (G2C) =58 0.0 59.5Income tax refunds =46 0.0 63.7
Social security benefi ts =51 0.0 62.9
Unemployment, workers’ comp and welfare benefi ts =56 0.0 56.9
Government health benefi ts =44 0.0 54.4
BUSINESS-TO-GOVERNMENT (B2G) =56 31.3 73.3Income tax payments =57 25.0 80.2
VAT/sales tax payments =41 75.0 78.6
Social security and other contributions =50 25.0 71.8
Company registration and payment of fees =50 0.0 62.5
GOVERNMENT-TO-BUSINESS (G2B) =52 18.8 58.3Income tax refunds =46 0.0 62.5
VAT/sales tax refunds =35 50.0 61.3
Payments for goods and services =48 25.0 63.3
Disbursement of loans =42 0.0 46.0
Rank Score Average
INFRASTRUCTURE 51 31.2 49.5Number of ATMs per 10,000 people =20 32.4 28.5
Number of POS terminals per 10,000 people 45 2.9 20.0
Diffusion of broadband 40 16.2 34.5
Public-access terminals per capita =46 50.0 76.2
Mobile subscriptions per 100 people 26 47.8 42.8
Level of development of stored value cards =38 50.0 72.2
Level of development of 3G and other technologies =44 25.0 68.1
Level of development of contactless and mobile payments =36 25.0 53.6
SOCIAL AND ECONOMIC CONTEXT 37 54.3 60.9Literacy level 4 99.3 80.5
Educational level 27 58.2 53.6
Internet/technology savviness =51 25.0 66.5
Percentage of population using banks/other fi nancial institutions =1 100.0 60.5
Percentage of businesses using banks/other fi nancial institutions =42 50.0 69.0
Provision of fi nancial education =30 75.0 73.4
Proportion of businesses placing orders via the Internet =31 25.0 41.1
Proportion of consumer orders of goods via the Internet 50 5.9 38.8
Percentage of population with payment card(s) =39 50.0 64.9
POLICY CONTEXT =53 50.0 73.5Government commitment to e-payment security =43 50.0 74.2
Government commitment to integrating the informal economy 62 0.0 63.3
Government commitment to the Financial Action Task Force (FATF) =1 100.0 83.1
UkraineAverage for all countries
CITIZEN-TO-GOVERNMENT (C2G)
GOVERNMENT-TO-CITIZEN (G2C)
BUSINESS-TO-GOVERNMENT(B2G)
INFRASTRUCTURE
SOCIAL ANDECONOMIC
CONTEXT
POLICYCONTEXT
GOVERNMENT-TO-BUSINESS (G2B)
100
75
50
25
0
Rank Score Average
OVERALL SCORE 39 53.4 62.5
CITIZEN-TO-GOVERNMENT (C2G) =28 65.0 62.7Income tax payments =1 100.0 83.1
Social security contributions =53 0.0 69.8
Obtaining/paying for an ID card =13 50.0 28.2
Automotive costs: tolls and fi nes =1 100.0 71.4
Public transit payments =19 75.0 60.9
GOVERNMENT-TO-CITIZEN (G2C) =47 37.5 59.5Income tax refunds =46 0.0 63.7
Social security benefi ts =40 50.0 62.9
Unemployment, workers’ comp and welfare benefi ts =28 50.0 56.9
Government health benefi ts =30 50.0 54.4
BUSINESS-TO-GOVERNMENT (B2G) =49 50.0 73.3Income tax payments =1 100.0 80.2
VAT/sales tax payments =56 0.0 78.6
Social security and other contributions =50 25.0 71.8
Company registration and payment of fees =23 75.0 62.5
GOVERNMENT-TO-BUSINESS (G2B) =47 25.0 58.3Income tax refunds =46 0.0 62.5
VAT/sales tax refunds =46 0.0 61.3
Payments for goods and services =1 100.0 63.3
Disbursement of loans =42 0.0 46.0
Rank Score Average
INFRASTRUCTURE 16 65.9 49.5Number of ATMs per 10,000 people 15 45.2 28.5
Number of POS terminals per 10,000 people 23 23.9 20.0
Diffusion of broadband 27 32.9 34.5
Public-access terminals per capita =26 75.0 76.2
Mobile subscriptions per 100 people 1 100.0 42.8
Level of development of stored value cards =1 100.0 72.2
Level of development of 3G and other technologies =28 75.0 68.1
Level of development of contactless and mobile payments =16 75.0 53.6
SOCIAL AND ECONOMIC CONTEXT 30 64.1 60.9Literacy level 45 77.6 80.5
Educational level 41 47.9 53.6
Internet/technology savviness =1 100.0 66.5
Percentage of population using banks/other fi nancial institutions =23 75.0 60.5
Percentage of businesses using banks/other fi nancial institutions =24 75.0 69.0
Provision of fi nancial education =53 25.0 73.4
Proportion of businesses placing orders via the Internet =19 50.0 41.1
Proportion of consumer orders of goods via the Internet =34 26.5 38.8
Percentage of population with payment card(s) =1 100.0 64.9
POLICY CONTEXT =40 66.7 73.5Government commitment to e-payment security =25 75.0 74.2
Government commitment to integrating the informal economy =36 50.0 63.3
Government commitment to the Financial Action Task Force (FATF) =38 75.0 83.1
United Arab EmiratesAverage for all countries
CITIZEN-TO-GOVERNMENT (C2G)
GOVERNMENT-TO-CITIZEN (G2C)
BUSINESS-TO-GOVERNMENT(B2G)
INFRASTRUCTURE
SOCIAL ANDECONOMIC
CONTEXT
POLICYCONTEXT
GOVERNMENT-TO-BUSINESS (G2B)
100
75
50
25
0
Ukraine Nominal GDP (US$ bn) 137.9
Population (m) 45.8
GDP per capita (US$) 3,010.0
United Arab Emirates Nominal GDP (US$ bn) 297.6
Population (m) 6.7
GDP per capita (US$) 44,170.0

© Economist Intelligence Unit Limited 201275
Notes: Rank is out of 62 countries. “=” before the rank indicates that there is a tie in rank with another country. Score is normalised on a scale of 0-100, where 100=best. Average score is of all 62 countries. GDP and Population fi gures are EIU estimates for 2010.
Appendix ICountry Summaries
2011 Government E-Payments Adoption RankingA global index and benchmarking study
Rank Score Average
OVERALL SCORE 2 91.6 62.5
CITIZEN-TO-GOVERNMENT (C2G) =5 90.0 62.7Income tax payments =1 100.0 83.1
Social security contributions =1 100.0 69.8
Obtaining/paying for an ID card =1 100.0 28.2
Automotive costs: tolls and fi nes =26 75.0 71.4
Public transit payments =19 75.0 60.9
GOVERNMENT-TO-CITIZEN (G2C) =14 87.5 59.5Income tax refunds =1 100.0 63.7
Social security benefi ts =1 100.0 62.9
Unemployment, workers’ comp and welfare benefi ts =28 50.0 56.9
Government health benefi ts =1 100.0 54.4
BUSINESS-TO-GOVERNMENT (B2G) =1 100.0 73.3Income tax payments =1 100.0 80.2
VAT/sales tax payments =1 100.0 78.6
Social security and other contributions =1 100.0 71.8
Company registration and payment of fees =1 100.0 62.5
GOVERNMENT-TO-BUSINESS (G2B) =6 93.8 58.3Income tax refunds =1 100.0 62.5
VAT/sales tax refunds =1 100.0 61.3
Payments for goods and services =1 100.0 63.3
Disbursement of loans =11 75.0 46.0
Rank Score Average
INFRASTRUCTURE 4 76.8 49.5Number of ATMs per 10,000 people 8 56.2 28.5
Number of POS terminals per 10,000 people 14 35.9 20.0
Diffusion of broadband 11 69.5 34.5
Public-access terminals per capita =1 100.0 76.2
Mobile subscriptions per 100 people =16 52.6 42.8
Level of development of stored value cards =1 100.0 72.2
Level of development of 3G and other technologies =1 100.0 68.1
Level of development of contactless and mobile payments =1 100.0 53.6
SOCIAL AND ECONOMIC CONTEXT 3 93.5 60.9Literacy level =9 97.8 80.5
Educational level 12 68.8 53.6
Internet/technology savviness =1 100.0 66.5
Percentage of population using banks/other fi nancial institutions =1 100.0 60.5
Percentage of businesses using banks/other fi nancial institutions =1 100.0 69.0
Provision of fi nancial education =1 100.0 73.4
Proportion of businesses placing orders via the Internet =7 75.0 41.1
Proportion of consumer orders of goods via the Internet 1 100.0 38.8
Percentage of population with payment card(s) =1 100.0 64.9
POLICY CONTEXT =1 100.0 73.5Government commitment to e-payment security =1 100.0 74.2
Government commitment to integrating the informal economy =1 100.0 63.3
Government commitment to the Financial Action Task Force (FATF) =1 100.0 83.1
United KingdomAverage for all countries
CITIZEN-TO-GOVERNMENT (C2G)
GOVERNMENT-TO-CITIZEN (G2C)
BUSINESS-TO-GOVERNMENT(B2G)
INFRASTRUCTURE
SOCIAL ANDECONOMIC
CONTEXT
POLICYCONTEXT
GOVERNMENT-TO-BUSINESS (G2B)
100
75
50
25
0
Rank Score Average
OVERALL SCORE 1 93.6 62.5
CITIZEN-TO-GOVERNMENT (C2G) =2 95.0 62.7Income tax payments =1 100.0 83.1
Social security contributions =1 100.0 69.8
Obtaining/paying for an ID card =6 75.0 28.2
Automotive costs: tolls and fi nes =1 100.0 71.4
Public transit payments =1 100.0 60.9
GOVERNMENT-TO-CITIZEN (G2C) =14 87.5 59.5Income tax refunds =1 100.0 63.7
Social security benefi ts =1 100.0 62.9
Unemployment, workers’ comp and welfare benefi ts =11 75.0 56.9
Government health benefi ts =23 75.0 54.4
BUSINESS-TO-GOVERNMENT (B2G) =1 100.0 73.3Income tax payments =1 100.0 80.2
VAT/sales tax payments =1 100.0 78.6
Social security and other contributions =1 100.0 71.8
Company registration and payment of fees =1 100.0 62.5
GOVERNMENT-TO-BUSINESS (G2B) =1 100.0 58.3Income tax refunds =1 100.0 62.5
VAT/sales tax refunds =1 100.0 61.3
Payments for goods and services =1 100.0 63.3
Disbursement of loans =1 100.0 46.0
Rank Score Average
INFRASTRUCTURE 5 76.6 49.5Number of ATMs per 10,000 people 3 80.4 28.5
Number of POS terminals per 10,000 people 10 38.4 20.0
Diffusion of broadband 17 57.9 34.5
Public-access terminals per capita =1 100.0 76.2
Mobile subscriptions per 100 people 43 35.7 42.8
Level of development of stored value cards =1 100.0 72.2
Level of development of 3G and other technologies =1 100.0 68.1
Level of development of contactless and mobile payments =1 100.0 53.6
SOCIAL AND ECONOMIC CONTEXT 2 96.0 60.9Literacy level =9 97.8 80.5
Educational level 15 67.6 53.6
Internet/technology savviness =1 100.0 66.5
Percentage of population using banks/other fi nancial institutions =1 100.0 60.5
Percentage of businesses using banks/other fi nancial institutions =1 100.0 69.0
Provision of fi nancial education =1 100.0 73.4
Proportion of businesses placing orders via the Internet =1 100.0 41.1
Proportion of consumer orders of goods via the Internet 2 98.9 38.8
Percentage of population with payment card(s) =1 100.0 64.9
POLICY CONTEXT =1 100.0 73.5Government commitment to e-payment security =1 100.0 74.2
Government commitment to integrating the informal economy =1 100.0 63.3
Government commitment to the Financial Action Task Force (FATF) =1 100.0 83.1
United StatesAverage for all countries
CITIZEN-TO-GOVERNMENT (C2G)
GOVERNMENT-TO-CITIZEN (G2C)
BUSINESS-TO-GOVERNMENT(B2G)
INFRASTRUCTURE
SOCIAL ANDECONOMIC
CONTEXT
POLICYCONTEXT
GOVERNMENT-TO-BUSINESS (G2B)
100
75
50
25
0
United KingdomNominal GDP (US$ bn) 2,250.1
Population (m) 62.3
GDP per capita (US$) 36,139.0
United States Nominal GDP (US$ bn) 14,526.6
Population (m) 310.2
GDP per capita (US$) 46,820.0
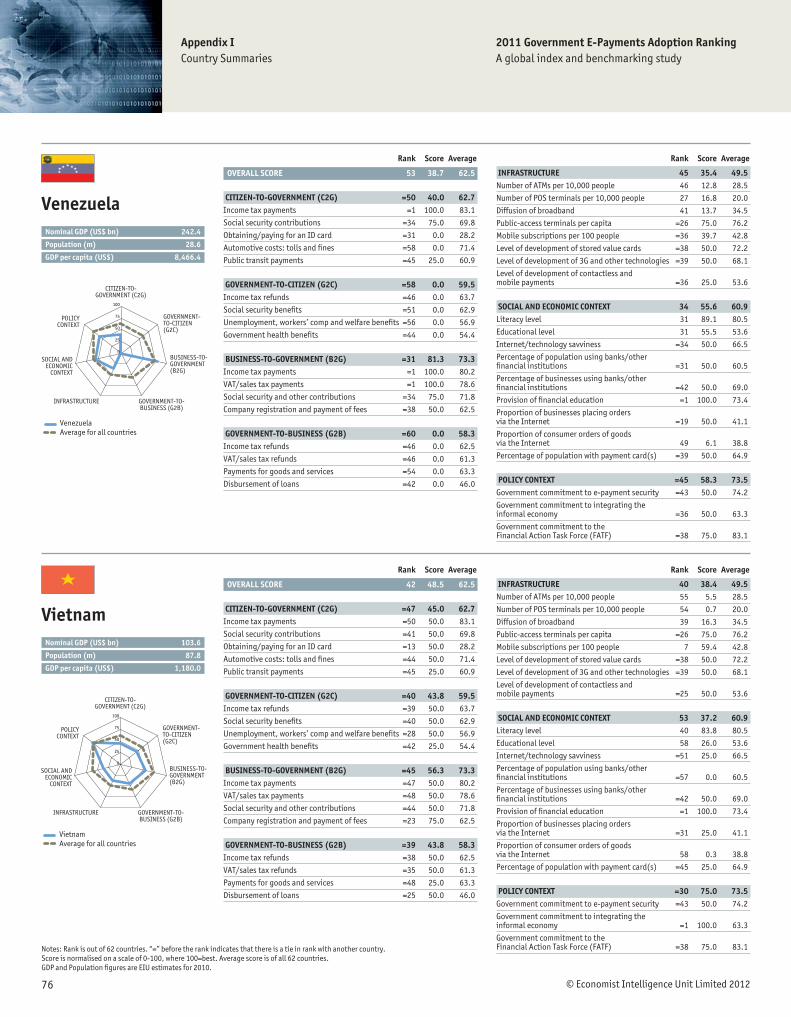
© Economist Intelligence Unit Limited 201276
Appendix ICountry Summaries
Notes: Rank is out of 62 countries. “=” before the rank indicates that there is a tie in rank with another country. Score is normalised on a scale of 0-100, where 100=best. Average score is of all 62 countries. GDP and Population fi gures are EIU estimates for 2010.
2011 Government E-Payments Adoption RankingA global index and benchmarking study
Rank Score Average
OVERALL SCORE 53 38.7 62.5
CITIZEN-TO-GOVERNMENT (C2G) =50 40.0 62.7Income tax payments =1 100.0 83.1
Social security contributions =34 75.0 69.8
Obtaining/paying for an ID card =31 0.0 28.2
Automotive costs: tolls and fi nes =58 0.0 71.4
Public transit payments =45 25.0 60.9
GOVERNMENT-TO-CITIZEN (G2C) =58 0.0 59.5Income tax refunds =46 0.0 63.7
Social security benefi ts =51 0.0 62.9
Unemployment, workers’ comp and welfare benefi ts =56 0.0 56.9
Government health benefi ts =44 0.0 54.4
BUSINESS-TO-GOVERNMENT (B2G) =31 81.3 73.3Income tax payments =1 100.0 80.2
VAT/sales tax payments =1 100.0 78.6
Social security and other contributions =34 75.0 71.8
Company registration and payment of fees =38 50.0 62.5
GOVERNMENT-TO-BUSINESS (G2B) =60 0.0 58.3Income tax refunds =46 0.0 62.5
VAT/sales tax refunds =46 0.0 61.3
Payments for goods and services =54 0.0 63.3
Disbursement of loans =42 0.0 46.0
Rank Score Average
INFRASTRUCTURE 45 35.4 49.5Number of ATMs per 10,000 people 46 12.8 28.5
Number of POS terminals per 10,000 people 27 16.8 20.0
Diffusion of broadband 41 13.7 34.5
Public-access terminals per capita =26 75.0 76.2
Mobile subscriptions per 100 people =36 39.7 42.8
Level of development of stored value cards =38 50.0 72.2
Level of development of 3G and other technologies =39 50.0 68.1
Level of development of contactless and mobile payments =36 25.0 53.6
SOCIAL AND ECONOMIC CONTEXT 34 55.6 60.9Literacy level 31 89.1 80.5
Educational level 31 55.5 53.6
Internet/technology savviness =34 50.0 66.5
Percentage of population using banks/other fi nancial institutions =31 50.0 60.5
Percentage of businesses using banks/other fi nancial institutions =42 50.0 69.0
Provision of fi nancial education =1 100.0 73.4
Proportion of businesses placing orders via the Internet =19 50.0 41.1
Proportion of consumer orders of goods via the Internet 49 6.1 38.8
Percentage of population with payment card(s) =39 50.0 64.9
POLICY CONTEXT =45 58.3 73.5Government commitment to e-payment security =43 50.0 74.2
Government commitment to integrating the informal economy =36 50.0 63.3
Government commitment to the Financial Action Task Force (FATF) =38 75.0 83.1
VenezuelaAverage for all countries
CITIZEN-TO-GOVERNMENT (C2G)
GOVERNMENT-TO-CITIZEN (G2C)
BUSINESS-TO-GOVERNMENT(B2G)
INFRASTRUCTURE
SOCIAL ANDECONOMIC
CONTEXT
POLICYCONTEXT
GOVERNMENT-TO-BUSINESS (G2B)
100
75
50
25
0
Rank Score Average
OVERALL SCORE 42 48.5 62.5
CITIZEN-TO-GOVERNMENT (C2G) =47 45.0 62.7Income tax payments =50 50.0 83.1
Social security contributions =41 50.0 69.8
Obtaining/paying for an ID card =13 50.0 28.2
Automotive costs: tolls and fi nes =44 50.0 71.4
Public transit payments =45 25.0 60.9
GOVERNMENT-TO-CITIZEN (G2C) =40 43.8 59.5Income tax refunds =39 50.0 63.7
Social security benefi ts =40 50.0 62.9
Unemployment, workers’ comp and welfare benefi ts =28 50.0 56.9
Government health benefi ts =42 25.0 54.4
BUSINESS-TO-GOVERNMENT (B2G) =45 56.3 73.3Income tax payments =47 50.0 80.2
VAT/sales tax payments =48 50.0 78.6
Social security and other contributions =44 50.0 71.8
Company registration and payment of fees =23 75.0 62.5
GOVERNMENT-TO-BUSINESS (G2B) =39 43.8 58.3Income tax refunds =38 50.0 62.5
VAT/sales tax refunds =35 50.0 61.3
Payments for goods and services =48 25.0 63.3
Disbursement of loans =25 50.0 46.0
Rank Score Average
INFRASTRUCTURE 40 38.4 49.5Number of ATMs per 10,000 people 55 5.5 28.5
Number of POS terminals per 10,000 people 54 0.7 20.0
Diffusion of broadband 39 16.3 34.5
Public-access terminals per capita =26 75.0 76.2
Mobile subscriptions per 100 people 7 59.4 42.8
Level of development of stored value cards =38 50.0 72.2
Level of development of 3G and other technologies =39 50.0 68.1
Level of development of contactless and mobile payments =25 50.0 53.6
SOCIAL AND ECONOMIC CONTEXT 53 37.2 60.9Literacy level 40 83.8 80.5
Educational level 58 26.0 53.6
Internet/technology savviness =51 25.0 66.5
Percentage of population using banks/other fi nancial institutions =57 0.0 60.5
Percentage of businesses using banks/other fi nancial institutions =42 50.0 69.0
Provision of fi nancial education =1 100.0 73.4
Proportion of businesses placing orders via the Internet =31 25.0 41.1
Proportion of consumer orders of goods via the Internet 58 0.3 38.8
Percentage of population with payment card(s) =45 25.0 64.9
POLICY CONTEXT =30 75.0 73.5Government commitment to e-payment security =43 50.0 74.2
Government commitment to integrating the informal economy =1 100.0 63.3
Government commitment to the Financial Action Task Force (FATF) =38 75.0 83.1
VietnamAverage for all countries
CITIZEN-TO-GOVERNMENT (C2G)
GOVERNMENT-TO-CITIZEN (G2C)
BUSINESS-TO-GOVERNMENT(B2G)
INFRASTRUCTURE
SOCIAL ANDECONOMIC
CONTEXT
POLICYCONTEXT
GOVERNMENT-TO-BUSINESS (G2B)
100
75
50
25
0
Venezuela Nominal GDP (US$ bn) 242.4
Population (m) 28.6
GDP per capita (US$) 8,466.4
Vietnam Nominal GDP (US$ bn) 103.6
Population (m) 87.8
GDP per capita (US$) 1,180.0
77 Economist Intelligence Unit 2012
Appendix IIProject scope, framework and methodology
2011 Government E-Payments Adoption RankingA global index and benchmarking study
1. Scoring criteria and categoriesThe Government E-Payments Adoption Ranking (GEAR) is a dynamic quantitative and qualitative benchmarking model of 37 indicators across seven categories. The model measures specifi c attributes of the electronic payments (e-payments) environment for governments across 62 countries. E-payment is defi ned as the exchange or transfer of funds over an electronic platform. Examples of electronic platforms include the Internet (accessed via multiple devices, including personal computers, mobile phones and tablets) and mobile-phone networks. Payments through these electronic platforms can be made by various means, including payment card, direct deposit, direct debit, electronic funds transfer and wire transfer.
The indicators and categories researched in this study improve upon the approach of the 2007 GEAR study, which analysed 31 indicators across six categories. For the most part the EIU utilised indicators from the 2007 study so that cross-time comparisons could be made. Seven new indicators were added to the 2011 GEAR study and one indicator (from the 2007 GEAR study) was removed. These modifi cations refl ect the changing landscape for government e-payments overall and the desire to incorporate a wider range of analysis into the research. The research includes a mix of both qualitative and quantitative indicators.
The seven category scores are calculated from the weighted average of underlying indicators and scaled from 0-100, where 100=most favourable. The overall score is a weighted average of the category scores. The default model weight profi le is set at neutral, where each category and indicator in the model is assigned an equal weight. The weighting for each indicator and category can be adjusted in the model in order to better gauge the impact of each indicator/category on the overall score.
Appendix II: Project scope, framework and methodology
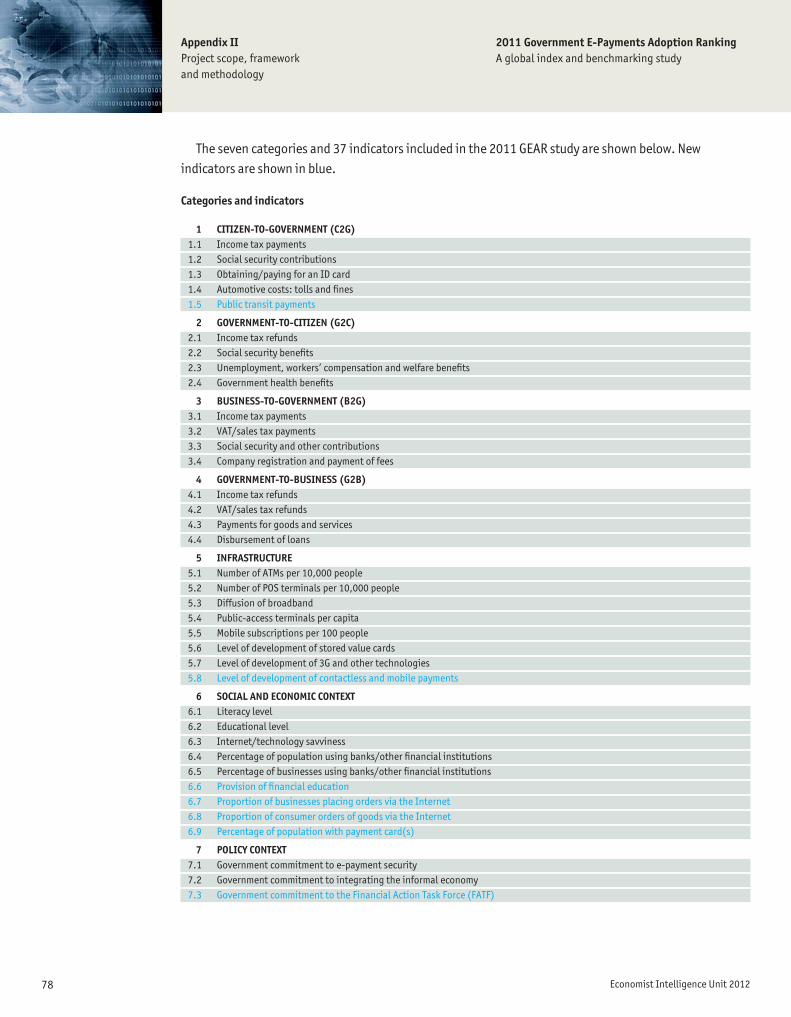
78 Economist Intelligence Unit 2012
Appendix IIProject scope, framework and methodology
2011 Government E-Payments Adoption RankingA global index and benchmarking study
The seven categories and 37 indicators included in the 2011 GEAR study are shown below. New indicators are shown in blue.
1 CITIZEN-TO-GOVERNMENT (C2G) 1.1 Income tax payments 1.2 Social security contributions 1.3 Obtaining/paying for an ID card 1.4 Automotive costs: tolls and fi nes 1.5 Public transit payments
2 GOVERNMENT-TO-CITIZEN (G2C) 2.1 Income tax refunds 2.2 Social security benefi ts 2.3 Unemployment, workers’ compensation and welfare benefi ts 2.4 Government health benefi ts
3 BUSINESS-TO-GOVERNMENT (B2G) 3.1 Income tax payments 3.2 VAT/sales tax payments 3.3 Social security and other contributions 3.4 Company registration and payment of fees
4 GOVERNMENT-TO-BUSINESS (G2B) 4.1 Income tax refunds 4.2 VAT/sales tax refunds 4.3 Payments for goods and services 4.4 Disbursement of loans
5 INFRASTRUCTURE 5.1 Number of ATMs per 10,000 people 5.2 Number of POS terminals per 10,000 people 5.3 Diffusion of broadband 5.4 Public-access terminals per capita 5.5 Mobile subscriptions per 100 people 5.6 Level of development of stored value cards 5.7 Level of development of 3G and other technologies 5.8 Level of development of contactless and mobile payments
6 SOCIAL AND ECONOMIC CONTEXT 6.1 Literacy level 6.2 Educational level 6.3 Internet/technology savviness 6.4 Percentage of population using banks/other fi nancial institutions 6.5 Percentage of businesses using banks/other fi nancial institutions 6.6 Provision of fi nancial education 6.7 Proportion of businesses placing orders via the Internet 6.8 Proportion of consumer orders of goods via the Internet 6.9 Percentage of population with payment card(s)
7 POLICY CONTEXT 7.1 Government commitment to e-payment security 7.2 Government commitment to integrating the informal economy 7.3 Government commitment to the Financial Action Task Force (FATF)
Categories and indicators

79 Economist Intelligence Unit 2012
Appendix IIProject scope, framework and methodology
2011 Government E-Payments Adoption RankingA global index and benchmarking study
Countries
The countries included in the 2011 GEAR study are listed below. The countries delineated in blue are those that were not included in the 2007 GEAR study.
2. Methodologya. Data modelling
Data were collected across 37 indicators for each country. The research includes qualitative indicators, also referred to as ordinal variables, that are measured on a 0 to 4 scale, where 4=most favourable conditions, and are normalised on a scale of 0-100. The research also includes quantitative indicators, which are measured by a number and normalised on a scale of 0-100. Each indicator is constructed such that a higher value associates with a more favourable e-payments environment. For example, for the public transit payments indicator, a country in which transportation schemes enable transit costs to be fully and easily paid electronically is assigned a level of 4, whereas a country with no electronic payment system in place is assigned 0.
The scoring scheme for each component of the 2011 GEAR study is listed below:
ArgentinaAustraliaAustriaBahrainBrazilCanadaChileChinaColombiaCosta RicaCzech RepublicDenmarkDominican RepublicEcuadorEgyptFinlandFranceGermanyHong KongHungaryIndia
IndonesiaIranIrelandIsraelItalyJapanKazakhstanKenyaKuwaitMalaysiaMexicoMoroccoNetherlandsNew ZealandNigeriaNorwayOmanPakistanPeruPhilippinesPoland
QatarRussiaRwandaSaudi ArabiaSingaporeSouth AfricaSouth KoreaSpainSwedenTaiwanThailandTunisiaTurkeyUgandaUkraineUnited Arab EmiratesUnited KingdomUnited StatesVenezuelaVietnam
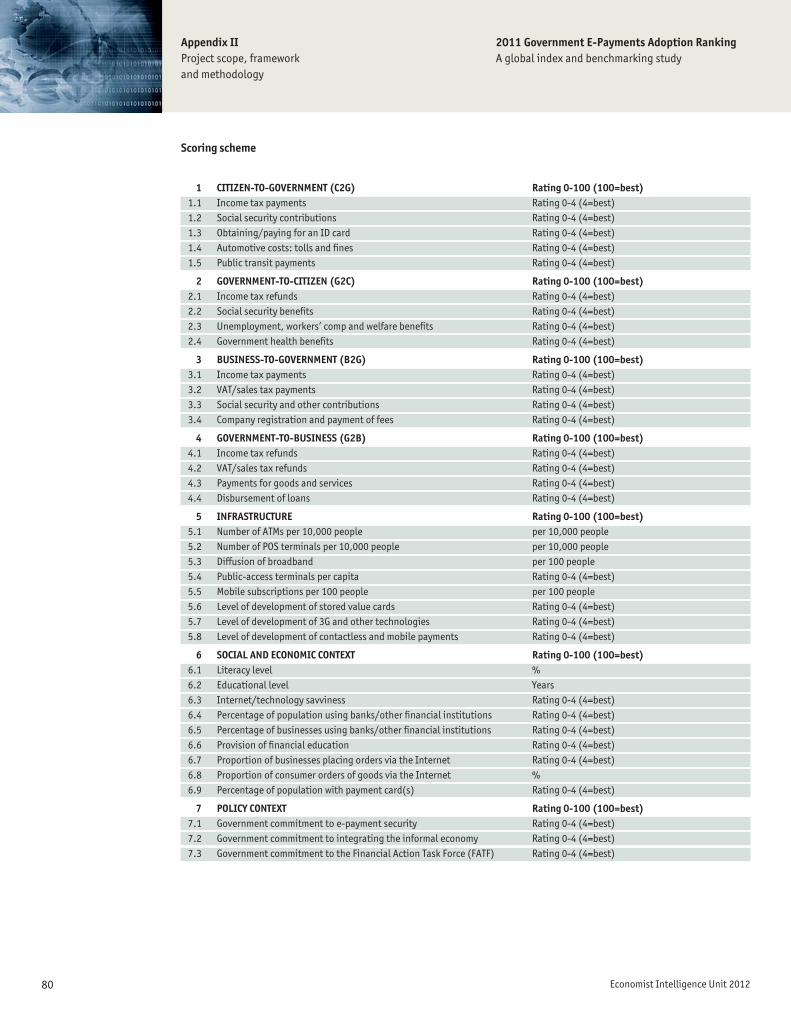
80 Economist Intelligence Unit 2012
Appendix IIProject scope, framework and methodology
2011 Government E-Payments Adoption RankingA global index and benchmarking study
1 CITIZEN-TO-GOVERNMENT (C2G) Rating 0-100 (100=best) 1.1 Income tax payments Rating 0-4 (4=best) 1.2 Social security contributions Rating 0-4 (4=best) 1.3 Obtaining/paying for an ID card Rating 0-4 (4=best) 1.4 Automotive costs: tolls and fi nes Rating 0-4 (4=best) 1.5 Public transit payments Rating 0-4 (4=best)
2 GOVERNMENT-TO-CITIZEN (G2C) Rating 0-100 (100=best) 2.1 Income tax refunds Rating 0-4 (4=best) 2.2 Social security benefi ts Rating 0-4 (4=best) 2.3 Unemployment, workers’ comp and welfare benefi ts Rating 0-4 (4=best) 2.4 Government health benefi ts Rating 0-4 (4=best)
3 BUSINESS-TO-GOVERNMENT (B2G) Rating 0-100 (100=best) 3.1 Income tax payments Rating 0-4 (4=best) 3.2 VAT/sales tax payments Rating 0-4 (4=best) 3.3 Social security and other contributions Rating 0-4 (4=best) 3.4 Company registration and payment of fees Rating 0-4 (4=best)
4 GOVERNMENT-TO-BUSINESS (G2B) Rating 0-100 (100=best) 4.1 Income tax refunds Rating 0-4 (4=best) 4.2 VAT/sales tax refunds Rating 0-4 (4=best) 4.3 Payments for goods and services Rating 0-4 (4=best) 4.4 Disbursement of loans Rating 0-4 (4=best)
5 INFRASTRUCTURE Rating 0-100 (100=best) 5.1 Number of ATMs per 10,000 people per 10,000 people 5.2 Number of POS terminals per 10,000 people per 10,000 people 5.3 Diffusion of broadband per 100 people 5.4 Public-access terminals per capita Rating 0-4 (4=best) 5.5 Mobile subscriptions per 100 people per 100 people 5.6 Level of development of stored value cards Rating 0-4 (4=best) 5.7 Level of development of 3G and other technologies Rating 0-4 (4=best) 5.8 Level of development of contactless and mobile payments Rating 0-4 (4=best)
6 SOCIAL AND ECONOMIC CONTEXT Rating 0-100 (100=best) 6.1 Literacy level % 6.2 Educational level Years 6.3 Internet/technology savviness Rating 0-4 (4=best) 6.4 Percentage of population using banks/other fi nancial institutions Rating 0-4 (4=best) 6.5 Percentage of businesses using banks/other fi nancial institutions Rating 0-4 (4=best) 6.6 Provision of fi nancial education Rating 0-4 (4=best) 6.7 Proportion of businesses placing orders via the Internet Rating 0-4 (4=best) 6.8 Proportion of consumer orders of goods via the Internet % 6.9 Percentage of population with payment card(s) Rating 0-4 (4=best)
7 POLICY CONTEXT Rating 0-100 (100=best) 7.1 Government commitment to e-payment security Rating 0-4 (4=best) 7.2 Government commitment to integrating the informal economy Rating 0-4 (4=best) 7.3 Government commitment to the Financial Action Task Force (FATF) Rating 0-4 (4=best)
Scoring scheme
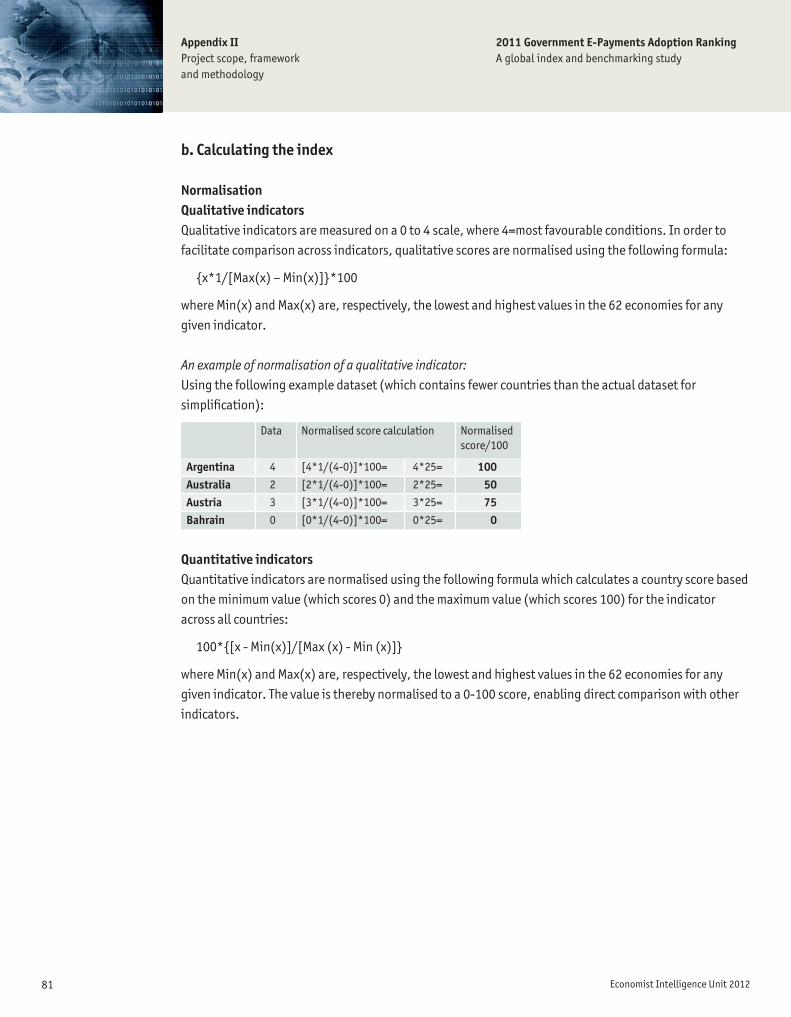
81 Economist Intelligence Unit 2012
Appendix IIProject scope, framework and methodology
2011 Government E-Payments Adoption RankingA global index and benchmarking study
b. Calculating the index
NormalisationQualitative indicatorsQualitative indicators are measured on a 0 to 4 scale, where 4=most favourable conditions. In order to facilitate comparison across indicators, qualitative scores are normalised using the following formula:
{x*1/[Max(x) – Min(x)]}*100
where Min(x) and Max(x) are, respectively, the lowest and highest values in the 62 economies for any given indicator.
An example of normalisation of a qualitative indicator:
Using the following example dataset (which contains fewer countries than the actual dataset for simplifi cation):
Data Normalised score calculation Normalised score/100
Argentina 4 [4*1/(4-0)]*100= 4*25= 100Australia 2 [2*1/(4-0)]*100= 2*25= 50Austria 3 [3*1/(4-0)]*100= 3*25= 75Bahrain 0 [0*1/(4-0)]*100= 0*25= 0
Quantitative indicatorsQuantitative indicators are normalised using the following formula which calculates a country score based on the minimum value (which scores 0) and the maximum value (which scores 100) for the indicator across all countries:
100*{[x - Min(x)]/[Max (x) - Min (x)]}
where Min(x) and Max(x) are, respectively, the lowest and highest values in the 62 economies for any given indicator. The value is thereby normalised to a 0-100 score, enabling direct comparison with other indicators.
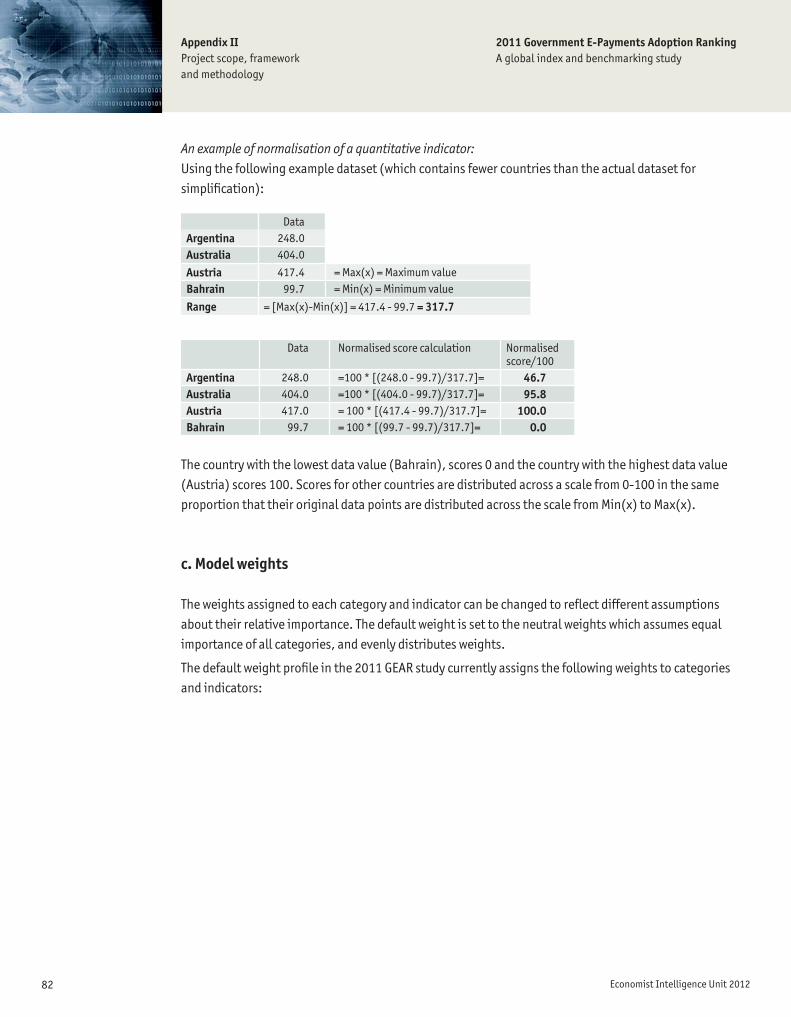
82 Economist Intelligence Unit 2012
Appendix IIProject scope, framework and methodology
2011 Government E-Payments Adoption RankingA global index and benchmarking study
An example of normalisation of a quantitative indicator:
Using the following example dataset (which contains fewer countries than the actual dataset for simplifi cation):
DataArgentina 248.0Australia 404.0
Austria 417.4 = Max(x) = Maximum valueBahrain 99.7 = Min(x) = Minimum value
Range = [Max(x)-Min(x)] = 417.4 - 99.7 = 317.7
Data Normalised score calculation Normalised score/100
Argentina 248.0 =100 * [(248.0 - 99.7)/317.7]= 46.7Australia 404.0 =100 * [(404.0 - 99.7)/317.7]= 95.8Austria 417.0 = 100 * [(417.4 - 99.7)/317.7]= 100.0Bahrain 99.7 = 100 * [(99.7 - 99.7)/317.7]= 0.0
The country with the lowest data value (Bahrain), scores 0 and the country with the highest data value (Austria) scores 100. Scores for other countries are distributed across a scale from 0-100 in the same proportion that their original data points are distributed across the scale from Min(x) to Max(x).
c. Model weights
The weights assigned to each category and indicator can be changed to refl ect different assumptions about their relative importance. The default weight is set to the neutral weights which assumes equal importance of all categories, and evenly distributes weights.
The default weight profi le in the 2011 GEAR study currently assigns the following weights to categories and indicators:
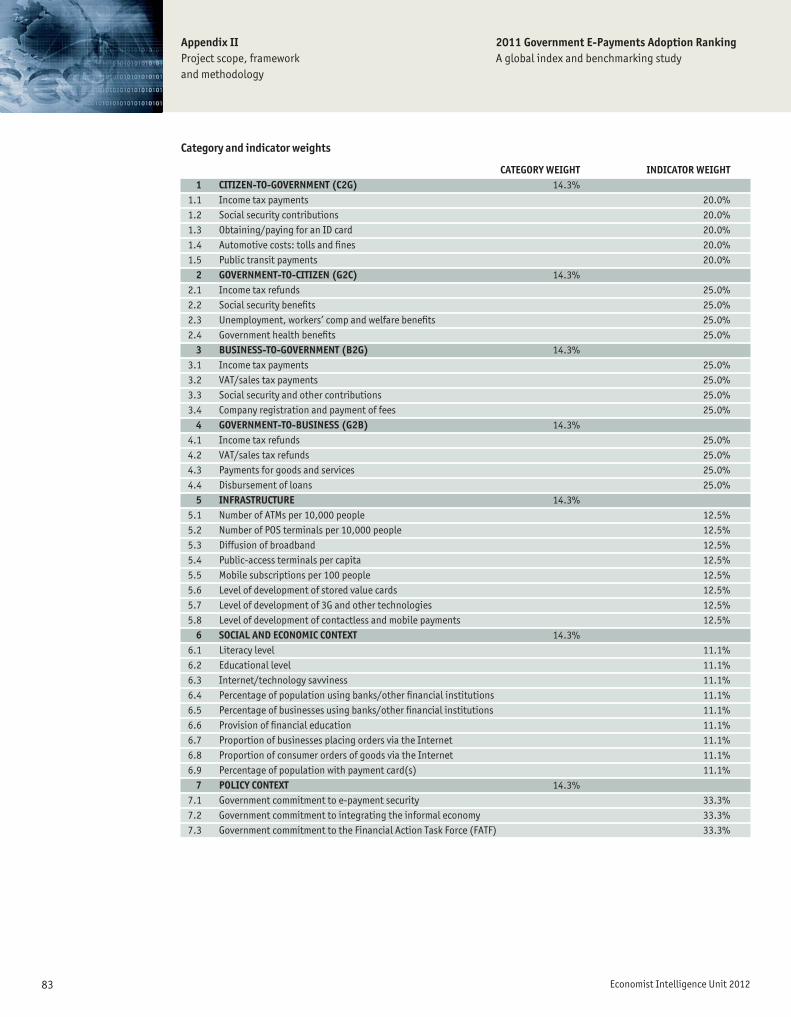
83 Economist Intelligence Unit 2012
Appendix IIProject scope, framework and methodology
2011 Government E-Payments Adoption RankingA global index and benchmarking study
CATEGORY WEIGHT INDICATOR WEIGHT 1 CITIZEN-TO-GOVERNMENT (C2G) 14.3% 1.1 Income tax payments 20.0% 1.2 Social security contributions 20.0% 1.3 Obtaining/paying for an ID card 20.0% 1.4 Automotive costs: tolls and fi nes 20.0% 1.5 Public transit payments 20.0% 2 GOVERNMENT-TO-CITIZEN (G2C) 14.3% 2.1 Income tax refunds 25.0% 2.2 Social security benefi ts 25.0% 2.3 Unemployment, workers’ comp and welfare benefi ts 25.0% 2.4 Government health benefi ts 25.0% 3 BUSINESS-TO-GOVERNMENT (B2G) 14.3% 3.1 Income tax payments 25.0% 3.2 VAT/sales tax payments 25.0% 3.3 Social security and other contributions 25.0% 3.4 Company registration and payment of fees 25.0% 4 GOVERNMENT-TO-BUSINESS (G2B) 14.3% 4.1 Income tax refunds 25.0% 4.2 VAT/sales tax refunds 25.0% 4.3 Payments for goods and services 25.0% 4.4 Disbursement of loans 25.0% 5 INFRASTRUCTURE 14.3% 5.1 Number of ATMs per 10,000 people 12.5% 5.2 Number of POS terminals per 10,000 people 12.5% 5.3 Diffusion of broadband 12.5% 5.4 Public-access terminals per capita 12.5% 5.5 Mobile subscriptions per 100 people 12.5% 5.6 Level of development of stored value cards 12.5% 5.7 Level of development of 3G and other technologies 12.5% 5.8 Level of development of contactless and mobile payments 12.5% 6 SOCIAL AND ECONOMIC CONTEXT 14.3% 6.1 Literacy level 11.1% 6.2 Educational level 11.1% 6.3 Internet/technology savviness 11.1% 6.4 Percentage of population using banks/other fi nancial institutions 11.1% 6.5 Percentage of businesses using banks/other fi nancial institutions 11.1% 6.6 Provision of fi nancial education 11.1% 6.7 Proportion of businesses placing orders via the Internet 11.1% 6.8 Proportion of consumer orders of goods via the Internet 11.1% 6.9 Percentage of population with payment card(s) 11.1% 7 POLICY CONTEXT 14.3% 7.1 Government commitment to e-payment security 33.3% 7.2 Government commitment to integrating the informal economy 33.3% 7.3 Government commitment to the Financial Action Task Force (FATF) 33.3%
Category and indicator weights
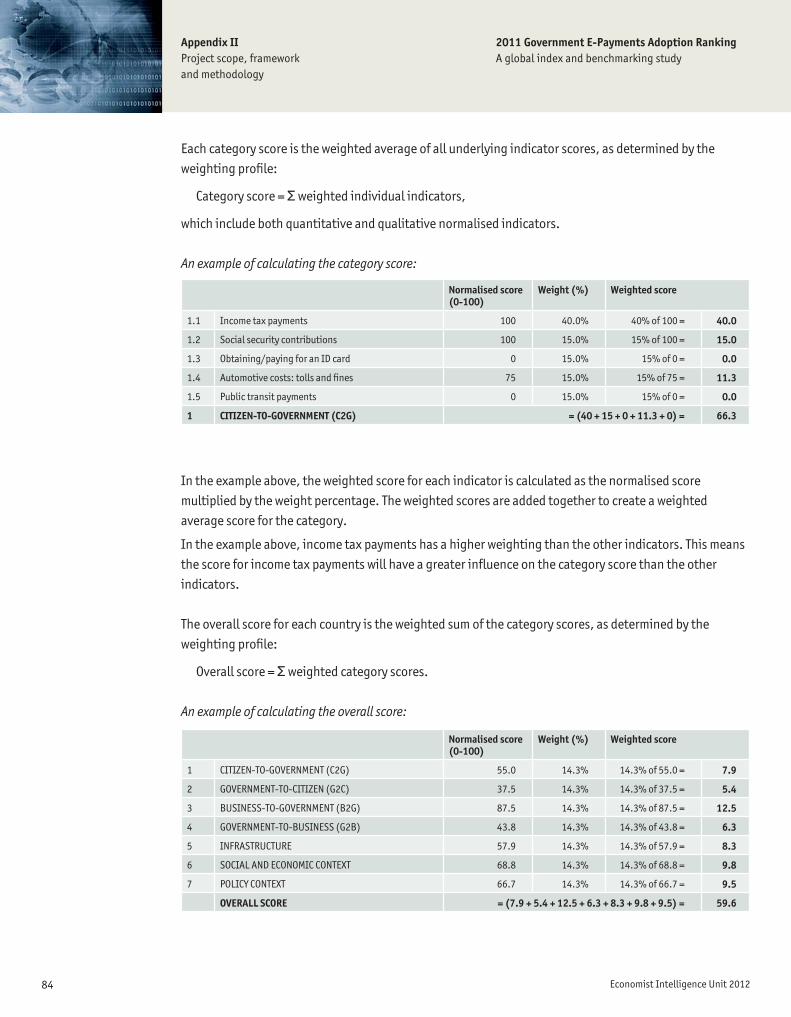
84 Economist Intelligence Unit 2012
Appendix IIProject scope, framework and methodology
2011 Government E-Payments Adoption RankingA global index and benchmarking study
Each category score is the weighted average of all underlying indicator scores, as determined by the weighting profi le:
Category score = Σ weighted individual indicators,
which include both quantitative and qualitative normalised indicators.
An example of calculating the category score:
Normalised score (0-100)
Weight (%) Weighted score
1.1 Income tax payments 100 40.0% 40% of 100 = 40.0
1.2 Social security contributions 100 15.0% 15% of 100 = 15.0
1.3 Obtaining/paying for an ID card 0 15.0% 15% of 0 = 0.0
1.4 Automotive costs: tolls and fi nes 75 15.0% 15% of 75 = 11.3
1.5 Public transit payments 0 15.0% 15% of 0 = 0.0
1 CITIZEN-TO-GOVERNMENT (C2G) = (40 + 15 + 0 + 11.3 + 0) = 66.3
In the example above, the weighted score for each indicator is calculated as the normalised score multiplied by the weight percentage. The weighted scores are added together to create a weighted average score for the category.
In the example above, income tax payments has a higher weighting than the other indicators. This means the score for income tax payments will have a greater infl uence on the category score than the other indicators.
The overall score for each country is the weighted sum of the category scores, as determined by the weighting profi le:
Overall score = Σ weighted category scores.
An example of calculating the overall score:
Normalised score (0-100)
Weight (%) Weighted score
1 CITIZEN-TO-GOVERNMENT (C2G) 55.0 14.3% 14.3% of 55.0 = 7.9
2 GOVERNMENT-TO-CITIZEN (G2C) 37.5 14.3% 14.3% of 37.5 = 5.4
3 BUSINESS-TO-GOVERNMENT (B2G) 87.5 14.3% 14.3% of 87.5 = 12.5
4 GOVERNMENT-TO-BUSINESS (G2B) 43.8 14.3% 14.3% of 43.8 = 6.3
5 INFRASTRUCTURE 57.9 14.3% 14.3% of 57.9 = 8.3
6 SOCIAL AND ECONOMIC CONTEXT 68.8 14.3% 14.3% of 68.8 = 9.8
7 POLICY CONTEXT 66.7 14.3% 14.3% of 66.7 = 9.5
OVERALL SCORE = (7.9 + 5.4 + 12.5 + 6.3 + 8.3 + 9.8 + 9.5) = 59.6

85 Economist Intelligence Unit 2012
Appendix IIProject scope, framework and methodology
2011 Government E-Payments Adoption RankingA global index and benchmarking study
In the example above, the weighted score for each category is calculated as the normalised score multiplied by the weight percentage.The weighted scores are added together to create a weighted average overall score.
d. Dependent variables and model correlations
Correlating the indicators and categories in the 2011 GEAR study to other “output” (dependent) variables reveals some potentially interesting relationships. Correlation is a measure of the degree of linear relationship between two variables. A higher correlation refl ects a stronger relationship between variables. A positive or negative correlation greater than 0.60 indicates a signifi cant relationship (where 1.0=strongest correlation). To evaluate the relationship, the slope of the line that best fi ts through the data points, as well as the degree of scatter from that same line, is evaluated. The more dispersed the data points, the lower the correlation. The closer all of the data points are to the line, the higher the degree of correlation.
Where, E(XY) is the average of the product of all corresponding X and Y valuesE(X) is the average of X valuesE(Y) is the average of Y values
andThe denominator is the product of the standard deviations of X and Y (standard deviation is a measure of variability of an indicator).
The section below discusses the dependent variables included in the analysis and the correlation between these variables and the overall score for countries in the 2011 GEAR study.
i. E-Participation Index:The E-Participation Index is a complement to the UN E-Government Development Index. The E-Participation Index assesses the quality and usefulness of information and services provided by a country for the purpose of engaging its citizens in public policy making through the use of e-government programmes. It is measured on a scale of 0-1 (where a score of 1 refl ects government inclusion of citizens in their decision-making process, government provision of information knowledge, and government consultation with citizens to obtain feedback).
The overall score in the 2011 GEAR study has a relatively strong positive correlation (0.72) with the E-Participation Index, implying that an increase in the overall score can signifi cantly predict an increase in the score for the E-Participation Index. A relatively high correlation between the overall score and the E-Participation Index score implies that as a government improves its score in the GEAR study, its E-Participation Index score will also improve. Correlation does not prove causation: one variable does not cause a change in the other.

86 Economist Intelligence Unit 2012
Appendix IIProject scope, framework and methodology
2011 Government E-Payments Adoption RankingA global index and benchmarking study
ii. Government Online Service Index:The Government Online Service Index is one of the three components of the UN E-Government Development Index, which is a widely recognised measure of public sector capacity to provide electronic and mobile services. The Government Online Service Index measures four online service development phases: stage 1—emerging information services, stage 2—enhanced information services, stage 3—transactional services, and stage 4—connected services. The Index is measured on a scale of 0-1 (where a score of 1 refl ects the best delivery of online services by the government).
The overall score in the 2011 GEAR study has a relatively strong positive correlation (0.72) with the Government Online Service Index, implying that an increase in the overall score can signifi cantly predict an increase in the Government Online Service Index score. In other words, this relationship implies that as a government improves its score in the GEAR study, its Government Online Service Index score will also improve. This is a signifi cant result, pointing to the interrelationship between the provision of key public services online (central to the GEAR study) and the provision of services for citizens to engage in decisions related to public policy (as measured in the Government Online Service Index).
iii. GDP per capita:The overall score in the 2011 GEAR study has a moderately strong positive correlation of 0.64 with GDP per capita.
3. Notes on the comparison between 2007 and 2011Technological developments have abounded worldwide over the past four years, prompting a change in standards for evaluating countries. It should be noted that because of a change in the number of countries in the 2011 study, the normalised scores and averages utilised in the cross-time comparison are different from the normalised scores and averages achieved by countries within each study individually.This section provides greater detail on how countries were compared and the methodology used to facilitate the comparison between the 2007 and 2011 studies.
To ensure an accurate comparison between 2007 and 2011, the analysis considers only the 43 countries researched in both 2007 and 2011. The following 19 countries were added to the 2011 GEAR study and were not included in the 2007 GEAR study:
AustriaBahrainChileDenmarkDominican RepublicEcuadorFinland
IsraelKenyaKuwaitNew ZealandNorwayOmanPeru
QatarRwandaTunisiaUgandaVietnam
87 Economist Intelligence Unit 2012
Appendix IIProject scope, framework and methodology
2011 Government E-Payments Adoption RankingA global index and benchmarking study
New indicatorsThese seven indicators were added to the 2011 study, and therefore are not included in the comparison:
• 1.5 Public transit payments• 5.8 Contactless and mobile payments• 6.6 Proportion of businesses placing orders via the Internet• 6.7 Proportion of consumer orders of goods via the Internet• 6.8 Households with payment card(s)• 6.9 Financial education• 7.3 Government commitment to the Financial Action Task Force (FATF)
Indicators that were removed from the studyThe following indicator was removed from the 2011 study, and therefore is not included in the comparison:
• Diffusion of narrowband/dial-up
The exclusion of this indicator from the 2007/2011 comparison resulted in a change to the 2007 normalised scores, and associated ranks, for countries in the comparison. Therefore, the normalised scores and ranks in the original 2007 model will not match the normalised scores and ranks in the 2007 study used for the comparison with the 2011 study.
New scoring methodology:The following indicators exist in both the 2007 and 2011 studies, but are quantitative in the 2011 model, whereas they were qualitative in 2007. Qualitative scores have been inferred for 2011 based on the quantitative data. The subsequent qualitative scores are used for the comparison with 2007.
• Diffusion of broadband (1-5 rating in 2007; these bands were utilised to convert the 2011 quantitative indicator data, so that it is comparable).
• Mobile subscriptions per 100 people (1-5 rating in 2007; these bands were utilised to convert the 2011 quantitative indicator data, so that it is comparable).
Revised methodology for measuring indicators:The methodology for scoring the following indicator changed between 2007 and 2011:
• Government commitment to e-payment security
This indicator looks at government commitment to electronic payment security. Assessment is based on the extent of e-commerce laws, whether e-commerce laws have been translated into the national regulatory regime, and whether regulations are actively enforced. By contrast, in 2007 this indicator looked at government commitment to electronic payments, with the emphasis placed on what governments were doing in order to encourage consumers and businesses to make electronic payments. The signifi cant difference in the scoring methodology for this indicator should be noted and taken into consideration when making a 2007/2011 comparison.
Despite a signifi cant change in the defi nition and evaluation criteria of this indicator, it was nevertheless included in the comparison analysis. This inclusion refl ects the assumption that along with the
88 Economist Intelligence Unit 2012
Appendix IIProject scope, framework and methodology
2011 Government E-Payments Adoption RankingA global index and benchmarking study
technological developments that have abounded worldwide over the past four years, governments have also moved from not only promoting the provision and adoption of electronic services, but also endorsing the security of these processes.
Interpreting changes in score for quantitative indicators:The scores for the following quantitative indicators are normalised to create a score from 0-100 based on the range of data across all countries. This means that instead of comparing absolute changes to fi gures across time, the difference in scores among countries refl ects the relative performance of a country (ie how it fared against other countries in a given year for a given indicator). Therefore, it is possible, for example, for a country to have more POS terminals in 2011 compared with 2007 but receive a lower normalised score (refl ecting the fact that there are fewer POS terminals relative to other countries in a given year). For these indicators, change in rank rather than score is likely the most useful comparison metric:
• 5.1 Number of ATMs per 10,000 people• 5.2 Number of POS terminals per 10,000 people• 6.1 Literacy level• 6.2 Educational level

89 Economist Intelligence Unit 2012
Appendix IIProject scope, framework and methodology
2011 Government E-Payments Adoption RankingA global index and benchmarking study
Indicator Source Data Year Range
Indicator defi nitions and construction
1.1i
Income tax paymentsEconomist Intelligence Unit analyst qualitative assessment based on information obtained from the domestic websites of the appropriate government body.
2009-2011 This indicator looks at the process of paying income taxes by individuals, including whether income taxes can fully and easily be calculated and fi led electronically.
Countries were evaluated using the following scoring criteria:4= Income taxes can fully and easily be calculated and fi led electronically;3= System exists but has one major drawback;2= System exists but has several drawbacks;1= System is planned or in beta etc.;0= No such system exists
In some cases, the payment aspect of the process was specifi cally considered (where applicable). This indicator assesses national (or federal) income taxes. On its own, downloading forms from a website is not considered to be a part of the electronic process for this indicator. Countries that do not have an income tax are scored using a proxy tax. The EIU considers the lack of publicly available information, the complexity of the overall process, and/or an in-person requirement to be a potential drawback.
1.2i
Social security contributions
Economist Intelligence Unit analyst qualitative assessment based on information obtained from the domestic websites of the appropriate government body.
2010-2011 This indicator looks at the process of making social security contributions by individuals, including whether contributions can fully and easily be calculated and fi led electronically.
Countries were evaluated using the following scoring criteria:4= Contributions can fully and easily be calculated and fi led electronically;3= System exists but has one major drawback;2= System exists but has several drawbacks;1= System is planned or in beta etc.;0= No such system exists
In some cases, the payment aspect of the process was specifi cally considered (where applicable). This indicator assesses national (or federal) social security contributions. On its own, downloading forms from a website is not considered to be a part of the electronic process for this indicator. The EIU considers the lack of publicly available information, the complexity of the overall process, and/or an in-person requirement to be a potential drawback.
4. Sources and defi nitions of selected indicatorsi Qualitative indicator—A qualitative variable is also called an ordinal variable. Performance along an indicator was evaluated based on informed assessment. It was measured on a 0 to 4 scale, where 4=most favourable conditions. In order to facilitate comparison, qualitative scores were normalised and translated to a 0-100 scale.
ii Quantitative indicator—A quantitative variable is a variable that can be measured by a number. In order to facilitate comparison, quantitative indicators were normalised and statistical fi gures were translated to a score on a 0-100 scale.
1) CITIZEN-TO-GOVERNMENT (C2G)
This category captures the extent to which citizens can complete various transactions electronically. These transactions are: income tax payments, social security contributions, obtaining/paying for an ID card, automotive costs and public transit payments.
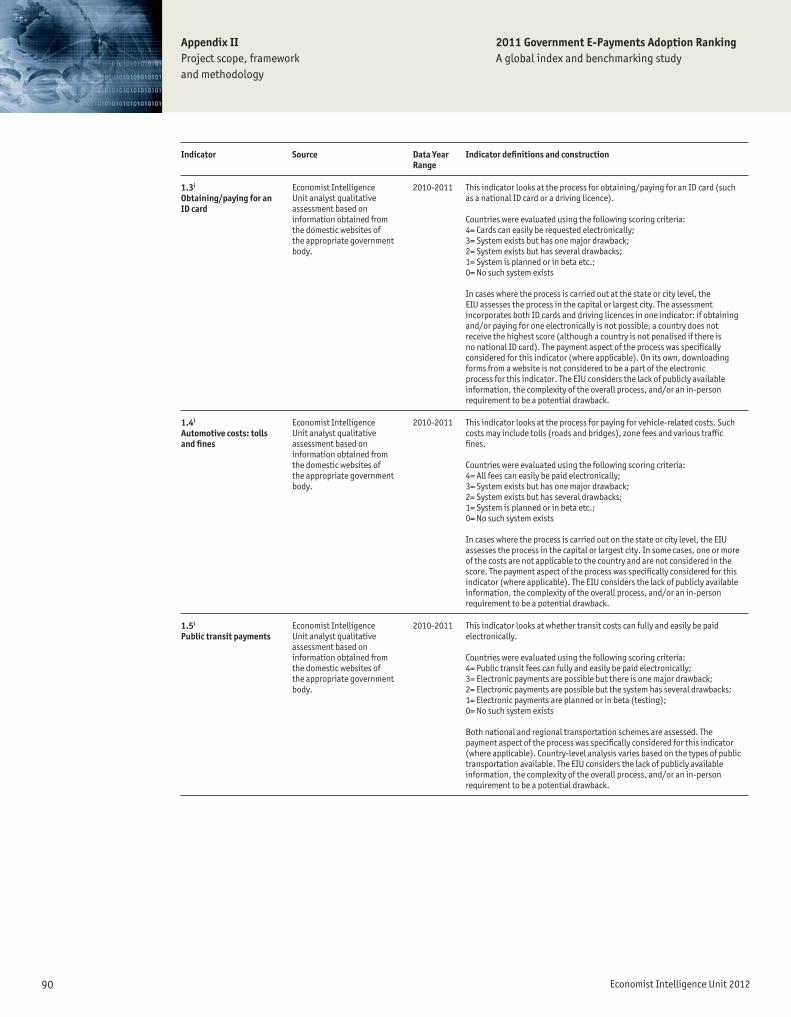
90 Economist Intelligence Unit 2012
Appendix IIProject scope, framework and methodology
2011 Government E-Payments Adoption RankingA global index and benchmarking study
Indicator Source Data Year Range
Indicator defi nitions and construction
1.3i
Obtaining/paying for an ID card
Economist Intelligence Unit analyst qualitative assessment based on information obtained from the domestic websites of the appropriate government body.
2010-2011 This indicator looks at the process for obtaining/paying for an ID card (such as a national ID card or a driving licence).
Countries were evaluated using the following scoring criteria:4= Cards can easily be requested electronically;3= System exists but has one major drawback;2= System exists but has several drawbacks; 1= System is planned or in beta etc.;0= No such system exists
In cases where the process is carried out at the state or city level, the EIU assesses the process in the capital or largest city. The assessment incorporates both ID cards and driving licences in one indicator: if obtaining and/or paying for one electronically is not possible, a country does not receive the highest score (although a country is not penalised if there is no national ID card). The payment aspect of the process was specifi cally considered for this indicator (where applicable). On its own, downloading forms from a website is not considered to be a part of the electronic process for this indicator. The EIU considers the lack of publicly available information, the complexity of the overall process, and/or an in-person requirement to be a potential drawback.
1.4i
Automotive costs: tolls and fi nes
Economist Intelligence Unit analyst qualitative assessment based on information obtained from the domestic websites of the appropriate government body.
2010-2011 This indicator looks at the process for paying for vehicle-related costs. Such costs may include tolls (roads and bridges), zone fees and various traffi c fi nes.
Countries were evaluated using the following scoring criteria:4= All fees can easily be paid electronically;3= System exists but has one major drawback;2= System exists but has several drawbacks;1= System is planned or in beta etc.; 0= No such system exists
In cases where the process is carried out on the state or city level, the EIU assesses the process in the capital or largest city. In some cases, one or more of the costs are not applicable to the country and are not considered in the score. The payment aspect of the process was specifi cally considered for this indicator (where applicable). The EIU considers the lack of publicly available information, the complexity of the overall process, and/or an in-person requirement to be a potential drawback.
1.5i
Public transit paymentsEconomist Intelligence Unit analyst qualitative assessment based on information obtained from the domestic websites of the appropriate government body.
2010-2011 This indicator looks at whether transit costs can fully and easily be paid electronically.
Countries were evaluated using the following scoring criteria:4= Public transit fees can fully and easily be paid electronically;3= Electronic payments are possible but there is one major drawback;2= Electronic payments are possible but the system has several drawbacks;1= Electronic payments are planned or in beta (testing);0= No such system exists
Both national and regional transportation schemes are assessed. The payment aspect of the process was specifi cally considered for this indicator (where applicable). Country-level analysis varies based on the types of public transportation available. The EIU considers the lack of publicly available information, the complexity of the overall process, and/or an in-person requirement to be a potential drawback.

91 Economist Intelligence Unit 2012
Appendix IIProject scope, framework and methodology
2011 Government E-Payments Adoption RankingA global index and benchmarking study
2) GOVERNMENT-TO-CITIZEN (G2C)This category assesses the extent to which various government transfers to citizens can be completed electronically. These transactions are: income tax refunds, social security benefi ts, government health benefi ts and unemployment, workers’ compensation and welfare benefi ts.
Indicator Source Data Year Range
Indicator defi nitions and construction
2.1i
Income tax refundsEconomist Intelligence Unit analyst qualitative assessment based on information obtained from the domestic websites of the appropriate government body.
2009-2011 This indicator looks at the process of calculating and requesting income tax refunds electronically.
Countries were evaluated using the following scoring criteria:4= Refunds can fully and easily be calculated and requested electronically;3= System exists but has one major drawback;2= System exists but has several drawbacks;1= System is planned or in beta etc.;0= No such system exists
This indicator assesses national (or federal) income tax refunds. In some cases, the payment aspect of the process was specifi cally considered (where applicable). On its own, downloading forms from a website is not considered to be a part of the electronic process for this indicator. Countries that do not have an income tax are scored using a proxy tax. The EIU considers the lack of publicly available information, the complexity of the overall process and/or an in-person requirement to be a potential drawback.
2.2i
Social security benefi tsEconomist Intelligence Unit analyst qualitative assessment based on information obtained from the domestic websites of the appropriate government body.
2011 This indicator assesses whether individuals can register for social security benefi ts online, calculate benefi ts, submit benefi t requests, and track benefi ts via an online system.
Countries were evaluated using the following scoring criteria:4= Benefi ts can fully and easily be calculated and requested electronically;3= System exists but has one major drawback;2= System exists but has several drawbacks;1= System is planned or in beta etc.; 0= No such system exists
In some cases, the payment aspect of the process was specifi cally considered (where applicable). On its own, downloading forms from a website is not considered to be a part of the electronic process for this indicator. The EIU considers the lack of publicly available information, the complexity of the overall process, and/or an in-person requirement to be a potential drawback.
2.3i
Unemployment, workers’ comp and welfare benefi ts
Economist Intelligence Unit analyst qualitative assessment based on information obtained from the domestic websites of the appropriate government body.
2011 This indicator looks at the process of requesting unemployment, workers’ compensation and welfare benefi ts electronically.
Countries were evaluated using the following scoring criteria:4= Benefi ts can fully and easily be requested electronically;3= System exists but has one major drawback;2= System exists but has several drawbacks;1= System is planned or in beta etc.;0= No such system exists
Aggregating the benefi ts into one indicator means that if not all of the benefi ts can be requested electronically, a country does not receive the highest possible score. In some cases, one or more of the benefi ts are not applicable to the country and are not considered. Conditional cash transfers are sometimes considered. In some cases, the payment aspect of the process was specifi cally considered (where applicable). On its own, downloading forms from a website is not considered to be a part of the electronic process for this indicator. The EIU considers the lack of publicly available information, the complexity of the overall process, and/or an in-person requirement to be a potential drawback.
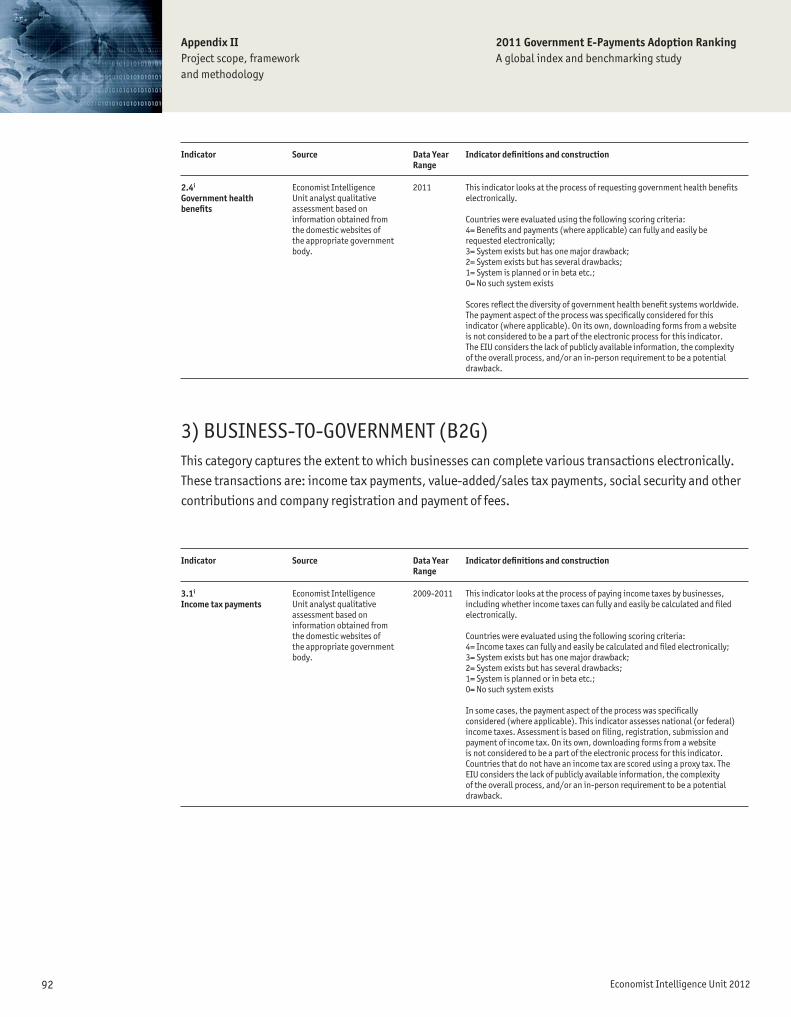
92 Economist Intelligence Unit 2012
Appendix IIProject scope, framework and methodology
2011 Government E-Payments Adoption RankingA global index and benchmarking study
Indicator Source Data Year Range
Indicator defi nitions and construction
2.4i
Government health benefi ts
Economist Intelligence Unit analyst qualitative assessment based on information obtained from the domestic websites of the appropriate government body.
2011 This indicator looks at the process of requesting government health benefi ts electronically.
Countries were evaluated using the following scoring criteria:4= Benefi ts and payments (where applicable) can fully and easily be requested electronically;3= System exists but has one major drawback;2= System exists but has several drawbacks;1= System is planned or in beta etc.;0= No such system exists
Scores refl ect the diversity of government health benefi t systems worldwide. The payment aspect of the process was specifi cally considered for this indicator (where applicable). On its own, downloading forms from a website is not considered to be a part of the electronic process for this indicator. The EIU considers the lack of publicly available information, the complexity of the overall process, and/or an in-person requirement to be a potential drawback.
3) BUSINESS-TO-GOVERNMENT (B2G)This category captures the extent to which businesses can complete various transactions electronically. These transactions are: income tax payments, value-added/sales tax payments, social security and other contributions and company registration and payment of fees.
Indicator Source Data Year Range
Indicator defi nitions and construction
3.1i
Income tax paymentsEconomist Intelligence Unit analyst qualitative assessment based on information obtained from the domestic websites of the appropriate government body.
2009-2011 This indicator looks at the process of paying income taxes by businesses, including whether income taxes can fully and easily be calculated and fi led electronically.
Countries were evaluated using the following scoring criteria:4= Income taxes can fully and easily be calculated and fi led electronically;3= System exists but has one major drawback;2= System exists but has several drawbacks;1= System is planned or in beta etc.;0= No such system exists
In some cases, the payment aspect of the process was specifi cally considered (where applicable). This indicator assesses national (or federal) income taxes. Assessment is based on fi ling, registration, submission and payment of income tax. On its own, downloading forms from a website is not considered to be a part of the electronic process for this indicator. Countries that do not have an income tax are scored using a proxy tax. The EIU considers the lack of publicly available information, the complexity of the overall process, and/or an in-person requirement to be a potential drawback.

93 Economist Intelligence Unit 2012
Appendix IIProject scope, framework and methodology
2011 Government E-Payments Adoption RankingA global index and benchmarking study
Indicator Source Data Year Range
Indicator defi nitions and construction
3.2i
VAT/sales tax paymentsEconomist Intelligence Unit analyst qualitative assessment based on information obtained from the domestic websites of the appropriate government body.
2009-2011 This indicator looks at the process of paying value-added and sales taxes by businesses, including whether these taxes can fully and easily be calculated and fi led electronically.
Countries were evaluated using the following scoring criteria:4= VAT/sales taxes can fully and easily be calculated and fi led electronically;3= System exists but has one major drawback;2= System exists but has several drawbacks;1= System is planned or in beta etc.;0= No such system exists
Assessment is based on fi ling, registration, submission and payment of these taxes. In some cases, the payment aspect of the process was specifi cally considered (where applicable). On its own, downloading forms from a website is not considered to be a part of the electronic process for this indicator. Countries that do not have a VAT or sales tax (or a closely-related tax that could be used as a proxy) score a zero. The EIU considers the lack of publicly available information, the complexity of the overall process, and/or an in-person requirement to be a potential drawback.
3.3i
Social security and other contributions
Economist Intelligence Unit analyst qualitative assessment based on information obtained from the domestic websites of the appropriate government body.
2010-2011 This indicator looks at the process of paying social security and other contributions by businesses, including whether these contributions can fully and easily be calculated and fi led electronically.
Countries were evaluated using the following scoring criteria:4= Contributions can fully and easily be calculated and fi led electronically;3= System exists but has one major drawback;2= System exists but has several drawbacks;1= System is planned or in beta etc.;0= No such system exists
Assessment is based on fi ling, registration, submission and payment of contributions. In some cases, the payment aspect of the process was specifi cally considered (where applicable). On its own, downloading forms from a website is not considered to be a part of the electronic process for this indicator. The EIU considers the lack of publicly available information, the complexity of the overall process, and/or an in-person requirement to be a potential drawback.
3.4i
Company registration and payment of fees
Economist Intelligence Unit analyst qualitative assessment based on information obtained from the domestic websites of the appropriate government body.
2011 This indicator looks at the process by which companies register and pay associated fees.
Countries were evaluated using the following scoring criteria:4= The registration process can be completed electronically;3= System exists but has one major drawback;2= System exists but has several drawbacks;1= System is planned or in beta etc.;0= No such system exists
Assessment is based on whether registration and payment of fees can be completed electronically, as well as the user-friendliness of the online service. Because company registration processes vary by country, the payment aspect of the process was specifi cally considered only in some cases (where applicable). On its own, downloading forms from a website is not considered to be a part of the electronic process for this indicator. The EIU considers the lack of publicly available information, the complexity of the overall process, and/or an in-person requirement to be a potential drawback.

94 Economist Intelligence Unit 2012
Appendix IIProject scope, framework and methodology
2011 Government E-Payments Adoption RankingA global index and benchmarking study
4) GOVERNMENT-TO-BUSINESS (G2B)This category captures the extent to which various government transfers to businesses can be completed electronically. These transactions are: refunds for income and value-added/sales taxes, payments for goods and services and the disbursement of loans.
Indicator Source Data Year Range
Indicator defi nitions and construction
4.1i
Income tax refundsEconomist Intelligence Unit analyst qualitative assessment based on information obtained from the domestic websites of the appropriate government body.
2009-2011 This indicator looks at the process of calculating and requesting income tax refunds electronically.
Countries were evaluated using the following scoring criteria:4= Refunds can fully and easily be calculated and requested electronically;3= System exists but has one major drawback;2= System exists but has several drawbacks;1= System is planned or in beta etc.;0= No such system exists
This indicator assesses national (or federal) income tax refunds. In some cases, the payment aspect of the process was specifi cally considered (where applicable). On its own, downloading forms from a website is not considered to be a part of the electronic process for this indicator. Countries that do not have an income tax are scored using a proxy tax. The EIU considers the lack of publicly available information, the complexity of the overall process, and/or an in-person requirement to be a potential drawback.
4.2i
VAT/sales tax refundsEconomist Intelligence Unit analyst qualitative assessment based on information obtained from the domestic websites of the appropriate government body.
2011 This indicator looks at the process of calculating and requesting sales or value-added tax refunds electronically.
Countries were evaluated using the following scoring criteria:4= Refunds can fully and easily be calculated and requested electronically;3= System exists but has one major drawback;2= System exists but has several drawbacks;1= System is planned or in beta etc.;0= No such system exists
In some cases, the payment aspect of the process was specifi cally considered (where applicable). On its own, downloading forms from a website is not considered to be a part of the electronic process for this indicator. The EIU considers the lack of publicly available information, the complexity of the overall process, and/or an in-person requirement to be a potential drawback.
4.3i
Payments for goods and services
Economist Intelligence Unit analyst qualitative assessment based on information obtained from the domestic websites of the appropriate government body.
2009-2011 This indicator looks at whether the government offers an electronic platform (website) for procurement and whether the platform has payment capabilities.
Countries were evaluated using the following scoring criteria:4= Payments can fully and easily be handled electronically;3= System exists but has one major drawback;2= System exists but has several drawbacks;1= System is planned or in beta etc.;0= No such system exists
In some cases, the payment aspect of the process was specifi cally considered (where applicable). The EIU considers the lack of publicly available information, the complexity of the overall process, and/or an in-person requirement to be a potential drawback.

95 Economist Intelligence Unit 2012
Appendix IIProject scope, framework and methodology
2011 Government E-Payments Adoption RankingA global index and benchmarking study
Indicator Source Data Year Range
Indicator defi nitions and construction
4.4i
Disbursements of loansEconomist Intelligence Unit analyst qualitative assessment based on information obtained from the domestic websites of the appropriate government body.
2011 This indicator looks at whether loan requests and the disbursement of loans can be completed electronically via a government provider.
Countries were evaluated using the following scoring criteria:4= Loans can fully and easily be disbursed electronically;3= Loans can be disbursed electronically but there is one major drawback to the current system;2= Process of loan application and/or disbursal has at least two obvious drawbacks;1= System is planned or in beta etc.;0= No such system exists
In some cases, the payment aspect of the process was specifi cally considered (where applicable). The complexity of the loan application/disbursal process is considered in scoring this indicator. If the government does not provide the loans directly (ie, a fi nancial institution is used as an intermediary), the highest score a state can receive is a three owing to the added complexity of using a third party. The diversity of schemes by which governments disburse loans necessitates a qualitative assessment of the process. The EIU considers the lack of publicly available information and/or an in-person requirement to be a potential drawback.
5) INFRASTRUCTUREThis category examines the existing technological infrastructure that supports the adoption of e-payments. It comprises indicators that assess the number of ATMs and point-of-sale (POS) terminals per 10,000 people, the diffusion of broadband, public-access terminals per capita, mobile subscriptions per 100 people, the level of development of stored value cards, the level of development of 3G and other technologies, and the level of development of contactless and mobile payments.
Indicator Source Data Year Range
Indicator defi nitions and construction
5.1ii
Number of ATMs per 10,000 people
The primary data source is the Financial Access 2010 report published by the World Bank. If World Bank data is not available, a national statistical source or other reliable source is used.
Consultative Group toAssist the Poor, FinancialAccess 2010.
2008-2011 This indicator looks at the number of automatic teller machines (ATMs) per 10,000 people (out of total population).
5.2ii
Number of POS terminals per 10,000 people
The primary data source is the Financial Access 2010 report published by the World Bank. If World Bank data is not available, a national statistical source or other reliable source is used.
Consultative Group toAssist the Poor, FinancialAccess 2010.
2008-2011 This indicator looks at the number of point-of-sale (POS) terminals per 10,000 people (out of total population).

96 Economist Intelligence Unit 2012
Appendix IIProject scope, framework and methodology
2011 Government E-Payments Adoption RankingA global index and benchmarking study
Indicator Source Data Year Range
Indicator defi nitions and construction
5.3ii
Diffusion of broadbandThe primary data source for this indicator is a proprietary Economist Intelligence Unit’s database (fi gures are taken from a variety of sources, including Pyramid Research data and aggregated by EIU analysts to ensure consistency and comparability of data). If EIU data is not available, a national statistical source or other reliable source is used.
2009-2011 This indicator looks at the number of broadband Internet subscriptions (subscriber lines with a transmission speed greater than 128 Kbps, including primary rate interface (PRI) ISDN connections, xDSL connections, cable modem and cable telephony connections and high-speed fi xed wireless connections) per 100 people (ie, of total population).
5.4i
Public-access terminals per capita
Economist Intelligence Unit analyst qualitative assessment based on offi cial national sources, which vary by country.
2006-2011 This indicator looks at public-access terminals per capita.
Countries were evaluated using the following scoring criteria:4= Public-access terminals are widely available (eg, public libraries, transportation terminals, Wi-Fi hotspots, Internet cafés, call centres);3= Public-access terminals are generally available;2= Public-access terminals exist but they are rare;1= There is a plan to implement public-access terminals in the country/there are public-access terminals in trial phase;0= There are no public-access terminals in this country
Research defi nes public-access terminals as points of access to information and/or the Internet. These terminals include, but are not limited to, Wi-Fi hotspots, Internet cafes, call centres, public libraries and transportation terminals. Assessment is qualitative and is based on availability of terminals in metropolitan area(s) (ie commercial centres and/or major city).
5.5ii
Mobile subscriptions per 100 people
The primary data source for this indicator is a proprietary Economist Intelligence Unit’s database (fi gures are taken from a variety of sources, including the International Telecommunication Union, and aggregated by EIU analysts to ensure consistency and comparability of data). If EIU data is not available, a national statistical source or other reliable source is used.
2008-2011 This indicator looks at the number of mobile phone subscriptions per 100 people (out of total population). Research considers subscriptions to include the aggregate number of active mobile phone numbers—used and unused (both prepaid and post-paid).
5.6i
Level of development of stored value cards
Economist Intelligence Unit analyst qualitative assessment based on offi cial national sources, which vary by country.
2005-2011 This indicator looks at the development and integration of stored value cards.
Countries were evaluated using the following scoring criteria:4= Stored value cards are well developed and integrated across the most common uses (eg, telephone, public transportation, public services and small payments) 3= Various types of cards exist but do not cover all uses or are poorly integrated; 2= Few types of cards exist; 1= At least one type of card is in a trial phase;0= No stored value cards exist
In addition to other uses, research considers stored value cards to include, prepaid cards for making telephone calls, for using public transportation, for paying for public services and for making other small payments.
97 Economist Intelligence Unit 2012
Appendix IIProject scope, framework and methodology
2011 Government E-Payments Adoption RankingA global index and benchmarking study
Indicator Source Data Year Range
Indicator defi nitions and construction
5.7i
Level of development of 3G and other technologies
Economist Intelligence Unit analyst qualitative assessment based on offi cial national sources, which vary by country.
2007-2011 This indicator looks at the development of 3G and other technologies (eg 4G or more advanced technologies) in terms of geographic coverage.
Countries were evaluated using the following scoring criteria:4= 3G is well developed technologically and widely deployed geographically;3= 3G is in place but suffers from some shortcomings in technology or availability;2= 3G has been widely deployed, but suffers from shortcomings and/or limited adoption;1= 3G exists but is not widely deployed;0= 3G technologies do not exist in this market
When data on geographic coverage is not available, research makes an assessment based on the percentage of 3G mobile phone subscriptions out of the total number of subscriptions. Otherwise, a qualitative assessment of 3G deployment and coverage is made.
5.8i
Level of development of contactless and mobile payments
Economist Intelligence Unit analyst qualitative assessment based on offi cial national sources, which vary by country.
2008-2011 This indicator looks at the development of contactless and mobile payments in terms of geographic coverage.
Countries were evaluated using the following scoring criteria:4= Contactless and mobile payments are widely deployed geographically;3= Contactless and/or mobile payments are in place, but suffer from shortcomings in technology or availability;2= Contactless and/or mobile payments are suffi ciently deployed, but suffer from limited adoption;1= Contactless and/or mobile payments exist on very limited scale;0= Contactless and/or mobile payments do not exist in this market
Research defi nes contactless payments as those made by credit cards and debit cards, key fobs, smartcards or other devices which use radio-frequency identifi cation for making secure payments. Mobile payments are defi ned as payments made by individuals via a mobile phone. Mobile payment models include: premium short-message-service based transactional payments, direct mobile billing, mobile web payments, and contactless near fi eld communication. The assessment incorporates both mobile payments and contactless payments in one indicator: each element is not necessarily evaluated individually in order to score each country.

98 Economist Intelligence Unit 2012
Appendix IIProject scope, framework and methodology
2011 Government E-Payments Adoption RankingA global index and benchmarking study
6) SOCIAL AND ECONOMIC CONTEXTThis category examines the social and economic environment that supports the adoption of e-payments. It comprises indicators that assess literacy and educational levels, Internet/technology savviness, the percentage of the population and businesses using banks or other fi nancial institutions, the provision of fi nancial education, the proportion of businesses placing orders via the Internet, the proportion of consumer orders of goods via the Internet, and the percentage of the population with payment card(s).
Indicator Source Data Year Range
Indicator defi nitions and construction
6.1ii
Literacy levelThe primary source for literacy data is the UN Statistics Division.
2000-2011 This indicator looks at adult (age 15+) literacy rates (percentage of adults who can both read and write with understanding, a short, simple statement on his or her everyday life out of the total population) in a given country.
6.2ii
Educational levelThe primary sources for education level data are the UN Statistics Division or the UN Educational, Scientifi c and Cultural Organization Institute for Statistics.
2006-2010 This indicator looks at the number of years of schooling that a child of school entrance age in a given country can expect to receive if prevailing patterns of age-specifi c enrolment rates were to stay the same throughout the child’s life.
6.3i
Internet/technology savviness
Economist Intelligence Unit analyst qualitative assessment based on offi cial national sources, which vary by country.
2009-2011 This indicator looks at how savvy the general population is about technology and how readily the population adopts innovations.
Countries were evaluated using the following scoring criteria:4= Population is generally extremely savvy about technology and readily adopts innovations;3= Savvy about technology but generally second-tier adopters;2= Neither savviest nor most eager, but technologies have diffused suffi ciently;1= Poorly trained and sluggish in adopting technology; 0= Very low levels of technological knowledge and adoption
Researchers make assessments based on the observed uptake of new personal technology trends, Internet penetration and modes of Internet access.
6.4i
Percentage of population using banks/other fi nancial institutions
Some of the primary sources used include the following: Consultative Group to Assist the Poor, Financial Access 2010, Consultative Group to Assist the Poor, Financial Access 2009, International Monetary Fund, Access to Finance project.
2009-2011 This indicator looks at the number of deposit accounts in a commercial bank per 1,000 adults.
Countries were evaluated using the following scoring criteria:4= >2,000 deposit accounts in a commercial bank per 1,000 adults;3= 1,500-1,999;2= 1,000-1,499;1= 500-999;0= <500

99 Economist Intelligence Unit 2012
Appendix IIProject scope, framework and methodology
2011 Government E-Payments Adoption RankingA global index and benchmarking study
Indicator Source Data Year Range
Indicator defi nitions and construction
6.5i
Percentage of businesses using banks/other fi nancial institutions
Economist IntelligenceUnit analyst qualitativeassessment based on data obtained from the World Bank Group, DoingBusiness Project and the World Bank Group, Enterprise Survey.
2007-2011 This indicator looks at the extent to which commercial entities utilise fi nancial institutions.
Countries were evaluated using the following scoring criteria:4= 80%+ use banks and other fi nancial institutions;3= 60-79%;2= 40-59%;1= 20-39%;0= 0-19%
Research considers whether or not it is compulsory for businesses to hold a bank account (ie, a bank account is mandatory to start/register a business, as indicated in the World Bank Doing Business report), the percentage of fi rms with a line of credit or loans from fi nancial institutions, taken from results obtained in the Enterprise Survey (a World Bank initiative), and the size of the informal economy (refl ecting the proportion of fi rms operating without formal fi nancial services).
6.6i
Provision of fi nancial education
The primary data source is the Financial Access 2010 report published by the World Bank. If World Bank data is not available, a national statistical source or other reliable source is used.
Consultative Group to Assist the Poor, Financial Access 2010.
2009-2011 This indicator looks at the regulatory requirements for fi nancial institutions regarding disclosure at account opening.
Countries were evaluated using the following scoring criteria:4= Financial institutions provide clear consumer protection and educational information about fi nancial products and services (12-16 checks in the World Bank Financial Access 2010 report);3= Financial institutions make some efforts (9-11 checks in the World Bank Financial Access 2010 report);2= Financial institutions make limited efforts (6-8 checks in the World Bank Financial Access 2010 report);1= Financial institutions make very limited efforts (1-5 checks in the World Bank Financial Access 2010 report);0= Financial institutions make no efforts (no checks in the World Bank Financial Access 2010 report)
A regulatory basis for disclosure is part of the foundation of a strong system of fi nancial education and consumer protection. These disclosure requirements are reported as checks in the World Bank’s Financial Access 2010 report, covering four separate aspects of disclosure requirements—notifying customers in writing of pricing, terms & conditions, general requirements (language, disclosure, recourse rights, etc.), and requirements related to deposit and credit products.
6.7i
Proportion of businesses placing orders via the Internet
One of the main sources used was the Information Economy 2010 report published by the UN Conference on Trade and Development.
2005-2011 This indicator looks at the proportion of enterprises that place orders over the Internet.
Countries were evaluated using the following scoring criteria:4= 55%+ place orders over the Internet3= 40-54%;2= 25-39%;1= 10-24%;0= 0-9%
To maximise consistency across all countries, research considered enterprises with 10 or more persons employed placing orders via the Internet where possible (as defi ned by the primary source used in the analysis).
6.8ii
Proportion of consumer orders of goods via the Internet
Economist Intelligence Unit analyst qualitative assessment based on offi cial national sources, which vary by country.
2008-2011 This indicator looks at the percentage of Internet users that make purchases of goods or services online.
The age range for Internet users varies by country.
100 Economist Intelligence Unit 2012
Appendix IIProject scope, framework and methodology
2011 Government E-Payments Adoption RankingA global index and benchmarking study
Indicator Source Data Year Range
Indicator defi nitions and construction
6.9i
Percentage of population with payment card(s)
One of the main sources used was the Bank for International Settlements.
2008-2011 This indicator looks at the percentage of the total population with debit, credit and other electronic payment card(s).
Countries were evaluated using the following scoring criteria:4= 90%+ of the population has a payment card (very high penetration)3= 75-89% of the population has a payment card (high penetration);2= 50-74% of the population has a payment card (moderate penetration);1= 25-49% of the population has a payment card (low penetration);0= Less than 25% of the population has a payment card (very low penetration)
This percentage is referred to as a penetration rate—the number of payment cards relative to the total population in a given country.
7) POLICY CONTEXTThis category provides an assessment of the policy environment that helps to support e-payments adoption. It comprises indicators that assess government commitment to e-payment security, integrating the informal economy and the Financial Action Task Force.
Indicator Source Data Year Range
Indicator defi nitions and construction
7.1i
Government commitment to e-payment security
Economist Intelligence Unit analyst qualitative assessment based on offi cial national sources, which vary by country.
2003-2011 This indicator looks at governments’ commitment to electronic payment security.
Countries were evaluated using the following scoring criteria:4= Government makes active efforts to secure electronic payments both in its activities and in the private sector;3= It makes some efforts, probably more in its activities;2= It makes efforts, but they are uneven etc.;1= It plays only a limited role;0= It is inactive in this area
Research assigns scores based on the extent of e-commerce laws, whether e-commerce laws have been translated into the national regulatory regime, and whether regulations are actively enforced.
7.2i
Government commitment to integrating the informal economy
The primary source for the size of the informal economy a policy research working paper from The World BankDevelopment Research Group Poverty and Inequality Team& Europe and Central Asia Region Human Development Economics Unit.
The primary source to determine the existence of a strategy document is the Financial Access 2010 report published by the World Bank.Consultative Group toAssist the Poor, FinancialAccess 2010.
2005-2007 This indicator looks at governments’ commitment to integrating the informal economy.
Countries were evaluated using the following scoring criteria:4= Government makes active efforts to integrate the informal economy or has already largely absorbed it;3= It makes some efforts;2= It makes efforts, but they are uneven etc.;1= It plays only a limited role;0= It is inactive in this area
Research assesses the size of the informal economy and whether a country has a strategy document in place to address its informal economy. Research uses the World Bank defi nition of the informal economy, where the informal economy refers to activities and income that are partially or fully outside government regulation, taxation, and observation.
101 Economist Intelligence Unit 2012
Appendix IIProject scope, framework and methodology
2011 Government E-Payments Adoption RankingA global index and benchmarking study
Indicator Source Data Year Range
Indicator defi nitions and construction
7.3i
Government commitment to the Financial Action Task Force (FATF)
Financial Action Task Force (FATF), The Asia/Pacifi c Group on Money Laundering (APG), The Caribbean Financial Action Task Force (CFATF), The Eurasian group on combating money laundering and fi nancing of terrorism (EAG), The Eastern and South African Anti Money Laundering Group (ESAAMLG), Financial Action Task Force on Money Laundering in South America (GAFISUD), the Intergovernmental Action Group against Money Laundering in West Africa (GIABA), the Middle East and North Africa Region (MENAFATF), the Committee of Experts on the Evaluation of Anti-Money Laundering Measures and the Financing of Terrorism (MONEYVAL), the International Monetary Fund (IMF), and the World Bank (WB).
2005-2011 This indicator looks at how compliant a country is with the 49 Financial Action Task Force recommendations on anti-money laundering and combating the fi nancing of terrorism.
Countries were evaluated using the following scoring criteria:4= 80%+ compliant with the FATF’s 49 recommendations;3= 60-79% compliant;2= 40-59% compliant;1= 20-39% compliant;0= less than 20% compliant
The FATF outlines four compliance ratings: Compliant, Largely compliant, Partially compliant, Non-compliant, or as Not applicable. States receive points for being compliant, partially compliant or largely compliant on a recommendation according to the scoring criteria above. If a recommendation is not applicable, a state’s score is based on the total number of applicable recommendations.
DEPENDENT VARIABLESDependent variables were included in the analysis in order to emphasise the relevancy of these variables to the scores achieved in the 2011 GEAR study.
Indicator Source Data Year Range
Indicator defi nitions and construction
E-Participation Index Global Information Technology Report published by the World Economic Forum.
2010 The E-Participation Index is a complement to the UN E-Government Development Index. The E-Participation Index assesses the quality and usefulness of information and services provided by a country for the purpose of engaging its citizens in public policy making through the use of e-government programmes. It is measured on a scale of 0-1 (where a score of 1 refl ects government inclusion of citizens in their decision-making process, government provision of information knowledge, and government consultation with citizens to obtain feedback).
Government Online Service Index
Global Information Technology Report published by the World Economic Forum.
2010 The Government Online Service Index is one of the three components of the UN E-Government Development Index, which is a widely recognised measure of public sector capacity to provide electronic and mobile services. The Government Online Service Index measures four online service development phases: stage 1—emerging information services, stage 2—enhanced information services, stage 3—transactional services, and stage 4—connected services. The Index is measured on a scale of 0-1 (where a score of 1 refl ects the best delivery of online services by the government).
GDP per capita Economist Intelligence Unit and national sources, which vary by country.
2010 Gross domestic product (GDP) per capita is a measure of total output of a country divided by the population.
102 Economist Intelligence Unit 2012
Appendix IIISelect bibliography
2011 Government E-Payments Adoption RankingA global index and benchmarking study
Infrastructure:
Source for indicators 5.1 and 5.2:
The Consultative Group to Assist the Poor/The World Bank Group Report (September 2010). “Financial Access 2010. The State of Financial Inclusion Through the Crisis”. URL: http://www.cgap.org/gm/document-1.9.46570/FA_2010_Financial_Access_2010_Rev.pdf
Social and economic context:
Source for indicator 6.1:
UNESCO Institute for Statistics, Data on national literacy rates for youths (15-24) and adults (15+). Accessed June 2011. URL: http://unstats.un.org/unsd/demographic/products/socind/literacy.htm
Source for indicator 6.2:
UNESCO Institute for Statistics, Data on school life expectancy (years) from primary to tertiary by country and sex . Accessed June 2011. URL: http://unstats.un.org/unsd/demographic/products/socind/literacy.htm
Sources for indicator 6.4:
The Consultative Group to Assist the Poor/The World Bank Group Report (September 2010). “Financial Access 2010. The State of Financial Inclusion Through the Crisis”. URL: http://www.cgap.org/gm/document-1.9.46570/FA_2010_Financial_Access_2010_Rev.pdf
The Consultative Group to Assist the Poor/The World Bank Group Report (September 2009). “Financial Access 2009. Measuring Access to Financial Services around the World”. URL: http://www.cgap.org/gm/document-1.9.38735/FA2009.pdf
Sources for indicator 6.5:
The International Bank for Reconstruction and Development/The World Bank Report: Doing Business 2011. Accessed September 2011. URL: http://www.doingbusiness.org/
The World Bank Group: Enterprise Surveys. Accessed September 2011. URL: http://www.enterprisesurveys.org/
Source for indicator 6.6:
The Consultative Group to Assist the Poor/The World Bank Group Report (September 2010). “Financial Access 2010. The State of Financial Inclusion Through the Crisis”. URL: http://www.cgap.org/gm/document-1.9.46570/FA_2010_Financial_Access_2010_Rev.pdf
Appendix III: Select bibliography
103 Economist Intelligence Unit 2012
Appendix IIISelect bibliography
2011 Government E-Payments Adoption RankingA global index and benchmarking study
Source for indicator 6.7:
United Nations Conference on Trade and Development (2010). “Information Economy Report 2010. ICTs, Enterprises and Poverty Alleviation”. URL: http://www.unctad.org/en/docs/ier2010_embargo2010_en.pdf
Source for indicator 6.9:
Bank for International Settlements (March 2011). “Statistics on Payment and Settlement Systems in the CPSS Countries: Figures for 2009”
Policy context:
Sources for indicator 7.2:
The World Bank Development Research Group Poverty and Inequality Team & Europe and Central Asia Region Human Development Economics Unit (July 2011). “Shadow Economies All over the World: New Estimates for 162 Countries from 1999 to 2007,” by Friedrich Schneider, Andreas Buehn, and Claudio E. Montenegro. URL: http://www-wds.worldbank.org/external/default/main?pagePK=64193027&piPK=64187937&theSitePK=523679&menuPK=64187510&searchMenuPK=64187511&entityID=000158349_20101014160704&cid=3001_4>
The Consultative Group to Assist the Poor/The World Bank Group Report (September 2010). “Financial Access 2010. The State of Financial Inclusion Through the Crisis”. URL: http://www.cgap.org/gm/document-1.9.46570/FA_2010_Financial_Access_2010_Rev.pdf
Sources for indicator 7.3:
Financial Action Task Force (FATF). URL: http://www.fatf-gafi .org/document/25/0,3746,en_32250379_32236963_43649561_1_1_1_1,00.html
The Asia/Pacifi c Group on Money Laundering (APG). URL: http://www.apgml.org/documents/default.aspx?DocumentCategoryID=17
The Caribbean Financial Action Task Force (CFATF). URL: http://www.cfatf-gafi c.org/
The Eurasian group on combating money laundering and fi nancing of terrorism (EAG). URL: http://www.eurasiangroup.org/
The Eastern and South African Anti Money Laundering Group (ESAAMLG). URL: http://www.esaamlg.org/work_programme/activities.php
Financial Action Task Force on Money Laundering in South America (GAFISUD). URL: http://www.gafi sud.info/home.htm
The Intergovernmental Action Group against Money Laundering in West Africa (GIABA). URL: http://www.giaba.org/
The Middle East and North Africa Region (MENAFATF). URL: http://www.menafatf.org/
The Committee of Experts on the Evaluation of Anti-Money Laundering Measures and the Financing of Terrorism (MONEYVAL). URL: http://www.coe.int/t/dghl/monitoring/moneyval/
The International Monetary Fund (IMF). URL: http://www.imf.org/external/index.htm
The World Bank Group. URL: http://www.worldbank.org/
Dependent Variables:
World Economic Forum, “Global Information Technology Report 2010-2011”. URL: http://www.weforum.org/reports

Whilst every effort has been taken to verify the accuracy of this information, neither the Economist Intelligence Unit Ltd. nor the sponsor can accept any responsibility or liability for reliance by any person on this report or any of the information, opinions or conclusions set out herein.Co
ver i
mag
e: S
hutt
erst
ock.
com

LONDON26 Red Lion SquareLondon WC1R 4HQUnited KingdomTel: (44.20) 7576 8000Fax: (44.20) 7576 8476E-mail: [email protected]
NEW YORK750 Third Avenue5th FloorNew York, NY 10017United StatesTel: (1.212) 554 0600Fax: (1.212) 586 0248E-mail: [email protected]
HONG KONG6001, Central Plaza18 Harbour RoadWanchai Hong KongTel: (852) 2585 3888Fax: (852) 2802 7638E-mail: [email protected]
GENEVABoulevard des Tranchées 161206 GenevaSwitzerlandTel: (41) 22 566 2470Fax: (41) 22 346 93 47E-mail: [email protected]