government finance statistics guide...government finance statistics guide 3 1 introduction this...
TRANSCRIPT
Government finance statistics guide
January 2019

Government finance statistics guide
1
Contents
1 Introduction 3
1.1 Latest update of the guide 3
1.2 Context and purpose 3
1.3 Methodological framework 4
1.4 ECB publications and other uses of GFS 6
1.5 Structure of the guide 7
2 Government revenue, expenditure and deficit/surplus (Table 1a) 9
2.1 Introduction to Table 1a 9
2.2 Table 1a: format and contents 10
2.3 Line-by-line analysis of Table 1a 11
3 Transactions with EU budget and the European Development Fund (EDF) (Table 1b) 23
3.1 Introduction to Table 1b 23
3.2 Table 1b: format and contents 23
3.3 Line-by-line analysis of Table 1b 24
4 Government consumption expenditure and other non-financial categories (Table 1c) 29
4.1 Introduction to Table 1c 29
4.2 Table 1c: Format and contents 30
4.3 Line-by-line analysis of Table 1c 31
5 Government deficit-debt adjustment (Table 2a) 35
5.1 Introduction to Table 2a 35
5.2 Table 2a: Format and contents 38
5.3 Line-by-line analysis of Table 2a 40
Breakdown by instrument 41
Breakdown by instrument 46
Breakdown by currency 50
Government finance statistics guide
2
6 Government Debt (Table 3a) 57
6.1 Introduction to Table 3a 57
6.2 Table 3a: Format and contents 60
6.3 Line-by-line analysis of Table 3a 61
Breakdown by instrument 61
Breakdown by holder/creditor 63
Currency denomination 66
Maturity of Maastricht debt 67
Breakdown of Maastricht debt by residual maturity 68
7 Government debt – consolidating elements (Table 3b) 72
7.1 Introduction to Table 3b 72
7.2 Table 3b: Format and contents 73
7.3 Line-by-line analysis of Table 3b 74
8 Compilation of aggregates for the euro area and the European Union 77
8.1 Aggregation method 77
8.2 Consolidation of national data 77
8.3 Treatment of the European Union budget and the EDF 78
9 References and background information 80
9.1 Legal background 80
9.2 Other published guidance and manuals 80
9.3 EDP notification tables 81
9.4 IMF government finance statistics 82

Government finance statistics guide
3
1 Introduction
This chapter explains the changes made to the Guide compared to the version of August 2014, how government finance statistics (GFS) are used at the European Central Bank (ECB) and also gives a brief overview of the methodological framework for GFS.
The Guide complements the latest GFS Guideline adopted by the ECB in 20181, which sets out the ECB’s statistical reporting requirements in the field of GFS. The Guide explains how the annual GFS data required by the GFS Guideline are compiled. The Guide is for use by staff in the national central banks (NCBs), national statistical institutes (NSIs) and other institutions engaged in preparing data for GFS returns, and for users requiring a better understanding of GFS.
1.1 Latest update of the guide
The alignment to the latest update of GFS Guideline in 2018 necessitated the changes to this Guide. Compared to the previous version of the Guide published in August 2014, the changes to GFS Tables 1a (Chapter 2), 1b (Chapter 3), 1c (Chapter 4) and Table 2a (Chapter 5) were done to achieve a greater consistency across euro area Member States and across datasets and incorporate further alignment of the current statistical requirements in the field of GFS with the European System of Accounts 2010 (ESA 2010) 2 Transmission Programme. In addition, the previous Table 2b on non-consolidated transactions in Maastricht debt has been deleted while Table 3b on consolidating elements of Maastricht debt has been expanded with more detailed data. Finally, Table 1b on transactions with the EU budget and European Development Fund (EDF) now includes a new separate section devoted to transactions vis-à-vis the Single Resolution Board/Single Resolution Fund.
1.2 Context and purpose
The ECB is interested in GFS for several reasons. It uses these in its monetary policy analysis, as government activity may influence the general price level. Moreover, the ECB, like the European Commission, prepares periodic “convergence” reports assessing the preparedness of non-participating Member States to adopt the euro; annual data on government deficits and outstanding government debt are important criteria here. The ECB also closely follows developments under the EU’s excessive deficit procedure (EDP) and the Stability and Growth Pact.
1 Guideline of the ECB of 25 July 2013 on government finance statistics (ECB/2013/23) as amended by
the GFS Guideline of 3 June 2014 (ECB/2014/21) and the GFS Guideline of 24 April 2018 (ECB/2018/13).
2 Regulation No 549/2013 of the European Parliament and of the Council of 21 May 2013 on the European system of national and regional accounts in the European Union.

Government finance statistics guide
4
The Governing Council of the ECB therefore attaches great importance to the reliable and timely compilation of GFS. It adopted the first guideline on the statistical reporting requirements in the field of GFS in 2005 to ensure the timely transmission of government statistics from the NCBs to the ECB. The original Guideline has since been repealed by the Guideline of the ECB of 25 July 2013 on government finance statistics (ECB/2013/23) and amended by the GFS Guideline of 3 June 2014 (ECB/2014/21) and the GFS Guideline of 24 April 2018 (ECB/2018/13).
The GFS Guideline imposes obligations on the ECB and the euro area NCBs, but does not bind the central banks of non-participating Member States. However, the information contained in this Guide is nevertheless relevant to them, as they also report GFS to the ECB.
1.3 Methodological framework
The GFS Guideline specifies the requested data on government revenue and expenditure, government deficit and debt, the relationship between deficit and debt, and transactions between the EU institutions and general government or other resident sectors of the economy. The Guideline also lays down when and how these data should be reported to the ECB. The Guideline defines the requested data by reference to the ESA 20103 and the EDP.4
European Union (EU) law requires Member States to use the ESA 2010 to prepare the macroeconomic statistics they send to the European Commission. This ensures that the national data are comparable. The ESA 2010 is based on the System of National Accounts 2008 (SNA 2008),5 a worldwide system developed by the Commission (Eurostat), the International Monetary Fund (IMF), the Organisation for Economic Co-operation and Development (OECD), the United Nations (UN) and the World Bank. The ESA 2010 is an integrated system of economic accounts from which many macroeconomic aggregates, such as gross domestic product, are derived. It organises the statistics on the output of an economy, the generation and distribution of income arising from that output, the accumulation of capital and of financial assets and liabilities, and balance sheets.
The general government sector in the ESA 2010 is composed of central government, state government (in countries where it exists), local government and social security funds (in countries where these exist). The principal economic functions of the general government sector are: (1) to assume responsibility for the provision of goods and services to the community or individual households for free or at prices that are not economically significant and (2) to redistribute national income and wealth by means of transfer payments, financing both of these activities primarily from taxation.
3 Regulation No 549/2013 of the European Parliament and of the Council of 21 May 2013 on the European
system of national and regional accounts in the European Union. 4 Council Regulation (EU) No 479/2009 as amended by Commission Regulation (EU) No 220/2014. 5 Available on the United Nations website.
Government finance statistics guide
5
GFS should reflect decisions taken by Eurostat on the interpretation of the ESA 2010 in specific cases involving the general government sector. With the aim of ensuring a consistent compilation of government deficit and debt across EU countries, Eurostat has developed a well-defined procedure for dealing with borderline transactions. After discussions in expert Eurostat working parties and task forces, Eurostat may consult the Committee on Monetary, Financial and Balance of Payments Statistics (CMFB),6 comprising senior statisticians of the ECB, Eurostat, the NCBs and national statistical institutes. Eurostat then takes the final decision on the transaction according to purely technical criteria, and this is subsequently applicable to similar cases arising throughout the EU. The main methodological decisions are discussed in more detail in the Manual on Government Deficit and Debt (MGDD).7
Total government revenue and expenditure are groupings of ESA 2010 non-financial transactions. Total government revenue consists, inter alia, of taxes and social contributions. Total government expenditure consists, inter alia, of compensation of government employees and government gross fixed capital formation. Chapter 2 explains the components of government revenue and expenditure in more detail. The deficit/surplus (net lending/net borrowing in the ESA 2010) is equal to total revenue less total expenditure.
Both the ESA 2010 and the EDP concern national data relating to the general government sector. They treat transactions between the EU institutions and institutional units in the Member States as transactions between resident sectors and the rest of the world. The GFS Guideline follows the ESA 2010 methodology, but specifies information on the transactions between Member States and the EU institutions financed by the EU budget and the European Development Fund (EDF), to capture the full extent of government activity in the EU. A detailed description of the EU budget and the EDF transactions is provided in Chapters 3 and 8.
The substantial differences between general government liabilities in the ESA 2010 balance sheet and government debt for EDP purposes are explained in Chapter 6. These differences can be summarised as follows:
• EDP debt comprises general government liabilities in the form of currency (coins), deposits, debt securities and loans only. All other general government liabilities, such as insurance technical reserves, other accounts payable (such as trade credits) and financial derivatives, are not included in Maastricht debt.
• The second difference arises from valuation. In the ESA 2010, general government liabilities are valued at market prices; in the EDP, they are entered at face value, which is the amount that the government is committed to repaying at maturity. The difference between market and face value can be large for zero coupon debt or for long-term coupon securities issued when coupon rates and market interest rates were different. Furthermore, the market price will reflect accrued interest on the instrument, whereas EDP debt at face value does not
6 See the CMFB website. 7 The MGDD is available in the government finance statistics section of the Eurostat website.
Government finance statistics guide
6
include accrued interest (with the exception of zero coupon bonds and the capital uplift for index-linked bonds).
• Third, the EDP values certain debt denominated in foreign currency in a different way. The ESA 2010 requires foreign currency debt to be converted into domestic currency at the spot market exchange rate on the balance sheet date. If the foreign currency liability is covered forward, the current market value of the foreign currency derivatives contract is entered in the balance sheet as a separate asset or liability of general government under financial derivatives. In the EDP, by contrast, the foreign currency liability is valued at the rate in the forward contract, not at the current spot market rate. A similar valuation procedure applies in the less likely case that debt denominated in domestic currency is converted into foreign currency debt.
EDP debt is consolidated, meaning that general government debt for EDP purposes excludes all holdings of general government debt by general government. Consolidation is explained in more detail in Chapter 7.
For the reasons set out, the reconciliation between the deficit/surplus and EDP government debt departs considerably from the reconciliation accounts in the ESA 2010 (i.e. other changes in the volume of assets (and liabilities) account and the revaluation account). The GFS Guideline requires information to enable the reconciliation between the deficit and debt (known as the deficit-debt adjustment (DDA).
Outstanding government debt does not necessarily increase in line with the deficit, for several reasons. First, the deficit is different from the amount a government needs to borrow (the borrowing requirement) because of changes in the financial assets it holds. Second, there are differences in the time of recording, mainly between government expenditure or revenue and any related cash flow. Finally, the change in outstanding government debt may differ from the borrowing requirement owing to other changes in the value or volume of debt as recorded in the “other changes in assets (and liabilities) account”. Chapter 5 explains the DDA in more detail.
1.4 ECB publications and other uses of GFS
The ECB requires two submissions each year of annual GFS (in April and October) and interim updates and revisions. These data deliveries are used to update the tables in the ECB’s Economic and Statistical Bulletins.8 The April and October data submissions are also used for internal purposes such as the June and December Fiscal Policy Notes, which contain statistics (up to year t-1) and fiscal forecasts (from year t to year t+2). Furthermore, the annual data transmitted by the NCBs of the non-participating Member States (excluding Denmark and the United Kingdom) are also used in the ECB’s Convergence Reports, which include tables with detailed breakdowns of government revenue and expenditure, the structural features of government debt and an analysis of the deficit-debt adjustment. 8 Available on the ECB website.

Government finance statistics guide
7
The ECB also publishes quarterly euro area aggregates of government revenue, expenditure, deficit, debt and the DDA in the ECB’s Economic and Statistical Bulletins. The provision of quarterly GFS is not covered by the GFS Guideline. Eurostat and the Member States kindly transmit these quarterly data to the ECB. The quarterly euro area aggregates of the financial accounts of the general government sector are used as a building block in compiling the integrated euro area accounts.
The ECB also compiles statistics on the (residual) maturity, debt service and nominal yields on government debt securities from the Centralised Securities Database (CSDB). The CSDB contains very detailed and up-to-date information on a security-by-security basis.9
1.5 Structure of the guide
The remainder of this Guide consists of chapters for each GFS reporting table and some additional methodological chapters:
• Chapter 2 provides an introduction to government revenue, expenditure and deficit/surplus, and a line-by-line analysis of Reporting Table 1a.
• Chapter 3 provides an introduction to the EU budget and the EDF transactions, and a line-by-line analysis of Reporting Table 1b.
• Chapter 4 provides an introduction to government consumption expenditure and other non-financial categories, and a line-by-line analysis of Reporting Table 1c.
• Chapter 5 provides an introduction to the deficit-debt adjustment and a line-by-line analysis of Reporting Table 2a.
• Chapter 6 provides an introduction to government debt and a line-by-line analysis of Reporting Table 3a.
• Chapter 7 provides an introduction to the consolidation of government debt and a line-by-line analysis of Reporting Table 3b.
• Chapter 8 explains how euro area and EU aggregates are compiled.
• Chapter 9 compares the ECB’s GFS data request with that of the IMF and the EDP notification tables.
• Chapter 10 contains a list of abbreviations.
Each chapter contains a table setting out the following information.
• the second column shows the GFS Guideline item numbers as listed in Annex II of the GFS Guideline.
9 For more information see the ECB statistical paper New and timely statistical indicators on government
debt securities, June 2015.

Government finance statistics guide
8
• the third column shows the item numbers used in the reporting tables sent to the NCBs for collecting the GFS data (which include not only the items in the Guideline but also some additional voluntary items reported by the NCBs). This column also shows how items in the GFS reporting tables relate to each other.
• the fourth column shows the corresponding codes in the ESA 2010.
Government finance statistics guide
9
2 Government revenue, expenditure and deficit/surplus (Table 1a)
2.1 Introduction to Table 1a
Government revenue and expenditure are defined in ESA 2010 paragraphs 20.76 and 20.91-20.92 respectively, as well as in Box 20.1. Government revenue and expenditure are recorded on an accrual basis, as are all transactions in the ESA 2010.
General government revenue and expenditure are respectively the sum of general government resources and the sum of general government uses that are transactions between units. ESA 2010 1.67-1.69 divides transactions into those within units and those between units.10 Transactions within units (intra-unit transactions) are excluded from the definitions of government revenue and expenditure since they do not affect net lending/net borrowing. The purpose of recording them in the ESA 2010 is to give a more analytically useful picture of output, final uses and costs. Most intra-unit transactions are transactions in products, typically recorded when institutional units consume some of the output they have produced themselves. By contrast, transactions between units (inter-unit transactions) generally have a counterpart transaction in the financial account and so affect net lending (+)/net borrowing (-). The practical application of this principle means that some ESA 2010 transactions, such as other non-market output and final consumption expenditure, are not explicitly recorded in government revenue and expenditure, whereas others, such as intermediate consumption and compensation of employees, are part of them.
Transactions within general government are consolidated only if the expenditure and revenue are in the same transaction line and same account in the ESA 2010. As such, current transfers within general government (D.73), interest (D.41), dividends (D.421), investment grants (D.92) and other capital transfers (D.99) are consolidated, but transactions in goods and services, taxes and subsidies are not.
In general, government revenue and expenditure are almost never recorded net, e.g. government interest receipts are not netted off against government interest payments. The one exception to this “no netting” rule is that capital formation is net of sales of capital assets, in accordance with the ESA 2010. The payable tax credits should be recorded as government expenditure for the total amount (ESA 2010 20.168).
The ECB GFS Guideline breaks government revenue down into current and capital revenue, and government expenditure into current and capital expenditure. These four categories do not exist in the ESA 2010 but are part of the ECB Guideline for analytical purposes. Current revenue less current expenditure equates to gross savings of general government.
10 Units are defined in the ESA 2010, paragraph 2.12.
Government finance statistics guide
10
2.2 Table 1a: format and contents
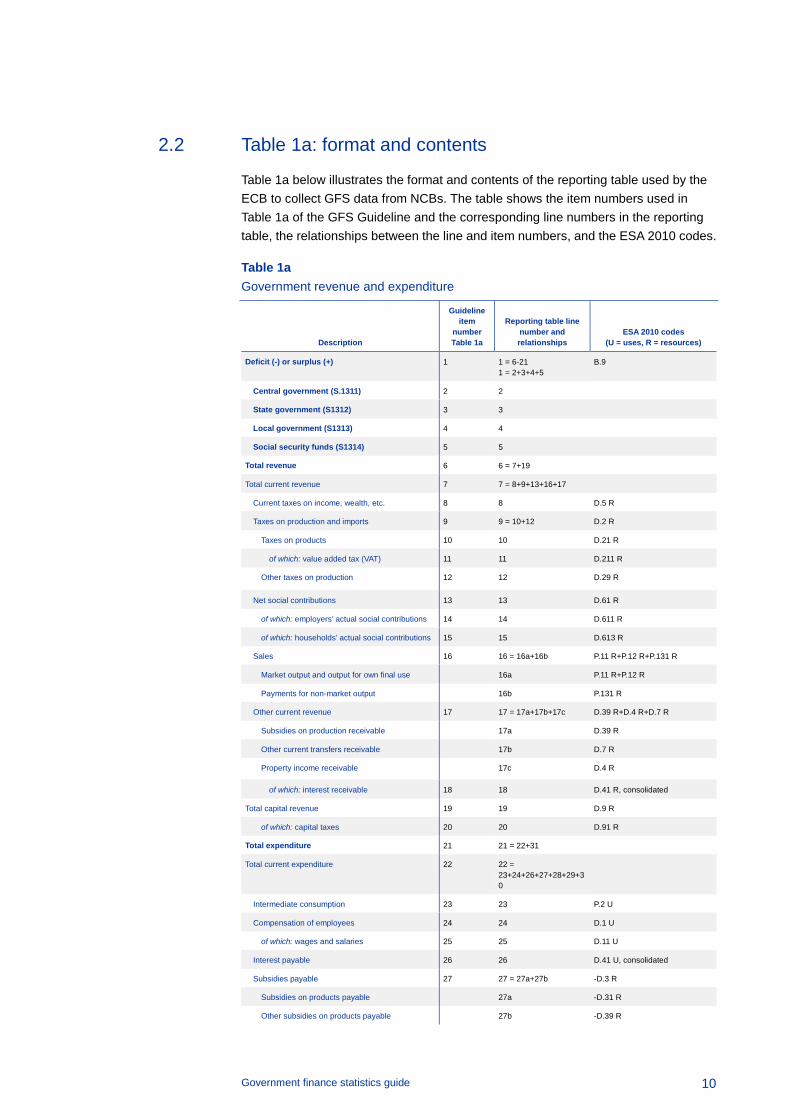
Table 1a below illustrates the format and contents of the reporting table used by the ECB to collect GFS data from NCBs. The table shows the item numbers used in Table 1a of the GFS Guideline and the corresponding line numbers in the reporting table, the relationships between the line and item numbers, and the ESA 2010 codes.
Table 1a Government revenue and expenditure
Description
Guideline item
number Table 1a
Reporting table line number and relationships
ESA 2010 codes (U = uses, R = resources)
Deficit (-) or surplus (+) 1 1 = 6-21 1 = 2+3+4+5
B.9
Central government (S.1311) 2 2
State government (S1312) 3 3
Local government (S1313) 4 4
Social security funds (S1314) 5 5
Total revenue 6 6 = 7+19
Total current revenue 7 7 = 8+9+13+16+17
Current taxes on income, wealth, etc. 8 8 D.5 R
Taxes on production and imports 9 9 = 10+12 D.2 R
Taxes on products 10 10 D.21 R
of which: value added tax (VAT) 11 11 D.211 R
Other taxes on production 12 12 D.29 R
Net social contributions 13 13 D.61 R
of which: employers’ actual social contributions 14 14 D.611 R
of which: households’ actual social contributions 15 15 D.613 R
Sales 16 16 = 16a+16b P.11 R+P.12 R+P.131 R
Market output and output for own final use 16a P.11 R+P.12 R
Payments for non-market output 16b P.131 R
Other current revenue 17 17 = 17a+17b+17c D.39 R+D.4 R+D.7 R
Subsidies on production receivable 17a D.39 R
Other current transfers receivable 17b D.7 R
Property income receivable 17c D.4 R
of which: interest receivable 18 18 D.41 R, consolidated
Total capital revenue 19 19 D.9 R
of which: capital taxes 20 20 D.91 R
Total expenditure 21 21 = 22+31
Total current expenditure 22 22 = 23+24+26+27+28+29+30
Intermediate consumption 23 23 P.2 U
Compensation of employees 24 24 D.1 U
of which: wages and salaries 25 25 D.11 U
Interest payable 26 26 D.41 U, consolidated
Subsidies payable 27 27 = 27a+27b -D.3 R
Subsidies on products payable 27a -D.31 R
Other subsidies on products payable 27b -D.39 R

Government finance statistics guide
11
Description
Guideline item
number Table 1a
Reporting table line number and relationships
ESA 2010 codes (U = uses, R = resources)
Social benefits other than social transfers in kind 28 28 D.62 U
of which: old age pensions and survivors’ pensions
28a (COFOG 10.2.0+COFOG 10.3.0) applied to D.62 U
of which: unemployment benefits 28b COFOG 10.5.0 applied to D.62 U
Social transfers in kind – purchased market production
29 29 D.632 U
Other current expenditure 30 30 = 30a+30b+30c+30d+30e
D.29 U+(D.4 U-D.41 U)+D.5 U+D.7 U+D.8 U
Other taxes on production 30a D.29 U
Other property income payable 30b D.4 U-D.41 U
Current taxes on income, wealth, etc. payable 30c D.5 U
Other current transfers payable 30d D.7 U
Adjustment for the change in pension entitlements
30e D.8 U
Total capital expenditure 31 31 = 32+33+34
Gross fixed capital formation 32 32 P.51 U
Other net acquisitions of non-financial assets and changes in inventories
33 33=33a+33b P.52 U+P.53 U+NP U
Changes in inventories and acquisitions less disposals of valuables
33a P.52 U+P.53 U
Acquisitions less disposals of non-financial non-produced assets
33b NP U
Capital transfers payable 34 34 D.9 U, consolidated
of which: investment grants 34a D.92 U
Memorandum items
Capital transfers representing taxes and social contributions assessed but unlikely to be collected
35 35 -D.995 U
2.3 Line-by-line analysis of Table 1a
Item 1: Deficit (-) or surplus (+)
This refers to the balance of net lending (+)/net borrowing (-) (B.9) of the general government sector in national accounts, which is the balance of the capital account.
This item is equal to the difference between total revenue (item 6) and total expenditure (item 21), which implies that if the government is spending more than it is receiving, the figure recorded in item 1 will be negative.
Items 2 to 5: Deficit (-) or surplus (+) by sub-sector
This refers to net lending (+)/net borrowing (-) (B.9) by the sub-sectors of general government.
Government finance statistics guide
12
State government refers to the regional level of government, in between central and local government. It does not refer to that part of central government sometimes called “the state”, as in “the state budget”. It is confined to those countries that are a federation of regional governments, such as Belgium, Germany, Austria and Spain.
Item 6: Total revenue
This is the set of ESA 2010 non-financial transactions that increase the general government net lending (surplus) or reduce net borrowing (deficit). They are transactions that increase net financial worth.
Item 7: Total current revenue
This is the set of ESA 2010 non-financial transactions that increase gross saving. It is the sum of taxes and net social contributions, sales and other current revenue.
Item 8: Current taxes on income, wealth, etc.
Current taxes on income, wealth, etc. (D.5) cover all compulsory, unrequited payments, in cash or in kind, levied periodically by general government and by the rest of the world on the income and wealth of institutional units, and some periodic taxes which are assessed on neither income nor wealth (ESA 2010 4.77-4.82). These taxes are not consolidated in GFS, so any taxes paid by one part of government to another are included as both revenue and expenditure. For example, some non-profit institutions, or extra-budgetary funds, classified as belonging to the government sector may be liable for tax on their interest income.
Item 9: Taxes on production and imports
Taxes on production and imports (D.2) receivable by general government are compulsory, unrequited payments, in cash or in kind, levied by general government in respect of the production and import of goods and services, the employment of labour or the ownership or use of land, buildings or other assets used in production (ESA 2010 4.14-4.29). These taxes are not consolidated. For example, taxes on the use of buildings by government entities (D.29) should be included in both revenue and expenditure.
Item 10: Taxes on products
Taxes on products (D.21) receivable by general government are compulsory, unrequited payments, in cash or in kind, levied by general government per unit of a
Government finance statistics guide
13
given good or service produced or transacted. These include, for example, value added type taxes, import duties and taxes, and excise and stamp taxes.
Item 11: Value added tax (VAT)
ESA 2010 4.17 defines VAT as a tax on goods or services collected in stages by enterprises and which is ultimately charged in full to the final purchaser.
Item 12: Other taxes on production
Other taxes on production (D.29) consist of all taxes levied as a result of production, independent of the quantity or value of the goods and services produced or sold. These taxes include, for example, taxes on ownership and use of land or fixed assets in production, taxes paid for business and professional licences, and taxes on pollution from production activities.
Item 13: Net social contributions
Net social contributions are recorded as resources of government (D.61). They are composed of employers’ actual social contributions (D.611), employers’ imputed social contributions (D.612), households’ actual social contributions (D.613) and households’ social contribution supplements (D.614), less social security scheme service charges (D.615). Actual social contributions are payments received by general government either from employers for their employees (ESA 2010 4.92-4.96) or from households on their own behalf (ESA 2010 4.100) under social security schemes or insurance and pension schemes, including schemes organised for an employer’s own employees. Employers’ imputed social contributions include estimates of accruing pension obligations to currently employed government staff; in practice, the imputation is usually based on amounts currently contributed by general government units under pay-as-you-go unfunded insurance schemes (ESA 2010 4.97-4.99). The imputed social contributions are included as part of compensation of employees (D.1) – a use from the employer perspective and resource from the household perspective – to reflect the true economic cost of employing staff in an unfunded pay-as-you-go pension scheme. The amounts are then recorded as imputed payments from households to government in D.612. The actual pensions paid are recorded in D.6211.
Item 14: Employers’ actual social contributions
This item consists of employers’ actual social contributions (D.611) payable by employers into social security schemes and into funded autonomous pension schemes by government, but re-routed in the national accounts as payments from employers to households and then as payments from households to government.

Government finance statistics guide
14
Item 15: Households’ actual social contributions
These are social contributions payable by households (employees, self-employed and non-employed persons) into social security schemes and into funded autonomous pension schemes of government (D.613).
Item 16: Sales
Sales consist of the following resources of government in the ESA 2010: market output (P.11), output for own final use (P.12) and payments for non-market output (P.131).
Market output (P.11) is equal to charges for goods and services by market establishments (some of which may be within the general government sector), plus sales at economically significant prices by non-market establishments (sometimes called “incidental sales”). Examples of where non-market establishments may charge economically significant prices (normally covering at least half of production costs) are:
• a government museum which charges economically significant prices for some of its services, such as refreshments and car parking for visitors, although its entrance fee is not economically significant;
• a government department or local authority which aims to reduce demand for road space and hence congestion by levying charges for the use of roads at certain times.
Output for own final use (P.12) consists of goods or services that are retained by government either for final consumption or for gross fixed capital formation. For example, a government department might employ its own staff to construct specialised capital equipment for security purposes. The finished capital goods are regarded as having been sold by government to itself and are included in gross fixed capital formation (P.51g). This component is not strictly a sale since it is not a transaction with another unit. The inclusion of this transaction in revenue, and of the corresponding transaction in expenditure (gross fixed capital formation), constitutes an exception to the general principle that intra-unit transactions are eliminated in GFS. The reason is to ensure that expenditure on items such as capital formation is recorded in full to give a complete picture of government activity. The production of output for own final use is economically analogous to the case where general government produces investment goods and sells them on the market, and then buys similar goods from another producer.
Payments for non-market output (P.131), sometimes called “partial payments”, consist of sales at prices that cover less than half of the production cost. This is the case, for instance, where a government health department charges patients for the provision of medicines, but at a standard price usually well below the cost of the medicines. Prices are not considered economically significant if they are not intended to influence
Government finance statistics guide
15
demand and thus ration the distribution of the goods and services supplied, but rather to contribute to the cost.
The sales, intermediate consumption and social transfers in kind purchased from market producers categories are not consolidated. In other words, the sale of a service by one government unit to another would add to the figures for sales and intermediate consumption in the GFS tables.
Chapter 4 shows how sales relate to government output and consumption.
Item 16a: Market output and output for own final use
This item consists of market output (P.11) and output for own final use (P.12) as explained in item 16.
Item 16b: Payments for non-market output
This item consists of payments for non-market output (P.131) as explained in item 16.
Items 16a and 16b are not included in the GFS Guideline, but are part of the GFS data request.
Item 17: Other current revenue
This consists of transactions that are part of current revenue and are not included in taxes (items 8 and 9), net social contributions (item 13) or sales (item 16). It comprises subsidies on production (D.39 U), property income (D.4) and other current transfers (D.7) (ESA 2010 20.85-20.90).
Item 17a: Subsidies on production
This item includes other subsidies on production (D.39 U) receivable by government units engaged in production.
Item 17b: Other current transfers
Other current transfers (D.7) include net non-life insurance premiums and claims, current international cooperation and miscellaneous current transfers.

Government finance statistics guide
16
Item 17c: Property income
Property income (D.4) is income received by owners of financial assets (investment income) and owners of natural resources (rents) for putting them at the disposal of other institutional units. This income includes interest, dividends, withdrawals from income of quasi-corporations, reinvested earnings on foreign direct investment, rents, etc.
Items 17a, 17b and 17c are not included in the GFS Guideline, but are part of the GFS data request.
Item 18: Interest receivable
This is the amount that non-government units (debtors) become liable to pay to the government over a given period, without reducing the principal outstanding (D.41, ESA 2010 4.42-4.52). Interest receivable/payable is consolidated within general government. The recording of interest is explained in more detail in Chapter II.4 of the MGDD.
Item 19: Total capital revenue
This consists of capital taxes (D.91), investment grants (D.92) and other capital transfers (D.99) that are receipts of government.
Capital transfers (D.92 and D.99) in cash consist of transfers of cash that the first party has raised by disposing of assets (other than inventories), or that the second party is expected or required to use for the acquisition of assets (other than inventories) or to pay off liabilities. Capital transfers in kind are transfers of ownership of an asset (other than inventories or cash), or the cancellation of a liability by a creditor without any counterpart being received in return (ESA 2010 4.145-4.167).
Capital revenue does not include capital transfers (D.92 or D.99) within government, for example between central and local government, since these are consolidated.
In some countries’ national accounts, capital transfers (D.995) are recorded for writing off taxes that accrue but are never paid. This ensures that net lending (+)/net borrowing (-) reflects only taxes that are actually collected, in cases where the accrued amounts recorded under taxes include amounts that are never collected. Such capital transfers should be recorded as negative figures under capital transfers received, rather than as positive figures under capital transfers paid.
Item 20: Capital taxes
Capital taxes (D.91) are taxes levied at irregular intervals on the value of assets owned or transferred. They include, for example, inheritance tax and taxes on increases in land values owing to land use regulations.

Government finance statistics guide
17
Item 21: Total government expenditure
This item consists mainly of the set of ESA 2010 non-financial transactions that decrease the general government net lending (surplus) or increase net borrowing (deficit). These are transactions that decrease net financial worth.
Item 22: Total current expenditure
This item consists mainly of the set of ESA 2010 non-financial transactions that decrease gross saving. It is the sum of intermediate consumption, compensation of employees, interest and subsidies payable, social benefits and other current expenditure.
Item 23: Intermediate consumption
This is the value of the goods and services consumed by government to produce its own output (P.2). It excludes the consumption of fixed capital (P.51C, ESA 2010 3.88-3.92), which is not included in the GFS definition of government expenditure since it does not affect the deficit (B.9).
Item 24: Compensation of employees
This is the total remuneration, in cash or in kind, paid by government to its employees in return for work done by the latter during the accounting period (D.1, ESA 2010 4.02).
Item 25: Wages and salaries
This item includes wages and salaries in cash and in kind (D.11, ESA 2010 4.03-4.07).
Item 26: Interest payable
This is the amount that government, as a debtor, becomes liable to pay to the creditor over a given period, without reducing the principal outstanding (D.41, ESA 2010 4.42-4.52). Interest payable is consolidated within general government. The recording of interest is explained in more detail in Chapter II.4 of the MGDD.
Item 27: Subsidies payable
These are current unrequited payments from government to resident producers with the objective of influencing their production, their prices or the remuneration of factors of production (ESA 2010 4.30-4.40). Subsidies are not consolidated. The ESA 2010

Government finance statistics guide
18
treats this item (D.3) as a negative resource of the government sector, rather than as a use, thus keeping it in the same part of the accounts as tax receipts. It is the only government “resource” included in government expenditure. Therefore, subsidies are presented in the tables with the sign reversed to be consistent with national accounts. For example, “- D.3 R” means that a positive figure should be recorded for subsidies payable by government.
Note that subsidies include tax credits paid to corporations that are treated as government expenditure in national accounts and hence classified in D.3.
Item 27a: Subsidies on products payable
Subsidies on products (D.31) are paid by government per unit of a good or service produced or imported. Subsidies on products only apply to market output and output for own final use.
Item 27b: Other subsidies on production payable
These are subsidies other than subsidies on products that are paid to resident units for engaging in production. They include subsidies on payroll or workforce, subsidies to reduce pollution and interest relief grants.
Items 27a and 27b are not included in the GFS Guideline, but are part of the GFS data request.
Item 28: Social benefits other than social transfers in kind
Social benefits (D.62) are transfers to households, other than transfers in kind, intended to relieve them from the financial burden of a number of risks and needs. They include payments under occupational pension schemes for government employees and state old age pension schemes, as well as social security and social assistance benefits in cash.
Item 28a: Old age pensions and survivors’ pensions
This item corresponds to the Classification of the Functions of Government (COFOG) 10.2.0 and 10.3.0 data applied to the expenditure on social benefits other than social transfers in kind. These data are available in Table 11 of the ESA 2010 Transmission Programme (TP). T-1 data and back data should be based on best estimates when they are not available in the TP.
Government finance statistics guide
19
Item 28b: Unemployment benefits
This item relates to the COFOG 10.5.0 data applied to expenditure on social benefits other than social transfers in kind. These data are available in Table 11 of the ESA 2010 Transmission Programme (TP). T-1 data and back data should be based on best estimates when they are not available in the TP.
Items 28a and 28b are not included in the GFS Guideline, but are part of the GFS data request.
Item 29: Social transfers in kind – purchased market production
Social transfers in kind via market producers (D.632) are goods and services produced by market producers and purchased by government, which supplies them to households without any transformation (ESA 2010 3.98.b). Note that for GFS it is necessary to distinguish between goods and services bought by government to produce government output (included in intermediate consumption (P.2)) and those bought by government from market producers and supplied directly to households without any processing by government (included in social transfers in kind via market producers (D.632)). Both are included in government final consumption expenditure (P.3).
Item 30: Other current expenditure
This item consists of current expenditure not included in any other category of current expenditure. It comprises other taxes on production (D.29), property income, excluding interest (D.4 except D.41), current taxes on income and wealth (D.5), other current transfers (D.7) and the adjustment for the change in pension entitlements (D.8) (ESA 2010 20.102-20.103). The adjustment for the change in net equity of households in pension funds reserves (D.8) is necessary only in the rare case where the government operates a funded pension scheme.
Item 30a: Other taxes on production
This item includes other taxes on production (D.29) payable by the government units involved in production.
Item 30b: Other property income payable
This item includes property income, excluding interest (D.4 except D.41) payable by the government units.
Government finance statistics guide
20
Item 30c: Current taxes on income, wealth, etc., payable
This item consists of current taxes on income, wealth, etc. (D.5) payable by the government units.
Item 30d: Other current transfers payable
This item consists of other current transfers (D.7) payable by the government units.
Item 30e: Adjustment for the change in pension entitlement
This item consists of the adjustment for the change in pension entitlements (D.8) (ESA 2010 20.102-20.103). This adjustment is necessary only in the rare case where the government operates a funded pension scheme.
Items 30a to 30e are not included in the GFS Guideline, but are part of the GFS data request.
Item 31: Total capital expenditure
This item includes government gross fixed capital formation, net acquisition of other non-financial assets, changes in inventories and capital transfers.
Netting off sales of assets from acquisitions in categories P.5 and NP is standard ESA 2010 practice. Thus, sales of non-financial assets such as buildings are not recorded as revenue, but as negative capital expenditure, making net lending/net borrowing more positive. This constitutes an exception to the general principle of not netting.
Item 32: Gross fixed capital formation
Gross fixed capital formation (P.51g) (government investment) is recorded within changes in government assets. It equals the acquisition less disposal of fixed assets, plus certain improvements to the value of non-produced assets such as land (e.g. by spending on sea defences or drainage) (ESA 2010 3.124-3.138). “Gross” here means before depreciation is deducted, but after the deduction of sales of capital assets.

Government finance statistics guide
21
Item 33: Other net acquisitions of non-financial assets and changes in inventories
This item comprises changes in inventories (P.52), net acquisition of valuables (P.53)11 and net acquisition of non-financial non-produced assets (NPs). Note that “net” here means net of the sale of assets.
Item 33a: Changes in inventories and acquisitions less disposals of valuables
This item includes changes in inventories (P.52) and net acquisition of valuables (P.53).
Changes in inventories (P.52) includes the acquisition of commodities to be held in stock for subsequent use as intermediate consumption, less the sale or consumption of commodities held in stock, plus changes in inventories of work-in-progress and finished goods (ESA 2010 3.146-3.153). Note that when stock is purchased or sold (P.52) there is an impact on net lending (+)/net borrowing (-), but when stocks are produced or consumed there is no impact. This is because output (P.1) offsets the positive stockbuilding when stocks are produced, and intermediate consumption (P.2) offsets the negative stockbuilding when stocks are consumed.
Net acquisition of valuables (P.53) is the acquisition of goods that are not used primarily for production or consumption, but are held primarily as stores of value, such as precious metals and works of art (ESA 2010 3.154-3.157). It is unlikely that governments would hold such items as a store of value, since works of art acquired for display are regarded as producing cultural outputs and so should be included in fixed assets (P.51).
Item 33b: Acquisitions less disposals of non-financial non-produced assets
The net acquisition of NPs consists of the net acquisition of non-produced assets that may be used in the production of goods and services, such as land, sub-soil assets and non-cultivated biological resources (ESA 2010 3.184-3.194). It also includes intangible non-produced assets, such as contracts for the use of non-financial assets (for example property leases) that are subsequently traded.
Items 33a and 33b are not included in the GFS Guideline, but are part of the GFS data request.
11 Monetary gold is treated as a financial asset (F.1), not as a valuable (P.53).
Government finance statistics guide
22
Item 34: Capital transfers payable
This consists of investment grants (D.92) payable by government (see item 34a) and other capital transfers (D.99). ESA 2010 4.164 states, “other capital transfers (D.99) cover transfers other than investment grants and capital taxes which do not themselves redistribute income but redistribute saving or wealth among the different sectors or sub-sectors of the economy or the rest of the world.”. These include the capital transfers recorded as the counterpart to an assumption of debt by mutual consent. A comprehensive list of transactions is given in ESA 2010 4.165.
Note that there are special rules for distinguishing between capital transfers and financial transactions in the case of payments between government and public corporations (see Chapter III of the MGDD for more details). For example, a capital injection from government to a public corporation might be described in legal terms as the acquisition of equity. In national accounts it would be classified as a capital transfer and not as a financial transaction, provided the government is not acting as a rational investor expecting a commercial return on its investment.
Capital transfers (D.995) are recorded for cancelling taxes that accrue but are never paid. These should be recorded as negative figures under capital transfers received, rather than as positive figures under capital transfers payable (see item 35).
Item 34a: Investment grants
Investment grants (D.92) consist of capital transfers in cash or in kind made by governments or by the rest of the world to other resident or non-resident institutional units to finance all or part of the costs of their acquiring fixed assets (ESA 2010 4.152). Item 34a is not included in the GFS Guideline, but it is part of the GFS data request.
Item 35: Capital transfers representing taxes and social contributions assessed but unlikely to be collected (memo item)
In some countries’ national accounts, capital transfers (D.995) are recorded for cancelling taxes that accrue but are never paid. This ensures that net lending (+)/net borrowing (-) reflects only taxes that are actually collected (or are likely to be collected). Such capital transfers should be recorded as negative figures under capital transfers received (under item 19), rather than as positive figures under capital transfers payable.
Government finance statistics guide
23
3 Transactions with EU budget and the European Development Fund (EDF) (Table 1b)
3.1 Introduction to Table 1b
In the ESA 2010 national accounts, total government revenue and expenditure are defined as groups of non-financial transactions of the general government sector of a Member State. Transactions between the resident sectors of the national economy and the EU budget are treated as transactions with the rest of the world (S.2) – and specifically with institutions and bodies of the EU (S.212). These transactions include transfers to finance the European Development Fund (EDF) managed by the European Commission as an extra-budgetary fund. In economic terms, however, EU budget subsidies are similar in their impact to subsidies paid by (national) general government. Likewise, the taxpayer perception is that taxes that are resources of the EU budget and the EDF are similar to those paid to (national) general government. To better understand the extent of both national and EU government activity in a Member State, information on the EU budget and the EDF transactions is therefore required.
The data on the EU budget and EDF transactions in Reporting Table 1b allow the ECB to examine, for each Member State, the payments made by the resident sectors of the economy to the EU budget and the EDF, and also EU expenditure in the Member State. This enables net payers into and net recipients of the EU budget to be identified, along with the impact of the EU budget and the EDF transactions on the general government deficit/surplus.
Chapter 8 contains a detailed description of the treatment of the EU budget and EDF transactions in the compilation of euro area and EU aggregates.
In addition, Table 1b includes transactions with the Single Resolution Board/Single Resolution Fund (SRB/SRF). These transactions are the contributions from the Member States’ financial institutions to the SRB/SRF and capital transfers from the SRB/SRF to the financial entity in the Member States in cases where the SRB/SRF conducts a resolution of a financial institution in a Member State.
3.2 Table 1b: format and contents
The table below shows the format and contents of Reporting Table 1b used by the ECB to collect GFS data from NCBs. The table shows the item numbers used in Table 1b of the GFS Guideline and the corresponding line numbers in the reporting table, the relationships between the line and item numbers, and the ESA 2010 codes.

Government finance statistics guide
24
Table 1b Transactions with the EU budget and the EDF
Description Guideline item
number Table 1b Reporting table line number
and relationships ESA 2010
codes
Revenue of the European Union (EU) budget and of the European Development Fund (EDF) from the Member State
1 1 = 2+3+4+7
Taxes on production and imports 2 2 D.2
Current international cooperation 3 3 D.74
Miscellaneous current transfers and EU own resources 4 4 D.75+D.76
of which: VAT-based third own resource 5 5 D.761
of which: GNI-based fourth own resource 6 6 D.762
of which: UK rebate - 6a D.762K
Capital transfers 7 7 D.9 U
Expenditure of the EU budget in the Member State 8 8 = 9+10+11+12+13+14
Subsidies 9 9 D.3
Current transfers to government 10 10 D.74+D.75
Current transfers to non-government 11 11 D.75
Capital transfers to government 12 12 D.9 R (S13)
Capital transfers to non-government 13 13 D.9 R (S1W)
Own resources collection costs 14 14 P.131
Balance of Member State vis-à-vis the EU budget and the EDF (net recipient +, net payer -)
15 15 = 8-1
Memo: Member State net revenue from pre-acceding programmes
- 16
Memo: Net revenue from pre-acceding programmes paid to government
- 17
Transactions with the Single Resolution Board/Single Resolution Fund(SRB/SRF)
Contributions to the Single Resolution Board/Single Resolution Fund (SRB/SRF)
- 18 D.29
Capital transfers from SRB/SRF - 19 D.9
of which: to financial entities in general government - 20 D.9
3.3 Line-by-line analysis of Table 1b
Item 1: Revenue of the EU budget and of the EDF from the Member State
This is the total of taxes on production and imports (D.2) received by the EU budget, plus other current transfers (D.7) and capital transfers (D.9) paid by general government to the EU budget and the EDF as recorded in national accounts.

Government finance statistics guide
25
Item 2: Taxes on production and imports
These comprise EU own resources, including several types of taxes on production and imports.12 The national accounts of Member States classify them as taxes on production and imports (D.2) paid by national residents to the institutions of the EU (S.212).
Note that the full amount of these taxes collected is included, not just the net amount paid after deduction of collection costs. The collection costs (item 14) are treated as a sale of a service by government (P.131) to the rest of the world.
Item 3: Current international cooperation
Current international cooperation (D.74) includes current transfers paid by general government to the EU budget and the EDF other than the fourth resource. These could include transfers to finance the EDF managed by the European Commission as an extra-budgetary fund.
Item 4: Miscellaneous current transfers and EU own resources
This line is for miscellaneous current transfers (D.75), as well as VAT-based and GNI-based EU own resources (D.76) paid by government to the EU, i.e. the UK rebate and the third and the fourth resources (see below).
Item 5: VAT-based third own resource
This is the value added tax (VAT)-based contribution (the third resource) to the EU budget. It includes any currency transfers paid by the general government of each Member State to the EU budget under the third resource.
Item 6: GNI-based fourth own resource
This is the gross national income (GNI)-based contribution (the fourth resource) to the EU budget. It includes any current transfers paid by the general government of each Member State to the EU budget under the fourth resource.
12 Such as receipts from the CAP, levies on imported agricultural products, monetary compensatory
amounts levied on exports and import, sugar production levies and the tax on isoglucose, co-responsibility levies on milk and cereals, receipts from trade with third countries and customs duties levied on the basis of the Integrated Tariff of the European Union (TARIC).
Government finance statistics guide
26
Item 6a: UK rebate
The UK rebate is a reduction, agreed by the European Council, in the payments to the EU budget by the UK, compensated by increased payments from other Member States. This item is not part of the GFS Guideline, but is included as a voluntary item in the GFS reporting tables. This item will be applicable until the UK is in the EU.
Item 7: Capital transfers
This would include the exceptional case where a national government pays an investment grant to the EU budget.
Item 8: Expenditure of the EU budget in the Member State
This equals payments from the EU budget to government units and non-government resident sectors as recorded in national accounts.
Item 9: Subsidies
Typically, this consists of agricultural subsidies paid under the Common Agricultural Policy (CAP). In national accounts, these are transactions between the rest of the world and non-government resident sectors in D.3.
Item 10: Current transfers to government
These are general government resources in current international cooperation (D.74) and miscellaneous current transfers (D.75). They can include rebates to national governments from the EU budget, and current transfers to government units to fund activity in those units. Government units in receipt of EU transfers can, for example, include government scientific institutions undertaking EU-funded research and development programmes.
Item 11: Current transfers to non-government units
Non-government here includes households (S.14) and Non-profit institutions serving households (NPISHs) (S.15). Typically, these are payments under the European Social Fund, such as transfers for education and training, and are classified under D.75.

Government finance statistics guide
27
Item 12: Capital transfers to government
These are general government receipts of investment grants (D.92). The item could include transfers to local government for structural improvements, such as road building and other European Regional Development Fund (ERDF) programmes, where government units acquire capital assets rather than passing the transfers on to non-government units for them to acquire capital assets.
Item 13: Capital transfers to non-government units
Typically, these are investment grants (D.92) paid from the European Agricultural Guidance and Guarantee Fund (EAGGF) and the ERDF programmes.
Item 14: Own resources collection costs
Member State governments collect taxes on behalf of the EU budget and transfer amounts to the EU budget net of an agreed amount to cover collection costs. The difference between the amount collected and the actual funds passed to the EU budget is recorded as payments to government for non-market output (P.131). EU tax receipts are recorded gross (i.e. before deduction of the collection costs).
Item 15: Balance of Member State vis-à-vis the EU budget and the EDF
This item equals expenditure of the EU budget in the Member State (item 8) less the revenue of the EU budget and the EDF from the Member State (item 1). It represents the net impact of transfers between the Member State on the one hand and the EU budget and the EDF on the other.
Note that the EU budget and the EDF payments and receipts include only subsidies, taxes and other transfers; they do not include payments for goods and services or wages in the Member State.
Items 16 and 17: Net revenue from pre-acceeding programmes (memo items)
Net revenues from the pre-accession funds (Poland and Hungary Assistance for the Restructuring of the Economy (PHARE), Instrument for Structural Policies for Pre-Accession (ISPA), Special Accession Programme for Agriculture and Rural Development (SAPARD), etc.) are not part of the transactions between the EU budget and a Member State. This is because these pre-accession funds represent a relationship between the EU budget and countries which are not Member States and so should not be recorded in Table 1b as EU budget transactions with Member States, even if funds are paid under continuing multi-year programmes. However, it may

Government finance statistics guide
28
sometimes be difficult around the time of accession to allocate the relevant funds to the correct programme, hence the presence of two additional memorandum items in Table 1b of the GFS data request (not included in the GFS Guideline): “Member State net revenue from pre-acceding programmes” (item 16) and “Net revenue from pre-acceding programmes paid to government” (item 17).
Item 18: Contributions to the Single Resolution Board/Single Resolution Fund (SRB/SRF)
The Single Resolution Board (SRB) and the Single Resolution Fund (SRF) were created in 2016 as part of a common framework for carrying out resolution activities in the EU. The SRB is the central resolution authority within the EU Banking Union. The SRB is classified in the sector “Institutions and bodies of the European Union” (S.212) as a government entity resident in the EU outside the euro area. The SRF is composed of contributions from credit institutions and certain investment firms in the participating Member States within the EU Banking Union. The SRF has no autonomy of decision and is not considered a separate institutional unit. It is therefore classified together with the SRB.
This item includes the contributions that the SRB is entitled to levy – normally a power exclusive to government entities. The contributions raised at national level are transferred to the SRF over the eight-year transitional phase starting in 2015. The contributions are recorded as an EU tax (other taxes on production – D.29), including the 2015 contributions collected by the National Resolution Authority/National Resolution Fund and transferred to the SRF in 2016 (as an EU tax in 2015).
Item 19: Capital transfers from the SRB/SRF
The SRB/SRF may use its resolution tools to support a failing financial institution. The amounts transferred by the SRB/SRF to the financial institutions under resolution are recorded as capital transfers (D.9).
Item 20: Capital transfers to financial entities in general government
This item includes capital transfers to financial entities that are classified in the general government sector. Where resolution activities apply, there are two possible cases with different classification implications: (i) viable institutions that will continue to be financial intermediaries (classified asS.122); and (ii) non-viable institutions (known as “defeasance structures” in the ESA 2010) that hold impaired assets which are extinguished progressively through the realisation of the assets. The latter may be classified in the general government sector based on the control and the risk and reward criteria.
Items 18, 19 and 20 are not part of the GFS Guideline, but are included as voluntary items in the GFS reporting tables.

Government finance statistics guide
29
4 Government consumption expenditure and other non-financial categories (Table 1c)
4.1 Introduction to Table 1c
The purpose of Table 1c is to collect data on government final consumption.
Final consumption expenditure is defined in ESA 2010 20.108 as the expenditure incurred by resident institutional units on goods or services that are used for the direct satisfaction of individual needs or wants or the collective needs of the community. Final consumption expenditure may take place on the domestic territory or abroad (in which case it is, at least in principle, reflected in imports of goods and services). General government final consumption expenditure includes two categories of expenditure.
• The value of the goods and services produced by general government itself (P.1) other than market output (P.11), output for own final use (P.12) and payments for non-market output (P.131).
• Purchases by general government of good and services produced by market producers that are supplied to households, without any transformation, as social transfers in kind (D.632). General government pays for these goods and services that the sellers provide to households.
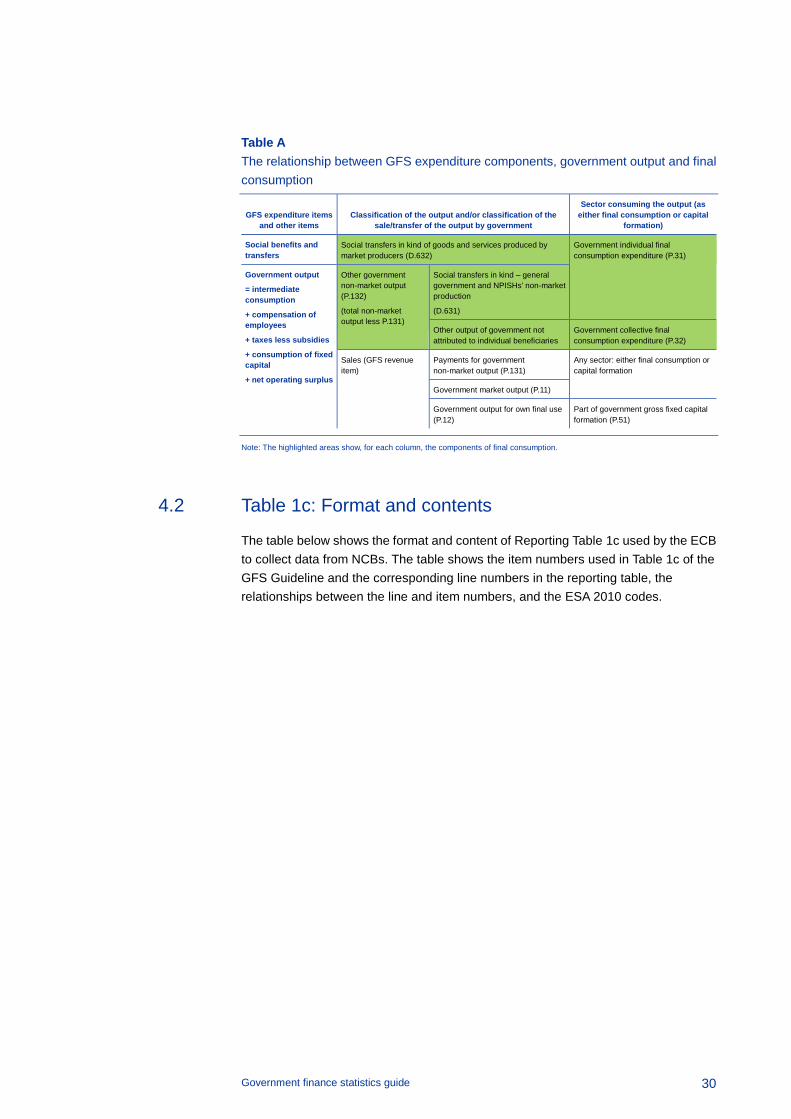
Table A shows the relationship between expenditure components, government output and government final consumption. The highlighted areas show, for each column, the components of final consumption. The last column shows that government final consumption consists of both individual and collective government consumption, as explained above. The middle column shows that government final consumption consists of the following.
• Social transfers in kind – market production purchased by general government and NPISHs (D.632). These are goods and services produced by market producers and purchased by government, which supplies them to households without any transformation (ESA 2010 3.98.b).
• Other government non-market output (P.132), which is government output that is supplied free of charge.
The table also shows that the other components of government output (P.11, P.12 and P.131), which together constitute the sales of government, are not part of government consumption.
Government finance statistics guide
30
Table A The relationship between GFS expenditure components, government output and final consumption
GFS expenditure items and other items
Classification of the output and/or classification of the sale/transfer of the output by government
Sector consuming the output (as either final consumption or capital
formation)
Social benefits and transfers
Social transfers in kind of goods and services produced by market producers (D.632)
Government individual final consumption expenditure (P.31)
Government output
= intermediate consumption
+ compensation of employees
+ taxes less subsidies
+ consumption of fixed capital
+ net operating surplus
Other government non-market output (P.132)
(total non-market output less P.131)
Social transfers in kind – general government and NPISHs’ non-market production
(D.631)
Other output of government not attributed to individual beneficiaries
Government collective final consumption expenditure (P.32)
Sales (GFS revenue item)
Payments for government non-market output (P.131)
Any sector: either final consumption or capital formation
Government market output (P.11)
Government output for own final use (P.12)
Part of government gross fixed capital formation (P.51)
Note: The highlighted areas show, for each column, the components of final consumption.
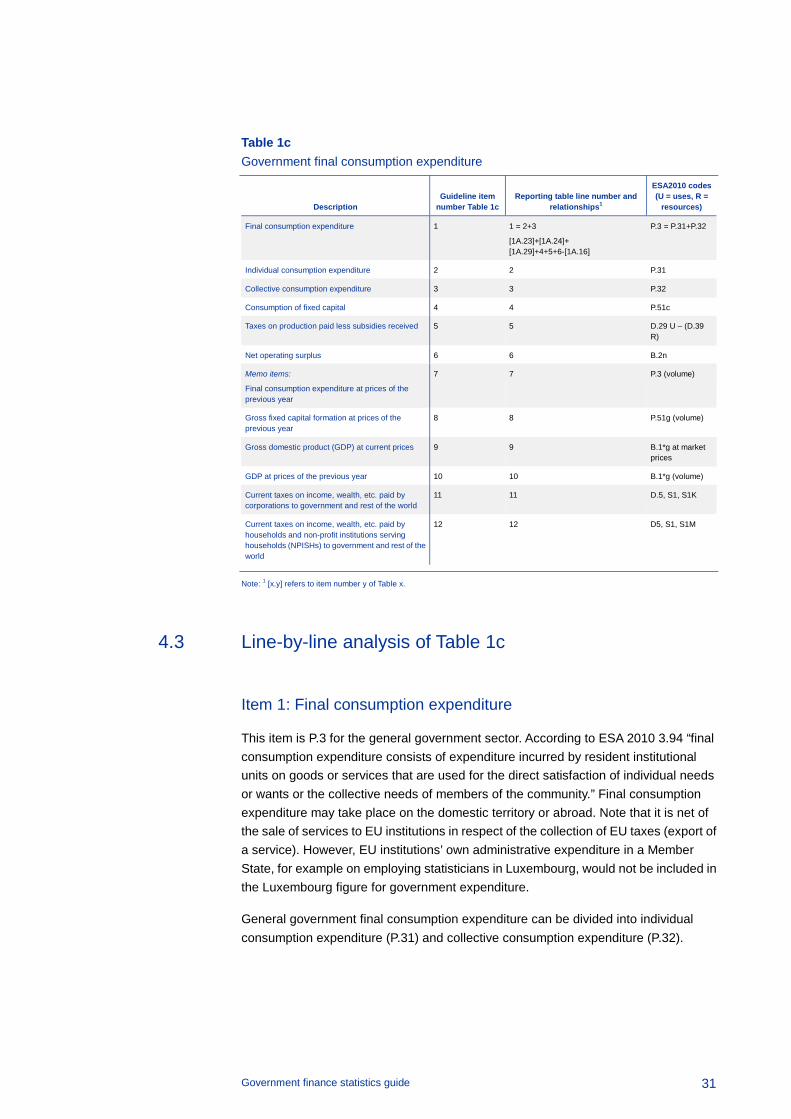
4.2 Table 1c: Format and contents
The table below shows the format and content of Reporting Table 1c used by the ECB to collect data from NCBs. The table shows the item numbers used in Table 1c of the GFS Guideline and the corresponding line numbers in the reporting table, the relationships between the line and item numbers, and the ESA 2010 codes.
Government finance statistics guide
31
Table 1c Government final consumption expenditure
Description Guideline item
number Table 1c Reporting table line number and
relationships1
ESA2010 codes (U = uses, R =
resources)
Final consumption expenditure 1 1 = 2+3
[1A.23]+[1A.24]+ [1A.29]+4+5+6-[1A.16]
P.3 = P.31+P.32
Individual consumption expenditure 2 2 P.31
Collective consumption expenditure 3 3 P.32
Consumption of fixed capital 4 4 P.51c
Taxes on production paid less subsidies received 5 5 D.29 U – (D.39 R)
Net operating surplus 6 6 B.2n
Memo items:
Final consumption expenditure at prices of the previous year
7 7 P.3 (volume)
Gross fixed capital formation at prices of the previous year
8 8 P.51g (volume)
Gross domestic product (GDP) at current prices 9 9 B.1*g at market prices
GDP at prices of the previous year 10 10 B.1*g (volume)
Current taxes on income, wealth, etc. paid by corporations to government and rest of the world
11 11 D.5, S1, S1K
Current taxes on income, wealth, etc. paid by households and non-profit institutions serving households (NPISHs) to government and rest of the world
12 12 D5, S1, S1M
Note: 1 [x.y] refers to item number y of Table x.
4.3 Line-by-line analysis of Table 1c
Item 1: Final consumption expenditure
This item is P.3 for the general government sector. According to ESA 2010 3.94 “final consumption expenditure consists of expenditure incurred by resident institutional units on goods or services that are used for the direct satisfaction of individual needs or wants or the collective needs of members of the community.” Final consumption expenditure may take place on the domestic territory or abroad. Note that it is net of the sale of services to EU institutions in respect of the collection of EU taxes (export of a service). However, EU institutions’ own administrative expenditure in a Member State, for example on employing statisticians in Luxembourg, would not be included in the Luxembourg figure for government expenditure.
General government final consumption expenditure can be divided into individual consumption expenditure (P.31) and collective consumption expenditure (P.32).

Government finance statistics guide
32
Item 2: Individual consumption expenditure
Individual consumption expenditure (P.31) has the following characteristics:
• it satisfies the individual needs of household members;
• it is possible to observe the consumption of goods and services by household members;
• households agree to consume the goods and services and take action to make it possible, for example by attending a school;
• consumption of goods and services by one household means that less goods and services are available for other households.
Item 3: Collective consumption expenditure
Collective consumption expenditure (P.32) has the following characteristics:
• the consumption by government is used to provide services simultaneously to all members of the community;
• households’ use of such services is usually passive and does not require their express agreement or active participation;
• provision of the service to one household does not reduce the services available to others.
Item 4: Consumption of fixed capital
This item consists of the capital consumption (P.51c, ESA 2010 3.139-3.145) of market and non-market establishments of units classified under general government. For national accounts, it is usually computed through a perpetual inventory model rather than being collected directly from government units. Depreciation in business accounts is a similar concept to capital consumption but may follow different valuation rules.
Item 5: Taxes on production paid minus subsidies received
This item is general government payments of other taxes on production (D.29 uses) less receipts of other subsidies on production (D.39 resources). These components are included in Table 1a, items 30a and 17a. Subsidies are shown with a positive sign (national accounts follow a different sign convention: subsidies receivable are a negative use and subsidies payable are a negative resource). Note that taxes or subsidies on products (D.21 and D.31 respectively) cannot be consolidated because there is no counterpart sector in the ESA for such transactions; the relevant amounts are not recognised separately as expenditure and revenue (respectively) and are
Government finance statistics guide
33
instead included in, or excluded from, the value of the intermediate consumption or of the sales. In other words, other taxes on production include, for example, taxes on the use of buildings and cars, but not taxes included in the prices of products, which are already counted in intermediate consumption. Other subsidies on production include, for example, subsidies on labour, but not subsidies included in prices paid, which are already counted in intermediate consumption.
Item 6: Net operating surplus
This item is B.2n of the general government sector. It analyses the extent to which government market output covers intermediate consumption, compensation of employees, other taxes less subsidies on production, and the consumption of fixed capital necessary for market output. For government non-market output, the net operating surplus is by definition equal to zero.
Item 7: Government final consumption expenditure at prices of the previous year (memo item)
This item is government final consumption (item 1) in chain-linked volumes at prices of the previous year (reference year 2010). In order to measure the volume growth of government final consumption, the effect of price changes must be eliminated. To achieve this, most EU countries in the past used a fixed weighting structure that was updated every five years. However, if fixed weights are used for a prolonged period, they become less relevant over time. To achieve more accurate and internationally comparable volume growth figures, NSIs and Eurostat have, since 2005, introduced weights that are updated annually, using values at the prices of the previous year, in line with EU legislation. The results obtained using these weights are subsequently (chain-)linked.
Item 8: Gross fixed capital formation at prices of the previous year (memo item)
This item is government investment (item 33 of Table 1a) in chain-linked volumes at prices of the previous year (reference year 2010). In order to measure the volume growth of government investment, the effect of price changes must be eliminated. To achieve this, most EU countries in the past used a fixed weighting structure that was updated every five years. However, if fixed weights are used for a prolonged period, they become less relevant over time. To achieve more accurate and internationally comparable volume growth figures, NSIs and Eurostat have, since 2005, introduced weights that are updated annually, using values at the prices of the previous year, in line with EU legislation. The results obtained using these weights are subsequently (chain-)linked.
Government finance statistics guide
34
Item 9: Gross domestic product (GDP) at current prices (memo item)
Gross domestic product at market prices is defined in ESA 2010 8.89.
Item 10: GDP at prices of the previous year (memo item)
This item is GDP in chain-linked volumes at prices of the previous year (reference year 2010). In order to measure the volume growth of GDP, the effect of price changes must be eliminated. To achieve this, most EU countries in the past used a fixed weighting structure that was updated every five years. However, if fixed weights are used for a prolonged period, they become less relevant over time. To achieve more accurate and internationally comparable volume growth figures, NSIs and Eurostat have, since 2005, introduced weights that are updated annually, using values at the prices of the previous year, in line with EU legislation. The results obtained using these weights are subsequently (chain-)linked.
Item 11: Current taxes on income, wealth, etc. paid by corporations to government and rest of the world (memo item)
Current taxes on income, wealth etc. (D.5) payable by corporations include the part of taxes payable by units in the financial or non-financial corporation sectors in national accounts. Typically, these are taxes on company profits, including taxes on capital gains as well as on operating income. The item includes taxes payable both to government units and to units resident in other economies.
Item 12: Current taxes on income, wealth, etc. paid by households and non-profit institutions serving households (NPISHs) to government and rest of the world (memo item)
Current taxes on income, wealth, etc. (D.5) payable by households include taxes payable by households and NPISHs. These include, for example, taxes on income and capital gains, motor vehicle licence fees paid by households and capital gains taxes. The item includes taxes payable both to government units and to units resident in other economies.
Government finance statistics guide
35
5 Government deficit-debt adjustment (Table 2a)
5.1 Introduction to Table 2a
Table 2a shows how the general government deficit is financed and considers the relationship between the deficit and Maastricht debt. The ability to reconcile the change in general government debt with the deficit, through the analysis in Table 2a, provides an important data quality check. Since government deficit and debt are the primary focus of fiscal surveillance, it is important to understand why they diverge.
Although government deficit and debt are closely interrelated concepts, the change in the debt level in any given year can be larger or smaller than the deficit. The difference between the change in debt and the deficit is known as the “deficit-debt adjustment” (DDA) or, more generally, as the “stock-flow adjustment”. The DDA measures the part of the change in debt that is not accounted for by the deficit/surplus. As long as the components of the DDA are sound, the difference between the change in debt and the deficit is explained and does not raise concerns over data quality. A positive DDA means that the increase in debt exceeds the deficit or that the reduction in debt is lower than the surplus. A negative DDA means that the decrease in debt is smaller than the surplus or that the debt has decreased despite a deficit.
The DDA can be divided into three main pillars:
A. transactions in main financial assets;
B. valuation effects and other changes in the volume of debt;
C. time of recording and other differences.
Pillar A – transactions in main financial assets comprises transactions in deposits held by the ministry of finance or other governmental units at the central bank and other monetary financial institutions (MFIs); the net acquisition of non-government securities by social security funds (which build up assets to cover future pension entitlements); and the net acquisition of equity held by government in public corporations. With a given deficit, government financial investment increases the borrowing requirement (the amount that government needs to borrow to finance its activities) and hence also government debt; conversely, a reduction in financial assets (as a result of privatisations, for instance), tends to reduce the borrowing requirement and debt, while leaving the deficit unchanged.
Pillar B – valuation effects and other changes in the volume of debt can be divided in three groups:
• the market-to-face-value adjustment;
• foreign exchange holding gains and losses;
Government finance statistics guide
36
• other changes in the volume of debt.
General government debt is recorded at face value (and therefore so too is the change in debt), whereas financial transactions in the ESA 2010 are recorded at market value including accrued interest. To compensate for this difference in valuation, the DDA includes the market-to-face-value adjustment. The adjustment applies only to transactions – that is, to new borrowings and repayment or buying-in of debt at prices which differ from nominal value (issuances and redemptions below or above par).
The MGDD and the ESA 2010 recommend recording accrued unpaid interest under the instrument that generates the interest rather than under other accounts receivable/payable (although the ESA 2010 also allows recording in other accounts receivable/payable (F.8); see ESA 2010, 5.242). The accrual recording of interest means that the interest accruing in each period is recorded in D.41 and, if not paid, is viewed as being reinvested in the instrument generating the interest through an entry in the financial account. At the time of the actual cash payment of the interest, a reimbursement of the instrument is recorded.
In the ESA 2010, the accruing of interest does not create difficulties in reconciling transactions and balance sheet stocks because, assuming no other events, the market value of the instrument increases in step with the accruing of interest (D.41). No entry in the revaluation account (K.7) is necessary. By contrast, because of the face valuation of debt, a reconciliation item is needed in GFS Table 2a, as debt does not increase in step with the accruing of interest (except for index-linked bonds). The reconciliation adjustment is entered in the item “Market-to-face-value adjustment”.
General government debt denominated in foreign currency, unless covered using financial derivative contract, is valued at current exchange rates on the balance sheet date. The level of outstanding debt may therefore vary without any counterpart in the general government deficit or any transactions in foreign currency debt in the intervening period. Foreign exchange holding gains and losses are therefore another element of the DDA. General government debt covered with financial derivative contract is valued at the exchange rate in the financial derivative contract, which does not vary during the life of the contract. However, as transactions in financial derivatives are also part of DDA, realised exchange rate effects at time of redemption of the underlying of hedged debt instruments have also to be recorded in DDA.
Changes in the debt related to reclassification are recorded in other changes in the volume of debt. These include changes in the statistical classification of units from the government to a non-government sector (or the reverse). Following the reclassification, liabilities of these units cease to be government debt, with no counterpart in the general government deficit. This item may also conceal statistical discrepancies between financial flows and the stock of debt.
Pillar C – time of recording and other differences can be divided into the following categories:
• time of recording differences;
Government finance statistics guide
37
• transactions in monetary gold and insurance, pension and standardised guarantee schemes;
• transactions in financial derivatives and employee stock options;
• statistical discrepancies between financial and non-financial accounts.
Time of recording differences refer to the difference between the recording of expenditure and the related payments and that of revenue and the related cash flow to government. For instance, expenditure is recorded upon delivery of supplies and hence increases the deficit, although a government may delay the actual cash payment (in line with contractual settlement clauses). The financial claim on the government owing to this timing difference is recorded under other accounts payable (F.8). Other accounts payable are not part of government debt for the purposes of the EDP. Hence, delayed payment by government for supplies does not affect the borrowing requirement or the debt, but delivery does increase the deficit. Similarly, taxes are recorded as reducing the deficit at the time that they are assessed, even though payment may take place somewhat later, unless a time-adjusted cash method is used. This delay is recorded under other accounts receivable (F.8) in the government accounts. The delayed payment of taxes to government does not reduce the borrowing requirement, although the taxes themselves decrease the deficit. Other time of recording differences may arise on account of the early or late reimbursement by the EU of the funds that the government spends on its behalf.
For the euro area countries, government transactions in monetary gold and special drawing rights (SDRs) (F.1) are by definition zero after adoption of the euro, since euro area governments are not allowed to hold monetary gold and SDRs. Of the non-euro area governments, only the UK government holds monetary gold. The net acquisition of and net incurrence of liabilities in insurance, pension and standardised guarantee schemes (F.6) (items 11 and 21 respectively, Table 2a) for the government sector are probably negligible in terms of GDP.
Transactions in financial derivatives and employee stock options (F.7) may either generate cash, thereby reducing the government borrowing requirement, or oblige the government to borrow more when settlements under swaps turn out to be negative.
The statistical discrepancy is the difference between the deficit as measured by the non-financial accounts (B.9) and the deficit as measured by the financial accounts (B.9f). When the government has a deficit in the non-financial accounts, the equivalent amount should be displayed in the general government financial accounts: the increase in liabilities should exceed the increase in financial assets by the amount of the deficit. Because different sources of data are used to measure the transactions resulting in the two balances, B.9 and B.9f are not always equal.
Figure 1 shows the two ways in which Table 2a reconciles the deficit and the change in debt. Item numbers refer to Table 2a.

Government finance statistics guide
38
Figure 1 Reconciliation of the government deficit and debt
Source: ECB calculations.
5.2 Table 2a: Format and contents
The table below shows the content and format of Reporting Table 2a used by the ECB to collect data from the NCBs. It shows the item numbers used in Table 2a of the GFS Guideline and the corresponding line numbers in Reporting Table 2a, the relationships between the line and item numbers, and the ESA 2010 codes. Some items in the data request are not included in the GFS Guideline (item 16a, item 16b, item 27a, item 27b, item 36a, item 36b, item 37a, item 37b, item 37c, item 40 and item 41). The rest of this chapter contains a description of each of the items listed in Table 2a. The transactions are presented net across instruments. For example, in transactions in financial assets, the proceeds from the liquidation of a long-term bond are deducted from the purchase of long-term bonds upon receipt.
Deficit/surplus (minus B.9)- item 1.A.1)
Transactions in main financial assets =transactions in currency and deposits (item 5)
+ transactions in debt securities (item 6)+ transactions in loans (item 7 + item 8)+ transactions in equity and investment fund shares or units (item 9)
Time of recording and other differencesnet transactions in other accounts receivable/payable (item 15 - item 27)
+ net transactions in insurance, pension and standardised guarantee schemes (item 13 - item 25)+ net transactions in financial derivatives and employee stock options (item 14 - item 26)+ statistical discrepancy (item 1)
General government borrowing requirement =transactions in currency and deposits (item 19)
+ transactions in debt securities (item 20 + item 21)+ transactions in loans (item 22 + item 23)
Valuation effects and other changes in volume of debt =re valuation effects on debt (item 34)
+ other changes in the volume of debt (item 37)
Change in government debt(item 38)
Deficit-debt adjustment(DDA)
Pillar A
Pillar B
Pillar C
+
=
+
+
=
=
+
+
+
+
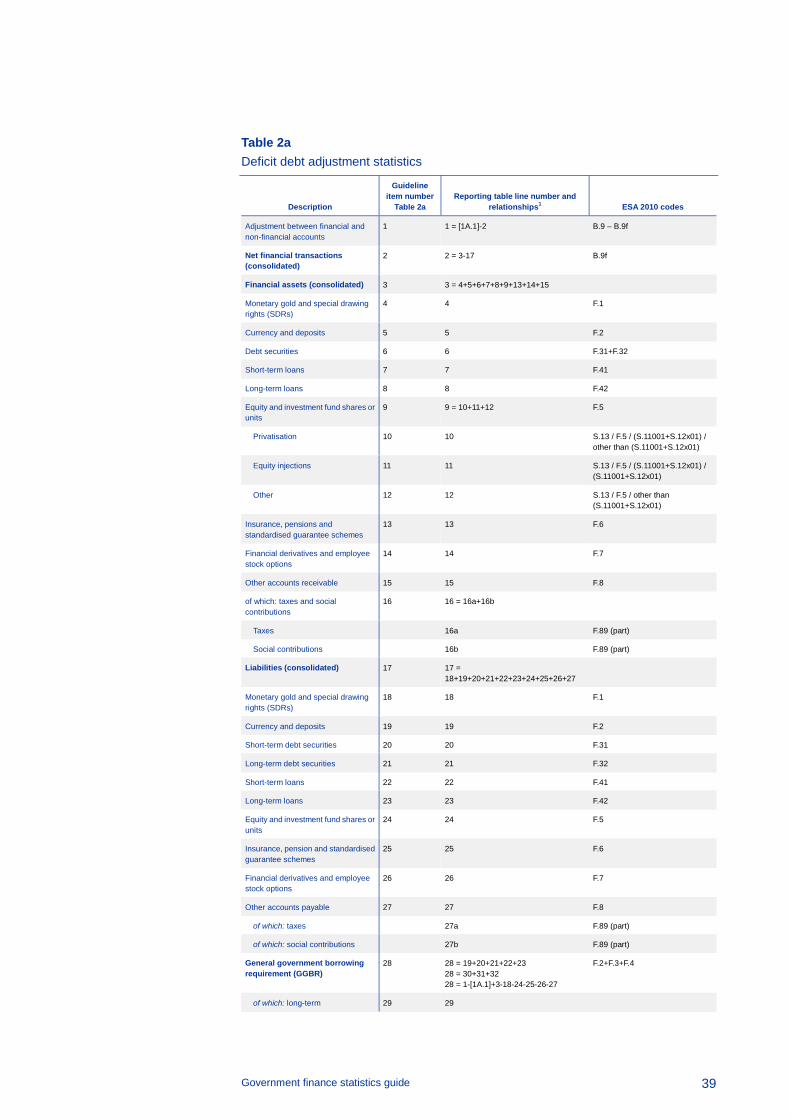
Government finance statistics guide
39
Table 2a Deficit debt adjustment statistics
Description
Guideline item number
Table 2a Reporting table line number and
relationships1 ESA 2010 codes
Adjustment between financial and non-financial accounts
1 1 = [1A.1]-2 B.9 – B.9f
Net financial transactions (consolidated)
2 2 = 3-17 B.9f
Financial assets (consolidated) 3 3 = 4+5+6+7+8+9+13+14+15
Monetary gold and special drawing rights (SDRs)
4 4 F.1
Currency and deposits 5 5 F.2
Debt securities 6 6 F.31+F.32
Short-term loans 7 7 F.41
Long-term loans 8 8 F.42
Equity and investment fund shares or units
9 9 = 10+11+12 F.5
Privatisation 10 10 S.13 / F.5 / (S.11001+S.12x01) / other than (S.11001+S.12x01)
Equity injections 11 11 S.13 / F.5 / (S.11001+S.12x01) / (S.11001+S.12x01)
Other 12 12 S.13 / F.5 / other than (S.11001+S.12x01)
Insurance, pensions and standardised guarantee schemes
13 13 F.6
Financial derivatives and employee stock options
14 14 F.7
Other accounts receivable 15 15 F.8
of which: taxes and social contributions
16 16 = 16a+16b
Taxes 16a F.89 (part)
Social contributions 16b F.89 (part)
Liabilities (consolidated) 17 17 = 18+19+20+21+22+23+24+25+26+27
Monetary gold and special drawing rights (SDRs)
18 18 F.1
Currency and deposits 19 19 F.2
Short-term debt securities 20 20 F.31
Long-term debt securities 21 21 F.32
Short-term loans 22 22 F.41
Long-term loans 23 23 F.42
Equity and investment fund shares or units
24 24 F.5
Insurance, pension and standardised guarantee schemes
25 25 F.6
Financial derivatives and employee stock options
26 26 F.7
Other accounts payable 27 27 F.8
of which: taxes 27a F.89 (part)
of which: social contributions 27b F.89 (part)
General government borrowing requirement (GGBR)
28 28 = 19+20+21+22+23 28 = 30+31+32 28 = 1-[1A.1]+3-18-24-25-26-27
F.2+F.3+F.4
of which: long-term 29 29

Government finance statistics guide
40
Description
Guideline item number
Table 2a Reporting table line number and
relationships1 ESA 2010 codes
Denominated in national currency 30 30
Denominated in currencies of euro area Member States
31 31
Denominated in other currencies 32 32
Other flows in government debt 33 33 = 34+37 K
Revaluation effects 34 34 = 35+36
Appreciation and depreciation of foreign currency debt
35 35 K.7 (part) in liabilities AF.2+AF.3+AF.4
Other revaluation effects (differences compared with face value)
36 36 = 38-28-35-37 36 = 36a+36b
Issuance and redemption above and below nominal value
36a
Difference between interest accrued and paid
36b
Other changes in volume of debt 37 37 = 37a+37b+37c K1+K.2+K.3+K.4+K.5+K.6 in liabilities: AF.2+AF.3+AF.4
Changes in sector classification - 37a
Other volume changes in financial liabilities
- 37b
Other statistical discrepancy - 37c
Change in government debt 38 38 = 28+33 38 = 1-[1A.1]+3-18-24-25-26-27+33
38 = ([3A.1] in year T) – ([3A.1] in year T-1)
Memorandum items
Net incurrence of loans granted by central bank
39 39 F.4 / S.121
Net transactions in other accounts receivable/payable related to the EU budget
- 40 F.89
Difference between deliveries and corresponding cash payment related to military equipment expenditure
- 41 F.89
Note: 1 [x,y] refers to item number y of Table x.
5.3 Line-by-line analysis of Table 2a
Item 1: Adjustment between financial and non-financial accounts
Item 1 equals B.9, the balance of the capital account, less B.9f, the balance of the financial account. In the ESA 2010, there is no conceptual reason for the difference. The adjustment arises only from measurement discrepancies in the sources and timing of information used to compile the accounts.13 It is common for the non-financial and financial accounts to be compiled independently and using different accounting or statistical documents as source data. The adjustment between financial 13 Note that the adjustment does not derive from the difference between cash movements and national
accounts recording on an accrual basis. Differences in timing between accrual and payment require an entry under other accounts receivable/payable (F.8) or, in the case of accrued interest, under the relevant financial instrument. They should have no impact on the statistical adjustment.

Government finance statistics guide
41
and non-financial accounts is also known as the “statistical discrepancy”. The size of the adjustment is a significant indicator of the quality of national accounts. Its size in the final version of the accounts must be reasonably small if the data are to be considered useful.
Item 2: Net transactions in financial assets and liabilities
This is net lending (+)/net borrowing (-) as recorded in the financial account (B.9f). It is the balance of the transactions in financial assets (item 3) and transactions in liabilities (item 17).
Item 3: Transactions in financial assets (consolidated)
These are transactions in the main financial assets, i.e. currency and deposits (F.2), loans (F.4), debt securities (F.3), and equity and investment fund shares or units (F.5), as well as transactions in other financial assets, i.e. monetary gold and SDRs (F.1), insurance, pension and standardised guarantee schemes (F.6), financial derivatives and employee stock options (F.7), and other accounts receivable (F.8). All transactions in financial assets are recorded on a consolidated basis.
Breakdown by instrument
Item 4: Transactions in monetary gold and special drawing rights
This category covers monetary gold (F.11) and special drawing rights (SDRs) (F.12). It includes government holdings of monetary gold and SDRs in countries where the government, rather than the NCB, controls the foreign exchange reserves.
Item 5: Transactions in currency and deposits
Currency and deposits correspond to F.2 in the ESA 2010 (assets of S.13). They comprise deposits of the ministry of finance and deposits held by other units of general government with the central bank (S.121), with other monetary financial institutions (S.122), and perhaps with other sectors, both domestic and abroad. All types of deposit are included in this item: transferable deposits, savings deposits and time deposits, whether in domestic or foreign currency.
This item also includes repurchase agreements (repos) where government units lend cash against securities and, in the process, acquire a claim on an MFI (see ESA 2010 5.86.f).

Government finance statistics guide
42
Reverse repos (where government units deliver securities against the receipt of cash) do not appear under item 5 as negative deposits. They are recorded as financial liabilities of government in the form of loans (F.4).
Deposits of government units with other government units (for example local government deposits with the ministry of finance) are consolidated. They do not appear under item 5 of Table 2a, but rather under item 3 of Table 3b, which shows the consolidating elements of the government debt.
Accrued interest is recorded under the relevant instrument (rather than under accounts receivable/payable, F.8) and so contributes to the transactions in such assets.
Item 6: Transactions in debt securities
Debt securities are the ESA 2010 category F.3, covering the net acquisition of non-government bills, notes and bonds. F.3 includes certificates of deposit and commercial paper, which are money market instruments issued by financial institutions and non-financial corporations respectively. This item includes non-government bonds, notes and bills purchased primarily by social security funds, which in some countries have large holdings of such instruments. Transactions are recorded at market value, rather than at face value, and include accrued interest.
Item 7: Transactions in short-term loans
This item includes loans with an initial maturity of one year or less (F.41) that are transactions in government assets. Examples of loans are loans to public corporations (which are classified as S.11 or S.12, and not as S.13), loans disbursed in the context of social housing schemes, and loans to students. This item includes imputed transactions related to accruing interest.
Item 8: Transactions in long-term loans
This item includes loans with an initial maturity of over one year (F.42) that are transactions in government assets. Transactions are recorded at market value, rather than at face value, and include accrued interest.
Item 9: Transactions in equity and investment fund shares or units
Equity and investment fund shares or units are recorded in the ESA 2010 category F.5 (government assets). In Table 2a, this category is broken down into privatisations, equity injections, and other transactions in equity and investment fund shares or units.
Government finance statistics guide
43
Item 10: Privatisations
Privatisation, although not an ESA 2010 category, is an important criterion for classification in the context of public finance analysis. Privatisation is the sale to third parties of government-owned shares in public corporations, such that the government cedes control of the corporation to the private sector. ESA 2010 2.35-2.38 defines control as “the ability to determine general corporate policy, for example by choosing appropriate directors if necessary,” involving the ownership of “more than half the voting shares or otherwise controlling more than half the shareholders’ voting power” (or sometimes having the power through legislation to determine corporate policy or to appoint the directors). During the early 1990s, privatisation, particularly of public utility businesses, became a normal practice of governments in western European countries. The former communist countries of eastern Europe also privatised many state-owned enterprises around the time of their accession to the EU.
Not all sales of shares in public corporations are to be recorded as privatisations. For example, the sale by a social security fund of a share initially bought by it for investment purposes would not be a privatisation.
Borderline cases might create specific difficulties. A sale of a large participation, such as a 20% stake in a business, even when not reducing control to less than 50% of the voting power, would nevertheless be seen as a privatisation if it meets one or more of the following conditions:
• it is the first step of a pre-announced sale of more than 50% of the shares in the unit;
• it involves a clear lessening of control;
• it is part of a clear agenda to reduce government holdings.
Similarly, a public corporation to be privatised could first be sold by the government to another public company (holding company). Although not formally leading to a change of control, this could be the first step in a pre-existing privatisation plan. Conversely, a sale of a 20% block in a corporation, viewed as portfolio management by a government unit acting primarily as an investment manager, would not be recorded under privatisation, but rather under item 12 (other transactions in equity and investment shares or units).
Positive amounts for this item may occur in the following two cases.
• Nationalisation: when government purchases a corporation from the private sector, thus acquiring ownership of a private sector business. This is normally an act of policy rather than an act of investment management.
• Debt assumptions and debt cancellations in the context of a privatisation (ESA 2010 4.165.f). In this case, the imputed payments from government to a corporation, which are recorded as the counterparts to the imputed transactions in loans, are classified as acquisitions of equity (F.5) (and not as capital transfers, the usual treatment for debt cancellation and assumption). For the GFS,
Government finance statistics guide
44
however, the transaction is recorded under privatisation rather than under equity injections since the intention is to increase the selling price when the unit is privatised. The net privatisation proceeds recorded in F.5 should therefore reflect the proceeds net of the cost of debt assumptions and cancellations.
Privatisation proceeds are to be recorded before the deduction of commission and fees paid to investment banks acting on the government’s behalf as agents in the privatisation. The commission and fees paid are treated as purchases of services and are recorded as government expenditure in intermediate consumption (P.2).
All privatisation proceeds are recorded under this item, and not solely those proceeds that by law, regulation or accounting device are allocated to reducing government debt. In practice, it is not usually possible to identify the subsequent uses of privatisation proceeds.
Item 11: Equity injections
An equity injection occurs when government acquires extra equity (F.5) in a public corporation through an injection of cash or in kind (a transfer of a building, for instance).
Negative equity injections (equity withdrawal) would be recorded in the event of a lump-sum payment by a public corporation to government, when the transaction is viewed as a financial transaction and is not a loan repayment. Lump-sum payments to government that greatly exceed a public corporation’s recent profit would, in general, be classified as an equity withdrawal.
Amounts received by government that relate to “indirect privatisations” (see Chapter III of the MGDD for more details) are generally recorded as negative equity injections. Indirect privatisation occurs where a public corporation, usually a holding company, sells assets (mainly shares and other equity) and gives the proceeds to government. According to the MGDD, the transfer of the proceeds is to be considered a withdrawal of equity from the holding company.
Item 12: Other transactions in equity and investment fund shares or units
This covers other transactions in equity and investment fund shares or units, i.e. all other transactions that are recorded in F.5 (government assets). It includes the following.
• Investment portfolio transactions, such as purchases by social security funds of shares for short-term money management or long-term investment purposes.
• Equity investments in international financial organisations where it is clear that these are genuine financial investments with an economic return expected. When no economic return is expected, the payments should be recorded as gifts
Government finance statistics guide
45
(D.74 or D.92 in the non-financial accounts) even if government has a theoretical legal entitlement to a return of its funds. It is the economic substance that matters, not the legal form.
Although well defined in principle, this category may, in practice, be compiled as a residual since total F.5 transactions will be available in the ESA 2010 financial accounts, while privatisation or equity injections may be estimated from different sources using slightly different methodologies.
Item 13: Transactions in insurance, pension and standardised guarantee schemes
This covers transactions in insurance, pension and standardised guarantee schemes, i.e. all transactions that are recorded in F.6 (government assets). It includes:
• non-life insurance and technical reserves;
• life insurance and annuity entitlements;
• pension entitlements;
• claims of pension funds on pension managers;
• entitlements to non-pension benefits;
• provisions for calls under standardised guarantees.
Item 14: Transactions in financial derivatives and employee stock options
This item records the net acquisition of assets in the form of financial derivatives contracts (F.7). It includes inflows and outflows related to purchases and sales of and settlements under options and warrants, margin calls on futures, and interim and termination payments related to all types of derivatives. However, deposits or initial margins placed or repaid are not recorded here, but under deposits (F.2) (or under loans (F.4) if government has received a margin payment which represents a liability of government (see ESA 2010 5.136.d)).
The market value of swaps is usually zero at inception. Changes in the market value, for example owing to changes in interest rates in the case of interest swaps, are recorded as other flows in national accounts, increasing/decreasing the balance sheet position AF.71 with no transaction recorded. Settlements of financial derivatives are recorded in the financial accounts as a transaction in F.71 with a counterpart entry in currency and deposits (F.2).
Government finance statistics guide
46
Item 15: Transactions in other accounts receivable
This category covers other accounts receivable (F.8) by the government.
Item 16: Of which taxes and social contributions
These are other accounts receivable (F.8) in respect of taxes and social contributions. Such amounts are the difference between accrual recording of taxes and social contributions and their cash recording. Chapter II.2 of the MGDD explains the accrual recording of taxes and social contributions.
Item 16a: Of which taxes
These are other accounts receivable (F.8) in respect of taxes. Such amounts are the difference between the accrual recording of taxes and their cash recording.
Item 16b: Of which social contributions
These are other accounts receivable (F.8) in respect of social contributions. Such amounts are the difference between the accrual recording of social contributions and their cash recording.
Item 17: Transactions in liabilities
These are transactions in the ESA 2010 liabilities, i.e. monetary gold (F.11) and special drawing rights (F.12), currency and deposits (F.2), debt securities (F.3), loans (F.4), insurance, pension and standardised guarantee schemes (F.6), financial derivatives and employee stock options (F.7), and other accounts payable, including trade credits (F.8). All transactions in liabilities are recorded on a consolidated basis.
Breakdown by instrument
Item 18: Transactions in monetary gold and special drawing rights
This category covers monetary gold (F.11) and special drawing rights (F.12).
Item 19: Transactions in currency and deposits
This item includes transactions in government liabilities classified in the ESA 2010 as currency (F.21), transferable deposits (F.22) or other deposits (F.29).
Government finance statistics guide
47
Currency (F.21) comprises coins in circulation issued by government. In certain countries, coins are issued by the central bank rather than government and are therefore a central bank liability, as are banknotes. General government is unlikely to have liabilities in the form of transferable deposits (F.22), except perhaps to other government units (which would not be included here because of the consolidation of financial transactions), or to public sector entities classified as being outside the general government sector.
Other deposits (F.29) include time deposits, savings deposits, savings books and savings certificates that are liabilities of government. For example, some ministries of finance operate savings accounts for households, perhaps managed by the postal service or other public agencies. This category would also include specific arrangements for banks or public corporations depositing cash with government.
The borderline between deposits and loans is explained in ESA 2010 5.117-5.119. The distinction between transactions in loans and transactions in deposits is that a debtor offers a standardised non-negotiable contract in the case of a loan but not in the case of a deposit (ESA 2010 5.117). The ECB’s MFI balance sheet regulation14 follows a different convention, under which no MFI liability is a “loan” and no MFI asset is a “deposit”.
This item also includes short-term liabilities in the form of repos.
Since these transactions are derived from the ESA 2010 financial accounts, accruing interest on such deposits is normally recorded in the instrument category. Some compilers, however, include accrued interest in other accounts payable (AF.8), not in the underlying instrument category. The stock of government debt increases only when the interest is actually credited to the account. The transactions and change in debt are reconciled through an entry in item 32 (other valuation effects).
Item 20: Transactions in short-term debt securities
Item 20 covers government liabilities in the ESA 2010 category F.31. It includes bills, short-term notes and bonds sold with an initial maturity of one year or less. Other securities are classified under long-term securities (F.32) in item 21.
Securities with an initial maturity of exactly one year are classified here. Some flexibility is necessary for issues of fungible securities when the initial maturity of the last tranche is, exceptionally, one year or less while the initial maturity of each of the first tranches was longer. In that case, all tranches would be classified as long-term instruments since it would not be possible to distinguish in the market between the tranches and still record transactions, other flows and stocks consistently.
This item excludes instruments – even those called “bills” or “Treasury bills” – when their initial maturity exceeds one year. The ESA 2010 defines short-term as an initial maturity of one year or less (ESA 2010 5.A1.14). 14 Regulation (EU) No 1071/2013 of the ECB of 24 September 2013 concerning the balance sheet of the
monetary financial institutions sector (ECB/2013/33).

Government finance statistics guide
48
Item 21: Transactions in long-term debt securities
Long-term securities (F.32) include bonds, notes and Treasury bills with an initial maturity of more than one year. They might be issued by the ministry of finance, other central government agencies, state governments, local governments or social security funds. This item may include liabilities legally structured as bonds, even where in practice there may be a single creditor, such as the central bank or a special fund established for a public purpose. The category includes securities with reimbursement options (callable by either the debtor or the creditor) of more than one year at the time of issue.
Long-term securities include conventional bonds issued at par, zero coupon bonds, deep-discounted bonds, bonds with capitalised interest, floating rate bonds, stripped bonds (coupon and principal split into numerous zero coupon bonds), fungible bonds issued in tranches, certain types of lottery bonds (although not non-tradable varieties, typically held by households, which are more appropriately classified as deposits), indexed bonds, foreign exchange bonds, and callable or puttable bonds.
Instruments with an initial maturity of one year are not classified here, but rather as short-term bonds. As noted above, some flexibility is needed in the case of fungible bonds issued close to maturity. Securities held by other government units are excluded in consolidation.
The redemption price of some securities is linked to an index such as a consumer price index. Chapter II.4 of the MGDD identifies two ways to account for the change in value of an indexed instrument.
• When the index is a consumer price index, the uplift in the value of the principal is generally small and not highly volatile. It is deemed to be interest (D.41) and is shown as being reinvested in the instrument in the financial account. It affects the GGBR if the security is a Maastricht debt instrument. There are no volume (K.5) or valuation (K.7) effects in other flows. The increase in the index is regarded as the property income received from the instrument over its life.
• When the index is volatile, the MGDD allows recording as other volume changes (K.5) and not as interest (D.41). This approach could cover liabilities indexed to stock prices, gold, other commodities or a currency. There is no certainty that the index will be higher when the bond is redeemed, and the change is not regarded as part of the yield. Such instruments are often a way of hedging or taking on risks.
This means that the change in Maastricht debt in the form of indexed instruments will sometimes appear in the GGBR (item 28) and sometimes in other volume changes (item 37).
Government finance statistics guide
49
Item 22: Transactions in short-term loans
Item 22, transactions in short-term loans, is the ESA 2010 category F.41. It covers short-term borrowing by government units in the form of loans with an initial maturity of one year or less.
The category includes imputed transactions in loans in respect of debt assumption. These are recorded in the ESA 2010 financial accounts as the counterpart to the capital transfer recorded to reflect the implicit gift that government makes to a non-government unit when it agrees to assume the unit’s debt owed to a third party. ESA 2010 4.165.f gives a more detailed explanation of this, including cases where the non-government unit becomes insolvent or where debt assumption is associated with privatisation. The category also includes imputed loans in respect of finance leases, lump-sum payments received at the inception of swaps, and securitisations. Guarantees are regarded as contingent liabilities and are not recorded in the system (ESA 2010 7.31) except when they are traded.
Item 23: Transactions in long-term loans
This item records transactions in long-term loans (F.42), i.e. loans with initial maturity over one year. The category includes imputed transactions in loans in respect of debt assumption. These are recorded in the ESA 2010 financial accounts as the counterpart to the capital transfer recorded to reflect the implicit gift that government makes to a non-government unit when it agrees to assume the unit’s debt owed to a third party. ESA 2010 4.165.f gives a more detailed explanation of this, including cases where the non-government unit becomes insolvent or where debt assumption is associated with privatisation. The category also includes imputed loans in respect of finance leases, lump-sum payments received at the inception of swaps, and securitisations. Guarantees are regarded as contingent liabilities and are not recorded in the system (ESA 2010 7.31) except when they are traded.
Item 24: Transactions in equity and investment fund shares or units
This item records the net incurrence of liabilities of equity and investment fund shares or units (F.5). See also item 9.
Item 25: Transactions in insurance, pension and standardised guarantee schemes
This item records the net incurrence of liabilities in the form of insurance, pension and standardised guarantees (F.6). See also item 13.
Government finance statistics guide
50
Item 26: Transactions in financial derivatives
This item records the net incurrence of liabilities in the form of financial derivatives contracts (F.7). See also item 14.
Item 27: Transactions in other accounts payable
This category covers transactions related to other accounts payable (F.8) by government.
Item 27a: Of which taxes
These are other accounts payable (F.8) in respect of taxes. They can arise due to payments by taxpayers exceeding their tax liability.
Item 27b: Of which social contributions
These are other accounts payable (F.8) in respect of social contributions.
Item 28: General government borrowing requirement
The general government borrowing requirement (GGBR) covers all financial transactions in Maastricht debt instruments (currency and deposits (F.2), debt securities (F.3) and loans (F.4)). It is sometimes called “transactions in government debt”, “Maastricht debt transactions” or “transactions in Maastricht debt”.
The GGBR is shown consolidated. For example, if central government issues bonds that are all bought by social security funds, there is no impact on the GGBR, but it is reported under item 10 of Table 3b, which shows the consolidating elements of the government debt.
Item 29: Transactions in long-term debt instruments
This item includes all Maastricht debt instruments with an initial maturity of more than one year. Initial maturity is the maturity at issue, which is also frequently referred to as “original maturity”.
Breakdown by currency
The breakdown of transactions by currency indicates the exposure of government to changes in exchange rates. The compilation of transactions is often based on
Government finance statistics guide
51
estimates of the stock of debt in a given currency and the change in value of that currency over an accounting period.
Item 30: Denominated in national currency
For Member States in the euro area, this means the euro or the national currency it replaced. For EU Member States outside the euro area, it means the (national) currency that is legal tender.
Item 31: Denominated in currencies of euro area member states
This item covers instruments denominated in currencies of countries participating in the euro area before they joined the euro area, other than the relevant domestic currency. It includes the European Currency Unit (ECU). For EU Member States that have not yet adopted the euro, this item includes euro-denominated debt.
Item 32: Denominated in other currencies
This item covers instruments denominated in currencies of EU Member States outside the euro area, such as the British pound sterling, and also those in (for example) US dollars, Swiss francs and Japanese yen.
Item 33: Other flows in government debt
Items 33 to 37 account for the difference between transactions in government debt instruments, the GGBR and the change in government debt. Item 33 “Other flows” is simply the sum of revaluation effects (item 34) and other changes in volume (item 37).
Item 34: Revaluation effects
The change in government debt (item 38) is recorded at face value, while the GGBR (item 28) is recorded at market value. Item 34 shows the difference between the change in debt and the GGBR due to the different valuation methods. It is the sum of two valuation effects: appreciation and depreciation of foreign currency debt (item 35) and other revaluation effects (differences compared with face value) (item 36).
Item 35: Appreciation and depreciation of foreign currency debt
This is the increase (+) or decrease (-) in the face value of government debt instruments due to exchange rate movements, recorded in the ESA 2010 financial accounts within the other flow category for nominal holding gains/losses (K.7). Item 35

Government finance statistics guide
52
encompasses effects of exchange rate movements on debt denominated in foreign currency. General government debt covered forward is valued at the exchange rate in the forward contract, which does not vary during the life of the contract. As transactions in financial derivatives are also part of DDA, realised exchange rate effects at time of redemption of the underlying of hedged debt instruments have also to be recorded under item 35. Possible effects of swaps used for hedging foreign currency debt have to be recorded within transactions in financial derivatives (items 14 and 26). “Net increase” in item 35 means the increases less the decreases in value due to such movements and changes.
These foreign exchange holding gains and losses can apply to all instruments: deposits, loans, short-term securities and long-term securities. They are recorded on a consolidated basis and so do not include changes in the value of government liabilities denominated in foreign currency that are held as assets by other units in the general government sector.
When sources of information are primarily balance sheets (stocks), estimates of the holding gains and losses must be made on the basis of the currency composition of the debt. The difference between a) transactions in foreign currency debt at face value (comprising new borrowings and repayment or buying-in of foreign currency debt), converted into national currency at the exchange rate at the time of transaction, and b) the change in stocks at face value in foreign currency terms but converted into national currency at the exchange rate on the balance sheet date, after allowing for any reclassification or other exceptional volume changes, would be recorded as holding gains or losses.
Item 36: Other revaluation effects (differences compared with face value)
This item is the “market-to-face-value adjustment” which was introduced in paragraph 5.10. It recognises that transactions in government debt instruments recorded at market value in the ESA 2010 financial accounts will differ from transactions in government debt recorded at face value. To reconcile their movements, it is necessary that both transactions and other flows are at face value.
For example, a bond issued at a discount will increase the ESA 2010 balance sheet debt by the discounted price (since that is the market price), but will increase government debt by the full face value.
The accounting identity is as follows: item 36 = face value less market price.
The ESA 2010 balance sheet is also affected by the addition of accrued unpaid interest in the financial account. Transactions in government debt instruments include amounts for accruing interest, both for interest accruing in D.41 in the non-financial account with its counterpart in the relevant financial instrument, and as regards transactions in financial instruments whose traded prices take account of accrued interest. The stock of government debt is valued at face value and so does not include accrued interest (except for certain indexed instruments).
Government finance statistics guide
53
Item 36 records the adjustments needed for consolidated financial transactions.
The market-to-face-value adjustment
= Gross issuance: face value less market value (A)
- Gross redemption: face value less market value (B)
+ Accrual of interest: interest payable less interest paid15 (C)
+ Exchange of debt (D)
A. Gross issuance
Premium and discounts at issue
For example, a zero coupon bond with a redemption price of 100 (face value) issued at 80 is recorded (at issue) as follows:
Transaction in bonds +80
Change in Maastricht debt +100
Market-to-face-value adjustment +20
The treatment is similar for all bonds not issued at face value. Other bonds include deep-discounted bonds, bonds with small discounts and bonds issued at a premium. In the last case, a negative entry is shown in item 36a.
Accrued interest sold at issue
Accrued interest is sometimes sold at issue, e.g. in the case of fungible tranches of linear bonds. Since accrued interest is not part of Maastricht debt, an adjustment is necessary. For example, suppose a 6% coupon bond with a face value of 100 pays a coupon on 1 September and is issued on 1 June at par. The selling price will be 104.5, of which 4.5 represents accrued interest.
Transaction in bonds +104.5
Change in Maastricht debt +100.0
Market-to-face-value adjustment -4.5
Now consider a bond, denominated in dollars, with a face value of 100. Suppose the euro falls from 1 dollar = 0.65 euro at the beginning of the year to 1 dollar = 0.70 euro at the end of the year. The face value of the bond (in euro) rises from 65 to 70, an increase of 5. This increase will be recorded in item 34. Any interest accrued during the year that remains unpaid is recorded in the financial accounts as a reinvestment in the bond and is therefore part of the borrowing requirement (item 28). Since the
15 Except for index-linked instruments, where index linking is reflected in EDP debt.
Government finance statistics guide
54
nominal value of the bond does not include interest accrued but not yet paid, the amount of accrued but unpaid interest will appear with a minus sign in item 36.
B. Gross redemption
In general, redemption at maturity is, by definition, at face value, so no adjustment is needed. For early redemption, item 36 equals the price paid to redeem the securities (the financial transaction recorded under the ESA 2010) less the face value.
C. Accrual of interest
Because interest (D.41) is recorded on an accrual basis, premia and discounts are amortised over time, giving rise to transactions in the instrument that do not affect the face value of the outstanding debt. Consider a 10-year bond, with a coupon paying 6% interest, issued at 90 and with a face value of 100. Assume linear amortisation of the discount of 10. Each year, the following would be recorded:
Interest accrued (D.41) +7
(coupon plus amortisation)
Interest actually paid +6
Transaction in bonds (F.3) +1
Change in Maastricht debt 0
Market-to-face-value adjustment -1
D. Exchange of debt
An exchange of debt is the early redemption of old debt and the issuance of new debt of equivalent market value. The face value of the old and new debts may differ. This difference is not entered in the general borrowing requirement (which is recorded at market value), but it does change Maastricht debt. The recording of early redemption and new issuance would be as described above.
Note that governments can reduce their debt by redeeming low coupon bonds and issuing high coupon bonds of the same market value. However, for instruments close to maturity, this would mean higher interest payments, which would increase the deficit in the following years.
Item 36a: Issuance and redemption above and below nominal value
This item is the part of the “market-to-face-value adjustment”, which occurs when the issuance or redemption of debt at the market price differs from the face value. This
Government finance statistics guide
55
information may be calculated by adding the issuances above (-)/below (+) nominal value and the redemptions of debt above (+)/below (-) nominal value. This also includes the exchange of debt as explained above. This information is also available through the EDP notification.
Item 36b: Difference between interest accrued and paid
This item includes the adjustment for difference between the accrued and paid interest, as explained in item 36 (C Accrual of interest).
Item 37: Other changes in volume
This item concerns all changes in stocks of government debt instruments that do not relate to (consolidated) transactions or (consolidated) valuation effects. The changes correspond to the ESA 2010 categories K1, K2, K.3, K.4, K.5 and K.6, at nominal value. In practice, this item is mostly a result of the reclassification of units between sectors (and, more rarely, of the reclassification of instruments). Statistical discrepancies may also contribute to this item.
Item 37a: Changes in sector classification
This item is the part of other changes in volume of debt that is due to the reclassification of units between general government and other sectors. This information is also available through the EDP notification.
Item 37b: Other volume changes in financial liabilities
This item is the part of other changes in the volume of debt that is due to the other volume changes in financial liabilities comprising Maastricht debt, for example, reclassification of instruments from Maastricht debt to non-Maastricht debt instruments (or vice versa). This information is also available through the EDP notification.
Item 37c: Other statistical discrepancy
This is the statistical discrepancy that may occur due to different compilation practices and data sources between the financial accounts transactions and other flows in government debt, and the government debt. In theory, the sum of transactions in government debt (GGBR, item 28) and the other flows and the change in government debt should be aligned, but in practice a statistical discrepancy between these items may exist and should be reported in this item.

Government finance statistics guide
56
Item 38: Change in government debt
This equals the sum of transactions in government debt (GGBR, item 28) and of other flows in government debt (item 33). It also equals the government debt at the end of the year less the government debt at the end of the previous year, as recorded in GFS Tables 3a and 3b.
Any unexplained residual arising from the two methods of measuring the change in debt should be added to item 37 (other volume changes) to ensure consistency. The amount added should also be reported in item 37c (other statistical discrepancy).
Item 39: Net incurrence of loans granted by central bank (memo item)
This item comprises loans (F.4) provided by the NCB to government (usually the ministry of finance). Since the Maastricht Treaty rules prohibit financing of government by the NCBs, the value of the transactions is expected to be zero (no incurrence of new liabilities) or negative (redemption of existing loans). Chapter 6 describes the prohibition on monetary financing in more detail.
Item 40: Net transactions in other accounts receivable/payable related to the EU budget (memo item)
This category is equal to transactions in other accounts receivable (F.8) related to the EU budget less transactions in other accounts payable (F.8) related to the EU budget. It includes advances received from the EU budget less prepayments made by government on behalf of the EU budget. Information on these transactions can be found in the EDP-related questionnaire that Member States are required to report to Eurostat along with the EDP notification tables.
Item 41: Difference between deliveries and corresponding cash payments related to military equipment expenditure (memo item)
Military equipment expenditure is to be recorded as expenditure in national accounts at the time of delivery. The corresponding cash payments may be made at a different point in time (either before or after delivery of the equipment). If cash payments occur before the delivery, the sign of this series is positive, as government acquires a financial asset (other accounts receivable, F.8). Conversely, if the delivery pre-dates the payment, the sign of this series is negative, as the government incurs a liability (recorded under other accounts payable, F.8). Information on the delivery of military equipment and the corresponding cash payments can be found in the EDP-related questionnaire that Member States are required to report to Eurostat along with the EDP notification tables.
Government finance statistics guide
57
6 Government Debt (Table 3a)
6.1 Introduction to Table 3a
This table analyses the stock of Maastricht debt, which is defined as “general government gross debt” in Council Regulation (EC) No 479/2009 as amended by Commission Regulation (EU) No 220/2014. Table 3a shows the stock of debt at a point in time (year-end).
Article 1(5) of Council Regulation (EC) No 479/2009 as amended by Commission Regulation (EU) No 220/2014 defines general government gross debt as:
• the consolidated liabilities of the ESA 2010 general government sector (S.13);
• in the ESA 2010 categories: currency and deposits (AF.2), debt securities (AF.3) and loans (AF.4);
• measured at “nominal value”, further defined in the regulation as “face value” – this means, in particular, that government debt is not affected by changes in market interest rates and excludes unpaid accrued interest.
Note that Maastricht debt excludes two types of government liability, as follows.
• Certain ESA 2010 liabilities:
• financial derivatives and employee stock options (AF.7);
• insurance, pension and standardised guarantee schemes (AF.6);
• equity and investment fund shares/units (AF.5);
• other accounts payable (AF.8) including trade credits and advances (AF.81) originating from delayed payments to providers of goods and services;
• accrued interest, whether recorded with the underlying instrument or recorded in other accounts payable (AF.8).
• Liabilities recognised by some accounting systems but not by the ESA 2010:
• provisions for expected but uncertain future payments arising from past events;
• contingent liabilities, including pension entitlements under unfunded government defined-benefit employer pension schemes or social security pension funds;
• liabilities of entities regarded as government subsidiaries in other accounting systems but outside the general government sector in national accounts.
Government finance statistics guide
58
Instruments can be measured in several ways. The following approaches are discussed below: market value, transaction value, issue value, redemption value, nominal value and face value.
• The market value corresponds to the quoted price of instruments, representing the price a purchaser or a seller can expect to pay or receive at that time (excluding commission, fees and taxes (ESA 2010 7.38)). It includes accrued interest. It is the value used in the ESA 2010 balance sheets (ESA 2010 7.33-7.35). This value is relevant both for the debtor, as the opportunity cost for the issuer to settle its debt early by buying it back on the secondary market, and for the creditor.
• The transaction value is usually close to the market value at the time of the transaction. Nevertheless, the ESA 2010 indicates that the transaction value is a concept different from the market value (ESA 2010 5.21) because the former is defined as the value corresponding to the actual payment for each transaction, which may differ slightly from the quoted value at the same time (and differ more substantially from a “closing price”). When the difference between the agreed contract price and the market price is large enough to suggest that the transaction has a “gift” component, the transaction is recorded at market value and the difference versus the contract price recorded as a transfer (D.7 or D.9) (see ESA 2010 5.21).
• The issue value is the transaction value at the time of issue of a financial instrument and represents nominal value plus the issue premium (ESA 2010 5.155). The issue value is relevant for the debtor since it represents the amount of funds received initially from the incurrence of the liability.
• The redemption value corresponds to the final payment on an instrument when it is repaid at maturity. Redemption value is relevant both for the debtor, as the amount repayable at the end of the contract, and for the creditor.
• The nominal value reflects the sum of funds originally advanced, plus any subsequent advances, less any repayments, plus any accrued interest. Nominal value is not the same as face value (ESA 2010 7.39). It refers to a value that does not change in response to changes in market yields.
• Face value is defined as the undiscounted amount of principal to be repaid at maturity (IMF Public Sector Debt Statistics: Guide for Compilers and Users – 2013 2.121).
Article 1(5) of Council Regulation (EC) No 479/2009 as amended by Commission Regulation (EU) No 220/2014 stipulates that government debt is to be recorded at nominal value. For the purposes of this regulation, nominal value is defined as the face value, i.e. the (contractually agreed) amount that the government will repay to creditors at maturity. The regulation develops or modifies the notion of nominal (or face) value in three specific cases:
Government finance statistics guide
59
• for an indexed-linked liability, the nominal value “corresponds to its face value adjusted by the index-related change in the value of the principal accrued to the end of the year”;
• foreign currency-denominated liabilities are converted into domestic currency at the market exchange rate at the end of each accounting period;
• liabilities denominated in foreign (or even domestic) currency that are exchanged or swapped for another currency, including the domestic currency, are converted at the rate stipulated in the contract, and not at the current market exchange rate.
Chapter VIII.2 of the MGDD gives additional guidance for specific instruments, as below:
• deposits (including non-negotiable notes): the nominal (or face) value includes interest accrued when it is actually credited to the holder (as a result of a legal obligation) and is available for withdrawal;
• index-linked bonds: the nominal value corresponds to the face value adjusted by the index-related capital uplift accrued to the end of the year;
• zero coupon bonds: the nominal value is the redemption value (face value);
• bonds with capitalised interest: the nominal value is the issue value (face value, but not the same as redemption value);
• stripped bonds: stripping of coupon and principal does not modify the nominal value of the original bond;
• financial leasing: debt includes the imputed loan equal to the gross fixed capital formation under financial leasing;
• if a securitisation cannot be recorded as a sale of assets in national accounts, debt includes the amount paid by the special-purpose vehicle (SPV) to government at inception of the securitisation;
• debt includes the market value for the off-market (non-zero value) swaps at the inception of swap contracts.16
The treatment of securities lending and repos is clarified in the ESA 2010 (5.86.f, 5.126-5.133). Securities delivered in the context of repurchase agreements (“repos”) or securities lending remain on the balance sheet of the assignor and do not appear on the balance sheet of the assignee. This is because repos are treated as a form of collateralised lending. They are recorded as transactions in loans or deposits and not in the underlying instrument, which is regarded as being retained by the assignor. Thus, in the breakdown by holder of government debt in GFS, securities received under a repo (or a securities lending transaction) and subsequently sold outright by the assignee are recorded as a negative holding of securities by the assignee. Since both the assignor and the final purchaser record the security in their balance sheets,
16 Guidance on swaps is available in the government finance statistics section of the Eurostat website.

Government finance statistics guide
60
total holdings of the asset do not change. The treatment specified in the ESA 2010 for securities lending and repos is applicable only where the original seller of the asset has a firm commitment to repurchasing it under conditions agreed at the outset. GFS follow the same rules.
6.2 Table 3a: Format and contents
The table below presents the format and contents of Reporting Table 3a used by the ECB to collect GFS data from NCBs. The table shows the item numbers used in Table 3a of the GFS Guideline, which are the same as the line numbers in Reporting Table 3a, and the relationship with the ESA 2010 codes. The table shows several breakdowns of Maastricht debt: by instrument, holder, currency and maturity.
Table 3a Government debt
Description Guideline item number Table 3a
Reporting table line number and relationships ESA 2010 codes
Government debt (consolidated) 1 1 = 2+3+4+5+6 1 = 7+12 1 = 13+14+15 1 = 16+17 1 = 19+20+22
F.2+ F.31+F32+ F.41+F.42
Currency and deposits 2 2 F.2
Short-term securities 3 3 F.31
Long-term securities 4 4 F.32
Short-term loans 5 5 F.41
Long-term loans 6 6 F.42
Held by residents of the Member State
7 7 = 8+9+10+11
Central bank 8 8 S.121
Other monetary financial institutions
9 9 S.122+S.123
Other financial institutions 10 10 S.124+S.125+S.126+S.127+S.128+S.129
Other residents 11 11 S.11+S.14+S.15
Held by non-residents of the Member State
12 12= 1-7 12 = 12a+12b
S.2
held by non-residents inside the euro area
12a
held by non-residents outside the euro area
12b
Denominated in national currency 13 13
Denominated in currencies of euro area Member States
14 14
Denominated in other currencies 15 15
Short-term debt 16 16
Long-term debt 17 17
of which: variable interest rate 18 18
Residual maturity up to one year 19 19
Residual maturity over one and up to five years
20 20
of which: variable interest rate 21 21
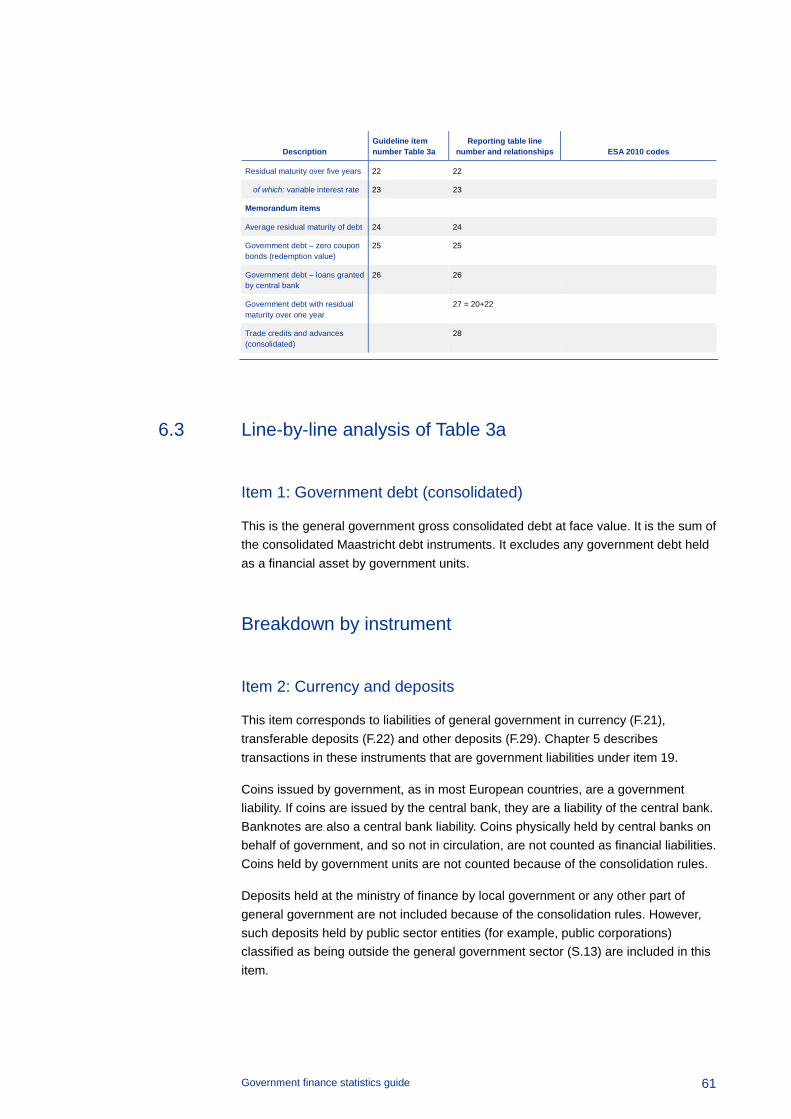
Government finance statistics guide
61
Description Guideline item number Table 3a
Reporting table line number and relationships ESA 2010 codes
Residual maturity over five years 22 22
of which: variable interest rate 23 23
Memorandum items
Average residual maturity of debt 24 24
Government debt – zero coupon bonds (redemption value)
25 25
Government debt – loans granted by central bank
26 26
Government debt with residual maturity over one year
27 = 20+22
Trade credits and advances (consolidated)
28
6.3 Line-by-line analysis of Table 3a
Item 1: Government debt (consolidated)
This is the general government gross consolidated debt at face value. It is the sum of the consolidated Maastricht debt instruments. It excludes any government debt held as a financial asset by government units.
Breakdown by instrument
Item 2: Currency and deposits
This item corresponds to liabilities of general government in currency (F.21), transferable deposits (F.22) and other deposits (F.29). Chapter 5 describes transactions in these instruments that are government liabilities under item 19.
Coins issued by government, as in most European countries, are a government liability. If coins are issued by the central bank, they are a liability of the central bank. Banknotes are also a central bank liability. Coins physically held by central banks on behalf of government, and so not in circulation, are not counted as financial liabilities. Coins held by government units are not counted because of the consolidation rules.
Deposits held at the ministry of finance by local government or any other part of general government are not included because of the consolidation rules. However, such deposits held by public sector entities (for example, public corporations) classified as being outside the general government sector (S.13) are included in this item.
Government finance statistics guide
62
This category may include liabilities in the form of repos. It excludes accrued interest because of the face value rule, but capitalised interest on deposits is recorded when it is added to the account.
Item 3: Short-term debt securities
This item includes bills and other short-term notes and bonds with an initial maturity of up to one year, issued predominantly by the ministry of finance (classified as F.31 in the ESA 2010). More information on short-term debt securities is given in Chapter 5 under item 20.
The face value rule means that instruments that pay no coupon interest, such as zero coupon bonds, are recorded in Maastricht debt at the full redemption value. Coupon instruments are also measured at redemption value. Accrued interest is excluded from Maastricht debt.
Securities held by other government units are excluded under the consolidation rules.
Item 4: Long-term debt securities
The long-term debt securities (F.32) item covers all types of securities with an initial maturity of more than one year. More information on long-term debt securities is given in Chapter 5 under item 21.
The redemption price of some securities is linked to an index such as a consumer price index. Council Regulation (EC) 479/2009 as amended by Commission Regulation (EU) No 220/2014 states that the face value of an index-linked liability includes the index-related change in the value of the principal accrued to the end of the year. Any change in the value of the principal (assumed to be the basis for determination of the coupons) will be reflected in Maastricht debt.
Item 5: Short-term loans
This item covers loans to government with initial maturity of one year or less classified as F.41 in national accounts. All units can grant loans, such as MFIs, other financial intermediaries, non-financial corporations and units resident in other economies. This item includes syndicated loans. Loans granted by other government units are excluded under the consolidation rules. Overdraft facilities with MFIs (other than the central bank) are recorded here when used. Unused facilities are not recorded. More information on short-term loans is given in Chapter 5 under item 22.
Government finance statistics guide
63
Item 6: Long-term loans
This item is similar to item 5 (short-term loans) but with an initial maturity over one year, classified as F.42 in national accounts. More information on long-term loans is given in Chapter 5 under item 23.
Imputed loans in respect of finance leases and other imputed loans are included in Maastricht debt in this item. Also included in this item are lump-sum payments received at the inception of swap contracts, along with proceeds from securitisations that are not deemed a sale in national accounts.
Breakdown by holder/creditor
Item 7: Held by residents of the Member State
This is the debt held by residents of the Member State. It is calculated as the sum of the debt held by the central bank (item 8), the debt held by other monetary financial institutions (item 9), the debt held by other financial institutions (item 10) and the debt held by other residents (item 11).
Item 8: Central bank
This item covers all government debt instruments held by the NCB (ESA 2010 category S.121). It includes:
• loans, including short-term loans, and overdraft facilities established before 1994 or before adoption of the euro;
• notional claims under other deposits (AF.29) in relation to the issuance of coins by the general government;
• deposits made by the NCB at the ministry of finance before 1994;
• government debt securities (acquired in the secondary market) held by the NCB.
This item excludes other financial links, sometimes substantial, between central banks and government, such as other accounts payable/receivable (F.8) arising when the central bank processes banking orders made daily by the ministry of finance.
It excludes government securities received by NCBs in connection with repos extended by central banks to MFIs – often as part of the refinancing operations of the Eurosystem.17
17 The Eurosystem comprises the ECB and the NCBs of those countries that have adopted the euro.
Government finance statistics guide
64
Item 9: Other monetary financial institutions
This item covers all elements of Maastricht debt held by domestic MFIs other than the NCB. Other MFIs form the ESA 2010 sub-sectors S.122 and S.123 (ESA 2010 2.68). They include both public (government-owned or controlled) and private institutions. The ECB defines other MFIs as resident credit institutions as defined in Community law, or other resident financial institutions whose business is to receive deposits and/or close substitutes for deposits from entities other than MFIs and, for their own account (at least in economic terms), to grant credits and/or make investments in securities.18
Government liabilities held by other MFIs may include:
• deposits at the ministry of finance;
• short-term and long-term loans extended to government units;
• debt securities issued by government units and held by MFIs other than NCBs.
This item excludes:
• debt securities issued by governments of other countries and held by domestic MFIs, and any loans made by them to, or deposits placed by them with, governments abroad;
• government debt securities borrowed or received (by banks) in the context of repos or bond lending/borrowing operations;
• liabilities in the form of derivatives, e.g. options issued by government and bought by MFIs, or swaps with negative market value (i.e. liabilities of government);
• other instruments not included in Maastricht debt.
Item 10: Other financial institutions
The other (non-monetary) financial institutions category includes the following.
• Non-money market fund (MMF) investment funds (S.124).
• Other financial intermediaries, except insurance corporations and pension funds (S.125).
• Financial auxiliaries (S.126) providing services closely linked to financial intermediation without undertaking financial intermediation themselves. They include supervisory bodies, fund managers and brokers. In contrast to financial intermediaries, auxiliaries do not place themselves at risk by acquiring financial
18 Regulation (EU) No 1071/2013 of the ECB of 24 September 2013 concerning the balance sheet of the
monetary financial institutions sector (ECB/2013/33).
Government finance statistics guide
65
assets and incurring liabilities on their own account (ESA 2010 2.33) and so, by definition, are not likely to hold significant government liabilities.
• Captive financial institutions and money lenders (S.127). These are units not engaged in either financial intermediation or the provision of financial auxiliary services, most of whose assets or liabilities are not transacted on open markets.
• Insurance corporations (S.128) and pension funds (S.129). These often have large holdings of government bonds. In some cases, these institutions are required by law to hold a minimum proportion of their portfolios as government bonds.
Item 11: Other residents
Other residents comprise:
• non-financial corporations (S.11);
• households (S.14);
• NPISHs (S.15).
Other residents exclude general government (S.13) because government debt is presented on a consolidated basis.
In addition to their claims on general government in the form of coins, households in some countries hold significant deposits (AF.2) directly with the ministry of finance or the post office (the latter being rerouted in national accounts to represent a liability of central government). These deposits are mostly of a monetary nature and are reported accordingly to the ECB in the context of monetary statistics. The larger part of government debt held by households is usually in the form of non-tradable government bonds or other instruments issued in small denominations and sometimes specifically targeted at the general public. Households may also have substantial holdings of marketable government debt. Holdings held indirectly via investment funds or other vehicles are not recorded here, but rather as holdings of the financial intermediaries concerned.
Non-financial corporations and NPISHs may also hold liquid assets in the form of government securities and hold claims on general government in the form of deposits (AF.2) or loans (AF.4). Their claims on general government in the form of other accounts receivable (AF.8) are excluded from Maastricht debt, as are any claims on general government in the form of financial derivatives (AF.7).
Item 12: Held by non-residents of the member state
This item covers the general government debt held by units of the rest of the world (S.2 in the ESA 2010). In the ESA 2010, this is split between “the European Union” (S.21) and “non-member countries and international organisations” (S.22). The former
Government finance statistics guide
66
is divided further into “the Member States of the EU” (S.211) and “the institutions of the EU” (S.212). There is no “euro area Member States” category in the ESA 2010.
This item covers:
• holdings of securities by non-residents;
• loans granted by non-resident institutions (such as euro-syndicated credit), including loans granted by the European Investment Bank (EIB);
• deposits by non-resident institutions (mostly non-resident banks) with government, particularly ministries of finance – this includes deposits by other governments, notably of other EU Member States in the context of extended cooperation between ministries of finance on the timing of treasury bill issuance;
• Debt issued by the domestic government and held by a government unit of another country, possibly both in the euro area, e.g. German Bund holdings of a Finnish social security fund.
Item 12a: Held by non-residents inside the euro area
This item covers the general government debt held by units of the rest of the world (S.2 in the ESA 2010) that are residents of the euro area.
Item 12b: Held by non-residents outside the euro area
This item covers the general government debt held by units of the rest of the world (S.2 in the ESA 2010) that are not residents of the euro area.
Items 12a and 12b are not part of the Guideline, but are voluntary items in Reporting Table 3a.
Currency denomination
Item 13: Denominated in national currency
This includes all elements of Maastricht debt denominated in the currency that is the legal tender of the Member State concerned in the year to which the data refer. This would be the euro for a euro area country, either from the time of the establishment of the euro area or from the time the Member State adopted the euro.
This item includes liabilities denominated in foreign currency and exchanged through contractual agreement into the national currency. The amount recorded is the face value expressed in foreign currency converted at the rate agreed in the contract.
Government finance statistics guide
67
It excludes liabilities denominated in national currency but subsequently exchanged through contractual agreement into a foreign currency. In that case, the liability is entered under the relevant item of the breakdown by foreign currency (item 14 or 15).
Item 14: Denominated in currencies of euro area Member States
This comprises Maastricht debt in a foreign currency that was legal tender in a country now part of the euro area. It includes the ECU before 1999.
By convention, this entry is zero for the years after the country in whose currency the debt is denominated joined the euro area, irrespective of whether each liability has been legally or technically converted into euro. For the years after 1999, it includes the euro for countries that were (or still are) outside the euro area in the year to which the figures relate.
This item includes liabilities that have subsequently been exchanged through contractual agreement into a currency of a euro area Member State. This item excludes liabilities in a currency of a euro area Member State that have been exchanged through contractual agreement into a national or other foreign currency.
Item 15: Denominated in other currencies
This item comprises all elements of Maastricht debt denominated in currencies other than the national currency, the euro, the ECU or the currency that was legal tender in a euro area country before it adopted the euro. It includes, for example, debt denominated in pounds sterling (except for the UK, for which it is the national currency), the Swiss franc, the US dollar and the Japanese yen.
The item includes liabilities that have been exchanged through contractual agreement into a currency other than the national currency or a currency of a euro area Member State. This item excludes liabilities that have been exchanged through contractual agreement into the national currency or into a currency of a euro area Member State.
Maturity of Maastricht debt
Initial maturity is the length of life of an instrument when first issued.
Item 16: Short-term debt
This is the total face value of all Maastricht debt instruments with an initial maturity of one year or less. Coins and transferable deposits are recorded under short-term debt because they can be redeemed at any time.

Government finance statistics guide
68
Item 17: Long-term debt
This is the total face value of all Maastricht debt instruments with an initial maturity of over one year.
Issues of tranches – each having one year or less maturity – of a long bond or long note benchmark would technically meet the short-term definition, but it is preferable for practical reasons to assimilate these last tranches to the others in terms of initial maturity. In other words, all future tranches of a bond issued with an initial maturity characteristic of a long-term bond would be classified as long-term, as it is generally not possible to identify the original tranche to which an individual security belongs.
Some deposits, although legally redeemable at short notice, are in practice held long-term with incentives for holders to retain them. By contrast, other time deposits might legally be long-term, but can be redeemed on demand with penalties, or after a period of notice. In these cases, it is a matter of judgement to determine whether long-term or short-term best describes the nature of the instrument.
Item 18: Of which variable interest rate
This item covers the outstanding amount of long-term government debt with a variable interest rate. Variable interest rate instruments are instruments where the coupon rate or underlying principal is linked to an interest rate resulting in a variable nominal coupon payment over the life of the instrument.
Instruments swapped are to be classified according to their post-swap characteristics. For example, a fixed rate instrument swapped into a floating rate instrument would be recorded in the variable rate instruments category.
Breakdown of Maastricht debt by residual maturity
Residual maturity is the duration from the reference period until the contractual redemption date of an instrument. Information on residual maturity gives a measure of the redemptions that general government will have to finance for each relevant period. This gross redemption amount plus the expected borrowing requirement for each period equals the total need for finance expected for that period. This gives a measure of potential liquidity risks and allows interest expenditure to be forecast in the event of changes in market interest rates.
For a conventional bond, the residual maturity corresponds to the redemption maturity, i.e. the date of reimbursement of the principal. Some loans are redeemed gradually over time through regular payments comprising both interest and principal. Ideally these loans should be apportioned to the different residual maturity categories as if they were separate loans.
Instruments with an option for early redemption can be classified according to the earliest date the option can be exercised (by either the issuer or the holder).

Government finance statistics guide
69
Item 19: residual maturity up to one year
This item includes:
• all debt with an initial maturity of one year or less, such as Treasury bills; other paper issued on money markets, such as commercial paper; short-term loans such as overdrafts; deposits of up to one year; and coins;
• debts with an initial maturity of more than one year which are within a year of maturity;
• debts repaid on a regular basis, some of which will fall due for redemption over the coming year.
Item 20: Residual maturity over one year and up to five years
This item includes:
• all debt of initial maturity of more than one year, with over one to five years to redemption;
• for instruments with a redemption maturity of more than five years but which are redeemed on a regular basis, the part to be repaid between more than one and five years from the reporting date.
Item 21: Of which variable interest rate
This item covers government variable rate debt instruments with a residual maturity over one year and up to five years. See also item 18.
Item 22: Residual maturity over five years
This item comprises instruments with a residual maturity over five years. For instruments with a redemption maturity of more than five years but which are redeemed on a regular basis, the part to be repaid more than five years from the reporting date is recorded here.
Item 23: Of which variable interest rate
This item covers government variable rate debt instruments with a residual maturity over five years. See also item 18.
Government finance statistics guide
70
Item 24: Average residual maturity of debt (memo item)
This memorandum item is the average residual maturity (in years) weighted by the face value outstanding, in line with the definition used for the residual maturity breakdown. This measure captures, in a very simple way, various changes occurring in the structure of the debt.
In practice, the average maturity of the component for securities can be compiled precisely, because security-by-security databases are often available. However, more complex calculations and estimations may be required for consolidation where precise data on the maturity of holdings by government units are not available.
The average maturity of coins along with transferable deposits is, by convention, zero. The average maturity of deposits transferable without notice is also, by convention, zero unless there are incentives to retain such deposits – resulting in a longer maturity in practice – when a suitable average maturity should be estimated.
The average maturity of loans takes into account the various dates associated with the regular reimbursement of the loan principal where regular payments of interest and principal are made. The average maturity of overdrafts is, by convention, zero.
Item 25: Government debt – zero coupon bonds (memo item)
This memorandum item is the total face value of all medium/long-term zero coupon instruments. The face value of a zero coupon bond is the redemption value and not its issue value. Zero coupon instruments are instruments where the final payment is the only payment over the whole life of the instrument. By convention, only “zeros” of more than one year are reported here, so the item excludes short-term debt. Zero coupon loans or deposits are also recorded here.
Item 26: Government debt – loans granted by central bank (memo item)
This item covers loans from the NCB to government (generally to the ministry of finance) classified as F.4 (assets of sub-sector S.121) in national accounts. In accordance with the Maastricht Treaty’s prohibition on lending to government by NCBs, all overdraft facilities granted by central banks to their governments in the EU Member States were discontinued by 1994. Some existing loans and overdrafts were converted to medium-term or long-term credit. As such, the content and pattern of this item changed from short-term and volatile to long-term and decreasing (new loans being prohibited) after 1993.
While the Maastricht Treaty also prohibited the purchase by central banks of government bonds on the primary market, it did allow secondary market purchases. The government debt held by NCBs item (item 8 of Table 3a) can therefore differ substantially from loans granted by the NCB item (item 26).
Government finance statistics guide
71
Item 27: Government debt with residual maturity over 1 year (memo item)
This item comprises instruments with a residual maturity over one year. For instruments with a redemption maturity of more than one year but which are redeemed on a regular basis, the part to be repaid more than one year from the reporting date is recorded here.
Item 28: Trade credits and advances (consolidated) (memo item)
Trade credits and advances are defined in ESA 2010 paragraphs 5.233-5.239. These financial claims arise when payment for goods and services is not made at the time they are delivered. In accordance with Regulation (EU) No 220/2014, trade credits are excluded from the definition of government debt. This item is not part of the Guideline, but is a voluntary item in Reporting Table 3a for size and data quality monitoring.
According to a Eurostat decision taken in 2012, when a supplier fully and irrevocably transfers its trade credit claim on government to a financial institution, the trade credit liability of government must be reclassified as a loan if the following two conditions are both met:
• the government unit no longer has any payment obligation to its supplier;
• the financial institution has no direct or indirect recourse against the supplier (transferor of the claim) if the government unit does not meet its payment obligations on time.
Likewise, when a trade credit claim is restructured in such a way that its main features are changed, for instance by adjusting the rate of interest charged to the debtor government unit and/or the timing of the repayment obligations, and if the changes are not restricted to a simple extension of the initial maturity, the original trade credit should be reclassified as a loan.
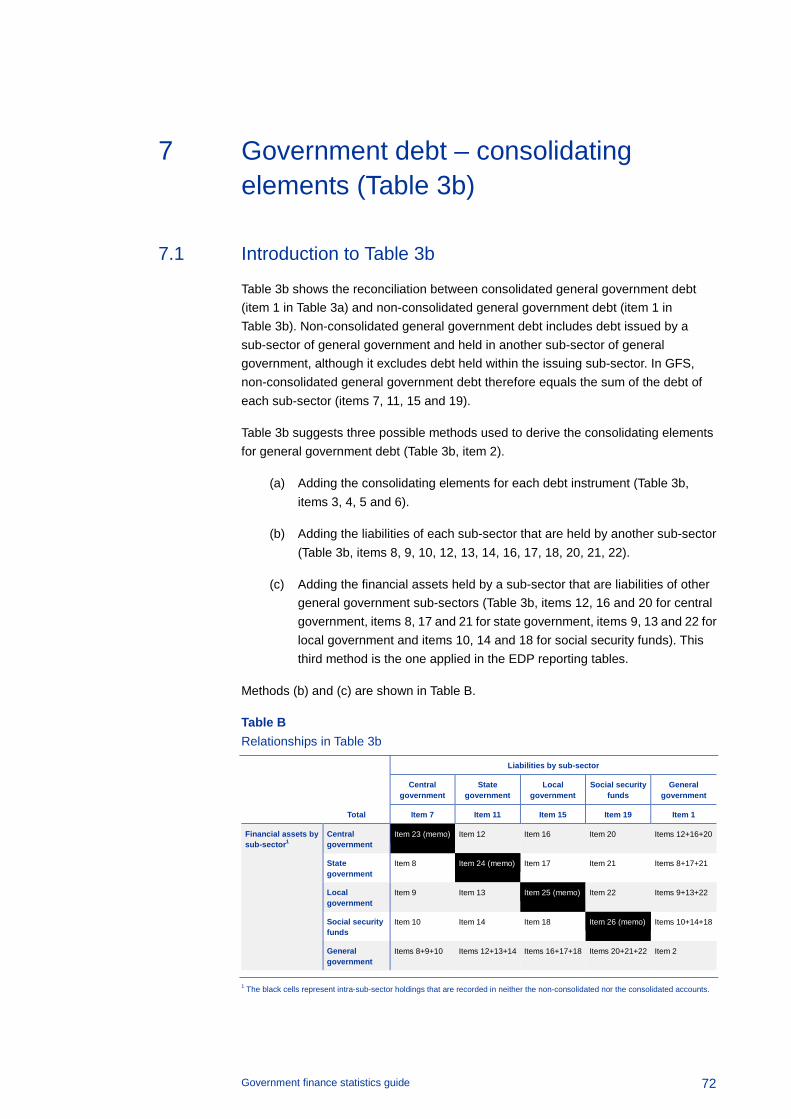
Government finance statistics guide
72
7 Government debt – consolidating elements (Table 3b)
7.1 Introduction to Table 3b
Table 3b shows the reconciliation between consolidated general government debt (item 1 in Table 3a) and non-consolidated general government debt (item 1 in Table 3b). Non-consolidated general government debt includes debt issued by a sub-sector of general government and held in another sub-sector of general government, although it excludes debt held within the issuing sub-sector. In GFS, non-consolidated general government debt therefore equals the sum of the debt of each sub-sector (items 7, 11, 15 and 19).
Table 3b suggests three possible methods used to derive the consolidating elements for general government debt (Table 3b, item 2).
(a) Adding the consolidating elements for each debt instrument (Table 3b, items 3, 4, 5 and 6).
(b) Adding the liabilities of each sub-sector that are held by another sub-sector (Table 3b, items 8, 9, 10, 12, 13, 14, 16, 17, 18, 20, 21, 22).
(c) Adding the financial assets held by a sub-sector that are liabilities of other general government sub-sectors (Table 3b, items 12, 16 and 20 for central government, items 8, 17 and 21 for state government, items 9, 13 and 22 for local government and items 10, 14 and 18 for social security funds). This third method is the one applied in the EDP reporting tables.
Methods (b) and (c) are shown in Table B.
Table B Relationships in Table 3b
Liabilities by sub-sector
Central government
State government
Local government
Social security funds
General government
Total Item 7 Item 11 Item 15 Item 19 Item 1
Financial assets by sub-sector1
Central government
Item 23 (memo) Item 12 Item 16 Item 20 Items 12+16+20
State government
Item 8 Item 24 (memo) Item 17 Item 21 Items 8+17+21
Local government
Item 9 Item 13 Item 25 (memo) Item 22 Items 9+13+22
Social security funds
Item 10 Item 14 Item 18 Item 26 (memo) Items 10+14+18
General government
Items 8+9+10 Items 12+13+14 Items 16+17+18 Items 20+21+22 Item 2
1 The black cells represent intra-sub-sector holdings that are recorded in neither the non-consolidated nor the consolidated accounts.
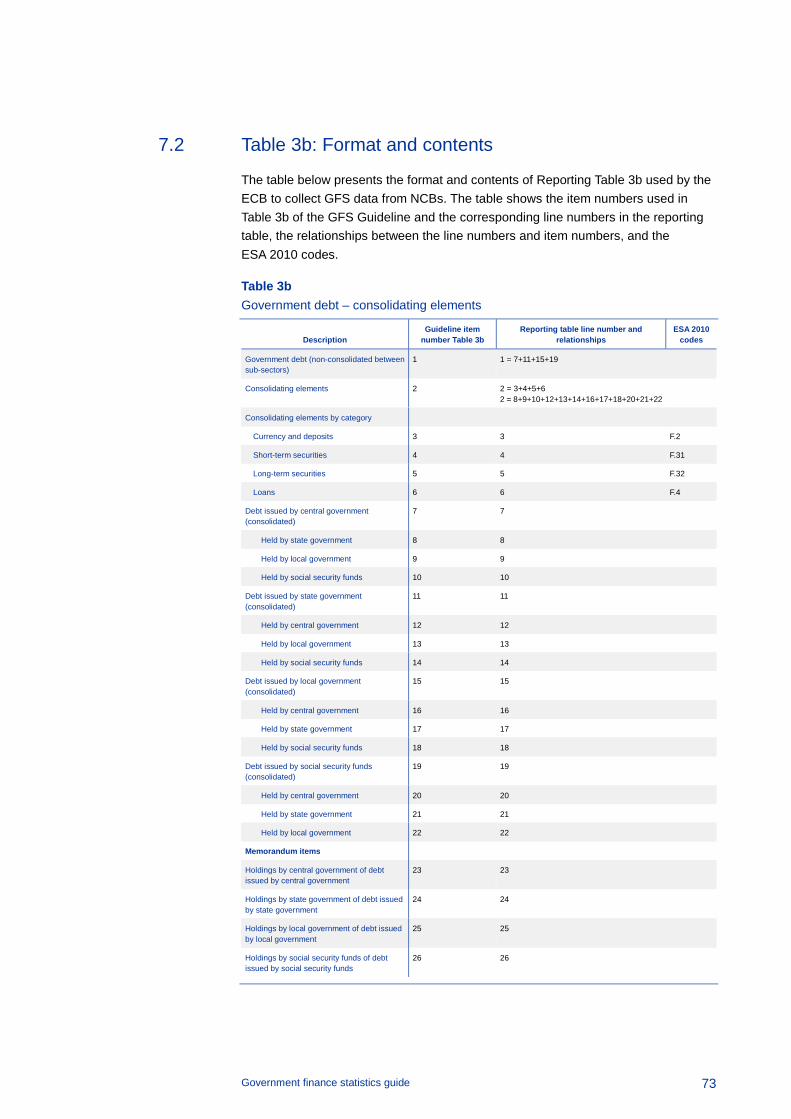
Government finance statistics guide
73
7.2 Table 3b: Format and contents
The table below presents the format and contents of Reporting Table 3b used by the ECB to collect GFS data from NCBs. The table shows the item numbers used in Table 3b of the GFS Guideline and the corresponding line numbers in the reporting table, the relationships between the line numbers and item numbers, and the ESA 2010 codes.
Table 3b Government debt – consolidating elements
Description Guideline item
number Table 3b Reporting table line number and
relationships ESA 2010
codes
Government debt (non-consolidated between sub-sectors)
1 1 = 7+11+15+19
Consolidating elements 2 2 = 3+4+5+6 2 = 8+9+10+12+13+14+16+17+18+20+21+22
Consolidating elements by category
Currency and deposits 3 3 F.2
Short-term securities 4 4 F.31
Long-term securities 5 5 F.32
Loans 6 6 F.4
Debt issued by central government (consolidated)
7 7
Held by state government 8 8
Held by local government 9 9
Held by social security funds 10 10
Debt issued by state government (consolidated)
11 11
Held by central government 12 12
Held by local government 13 13
Held by social security funds 14 14
Debt issued by local government (consolidated)
15 15
Held by central government 16 16
Held by state government 17 17
Held by social security funds 18 18
Debt issued by social security funds (consolidated)
19 19
Held by central government 20 20
Held by state government 21 21
Held by local government 22 22
Memorandum items
Holdings by central government of debt issued by central government
23 23
Holdings by state government of debt issued by state government
24 24
Holdings by local government of debt issued by local government
25 25
Holdings by social security funds of debt issued by social security funds
26 26

Government finance statistics guide
74
7.3 Line-by-line analysis of Table 3b
Item 1: Government debt (non-consolidated between sub-sectors)
Non-consolidated general government gross debt (meaning not consolidated between sub-sectors) is the sum of the Maastricht debt of each sub-sector (Table 3b, items 7, 11, 15 and 19). The debt of a sub-sector for this purpose is the total of all relevant EDP liabilities (i.e. AF.2, AF.3 and AF.4) issued by all units in that sub-sector that are not assets of that sub-sector. Valuation is at face value and follows the standard rules (see Chapter 6).
Item 2: Consolidating elements
The consolidating elements of government debt comprise all government liabilities in the relevant instruments (AF.2, AF.3 and AF.4) held by government units outside the sub-sector that has the liability, stated at face value (holdings by a unit of its own debt19 are not recorded at all in the accounts (ESA 2010, 7.92), and, as noted earlier, GFS do not record holdings by other units in the issuing sub-sector in the debt of that sub-sector.)
The consolidating elements of government debt can be broken down into the ESA 2010 categories:
• cross-deposits between government units, in particular local government (and social security fund) deposits held with the ministry of finance;
• cross-lending between government units, in particular central government loans to local government (and social security funds) to finance investments – in the latter case, year-end amounts may be small relative to infra-annual amounts outstanding;
• cross-holdings of securities:
• mainly holdings by social security funds in the form of Treasury bills, notes and bonds;
• holdings of government securities by other government units;
• holdings by government agencies which intervene on the market to manage government debt and liquidity, where such agencies are not part of the unit that issues the debt.
This item does not cover securities issued by government that are acquired by government under a repo operation, because repos are considered a collateralised loan of cash, not a transaction in securities.
19 That is, where the financial asset and liability are held by the same institutional unit.

Government finance statistics guide
75
The consolidating elements can be considered as either:
• the sum of all assets of each government sub-sector that are liabilities issued by government units (other than the unit which holds them);
• the sum of all liabilities of each government sub-sector that are held by government units (other than the unit which holds them).
Items 3 to 6: Consolidating elements by instrument
The instrument breakdown here follows the same definitions as for Table 3a.
Item 7: Debt issued by central government (consolidated)
All EDP debt instruments issued by central government held by non-government units and by government units outside central government are included. Debt instruments issued by central government units that are held within these units or by other central government units are not included in this item.
Items 8 to 10: Held by state government, local government and social security funds
All EDP debt instruments issued by central government that are held by government units outside central government are included, broken down by sub-sector (state government, local government and social security funds). An example is holdings of Treasury bills and other central government debt securities by social security funds.
Item 11: Debt issued by state government (consolidated)
All debt instruments issued by state government held by non-government units and by government units outside state government are included. Debt instruments issued by state government units that are held within these units or by other state government units are not included in this item.
Items 12 to 14: Held by central government, local government and social security funds
All EDP debt instruments issued by state government that are held by government units outside state government are included, broken down by sub-sector (central government, local government and social security funds).

Government finance statistics guide
76
Item 15: Debt issued by local government (consolidated)
All EDP debt instruments issued by local government held by non-government units and by government units outside local government are included. Debt instruments issued by local government units that are held within these units or by other local government units are not included in this item.
Items 16 to 18: Held by central government, state government and social security funds
All EDP debt instruments issued by local government that are held by government units outside local government are included, broken down by sub-sector (central government, state government and social security funds). An example is a loan provided by central government to local government.
Item 19: Debt issued by social security funds (consolidated)
All EDP debt instruments issued by social security funds held by non-government units and by government units that are not social security funds are included. Debt instruments issued by social security funds that are held by social security funds are not included in this item.
Items 20 to 22: Held by central government, state government and local government
All EDP debt instruments issued by social security funds that are held by government units that are not social security funds are included, broken down by sub-sector (central government, state government and local government).
Items 23 to 26: Holdings of debt issued within government sub-sectors (memo items)
These are the holdings of financial assets within the sub-sector, for example central government units holding the debt of other central government units.
Items 23 to 26 are not included in the GFS Guideline, but are part of the GFS data request.
Government finance statistics guide
77
8 Compilation of aggregates for the euro area and the European Union
This chapter discusses the compilation of GFS aggregates for the EU and the euro area. Three main issues are considered. The first is the aggregation method to be used for converting national series into a common currency. The second is the extension of the consolidation principle to “cross-border” transactions between national governments. The third issue is the treatment of EU budget transactions.
8.1 Aggregation method
This chapter describes the two methods chosen for GFS: the fixed euro conversion rate method in the case of the euro area aggregates, and the current exchange rate method in the case of the EU aggregates.
Under the fixed exchange rate method, the exchange rate in one chosen year is used for all years. In the case of the euro area aggregates, the irrevocable conversion rates into the euro of participating currencies are used. As the euro area countries already report their back data using the irrevocable conversion rates, the euro area aggregates are a simple sum of the country data in euro.
Under the current exchange rate method, the actual market exchange rate in the year is used to aggregate national data.
The difference between the aggregated stocks (across countries) in the common currency at the end of year t with the aggregated stocks at the end of year t-1 does not equal the sum of the aggregated flows in year t in the common currency, due to exchange rate fluctuations.
8.2 Consolidation of national data
At present, cross-border transactions between national governments in the euro area, and between governments and the EU budget, are as a general rule not consolidated in GFS (nor are they consolidated in the ESA 2010 or in the EDP data provided by Member States). The same is true of cross-border holdings of government debt securities. Intergovernmental lending operations in the context of the financial crisis are an exception to this general rule: these are consolidated in the euro area and EU aggregates. One example of such intergovernmental lending operations is the loans provided by the European Financial Stabilisation Facility (EFSF), which was set up to lend money to euro area countries in financial difficulty. Its lending operations are rerouted through the government accounts of the guarantor euro area Member States (EAMSs). Thus, not only does the gross government debt of the country in need increase, but the gross government debt of the guarantor EAMSs also increases in
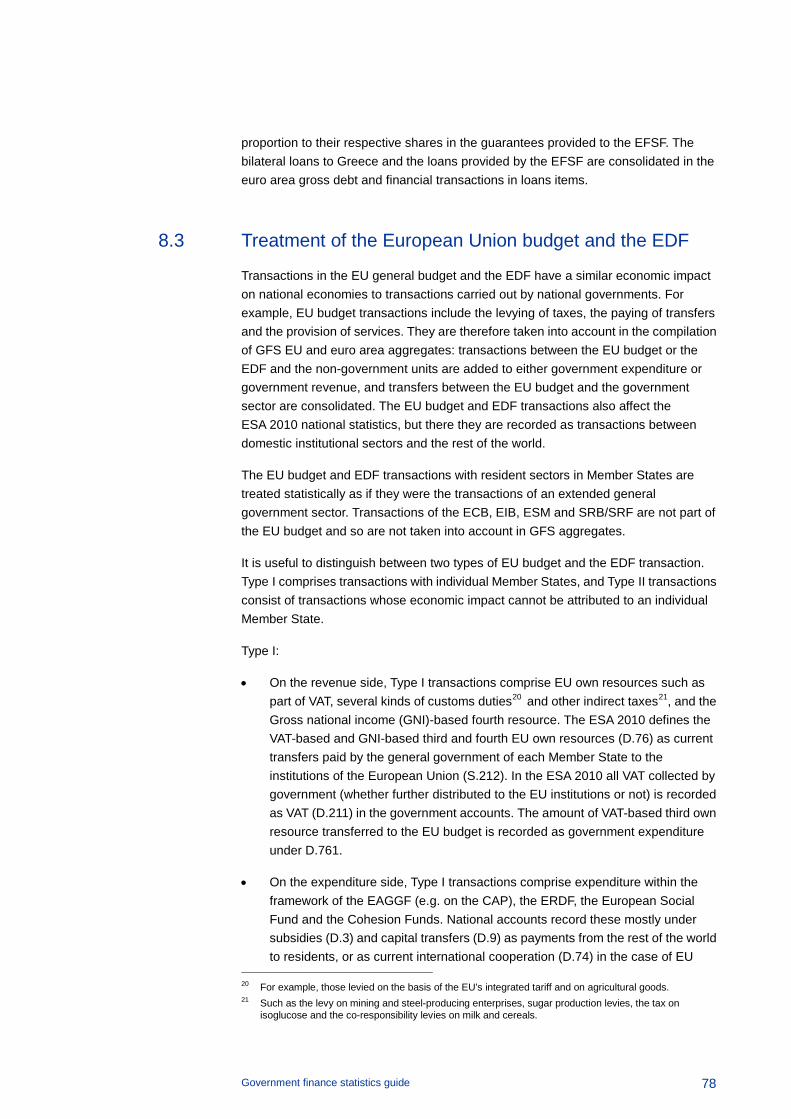
Government finance statistics guide
78
proportion to their respective shares in the guarantees provided to the EFSF. The bilateral loans to Greece and the loans provided by the EFSF are consolidated in the euro area gross debt and financial transactions in loans items.
8.3 Treatment of the European Union budget and the EDF
Transactions in the EU general budget and the EDF have a similar economic impact on national economies to transactions carried out by national governments. For example, EU budget transactions include the levying of taxes, the paying of transfers and the provision of services. They are therefore taken into account in the compilation of GFS EU and euro area aggregates: transactions between the EU budget or the EDF and the non-government units are added to either government expenditure or government revenue, and transfers between the EU budget and the government sector are consolidated. The EU budget and EDF transactions also affect the ESA 2010 national statistics, but there they are recorded as transactions between domestic institutional sectors and the rest of the world.
The EU budget and EDF transactions with resident sectors in Member States are treated statistically as if they were the transactions of an extended general government sector. Transactions of the ECB, EIB, ESM and SRB/SRF are not part of the EU budget and so are not taken into account in GFS aggregates.
It is useful to distinguish between two types of EU budget and the EDF transaction. Type I comprises transactions with individual Member States, and Type II transactions consist of transactions whose economic impact cannot be attributed to an individual Member State.
Type I:
• On the revenue side, Type I transactions comprise EU own resources such as part of VAT, several kinds of customs duties20 and other indirect taxes21, and the Gross national income (GNI)-based fourth resource. The ESA 2010 defines the VAT-based and GNI-based third and fourth EU own resources (D.76) as current transfers paid by the general government of each Member State to the institutions of the European Union (S.212). In the ESA 2010 all VAT collected by government (whether further distributed to the EU institutions or not) is recorded as VAT (D.211) in the government accounts. The amount of VAT-based third own resource transferred to the EU budget is recorded as government expenditure under D.761.
• On the expenditure side, Type I transactions comprise expenditure within the framework of the EAGGF (e.g. on the CAP), the ERDF, the European Social Fund and the Cohesion Funds. National accounts record these mostly under subsidies (D.3) and capital transfers (D.9) as payments from the rest of the world to residents, or as current international cooperation (D.74) in the case of EU
20 For example, those levied on the basis of the EU’s integrated tariff and on agricultural goods. 21 Such as the levy on mining and steel-producing enterprises, sugar production levies, the tax on
isoglucose and the co-responsibility levies on milk and cereals.
Government finance statistics guide
79
current payments made directly to national governments. Type I transactions make up the bulk of the EU budget.
Type II transactions consist of transactions whose economic impact cannot be attributed to an individual Member State. They include current international cooperation with third countries appearing under the EU budget headings external action or pre-accession aid (without counterparts in the national accounts of Member States), along with administrative expenditure, such as compensation of employees and intermediate consumption. They also include some receipts in the EU budget, such as direct taxes levied on employees of the EU institutions. The administrative expenditure, although not aimed at Member States, is included in their national accounts where the counterparts are resident units. The one exception is the payment made by the EU budget to each government for collecting EU own resources: this is treated as a Type I transaction.
Conceptually, the treatment of the EU budget and EDF transactions in the compilation of EU aggregates is straightforward. They are handled as if they related to an extra Member State. Both Type I and Type II transactions are included. Type I transactions which have national governments as counterparts are consolidated in the EU aggregates according to the usual consolidation rules for government revenue and expenditure described in the other chapters of this Guide. This requires the elimination of any current transfers or capital transfers where the national government is a counterpart, such as the fourth resource. By contrast, own resources collection costs are not consolidated because they are treated as a sale of non-market output (P.131) by government to the rest of the world.
It might be concluded that these overall net payments should be zero since, across all Member States, payments to the EU budget and the EDF should equal receipts from the EU budget and the EDF, given that the EU budget is in balance. This is not the case, however, because some types of expenditure from the EU budget cannot be assigned to an individual Member State and so are not included in the GFS tables of any Member State. This is either because there is no counterpart in a Member State (e.g. in the case of EU budget aid to developing countries) or because the expenditure is EU budget administrative expenditure.
Government finance statistics guide
80
9 References and background information
9.1 Legal background
The ECB Guideline on government finance statistics (ECB/2018/13) amending Guideline ECB/2013/23 describes the data required by the ECB from NCBs in the context of GFS.
9.2 Other published guidance and manuals
System of National Accounts 2008 (SNA 2008)
International guidance on the compilation of national accounts, published jointly by the UN, the World Bank, the European Commission, the IMF and the OECD. It is available on the website of the UN Statistics Division at www.unstats.un.org.
European System of Accounts 2010 (ESA 2010)
This is the national accounts standard for Europe, derived from and largely consistent with the SNA 2008, but with some additional elements for the EU context. It is legally binding for all EU Member States. The version published in the EU Official Journal includes the transmission programme, which describes the tables that are required by the Commission. It is available on the Eurostat website at https://ec.europa.eu/eurostat/web/esa-2010/overview.
Manual on government deficit and debt
This provides further guidance on matters affecting the general government sector in national accounts. It is available on the Eurostat website at https://ec.europa.eu/eurostat. It is not legally binding.
Manual on sources and methods for the compilation of COFOG statistics
This manual provides a methodological background, practical guidance, national sources and methods for the compilation of COFOG data. It is available on the Eurostat website at https://ec.europa.eu/eurostat.
IMF Government Finance Statistics Manual 2014
This IMF publication defines the general government sector statistics used to support fiscal analysis. It is available on the IMF website at www.imf.org. The manual is described in more detail below.
OECD Revenue Statistics
Each year the OECD publishes its Revenue Statistics. An annex to the publication explains the OECD classification of taxes and provides an interpretive guide. It is
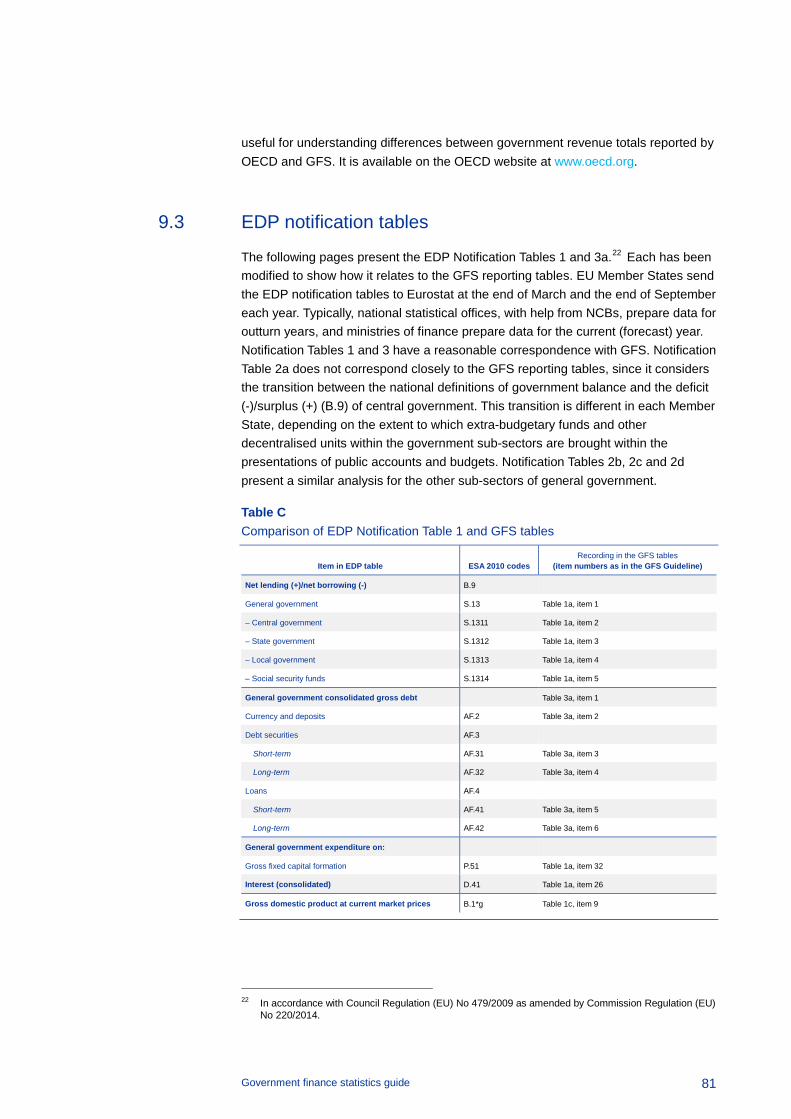
Government finance statistics guide
81
useful for understanding differences between government revenue totals reported by OECD and GFS. It is available on the OECD website at www.oecd.org.
9.3 EDP notification tables
The following pages present the EDP Notification Tables 1 and 3a.22 Each has been modified to show how it relates to the GFS reporting tables. EU Member States send the EDP notification tables to Eurostat at the end of March and the end of September each year. Typically, national statistical offices, with help from NCBs, prepare data for outturn years, and ministries of finance prepare data for the current (forecast) year. Notification Tables 1 and 3 have a reasonable correspondence with GFS. Notification Table 2a does not correspond closely to the GFS reporting tables, since it considers the transition between the national definitions of government balance and the deficit (-)/surplus (+) (B.9) of central government. This transition is different in each Member State, depending on the extent to which extra-budgetary funds and other decentralised units within the government sub-sectors are brought within the presentations of public accounts and budgets. Notification Tables 2b, 2c and 2d present a similar analysis for the other sub-sectors of general government.
Table C Comparison of EDP Notification Table 1 and GFS tables
Item in EDP table ESA 2010 codes Recording in the GFS tables
(item numbers as in the GFS Guideline)
Net lending (+)/net borrowing (-) B.9
General government S.13 Table 1a, item 1
– Central government S.1311 Table 1a, item 2
– State government S.1312 Table 1a, item 3
– Local government S.1313 Table 1a, item 4
– Social security funds S.1314 Table 1a, item 5
General government consolidated gross debt Table 3a, item 1
Currency and deposits AF.2 Table 3a, item 2
Debt securities AF.3
Short-term AF.31 Table 3a, item 3
Long-term AF.32 Table 3a, item 4
Loans AF.4
Short-term AF.41 Table 3a, item 5
Long-term AF.42 Table 3a, item 6
General government expenditure on:
Gross fixed capital formation P.51 Table 1a, item 32
Interest (consolidated) D.41 Table 1a, item 26
Gross domestic product at current market prices B.1*g Table 1c, item 9
22 In accordance with Council Regulation (EU) No 479/2009 as amended by Commission Regulation (EU)
No 220/2014.
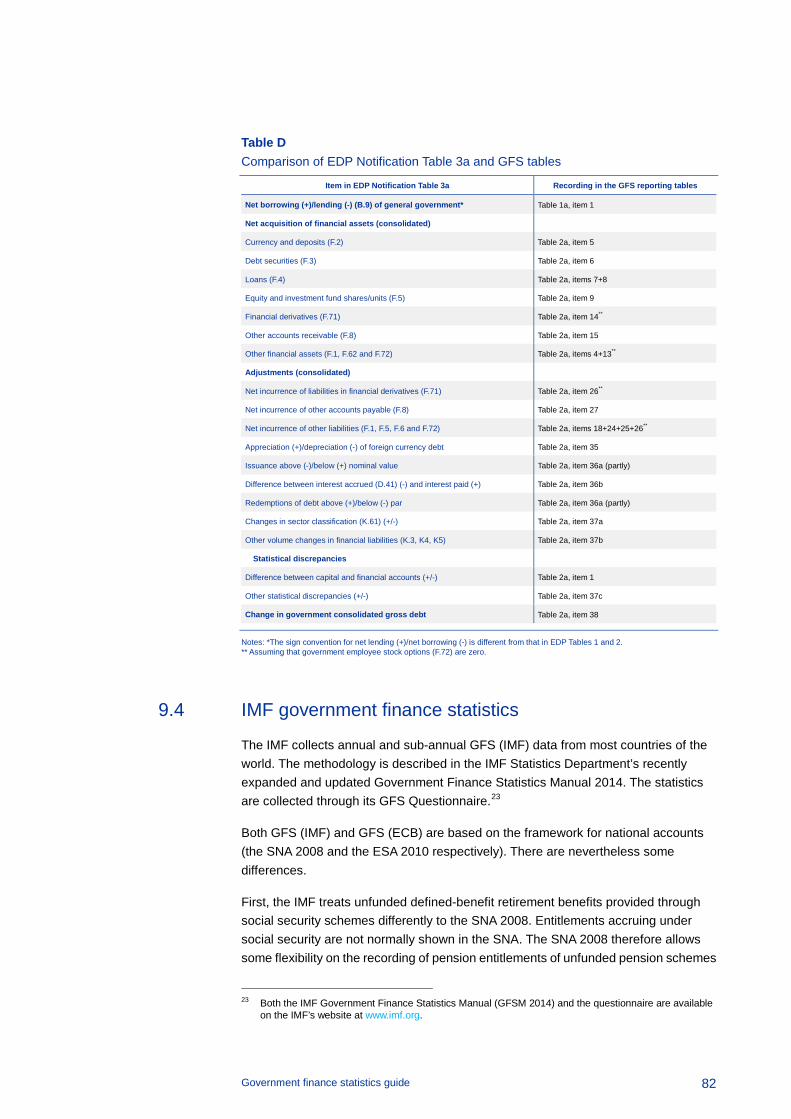
Government finance statistics guide
82
Table D Comparison of EDP Notification Table 3a and GFS tables
Item in EDP Notification Table 3a Recording in the GFS reporting tables
Net borrowing (+)/lending (-) (B.9) of general government* Table 1a, item 1
Net acquisition of financial assets (consolidated)
Currency and deposits (F.2) Table 2a, item 5
Debt securities (F.3) Table 2a, item 6
Loans (F.4) Table 2a, items 7+8
Equity and investment fund shares/units (F.5) Table 2a, item 9
Financial derivatives (F.71) Table 2a, item 14**
Other accounts receivable (F.8) Table 2a, item 15
Other financial assets (F.1, F.62 and F.72) Table 2a, items 4+13**
Adjustments (consolidated)
Net incurrence of liabilities in financial derivatives (F.71) Table 2a, item 26**
Net incurrence of other accounts payable (F.8) Table 2a, item 27
Net incurrence of other liabilities (F.1, F.5, F.6 and F.72) Table 2a, items 18+24+25+26**
Appreciation (+)/depreciation (-) of foreign currency debt Table 2a, item 35
Issuance above (-)/below (+) nominal value Table 2a, item 36a (partly)
Difference between interest accrued (D.41) (-) and interest paid (+) Table 2a, item 36b
Redemptions of debt above (+)/below (-) par Table 2a, item 36a (partly)
Changes in sector classification (K.61) (+/-) Table 2a, item 37a
Other volume changes in financial liabilities (K.3, K4, K5) Table 2a, item 37b
Statistical discrepancies
Difference between capital and financial accounts (+/-) Table 2a, item 1
Other statistical discrepancies (+/-) Table 2a, item 37c
Change in government consolidated gross debt Table 2a, item 38
Notes: *The sign convention for net lending (+)/net borrowing (-) is different from that in EDP Tables 1 and 2. ** Assuming that government employee stock options (F.72) are zero.
9.4 IMF government finance statistics
The IMF collects annual and sub-annual GFS (IMF) data from most countries of the world. The methodology is described in the IMF Statistics Department’s recently expanded and updated Government Finance Statistics Manual 2014. The statistics are collected through its GFS Questionnaire.23
Both GFS (IMF) and GFS (ECB) are based on the framework for national accounts (the SNA 2008 and the ESA 2010 respectively). There are nevertheless some differences.
First, the IMF treats unfunded defined-benefit retirement benefits provided through social security schemes differently to the SNA 2008. Entitlements accruing under social security are not normally shown in the SNA. The SNA 2008 therefore allows some flexibility on the recording of pension entitlements of unfunded pension schemes
23 Both the IMF Government Finance Statistics Manual (GFSM 2014) and the questionnaire are available
on the IMF’s website at www.imf.org.
Government finance statistics guide
83
in the main sequence of accounts. Contributions to the schemes reflect social security contributions receivable in the SNA 2008, but under GFS (IMF) they also reflect the increase in liabilities for promised future benefits in the GFS (IMF) balance sheets. The SNA 2008 requires that the estimates for these schemes be presented in a supplementary table.
Second, GFS (IMF) encourage an extension of the coverage to include statistics for the public sector and its sub-sectors, i.e. including the general government sector and the public corporations sector, whereas the ESA 2010 and GFS (ECB) limit their data to the general government sector alone.
Third, GFS (IMF) collect more information than GFS (ECB) and consequently, in some instances, offer a finer breakdown than GFS (ECB). In many cases, the extra detail is not defined by separate ESA 2010 categories. For example, the breakdown of taxes for GFS (IMF) is more detailed than for the ESA 2010 and is similar to the presentation in the OECD’s Revenue Statistics. Also, GFS (IMF) collect information on the sub-sectors of general government and allow the ESA 2010 social security fund sector to be combined with the central government sector, and each sub-sector of government to be divided into budgetary accounts and extra-budgetary accounts. This sub-classification of the general government sub-sectors is not defined in the ESA2010.
In addition, GFS (IMF) generally show financial assets and liabilities at market value if tradable, or otherwise at nominal value, while GFS (ECB) show the stock of debt at face value.
Finally, GFS (IMF), in principle, require consolidation of all flows and stock positions of the units in the general government sector. However, as explained in Chapter 2, GFS (ECB) do not consolidate certain categories of non-financial transactions, such as taxes and the sale of goods and services.
Figure 2 shows the structure of accounts in GFS (IMF). GFS (IMF) show full reconciliation of transactions, other flows and balance sheets at market value. GFS (ECB) show this reconciliation only for the change in government debt and deficit (deficit-debt adjustment).

Government finance statistics guide
84
Figure 2 Structure of accounts in GFS (IMF)
Source: IMF.
Stock positions Stock positionsFlows
Transactions Other economic flows+ =
Statement of Operations
RevenueMinus
Expense
Equals
Change in net worth due to transactions
(net operating balance)
Equals
Transactions in nonfinancial
assets
Plus
Change in net financial worth due to transactions (net
lending (+)/ net borrowing (−))
Equals
Transactions in financial assets
Minus
Transactions in liabilities
Opening balance sheet
Net worth
Equals
Nonfinancial assets
Plus
Net financial worth
Equals
Financial assets
Minus
Liabilities
Statement of Other Economic Flows
Change in net worth due to
other economic flows
Equals
Other economic flows in nonfinancial
assets
Plus
Change in net financial worth due to other
economic flows
Equals
Other economic flows in financial assets
Minus
Other economic flows in liabilities
Closing balance sheet
Net worth
Equals
Nonfinancial assets
Plus
Net financial worth
Equals
Financial assets
Minus
Liabilities
+
+
+
+
+
+
+
+
+
+
=
=
=
=
=

© European Central Bank, 2019
Postal address 60640 Frankfurt am Main, Germany Telephone +49 69 1344 0 Website www.ecb.europa.eu
All rights reserved. Reproduction for educational and non-commercial purposes is permitted provided that the source is acknowledged.
For specific terminology please refer to the ECB glossary (available in English only).
PDF ISBN 978-92-899-3677-4, ISSN 1725-4531, doi 10.2866/706961, QB-XC-19-001-EN-N