government in hawaii - university of hawaii that is compiled is made a ... tax bill service which...
TRANSCRIPT

GOVERNMENT IN HAWAII
A HANDBOOK OF FINANCIAL STATISTICS
1971EIGHTEENTH EDITION
HAWAII STATE AND COUNTYTAX COLLECTIONS g f 2*7 — X /
Fiscal 1970 L t D K M h ' Y
?TAT(: i i A W A I IMrNT OF n.ANNING AND
MiC i : /FLQPMENTF:-;; 2359 I waii 96804
AX FOUNDATION OF HAWAIIHONOLULU, HAW A II

TAX FOUNDATION OF HAWAII
O FFICERS
Howard C. Babbitt, President S. P. McCurdy, First Vice President D. Campbell Ross, Second Vice President
Fred W. Bennion, Secretary Bishop Trust Co., Ltd., Treasurer
BOARD OF TR U S TE E S
Norman C. Adams.S. M. Askins....*H. C. Babbitt... Thomas J. Bailey Ben W. Baker....Wm. H. Balthis (Maui)
................. Vice President - Hawaii, Longs Drug Stores
....Adm. Services Manager, Hawn. Div., Del Monte Corporation
............ '.Representative, Hawaiian Sugar Planters' Assn. Assistant Treasurer & Tax Manager, Castle S Cooke, Inc.Vice President 6 Controller, Maui Land & Pineapple Co. , Inc.......................................................Retired
Northrup H. Castle (Hawaii).................................... RancherClinton L. Childs (Kauai).......................... Realtor, Prosser • Childs, Inc.Robert G. Dodge......................................... Partner, Heen, Kai S DodgeRay M. Hammett.............. Exec. Vice Pres., American Savings S Loan AssociationThomas K. Hitch.......................... Senior Vice President, First Hawaiian BankAndrew T. F. Ing............ Financial Vice President, Hawaiian Electric Co., Inc.Sheridan C. F. Ing.......... .................. President, Sheridan Ing CorporationWm. A. Kruse...................................... Assistant Treasurer, Amfac, Inc.Randolph M. Lee, Jr Vice President & General Manager, Halekulcuii HotelVernon L. Libby........................................... Partner, Haskins 8 Sells*S. P. McCurdy.....................Vice President 8 Secretary, Castle 8 Cooke, Inc.*Lowell E. Mee Vice President 8 Treasurer, Honolulu Gas Co., Ltd.R. A. Obrock...............Senior Vice President - Finance, Dillingham Corporation*D. Campbell Ross.......................................State Manager, Shell Oil Co.C. George Ruff..................Manager, Tax Department, Alexander 8 Baldwin, Inc.H. Howard Stephenson........................ Senior Vice President, Bank of HawaiiL. L. Thomas........................... Vice President, Pacific Insurance Co., Ltd.
^Robert M. S. Tom..................Vice President-Treasurer, Hawaiian Telephone Co.James E. Watts...................................... Partner, Alexander Grant 8 Co.*Executive Committee
ALTER NA TES
(Mrs.) Anne Austin.............................Tax Manager, Hawaiian Telephone Co.Kenneth L. Bickmore...............Assistant Treasurer, Hawaiian Electric Co., Inc.Wm. V. Coots (Kauai) Treasurer, Grove Farm Co., Inc.Franklin Dey................. Manager, Tax Dept., Theo. H. Davies 8 Co. , Ltd.Charles F. DuBois. Secretary-Treasurer, Maui Land 8 Pineapple Co., Inc.G. R. Ewart III....................Manager, Land Department, C. Brewer 8 Co., Ltd.Shurei Hirozawa Assistant Vice President, First Hawaiian BankG. L. Hopper Managing Partner, Haskins 8 SellsJohn W. Hoxie............... Div. Industrial Relations Mgr., Del Monte CorporationW. B. Jamieson Assistant Controller, Castle 8 Cooke, Inc.Kakuji Kajiwara............ Vice Pres. 8 Controller, American Savings 8 Loan Assn.Wm. Mackenzie (Hawaii)....................President, Hilo Electric Light Co., Ltd.T. J. McCabe Ind. Rel. Dir., McCabe, Hamilton 8 Renny Co., Ltd.J. G. McGuire Plant Manager, Shell Oil Co.Stanley Y. Mukai Attorney, Wooddell, Mukai, Wirtz 8 IchikiColin C. Murdoch (Maui)....... Ex. Vice Pres. 8 Gen. Mgr., Maui Electric Co., Ltd.Burt Nose........................... Vice President 6 Manager, Young Brothers, Ltd.S. E. Peters Tax Manager, Dillingham CorporationCarl H. Sjoberg Controller, Agricultural Group, Amfac, Inc.Walter A. Turner, Jr.......................... Partner-in-Charge, Touche Ross 8 Co.Richard C. Van Etten....... Vice Pres..8 Sec., First Insurance Co. of Hawaii, Ltd.Roy A. Vitousek, Jr............................ ,................ AttorneyStanley W. Widasky..................................Vice President, Bank of HawaiiClifford H. N. Yee................................ President, Finance Factors, Ltd.
STAFF
Fred W. Bennion, Executive Director Nell A. Cammack, Research Assistant
Jonathan A. Jerome, Research Assistant Nora K. Kaaua, Secretary

TAX FOUNDATION OF HAWAII
Incorporated in 1953, the Tax Foundation of Hawaii is an independent, non-profit, non-partisan educational citizens' organization. The Foundation is governed by a 25-member Board of Trustees representing the entire State. The Foundation is financed by voluntary c o n tributions from underwriting members, business organizations, and from corporate and individual associate members.
The purpose of the Tax Foundation is to encourage efficiency and economy in government, and to improve the economic status and standard of living of the citizens of the State of Hawaii. This is accomplished in part by cooperating with public officials and other organized groups or individuals working toward the adoption of improved methods, systems and procedures of public a d m inistration.
Data relative to government and taxation are collected and analyzed, with the Tax Foundation serving as a clearing house. Information that is compiled is made available to the public through the publication of reports , p a m p h l e t s , newspaper articles and by radio and television broadcasts.
In addition to GOVERNMENT IN HAWAII, other releasee by the Tax Foundation of Hawaii include: FINANCE INBRIEF, a wallet size resume of Hawaii's fiscal facts; a weekly column in the editorial pages of the Sunday H o n o lulu Star-Bulletin S Advertiser; a radio series twice weekly on KHVH and KLEI. During the State of Hawaii L e g islative S e s s i o n s , the Foundation prepares a LEGISLATIVE TAX BILL SERVICE which digests and comments on tax legislation, and LEGISLATIVE TAX REVIEW, published at the c o n clusion of each session, presents detailed reports of all major action as well as an examination of the changes in the State's finances.
GOOD GOVERNMENT DEPENDS ON AN INFORMED PUBLIC

FOREWORD
The eighteenth edition of GOVERNMENT IN HAWAII outlines the changes in governmental finances that occurred during 1970 - some changes for the better, some trends that concern us all and invite our close attention .
Activity in the public sector of the State's economy is highlighted by the rise from third to second in per capita tax collections ($583), record expenditures by State and local governments which amounted to more than $706 million, and a rise from ninth to fifth highest in the nation in per capita long-term public debt.
Private industry recorded increases of 13% in the value of retail sales, 21% in sales at wholesale, and 23% in the value of construction. The number of visitors rose by 14%. However, visitor expenditures in Hawaii rose only 1% from $577 million to $583 million.
Factors which were of major interest to the citizens of Hawaii include a rise from 120 to 124 in theconsumer price index, and an increase of 14% in percapita personal income which coincided with a 21% increase in per capita tax collections. The unemployment rate reached 4.2% with fewer people being employed in 1970 than in 1969 by the construction and hotel industries and the federal government.
These are just a few of the highlights to be found in the eighteenth edition of GOVERNMENT IN HAWAII which supplements the Foundation's 1969 publication, A Compendium of Government Finances in Hawaii - 1949-1968, and continues to present data in the original format of four basic categories: general economic statistics,sources of government revenues, government expenditure patterns and the public debt of each governmental unit.
We gratefully acknowledge the cooperation and assistance provided by many persons in Federal, State and local government in Hawaii. Our special thanks go to the directors and staffs of the State of Hawaii Departments of Accounting and General Services, Budget and Finance, Education, Labor, Planning and Economic Development, Taxation, and Transportation; the Finance Directors of the four counties; and the First Hawaiian Bank and Bank of Hawaii.
Howard C. Babbitt, President Tax Foundation of Hawaii

TABLE OF CONTENTS— GOVERNMENT IN HAWAII 1971
Foreword........................................................ 2
PART ONE: 50TH STATE STATISTICS................................. 4Trends - Debt, Taxes, Income............................. 5Economic Growth........................................... 6Income Sources............................................ 7Population................................................ 8Hawaii's Counties........................................ 9Personal Income by State................................ 11Civilian Employment...................................... 12
PART TWO: WHERE GOVERNMENT GETS ITS MONEY ................... 14Tax Burden by State...................................... 15Fuel Tax Collections..................................... 16General Excise Tax Data.................................. 17State and County Taxes................................... 18State Operating Revenues................................ 20Sales Tax Rates by State................................ 22Fuel, Tobacco and Liquor Rates.......................... 2 3State Personal Income Tax Rates......................... 24State Corporate Income Tax Rates....................... 25Real Property Data....................................... 26County Operating Revenues............................... 29Taxes Levied in Hawaii................................... 32Federal Taxes and Grants in Hawaii..................... 34Federal Administrative Budget........................... 35Tax Collections in Hawaii............................... 36General Fund Finances.................................... 37
PART THREE: HOW GOVERNMENT SPENDS ITS MONEY ................ 38Direct Expenditures Per Capita.......................... 39State Operating Expenditures............................ 40County Operating Expenditures........................... 42Public Employment Data................................... 45Public School Data....................................... 49University of Hawaii..................................... 5 3Transportation: Airports............................... 54
Harbors................................ 55Highways............................... 56
PART FOUR: THE LONG TERM PUBLIC BONDED DEBT ................ 57Per Capita Debt by State................................ 5 8State and County Debt in Hawaii......................... 59Constitutional Debt Limits.............................. 6 3
Index........................................................... 64

50TH STATE STATISTICS
A br i e f look at the general eoonomio picture for Hawaii in 1970 shows that the Aloha State did relatively well during a period which, in a great many parts of the nation, was characterized by both high unemployment and low productivity and profits. Total personal income in the State increased an estimated 13% during 1970, and while State and local tax collections increased at a faster rate (15%) from $395 million to $*+54 million the increase was due to expansion of the tax base, including higher price levels, and not a raise in tax rates. Furthermore, while unemployment reached a high of *+.3% by November of 1970 (significantly above 1969's 2.8%), this is still well below the national rate which has been above 5% for many months now.
1971 may see some re-alignment of the relationships among Hawaii 's four major economic a c tivities: tourism, military expenditures, and theproduction and processing of sugar and pineapple. Visitor expenditures rose to $583 million, only 1% above 1969's $577 million. Continuation of the overall economic difficulties on the mainland, particularly on the west coast, will probably discourage many would-be visitors and keep the tourist industry operating at a level somewhat lower than was seen in the latter part of the 1960's.
Military expenditures in the islands may also continue at a lower level than has been seen in the past. The planned withdrawal from southeast Asia would cut down both Hawaii-based military operations and RSR activities. It would also continue to influence civilian employment by the armed services which dropped by 6% in 1970. These employes represent 6% of the civilians employed in Hawaii. However, a gradual decrease or maintenance of the present level of employment by the military should have a comparatively minor effect on the total labor situation.
The outlook for the sugar and pineapple i n dustries improved in 1970. The value of the sugar crop (1.2 million tons) rose an estimated $9 million over the 1969 value of $189 million. An increase from $120 million to $130 million in the value of 1970 pineapple exports indicated the recovery of the industry from the 1969 strike and its continued importance to Hawaii's economy.
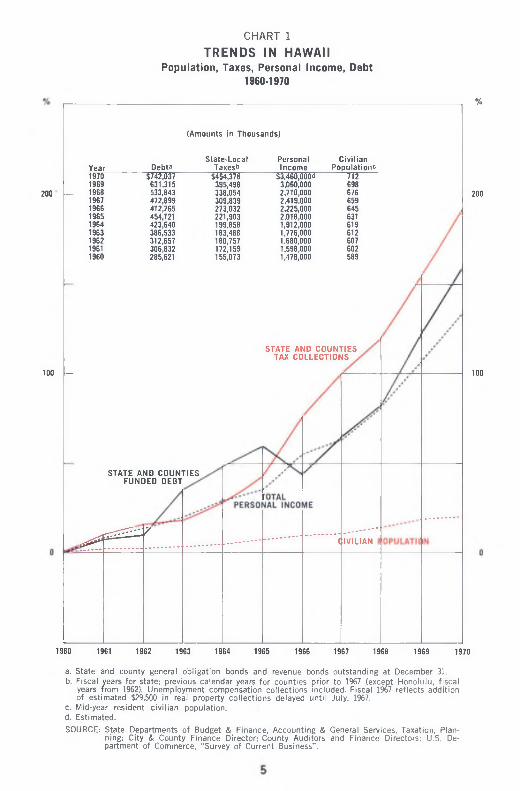
C HART 1
TRENDS IN HAWAII Population , Taxes, Personal Incom e, Debt
1960-1970
%
(A m o u n ts in T h o u s a n d s )
200 -
Y ear D eb taS ta te -L o c a l
Taxes'^P erso n a lIn c o m e
C iv ilia nP o p u la tio n c
1970 $742,037 $454,378 $3,460,0004 7121969 631,315 395,498 3,060,000 6981968 533,843 338,054 2,710.000 6761967 472,899 309,839 2,419,000 6591966 412,265 273,032 2,225,000 6451965 454,121 221,903 2,018,000 6311964 423,640 199,858 1,912,000 6191963 386,533 183,488 1.776,000 6121962 312,657 180,757 1,680,000 6071961 306,832 172,159 1,598,000 6021960 285,621 155,073 1,478,000 589
200
S T A T E A N D C O U N T IE S T A X C O L L E C T IO N S
100 - 100
S T A T E A N D C O U N T IE S F U N D E D D E B T
1960 1961 1962 1963 1964 1965 1966 1967 1968 1969 1970
a. State and county general obligation bonds and revenue bonds outstanding at December 31.b. Fiscal years for state; previous calendar years for counties prior to 1967 (except Honolulu, fiscal
years from 1962). Unemployment compensation collections included. Fiscal 1967 reflects addition of estimated $29,500 in real property collections delayed until July, 1967.
c. Mid-year resident civilian population.d. Estimated.SOURCE: State Departments of Budget & Finance, Accounting & General Services, Taxation, Plan
ning; City & County Finance Director; County Auditors and Finance Directors; U.S. Department of Commerce, "Survey of Current Business”.

TABLE 1
GROWTH IN THE HAWAIIAN ECONOMYS elected C alendar Years
AmountsEconomic Indicators 1970 1965 I960
Percent Chanqe 1970 f rom1969 1965 I9601 .83 11.81 18.516. 17 28.48 47.004.07 26.59 44,20
55.56 23.53 40.003.51 21 .47 33.236.54 27.74 73.624.41 23.43 48.4118.70 115.53 235.6113.95 157.42 426. 1 114.61 59.70 89. 1621 .46 95.64 143.93
• 1 .04 120.00 345.043.03 47,83 82.3113.07 71 .46 134.108.98 62.82 120.464.76 12.50 55.918.33 6.56 15.0413.05 73. 15 120.5221.38 189.94 290.362.15 50.79 95.21
23.80 125.95 181.82
10.71 72.78 138. 10I 1 .78 85.98 150,97
Populati on® 768,561 754,727 724,530 687,383 648,525Labor Force*^ 345,650 325,560 306,780 269,020 255,140Empl oyment^ 328,850 315,990 297,030 259,770 228,050Unemployment Rate*^ 4.2^ 2.1% 2.9? 3.4? 3.0?Cost of Living*^ 123.9 119.7 1 1 1 .9 102.0 93.0Motor Vehicle Registrations^ 408,584 383,510 372,894 319,862 235,330Total Housing Units® 245,620 235,251 226,671 198,994 165,506Total Hotel Rooms^ 3! ,957 26,923 22,801 14,827 9,522Number of Visitors^ 1 ,560,000 1,369,058 1,209,413 606,010 296,517Per Capita Personal lncom<^ S 4,502 $ 3,928 % 3,565 $ 2,819 $ 2,380Per Capita Taxes^ S 583 $ 480 $ 421 $ 298 $ 239
AMOUNTS IN MlLLIONSVisitor Expenditures^ s 583 $ 577 s 460 $ 265 $ 131Military Expenditures^ 680 660 606 460 373Total Personal Income^ 3,460 3,060 2,710 2,018 1 ,478Bank Deposits^ 1 ,638 1 ,503 1 ,379 1 ,006 743Value of Sugar Crops^ 198 169 200 176 127Value of Pineapple Exports^»9 130 120 123 122 I 13Retail Sales'^ 1 ,967 1 ,740 1 ,486 1 , 136 892Wholesale Sales^ 1 ,499 1 ,235 1 ,014 517 384Diversified Manufacturing^ 265 279 234 189 146Construction Value 775 626 463 343 275Balance of Payments:^*'
Receipts 2,450 2,213 2,003 1 ,418 1 ,029Expenditures 2,600 2,326 1 ,999 1 ,398 1 .036
Includes armed forces on a de facto basis for I960,Mid-year estimates of resident population except 1970 at 4/1/70. resident basis for 1961-1970.
b. Monthly average except 1970 at November.c. Honolulu Consumer Price Index annual average except 1970 at Septemberd. At December 31 except 1969 Kauai registrations at October 31.e. At April 1.f. Estimated 1970 data subject to revision.g. Exclusive of local sales.h. Based on general excise tax base.I. Revised data on Inflow and outflow of money due to commodity and other exports and Imports as reported by the Bank of
Hawaii.SOURCE: State Departments of Budget & Finance, Planning i Economic Devel
latlons, and Taxation; County Finance Directors; Hawaii Visitors Automobile Club; U. S. Department of Commerce; Bank of Hawaii; a
1963 = 100.
opment, Regulatory Agencies, Labor 4 Industrial ReBureau; Honolulu Redevelopment Agency; Honolulu
nd First Hawaiian Bank.

SOURCES OF PERSONAL INCOMEHaw aii (S e lected Years): U. S. Average (1959 and 1969)
(Am ounts in M illio n s)
TABLE 2
State of HawaI I1969
Income Source Amount% of Tota I Amount
% of Total
1959
Amount%, of Total
% Change 1969
From 1959
U. S. Average^
% of Total1959 1969
Change 1969
From 1959Wages and Salaries
Farms $ 66 2.2 S 66 2.4 $ 55 4,2 20.0 0.8 0.4 1 .3Contract Construction 237 7.7 171 6.3 77 5.9 207.8 4.0 4. 1 99.9Wholesale & Retail Trade 333 10.9 29 1 10.7 133 10. 1 150.4 12. 1 1 1 . 1 77.5Manufactur1ng 167 5.5 150 5.5 99 7.5 68.7 22.2 21 .2 85.7Finance, Insurance & Real Estate 1 17 3.8 96 3.5 34 2.6 244. 1 3. I 3.3 109.2Transportation 105 3.4 91 3.4 47 3.6 123.4 3.7 3. 1 60.9Communication & Utilities 81 2.6 68 2.5 23 1 .7 252.2 2.0 1.9 84.7Services
Hotels & Other Lodging 66 2.2 53 2.0 1 3 I .0 407.7 0.4 0.4 105.4Personal & Household Services 34 1 . 1 32 1.2 21 1.6 61.9 1.6 1.3 50.3Busi ness & Repair 53 1 .7 43 1 .6 13 1 .0 307.7 1.2 1.8 193.7Amusement & Recreation 1 8 0.6 15 0.6 7 0.5 157. 1 0.5 0.5 84.8Prof., Social, & Rel . Services 133 4.3 1 14 4.2 39 3.0 241.0 3. 1 4.5 184.0
GovernmentFedera1, Civilian 292 9.5 274 t o . 1 138 10.5 1 1 I .6 3.2 3.4 107. !Federal, M ilitary 282 9.2 277 10.4 174 13.2 62. 1 2.1 2.0 91 .5State & Local 289 9.4 246 9. 1 98 7.5 194.9 6.0 7.9 154.7
Other Industries 4 0. 1 4 0. 1 1 0. 1 300.0 1.2 0.8 42.3Total Wages and Salaries $2 ,279 74.5 $1 ,991 73.5 $ 974 74. 1 1 34.0 67. I 67.8 96. 1Other Labor Income 89 2.9 76 2.8 33 2.5 169.7 2.7 3.7 163.3Proprietors' Income: Farm 34 1 . I 37 1.4 32 2.4 6.3 3.0 2.2 43.8
Non-Farm 156 5. 1 151 5.6 94 7. 1 66.0 9.2 6.8 43. 1Property Income 418 13.7 381 14. 1 149 11.3 180.5 12.9 14.3 116.0Transfer Payments 192 6.3 167 6.2 62 4.7 209.7 7.2 8.7 1 36.6
Sub-Total $3 , 167 103.5 $2,803 103.4 $1 ,344 102.2 135.6 102. 1 103.5 96.9Less: Pers. Contrlb. for Soc. Ins. - 107 - 3.5 - 93 - 3.4 - 29 - 2.2 269.0 - 2. 1 - 3.5 228.0Total Personal Income $3 ,060 100.0 $2,710 100.0 $1 ,315 100.0 1 32.7 100.0 100.0 94.2NOTE: Detail may not add to total due to rounding,a. Excludes Alaska; Includes District of Columbia. SOURCE: "Survey of Current Business", August, 1970
(Unpublished tabulations), September, 1966, Washington, 0. C.
and August, 1962; "Hawaii Personal Income by Major Sources, 1948-1962" U. S. Department of Commerce, Office of Business Economics,

TABLE 3
POPULATION TRENDS IN HAWAII M id-Y ear Estim ates of R esident Population^
YearC ity-County Honol u lu
MauiCounty
Hawaii County
Kauai C ivilian® County Total
% Annual Increase
Armed^Forces
StateTotal
1970c 573,429 46,096 63,326 29,625 712,476 2.01 56,0851969 559,663 46,182 62,707 29,893 698,445 3.33 56,2821968 541,578 44,299 60,965 29,075 675,917 2.54 48,6131967 527,082 44,006 59,755 28,300 659,143 2.12 51,0021966 514,398 43,403 59,686 27,991 645,478 2.25 49,7371965 500,537 43,104 59,712 27,917 631,270 1.96 56,1131964 488,903 42,868 59,176 28,159 619,106 1.18 59,8401963 481,408 42,621 59,573 28,265 611,867 0.80 57,0931962 477,027 42,409 59,568 27,986 606,990 0.83 59,7021961 471,098 42,719 60,233 27,966 602,016 2.15 56,3481960 457,544 42,847 60,928 28,023 589,342 4.22 59,183
768,561 754,727 724,530 710,145 695,21 5 687,383 678,946 668,960 666,692 658,364 648,525
a. Includes military dependents.
b. Excludes armed forces on Rest and Recuperation leave In Hawaii. De factobasis for I960 and resident basis for 1961-1970.
c. As of April 1, all other years as of July I.
SOURCE: "The Population of Hawaii" Statistical Report 77, November 19, 1970,Department of Planning & Economic Development, State of Hawaii.
CHART 2
TRENDS IN CIVILIAN POPULATIONS tate of H aw aii & Counties
M id-Y ear Estim ates 1960-1970
Percent Percent
SOURCE: Table 3.
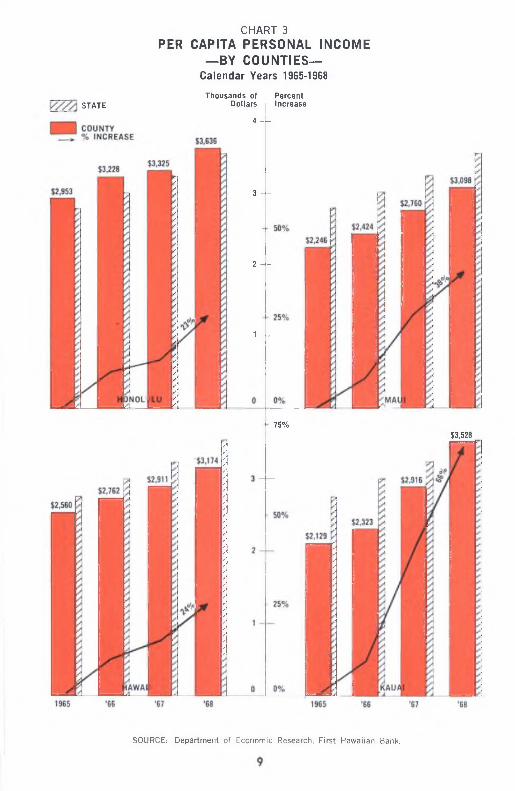
CHART 3PER CAPITA PERSONAL INCOME
— BY COUNTIES—C alendar Years 1965-19E8
S T A T ET h o u s a n d s of
D o lla rs
4 —
3 --
2 --
1 --
P e rc e n tIn c re a s e
75%$3,528
SOURCE: D e pa rtm e n t o f E conom ic Research, F irs t H aw a iian Bank.

TABLE 4
THE COUNTIES OF HAWAII C alendar Years 1969 and 1970
Honolulu Maui Haw a ii KauaiEconomic Indicators 1970 1969 1970 1969 1970 1969 1970 1969Pop u lation a 573,429 559,663 46,096 46,182 63,326 62,707 29,625 29,893Labor Force** 282,100 270,270 20, 150 20,080 30,200 28,580 13,150 13,300Empl oyment** 270,000 262,640 18,750 18,980 28,050 27,800 12,050 12,800Unemployment Rate** 4.3% 2.8% 5.2% 5.5% 5.5% 2.1% 4.0% 3.8%Hotel Units 21,217 18,209 3,011 2,675 3,486 2,697 2,609 2,241Motor Vehicle Regi strati on'- 318,553 300,971 31,527 28,485 40,094 37,435 18,410 16,601Number of Telephones 339,952 314,915 23,208 21,442 35,288 31,091 15,717 14,534Sugar Production (Tons) 212,367 217,191 279,729 268,855 431,134 439,318 238,841 257,050
Tax Revenue<* $ 81,087AMOUNTS IN THOUSANDS
$ 75,429 $ 4,920 $ 4,825 $ 7,281 $ 6,339 $ 3,054 $ 2,551Government Expenditures'* 105,893 96,351 9,812 9,641 13,578 13,562 6,936 6,333Bank Demand Deposits** 570,668 582,036 24,434 22,653 36,280 36,581 12,846 13,682Value of Sugar Crops® 36,234 34,719 47,718 42,979 73,458 70,214 40,590 41 ,088Selected Tax Bases
Pi neapp1e Ca n n ing 89,263 92,705 21,088 20,502 _ __ 4,283 3,260Retai ling 1 ,713,948 1 ,519,620 88,733 75,778 117,’ ;'; 102,285 47,151 42,526Wholesaling 1 ,407,855 1 , 1 53,014 28,598 24,890 48,636 45,620 1 3,803 1 1 ,588Manufacturing 264,512 262,365 4,746 A,951 9,332 8,705 6,66 1 3,455Contracti ng 721,413 575,600 23,378 20,298 30,861 21,260 7,319 7,800S ervices 453,978 408,210 17,280 14,192 24,194 21,529 8,738 7,883Rental s 469,521 434,212 24,429 24,122 28,696 25,028 9,022 7,494
a. Resident civilian population at 7/1/69 and 4/1/70.b. 1969 at December; 1970 at November.c. At December 31, except Kauai 1969 at October 31.d. Fiscal years.e. Based on total estimated 1970 value of SI98 million.
SOURCE: State Departments of Planning & Economic Development, Labor & Industrial Relations, and Taxation; County FinanceDirectors; Bank of Hawaii; Hawaiian Telephone Company; Hawaii Visitors Bureau; Hawaiian Sugar Planters^ Association; First Hawaiian Bank; and Tables 22-25 and 33-36.

TABLE 5
PER CAPITA PERSONAL INCOMEBy States— S elected Years^
1969 1968 1964 1959% Change 1969 from
State Amount Rank Amount Rank Amount Rank Amount Rank 1968 1959HAWAII $3,928 13 $3,565 15 $2,755 13 $2,156 10.2 82.2U.S. AV. 3,687 3,425 2,586 2,161 b 7.6 70.6Ala. Alaska Ar iz. Ark.Calif. Colo. Conn. Del . Fla. Ga.Idaho Ill.Ind.Iowa Kans. Ky.La.Me.Md. Mass. Mich. Minn. Miss. Mo. Mont. Neb. Nev.N . H .N.N.N.N.N.
J . M. Y.C.D.
Ohi o Okla. Ore. Pa.R . I . S . C . S . D . Tenn. Texas Utah Vt.Va. Wash. W. Va. Wisc. Wyo.D . C .
2,5824,4603,3722.488 4,290 3,604 4,595 4,107 3,525 3,071 2,953 4,285 3,687 3,5493.4882.847 2,781 3,054 4,073 4, I 56 3,994 3,635 2,2183.458 3, I 30 3,6094.458 3,471 4,241 2,897 4,442 2 , 8 8 8 3,012 3,738 3,047 3,573 3,659 3,858 2,607 3,027 2,808 3,259 2,997 3,247 3,3073.848 2,603 3,632 3,353 4,722
493
2950 6
222102535417 17 2426444636 I I91219 5 I 28 34 214
278
425
4339 1637 23 I 8 14473845324033 31 I 5482030 I
2, 3654.053 3,0262.315 4,0103.316 4,303 3,8423, 192 2,791 2,660 3,989 3,415 3,288 3,283 2,630 2,644 2,830 3, 780 3,888 3,715 3,3462.074 3,264 2,906 3,200 3,971 3,272 3,968 2,666 4,141 2,658 2,657 3,480 2,833 3,3253.394 3,61 I 2,391 2,820 2,584 3,019 2,7933.0533.074 3,674 2,433 3,374 3, 1004.394
494
32505
2221028394 I
617232445 4436 I I912205 I 2634 277
258
40 3
4243 1635 2118 14 4837463338 31 30 I 347 19 29
I ,774 3,052 2,281 I ,743 3, I 37 2,566 3,2393.1 20 2,291 2,008 2, 125 3,056 2,598 2,404 2,498 1 ,895 I ,9402, 132 2,836 2,902 2,7752.436 I ,484 2,470 2,260 2,365 3,2382.436 3,072 2,0983, 180 1,916 I ,981 2,647 2 , 120 2,608 2,595 2,657 I ,688 I ,885 I ,874 2,213 2,2682.1 50 2,263 2,719 I ,892 2,545 2,435 3,523
48 9
30495
20
26
294037 6I 827 224442 36 I I 10 I 224 51 2333283
25 7
394
4341 1638 (7 19 15504647343135321 4452 I26
I ,465 2,509 I ,948 I ,377 2,651 2, 196 2,695 2,712 I ,936 I ,609 I ,872 2,581 2,119 I ,949 2,075 I ,552 I ,666 I ,780 2,269 2,373 2,251 2,020 1 ,203 2,10 1 2,010 1 ,976 2,767 2,084 2,634 I .917 2,66 I I ,510 I ,537 2,276 I ,805 2, 191 2,196 2,154 I ,334 I ,469 I ,532 I ,913 I ,926 I ,739 I ,770 2,318 I ,584 2, 152 2,234 2,928
48 9
3049 6
164 3
314 I35
822292543 4037 I 3 1014 2b5 I232728 2
24 7
335
4644 1236 I 6 17 205047453432 39381 I 422 I15
9.2 10.011.4 7.57.08.76.8
6.910.4 10.0 I I .07.48 . 07.96.2 8.35.27.97.86.97.58.66.95.97.7
1 2 . 8
12.3 6. I6.98.77.38.713.47.47.67.57.86.8
9.07.38.7 7.97.36.47.64.77.0 7.6 8 . 27.5
76.2 77.8 73. I80.761.8 64. I 70.5 5 1.4 82. I90.9 57.7 66.074.0 82. 1 68. I83.466.9 71 .679.5 75. I77.480.084.464.655.7 82.6 61.1 66.6
61 .051.166.991.396.064.268.8
63. I 66.6
79. 195.4 106. I83.370.455.686.786.8
66.0
64.3 68.8 50. I 61 .3
Data for 1968 and 1969 revised by the U. S. Department of Commerce. Fifty states and the District of Columbia are ranked.
b. Excludes Hawaii and Alaska.
SOURCE: "Survey of Current Business", August, 1970, U. S. Department of Commerce, Office of Business Economics, Washington, D. C.
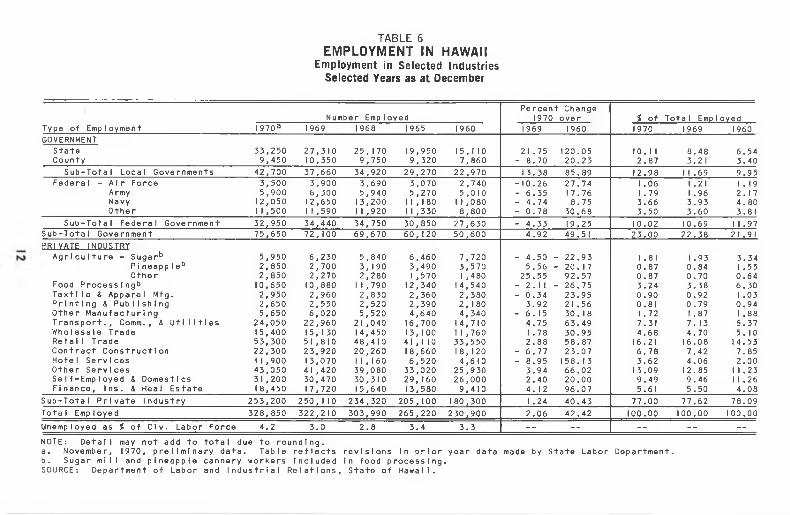
TABLE 6
EMPLOYMENT IN HAWAII Em ploym ent in S elec ted Industries
S elected Years as a t Decem ber
Type of EmploymentNumber Employed
Percent Change 1970 over % of Tota1 Empl oyed
1970 a 1969 1968 1965 . I960 1969 I960 1970 1969 1960GOVERNMENT
State 33,250 27,310 25, 170 19,950 15,110 21 .75 120.05 10.11 8.48 6.54County 9,450 10,350 9,750 9,320 7,860 - 8.70 20.23 2.87 3.21 3.40
Sub-Total Local Governments 42,700 37,660 34,920 29,270 22,970 13.38 85.89 12.98 1 1 .69 9.95Federa1 - A i r Force 3,500 3,900 3,690 3,070 2,740 -10.26 27.74 1 .06 1.21 1.19
Army 5,900 6,300 5,940 5,270 5,010 - 6.35 17.76 1 .79 1 .96 2.17Navy 12,050 12,650 13,200 1 I,180 1 1 ,080 - 4.74 8.75 3.66 3.93 4.80Othe r 1 1 ,500 1 1 ,590 1 1 ,920 1 1,330 8,800 - 0.78 30.68 3.50 3.60 3.81
Sub-Total Federal Government 32,950 34,440 34,750 30,850 27,630 - 4.33 19.25 10.02 10.69 1 1 .97Sub-Tota1 Government 75,650 72, 100 69,670 60, 120 50,600 4.92 49.51 23.00 22.38 21.91PRIVATE INDUSTRY
Agriculture - Sugar^ 5,950 6,230 5,840 6,460 7,720 - 4.50 - 22.93 1.81 1 .93 3.34P ineapp1e^ 2,850 2,700 3, 190 3,490 3,570 5.56 - 20. 17 0.87 0.84 1 .55Other 2,850 2,270 2,280 1 ,570 1 ,480 25.55 92.57 0.87 0.70 0.64
Food Processing^ 10,650 10,880 11,790 12,340 14,540 - 2.11 - 26.75 3.24 3.38 6. 30Textile & Apparel Mfg. 2,950 2,960 2,830 2,360 2,380 - 0.34 23.95 0.90 0.92 1 .03Printing & Pub1ishing 2,650 2,550 2, 520 2,390 2, 180 3.92 2 1 .56 0.81 0.79 0.94Other Manufacturing 5,650 6,020 5,520 4,640 4,340 - 6 . 1 5 30. 18 1 .72 1 .87 1 .88Transport., Comm., & Utilities 24,050 22,960 21,040 16,700 14,710 4.75 63.49 7.31 7.13 6.37Wholesale Trade 15,400 15,130 14,450 13,100 11,760 1.78 30.95 4.68 4.70 5. 10Retail Trade 53,300 51,810 48,410 41,110 33,550 2.88 58.87 16.21 16.08 14.53Contract Constructi on 22,300 23,920 20,260 18,660 18,120 - 6.77 23.07 6.78 7.42 7.85Hotel Services 11,900 13,070 11 ,160 6,520 4,610 - 8.95 158.13 3.62 4.06 2.00Other Services 43,050 41,420 39,080 33,020 25,930 3.94 66.02 13.09 12.85 1 1 .23Self-Employed & Domestics 31 ,200 30,470 30,310 29, 160 26,000 2.40 20.00 9.49 9.46 1 1 .26Finance, Ins. & Rea) Estate 18,450 17,720 15,640 13,580 9,410 4.12 96.07 5.61 5.50 4.08
Sub-Total Private Industry 253,200 250, 1 10 234,320 205, 100 180,300 1 .24 40.43 77.00 77.62 78.09Tota1 Emp1oyed 328,850 322,210 303,990 265,220 230,900 2.06 42.42 100.00 100.00 100.00Unemployed as % of Civ. Labor Force 4.2 3.0 2.8 3.4 3.3 — — — — —NOTE: Detail may not add to total due to rounding.a. November, 1970, preliminary data. Table reflects revisions in prior year data made by State Labor Department.b. Sugar mill and pineapple cannery workers Included In food processing.SOURCE: Department of Labor and Industrial Relations, State of Hawaii.
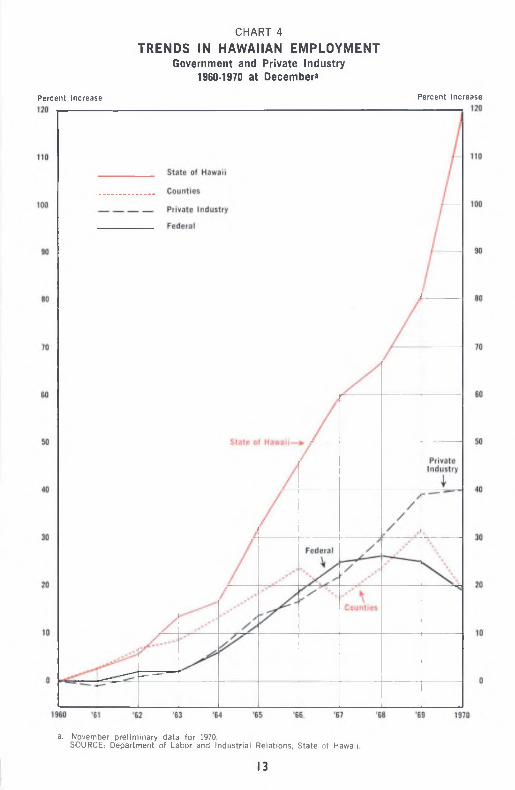
CHART 4TRENDS IN HAWAIIAN EMPLOYMENT
Governm ent and P rivate Industry 1960-1970 a t December^
P e rc e n t In c re a s e P e rc e n t In c re a s e
a. November pre lim inary data fo r 1970.SOURCE: Department of Labor and Industria l Relations. State o f Hawaii.
13

WHERE GOVERNMENT GETS ITS MONEY
HAWAII AND THE COUNTIESThe tax struc ture of Hawaii ie highly centralized with the State
levying, adminiatering and collecting almoat all taxea. The counties' responsibilities - although limited in the area of taxation - are nevertheless significant. The counties set rates for both the real property tax and the local portion of the fuel tax (without limits), and the State administers, assesses and collects them. While the State sets the public utility franchise tax, the counties are responsible for its administration aind collection. In addition to the various licenses and permits required and administered on the county level, the counties have complete control over the motor vehicle weight tax.
Hawaii's tax burden on a per capita basis is s till rising, with estimated State and local collections in fiscal 1970 of $583 per person. This ranks Hawaii 2nd in the nation and $150 above the national average. When taxes are related to personal income the ranking is 3rd with approximately $15 out of every $100 of income going for State and local taxes in the 50th State.
Total tax collections rose to over $1 billion during fiscal 1970. Federal collections in the State came to $600.6 million, while State and local collections (excluding unemployment compensation) reached $*440.1 million. The federal collections represented 58% of the total tax collections in Hawaii.
Sales and personal income taxes again made up the bulk of the tax receipts . They accounted for 61% of the State-county collections as compared with 59% in 1969. Real property taxes represented another 17% with licenses, vehicle weight, and other taxes making up the remaining 22%.
Earmarking of taxes is rare in Hawaii. When the $14 million collected for unemployment compensation taxes is excluded, only 9% of the fiscal 1970 tax receipts were automatically set aside for special funds. Primary among these were the liquid fuel and motor vehicle weight taxes (for airports, highways and mass transit), and the utility franchise tax (for county highways).
Total revenues of $577.6 million were reported by the State government in fiacal 1970. This is a 16% increase ($80 million) over the 1969 receipts. Tax collections rose by 17% and represent 61% of the total revenues. Federal grants-in-aid represent 24%, while earnings, which rose some 30%, accounted for only 8% of the State's revenues. The other 7% was made up of sales, interest earnings and other miscellaneous items.
A surplus of $24.8 million in the general fund at the end of fiscal 1970 represented an increase of $1 million from the previous year's surplus and continues a seven-year trend of surplus accumulation. Current expenditure projections indicate that some of this surplus will be used for non-recurring expenses during fiscal 1971 and 1972.THE COUNTIES
Total operating revenuea for the four counties in fiscal 1970 were $142.8 million. Of this sum, 53% was from real property taxes with the second largest item being State grants-in-aid. In Honolulu and Hawaii counties, the property tax is the largest single source of operating funds (58% and 40% respectively). Grants-in-aid to Hawaii County amounted to 36% of revenues, however they represent 40% of both Maui's and Kauai's revenues and were the largest single source of funds for these two counties. Honolulu's state grants were a minor source of funds accounting for only 7% of the county's revenues.
14

TABLE 7
STATE AND LOCAL TAX BURDENTax C ollections R elated to P opulation and Personal Incom e
By States: Fiscal Years 1969 and 1970
state
Per Capita Tax Collections®Fiscal 1969 Fiscal 1970'*Amount Rank Amount Rank
% Change from 1969
Per Capita Tax as a of Per Capi ta Income°1969 1970
Rank RankHAWAII $480 $583 21 .46 13.46 1 4.84U.S. Av. 380 433 1 3.95 I I .09 I I .74Ala.Al aska A r iz. Ark. Calif . Colo. Conn. Del. Fla. Ga.Idaho Ill.Ind.Iowa Kans. Ky.La.Me.Md. Mass. M ich. Minn. Miss. Mo. Mont. Neb. Nev.N . H . N . J . N . M . N . Y . N . C . N . D . Ohio Okla. Ore. Pa.R . I . S . C . S . D . Tenn. Texas Utah Vt.Va. Wash. W . V a . Wisc . Wyo.D . C .
224 390 387 221 540386 392372 330 270 328373 334 389 346 278298 308 41 I 453 428 406 242 30 1 351 362 466299 406 324 576 259 338 306 287387 340 379225 353 252 276 327 384 314 410 263 439 41 4 428
5015 1751
219 1423314432 22 301627424036 1057 124838 2624 4
39 1334 I
46 293741 I 828 2149254743332035 I 1456 98
263436427 254 552 423 532457 346 310 342 552 375 409 40 1 299331398 494 492 441 441 313 346 405 425 518332458 355 666
313 388 34 I 306399 417 415 273428 273 310400 508 326 4 30 305 515 432 506
50 16 20
513
225133443364
322527473930 10 I I1415413526 216
38 1233 I
42313745 29232448 19494428 8
40 1846 7179
17.41 I I .7910.34 14.932.22 9.59
35.7 I22.85 4.8514.81 4.27
47.99 12.28 5. 14 15.90 7.55 I I .0729.22 20. 198.613.048.62
29.34 I 4.95 15.38 17.40 11.16 I I .0412.81 9.57I 5.6320.85 14.79 I I .446.62 3. 10
22.65 9.50
21 .33 21 .25 8.3312.3222.32 32.293.824.8815.9717.314.35
18.22
9.479.6212.799.5513.47I I .64 9.11 9.6810. 34 9.67 12.33 9.359.78II .83 10.5410.57 I I .27 1 0 . 8 8 10.87I I .65II .52 12. 13 11.679.22 12.08 11.31 I I .74 9. 14 10.2312.15 13.919.74 12.728.79 10.13 I I .64 10.02 10.509.4112.529.75 9. 1411.7112.58 10.2111.16 10.81 13.01 13.359.74
4442 6
43 21950403141 104636 I 429 28232526 18 21 12 1747 13 22154832 I I1
387
513420353045 9
3749168
3324 2754
39
. 19
.78
.66
.21
.87
.74
.58
. 13
.82
.09
.58
.88
. 17
.52
.50
.50
.90
.03
. 13
.84
.04
.13
. I I
.01
.94
.78
.62
.56
.80
.25
.99
.84
.88
. 12
.04
. 17
.40
.76
.47
. 14
.72
.51
.35
.65
.86
. 17
.72
. 18
. 8 8 ,72
4047 I 4 39 I 3 212431 464225 1041262737 I 8
8161932 17
644 9
20
254934 152
33 I I 5 I4329283538 5
4850 7 I
4530 2241236
a. Population excluding armed forces overseas for July 1, 1969 as estimated by the U. S. Department of Commerce, and final April I, 1970 census counts excluding federal employees and their dependents overseas.
b. Fiscal year taxes as a percent of prior calendar year personal Income.c. Computed from preliminary state tax collections according to estimates
by the U. S. Department of Commerce for fiscal 1969.SOURCE: "State Tax Collections In 1970", "Governmental Finances In 1968-69",
and "Survey of Current Business", August, 1970, U. S. Department of Commerce.
15

TABLE 8
LIQUID FUEL TAX COLLECTIDNS S tate of H aw aii— S elected F iscal Years
Type of FuelTax Per Gal. Fiscal 1970 1968 I 965
STATE TAX REVENUESOAHU
Gasoline Other Highway Other Non-Hwy. Avi ation Small Boat®
5«5«11 I (
1 & 5C
$ 9,000,181 293,256 290, 176
4,334,906 25.224
8,369,210 262,744 241,066
3,859,634 25.352
S 7,626,849 210,231 224,408
3,563,480 26.592
$ 6,426,294 i69,304 222,664
I , 597,914 27. 131
TOTAL OAHU $13,943,744 12,758,006 SI I ,651 , 559 ,443,307MAUI
Gasoline Other Highway Other Non-Hwy. Aviation Small Boat®
5tf 5<t
I (I c
u & 5«r
784,857 I 8,670
I 18,474 32,721 2, 560
716,845 30,581 9 I ,674 28,752 2,628
685,58324,32390,76718,8352,607
598,05015,05149,6296,2402,694
TOTAL MAUI 957,283 870 ,479 S 822,I I 5 67 1 ,664HAWAII
Gasoline Other Highway Other Non-Hwy. Aviation Small Boat®
8t 8t 1 (t 1 t & 8(
$ I ,794, 176 I 23,245 94,327
230,958 5,964
I ,602,990 9 I ,566 76,525 176,083 4,732
S I ,499 , 782 9 I ,947 7 1,813 97,856 5,539
I , 256 ,906 83,404 75,494 15,716 4, 175
TOTAL HAWAII $ 2,248,670 I ,951, 895 I,766,938 I , 435 ,695KAUAI
Gasoline Other Highway Other Non-Hwy. Aviation Small Boata
5«5t
I «I tf
l« i 5«
502,798 22,348 44,I 48 2,996
745
465,37816,42834,6103,635
569
445,243 16,955 32,794 4, 109
846
396,246 11,417 29,839 I ,745 I ,765
TOTAL KAUAI 573,035 520,620 $ 499,947 441,012ALL COUNTIES
Gaso1ine $12,082,013 $11, 154 ,422 $10,257,456 $ 8,677,496Other Highway - - 457,467 401 , 520 543,457 279 , 176Other Non-Hwy. - - 547,125 443,874 419,782 377,626Aviation - - 4,60 I ,58 1 4,068, 103 3,684,280 1 ,621 ,615Sma11 Boat® - - 34.494 33,281 35,584 35.765
TOTAL ALL COUNTIES - - $17,722,731 $16,101 ,000 $14,740,559 $10,991 ,670COUNTIES TAX REV ENUES
OAHUGaso1ine 3-1/24 $ 6,300,127 $ 5,858,447 $ 5,338,794 $ 4,498,406Other Highway 3-1/24 205,279 183,921 147, 162 1 18,513
TOTAL OAHU - - $ 6,505,406 $ 6,042,368 $ 5,485,956 $ 4,616,919MAUi
Gaso1ine 54 $ 784,857 $ 716,845 S 605,583 $ 598,049Other Highway 54 1 8,670 50,581 24,323 15,051
TOTAL MAUI - - $ 803,527 $ 747.426 $ 709,906 $ 613, 100HAWAII
Gasoline 34 $ 672,816 $ 601,121 $ 562,418 $ 471,340Other Highway 34 46,217 34 ,337 34,480 31 ,276
TOTAL HAWAII - - $ 719,035 S 635,459 $ 596,899 $ 502,616KAUAI
Gasoline 44 $ 402,238 $ 372,302 $ 556 , 194 $ 516,996Other Highway 44 17,078 1 3, 1 43 1 3,564 9 , 1 34
TOTAL KAUAI - - $ 420 . 1 1 7 $ 385,445 $ 369,759 $ 526.130ALL COUNTIES
Gasoline - - $ 8,160,039 $ 7,548,715 $ 6,942,989 $ 5,884,791Other Highway - - 288,044 261,982 219,529 173,974
TOTAL ALL COUNTIES - - $ 8,448,003 $ 7,810,697 $ 7, 162,518 $ 6,058,765NOTE: Detail may not add to total due to rounding.a. Fuel other than gasol ine taxed at 14 per gallon.SOURCE: Reports of the Direct or of Taxation, State of Hawaii.
16

TABLE 9
GENERAL EXCISE TAX COLLECTIONS S tate of H aw aii— S elected Fiscal Years
Activities 1970 1969 1965Retailing $ 71 ,096,976 $ 61,7 12,434 $36,898,014 $ 9,384,542 15.21Services 19, 106,528 16,542,371 8,962,071 2,564,157 15.50Contracting 29,305,400 20,842,660 1 I , 195,909 8,462,740 40.60Theater, Radio,
Amusement 1 ,649,781 1 , 459 ,637 954,868 190,144 13.03Interest 1,489,856 1,213,075 995,551 276,781 22. 82Commissions 3,383,975 3 , 174, 422 1 , 831, 342 209,553 6.60Hotel Rentals® 2,980, 1 1 1 (a) ( (a) ( (a) ( (a)A ll Other Rental s 17,637,213 17,925,619 ( 9,092,898 ( 2,691,705 ( 1 5.02Use (4% )b 2,829,670 2,685,431 1 ,234,667 1 44 ,239 5.37All Others 2,300,822 1 ,933, 731 1 ,062 , 355 367,091 18.98Sub-Total $151,780,332 127,489,380 $72,227,675 $24,290,952 19.05Sugar Processi ng $ 967,593 896,082 $ 824,668 $ 71,511 7.98Pine Canninq 532,903 625,011 617,538 - 92,108 - 14.74Sub-Tota1 $ 1.500,496 1 ,52 1 ,093 $ 1 ,442,206 -$ 20,597 - 1 .35Producing S 362.756 334,621 $ 283,476 $ 28,135 8.41Manufacturing<^ 1,439,979 1 ,306,920 952,963 1 33,059 10. 18Sub-Tota1 $ 1,802,735 1 ,641 ,541 $ 1 ,216,459 $ 161 ,194 9.82Whol esaling $ 4,040,001 3,479,476 $ 2,302,728 $ 560,525 16.11Intermediary
Services 1 16, 126 9 1 ,200 87,366 24,926 27.33Use (1/2% )“= 2,642,568 2, 125, 359 165,451 5 1 7,209 24.34Blind Vendors 6, 123 6,478 1 ,867 - 355 - 5.48Sub-Tota1 $ 6,804,818 S 5,702,513 $ 2,557,412 $ 1 , 102,305 19.33Insurance
Sol icitors $ 325,683 $ 249,567 $ 154,325 $ 76, 1 16 30.50Penal ties and
Interest 474,507 465,024 268,905 1 1 ,483 2.48Licenses & Fees 178,879 166,661 143,809 12,218 7.33Estimated Tax'* 36,089 2,623 16,376 33,466 1,275.87Disaster C la ims
Refunds - - - - - 775,334 - - - -
GRAND TOTAL $162,903,539 $1 37.236,402 $77,251,813 $25,667,137 18.70NOTE: Data for 1969 and 1970 are not strictly comparable wi th 1965 in that "Dis-
Change 1970 from 1969 Amount Percent
aster Refunds" are not specified, but are deducted from tax collections.a. Prior to 1970 hotel rentals Included In all other rentals.b. Consumption and Compensating Taxes replaced with Use Tax (at same rates)
effective January I, 1966.c. Includes canning other than pineapple.d. Net payments of estimated taxes.SOURCE: Reports of the Department of Taxation, State of Hawaii.
TABLE 10
DISTRIBUTION OF STATE GRANTS-IN-AID S elected F iscal Years S tate of Haw aii: By C ounties
Change 1971 from 1970County 1971 1970 1965 Amount PercentHonolulu $ 5,372,528 $ 4, 145,714 $12,873,985 $1 ,226,814 29.59Hawaii 4,770,583 4, 1 78,922 4,681,449 591 ,661 14. 16Maui 3,060,506 2,923,958 3,511,087 136,548 4.67Kauai 3,140,948 2,358,350 2,340,724 782,598 33. 1 8Total $16,344,565 $13,606,944 $23,407,245 $2,737,621 20. 1 2NOTE: Effective July 1, 1965 d irect sharing of the general excise tax col 1 ections
with the counties was replaced with a system of State grants-in-aid. The general excise and use tax bases at the 4J level and the public service company tax base of motor and contract carriers at the 4$ level are used to compute the amount of state general fund revenues to be distributed to the counties' general funds as State grants-1n-a1d. The amount distributed is equal to 0.505$ of the total of these bases and each county's share Is determined by Its "fiscal capacity" and "fiscal need" as defined by law.
SOURCE: De part ment of Taxation, State of Hawaii.
17

STATE AND COUNTY TAX COLLECTIONS INS elected Fiscal Years
TABLE 11
HAWAII
Unit of Government Sources 1970 1969 1968 ■.1.965.
Sub-Total $438,397,420 $379,880,686 $324,322^57 $212,712,208
I960
General Excise 4 Use® $162,903,539 $137,236,402 $114,459,522 $ 77,251,813 $ 62,194,585Fuel 26,181,411 23,916,990 21,910,824 17,057,526 14,578,901Liquor 7,481,550 7,025,360 6,291,427 4,182,734 3,231,754Tobacco 5,803,292 5,397,827 4,972,852 2,608,868 1,971,303Insurance 6,095,588 5,228,657 5,147,387 2,794,785 1,883,186Public Service CompanIes° 14,105,008 10,841,479 10,544,914 7,613,281 4,025,563Banks 4 Other Financial Corporations 2,152,431 1,437,713 1,495,073 900,294 543,983Corporate Income^ 14,577,602 13,748,920 11,196,353 7,567,053 5,642,798Individual Income
Compensation 4 Dividends'^ 2,363 4,769 3,455 9,338 123,139Net Incomea e 105,016,241 86,495,777 70,308,626 38,541,659 28,655,451
Inheritance 4 Estate 2,324,433 3,412,768 1,606,042 1,077,416 587,271Real Property® 75,839,130 70,296,242 63,705,2589 41,756,872 19,864,840Conveyance (Realty Transfer) 411,551 405,589 264,173 — —Licenses, Permits 4 Other 1,257,481 1,107,612 956,124 732,891 467,989Unemployment Compensation_______________________ 14.245.800___________ 13.324.581________I I .460 .627___________ 10.617.678__________4.485.316
$148,256,079Countless
Liquor License Fees Utility Franchise Motor Vehicle Weight Licenses, Permits & Other
971,233 1,978,040
10,070,496 2,961 ,01 I
907,930 I ,816,300 9, 172,728 3,719,784
712,057 I ,676,432 8,777,013 2,565,775
541,205 1 ,368,960 5,743,127 1,537,117
444,708 897,546
4,396,685 ( ,078,176
Sub-Total $ 15,980,780 $ 9,190,409 $ 6.817,115Grand Total $454,378,200 $395,497,508 $338,053,934 $221,902.617 $155.073.194
d.e .
Reduced by Natu ( I 965); Persona $2 15,443 ( 1968) Formerl y Public were under Gene Includes paymen Compensation an Net Income tax Previous calend Adjusted for de
f .
9-SOURCE: Department
D irectors’
ral Disaster refunds and credits: General Excise, $622 (1970), $2,172 (1969), $61,862 (1968), $1,182,376I Income, $705 (1970), $963 (1969), $21,070 (1968), $197,152 (1965); and Real Property, $333 (1969),, $298,! 10 ( 1965) , ,Utility - After January I, 1964, Includes public utilities and airlines and motor carriers that previously
ral Excise Tax.ts of estimated taxes less refunds.d Dividends Tax repealed effective January I, 1958; collections In subsequent years are delinquent accounts, includes withheld and estimated tax, less refunds.ar year data for counties prior to 1967, except fiscal year data for City & County of Honolulu from 1962. layed collections of $29,500,000 collected In I960 but due In 1967.of Taxation, and Department of Accounting & General Services, State of Hawaii; and County Finance Annual Reports.

ALLOCATION OF STATE AND COUNTY TAXESH aw aii— Fiscal Years 1969 and 1970
(In Thousands)
TABLE 12
1970 Allocated to
1969 Al located to
Type of Taxes State Honolulu Maui Hawaii Kauai Total State Honolulu Maui Hawaii Kauai Total
$162,904 $124,794 $ 3,482 $2,860 $ 3,767 $2,333 $137,23626,181 16, 107 6,042 747 635 386 23,9177,482 7,025 7,0255,803 5,398 5,3986,096 5,229 5,22914,105 10,841 10,8412,152 1 ,438 1 ,43814,578 13,749 13,749
105,019 86,501 86,5012,324 3,413 3,413
75,839 1 60,375 3,432 4,794 1 ,694 70,296412 406 406
14,246 13,325 13,3251 ,257 1 , 108 i ,108
State CollectionsGeneral Excise® $149,297Fuel 17,733Liquor 7,482Tobacco 5,803Insurance 6,096Public Service Co. 14, 105Banks A Fin. Corp. 2,152Income - Corporate^ 14,578
Individual^ 105,019Inheritance & Estate 2,324Real Property 2Convey. (Realty Transfer) 412Unemployment Compensation 14,246 Licenses A Others 1,257
$ 4,146 $2,924 $ 4,179 $2,358 6,505 804 719 420
64,691 3,431 5,546 2,169
Sub-Tota1 $340,506 $75,342 $7,159 $10,444 $4 ,947 $438,397 $289,337 $69,899 $7,039 $ 9 .196 $4 ,413 $379,881Countv Col lections
Liquor Licenses A Fees $ -- $ 676 $ 112 $ 124 $ 59 $ 971 $ — $ 640 $ 113 $ 104 $ 52 $ 908Uti1ity Franchi se — 1 ,655 70 174 79 1 ,978 — 1 ,521 66 160 69 1,816Motor Vehicle Weight - - 8,236 610 842 383 10,071 - - 7,490 580 749 353 9,173All Others -- 2,298 233 345 85 2,961 — 3.029 213 371 107 3,720
Sub-Tota1 $ -- $12,865 $1 ,025 $ 1,485 $ 606 $ 15,981 $ -- $12,680 $ 972 $ I,384 $ 581 $ 15,617Total $340,506 $88,207 $8,184 $1 1 ,929 $5 ,553 $454,378 $289,337 $82,579 $8,011 $10 ,580 $4 ,994 $395,498NOTE: Detail may not add to total due to rounding.a. State Grants-in-Aid distributed according to each county's "relative fiscal capacity and relative fiscal need" as defined by
Act 155, SLH 1965. Although the amount dispersed to the counties Is determined by the total amount of general excise taxcollections, the actual monies dispersed are taken from the State general fund.
b. Includes amounts paid on declared estimated taxes less refunds.c. Includes delinquent collections from Compensation and Dividends Tax repealed 1-1-58 and Personal Net Income Tax, including
payments for withheld and declared estimated taxes less refunds.
SOURCE; Departments of Taxation, and Accounting and General Services, State of Hawaii; the various County Finance Directors' Annual Reports; and Table II.

CHART 5
SOURCES OF STATE GOVERNMENT OPERATING REVENUESSTATE OF H A W A II— FISC A L 1970
STATE G ENERAL FUND STATE GENERAL AND SPECIAL FUN D S
O
NOTE: See Table 13 for further detail.SOURCE: Compiled by The Tax Foundation of Hawaii from the 1970 Annual Report o f the Comptroller. State of Hawaii.

TABLE 13
STATE REVENUE RECEIPTS H aw aii— Fiscal Years 1969 and 1970
Fiscal 1970
Source of RevenuesGenera I Fund
Spec I a I Funds Tota I
Genera I Fund
Fiscal 1969S p e d a I Funds Tota I
Tax RevenuesGeneral Excise $162,867,450 $ —Specific Excises^ 33,906,473 17,688,237Individual Income 105,018,605 -Corporate Income 14,577,601 -Unemployment Compensation — 14,223,Other Taxes, Licenses & Permltsl* 5,751,282__________ II,
620846
$162,867,450 5 I ,594,710
105,018,605 14,577,601 14,223,620 5,763,128
$137,233,780 28,871,622 86,500,546 13,748,920
16,067,719
13,310,817 4.501
$137,233,78044,939,34186,500,54613,748,92013,310,8176,024,067
Sub-Total Taxes $322,121,41 I $ 31,923,703 $272.374.434 $ 2 9 , 3 8 3 , 0 3 7 $301,757,471Fines, Forfeits and Escheats $ 2,131,890 $ 43,567 $ 2,175,457Federal G r a n t s - 1 n - A id 99,143,951 40,267,876 139,411,828Revenues from Other Agencies 603,634 440,568 1,044,202Rents, Royalties 4 Land Income 2,841,640'' 1,617,823 4,459,463Sales of Real Property -- 977,819 977,819Earnings - General Departments 16,976,472 12,025,906 29,002,378Earnings - Public Serv. Enterp. 582,867 15,281,902 15,864,769Repayment Advances to Other
Civil Divisions 4,348 4,408,260 4,412,608Repayment Debt Cost: Counties 3,311,350 -- 3,311,350Interest Earned 4,834,836® 5,514,591 10,349,427M is cel l aneous_________________________________ 1,678,433 10,910,452^ 12.588,885
$ 2,000,51689,358,075
219,964 3,052,082''
14,105,515 636,034
3,401 3,405,814 3,951,755® I.312.546
26,793 33,813,350
153,396 I,327,139
602,624 6,037,928 13,657,685
8,305,267
3,574,05410.124.013^
$ 2,027,309123,171,425
373,360 4,379,221
602,624 20,143,443 14,293,719
8,308,668 3,405,814 7,525,809
I I .436 .559Total'= $454,230,833 $123,412,467 $577.643,300 $390,420,136 $107.005.287 $497.425.423
and Fuel taxes.Conveyance Tax, business and non-business licenses
Includes Public Utilities, Tobacco, Liquor, Insurance Includes Franchise tax. Inheritance and Estate taxes, and permits.Excludes transfers and repayments except as shown.Includes transfer of land Income proceeds from Trust Fund to General Fund In the amount of $2,786,963 In 1969 and $2,778,539 In 1970.Excludes repayments of Interest on state bonds from spe Includes public school cafeteria sales of $6,601,677 Ir
ecial fund agenclef. Includes public school cafeteria sales of $6,601,677 In 1969 and $6,587, SOURCE: Compiled by the Tax Foundation of Hawaii from the Annual Reports of
s to avoid duplication.329 in 1970. the Comptroller, State of Hawaii.

state
TABLE 14
STATE GENERAL SALES TAX DATATax Rates as of January 1,1971
State Loca IOtherRates*>
Credit Granted A g a inst
Income TaxesFood
Taxable<=Drugs
T axabledHAWAII 4.0* 0.5* Yes Yes YesAla.Al aska Ari z . Ark. Cali f Col o. Conn. Del . Fla. Ga.Idaho III.Ind.Iowa Kans. Ky.La.Me.Md.Mass.Mich.M inn.M iss .Mo.Mont,Neb.Nev.N. H. N . J. N. M. N. Y. N. C. N. 0. Ohio Okla. Ore. Pa.R. I . S. C. S. D. Tenn. Texas Utah Vt,Va. Was h . W. Va. Wisc . Wyo.D. C.
4.0
3.03.04.03.05.0No state4.03.03.04.02 . 03.03.05.03.05.04.03.04.03.05.03.0No state2.53.0No state5.04.03.03.04.04.02 . 0No state6.05.04.04.03.0 3,254.03.03.04.53.04.03.0
2.0 -5.0 -2.0 —1.0 -1.5 -3.0 —or local sales tax
1.0
5.0
1.0
0.5
0. 1251.0 -or local sales tax1.0 -0.5 -or local sales tax
0.5 -3.0 -1.0 -
0.5 -1.0 -or local sales tax 0.3 —
1.01.51.00.5
1.00.925 0.44
0.8
4.0
NoNoNoNoNoYesNo
NoNoNoNoYesYesNoNoNoNoNoYesNoNoNoNo
YesNo
NoNoNoNoNoNoNo
NoNoNoNoNoNoNoYesNoNoNoNoNoYes
YesYesYesYesNoYesNo
NoYesYesYesYesYesYesYesYes (2$)NoNoNoYesNoYesYes
YesYes
NoYesNoYesYesNoYes
NoNoYesYesYesNoYesNoYesYesYesNoYesYes ( 2 0
YesYesNoYesNoNoNo
NoYesNoYesNoYesYesNoYes (2%)NoNoNoYesNoYesYes
NoNo
NoYesNoNoNoNoYes
NoNoYesYesYesNoYesNoNoYesNoNoYesNo_______
a. Generally on tangible personalty only, although a few states (Including Hawaii) tax selected services. Local rate Is highest allowed or Imposed.
b. Hawaii levies the tax on wholesaling, producing, and manufacturing; Indiana on wholesaling and producing; Mississippi on wholesaling; Washington on wholesaling and manufacturing; and West Virginiaon manufacturing.
c. Food for home consumption; restaurant meals are generally taxable.d. Generally limited to prescription medicine and drugs, although some
states exempt various other medical Items such as patent medicines, baby supplies, eyeglasses, and artificial limbs.
SOURCE: State Tax Guide, All States Unit, Commerce Clearing House, Inc.
2 2

TABLE 15
STATE FUEL, TOBACCO AND LIQUOR TAXESTax Rates a t January 1,1971
Motor Fuel Tax^ it Per Gal Ion)
Tobacco Clgarettes
Taxes■^ t h ^ Liquor‘d
State State Loca 1 (c Per Pack) Products (Per G a l.)HAWAII 5.0 5.0 40^ Whlse.'^ 40$ Whise. 20$ WholesaleAl abama 7.0 2.0 12.0 Yes 35$ Retai1®Alaska 8.0 8.0 No $4.00A r izona 7.0 10.0 Yes 2.00Arkansas 7 .5b 12.75 15$ WhIse. 2.50C a lifornia 7.0 10.0 No 2.00Co1orado 7.0 5.0 No 1 .80Connecticut 8.0 16.0 No 2.50De laware 7.0 1 1.0 No 1 .65Florida 7.0 15.0 No 7.50Georgi a 6.5 8.0 Yes 3.75Idaho 7.0 7.0 No (e)Illinois 7.5 12.0 20$ Whise. 2.00In d iana 8.0 6.0 No 2.08Iowa 7.0** 10.0 10$ Whise. 1 5$ Who 1e s a 1e^Kansas 7.0** 1 1.0 No 1 .50Kentucky 7.0 3.0 No 1 .92Louis iana 8.0 1 1.0 Yes 2.50Maine 8.0 12.0 No (e)Maryl and 7.0 6.0 No 1 .50Massachusetts 6.5 12.0 No 2.95Michigan 7.0 I 1 .0 No 8$ Retal1®MInnesota 7.0 13.0 20$ Whise. 3.74Mississippi 8.0** 3.0 9.0 Yes 2.50®M issouri 5.0 9.0 No 1 .20Montana 7.0** 8.0 12.5$ Whise. 20$ Retal1®Nebraska 8.5 8.0 No 1 .60Nevada 6.0 2.0 10.0 No 1 .90New Hampshire 7.0 34^ Retal 1^ 34$ Retal 1 (e)New Jersey 7.0 14.0 No 2.30New Mexico 7.0 12.0 No 1 .50New York 7.0** 12.0 No 2.25North Caroli na 9.0 2.0 No $4.80+12$ RetalNorth Dakota 7.0 1 1 .0 11$ Wh Ise. 2.50Ohio 7.0 10.0 No (e)Ok1ahoma 6.58*> 13.0 Yes 2.40Oregon 7.0 4.0 No (e )Pennsylvani a 8.0 18.0 No 18$ Retal1®Rhode Island 8.0 13.0 25$ Whise. 2.50South Ca r o 1i na 7.0 6.0 Yes 2.72South Dakota 7.0 12.0 No $1.25+10$ RetalTennessee 7.0** 13.0 Yes 4.00Texas 5.0b 15.5 Yes 1 .68Utah 7.0 8.0 25$ Retal1 8$ Retal1®Vermont 8.0b 12.0 20$ Whise. 5.60®Vi rgini a 7.0 2.5 No 14$ Retal1®Washi ngton 9.0 1 1.0 30$ WhIse. (e)West Virginia 8.5 12.0 No (e)Wisconsi n 7.0 14.0 No 2.25Wyoming 7.0 8.0 No 0.80®Dist. Columbia 7.0 4.0 No 2.00a. Excludes liquid petroleum gas, special fuels, and aviation and other
non-highway fuel. Local rate Is highest single rate Imposed or allowed.b. Rate for diesel fuel for highways differs In: Texas and Oklahoma, 6.5t;
Kansas, Iowa and Tennessee, 0^; Arkansas, 8.5t; Montana and New York,9t; Mississippi, l o t ; and tax exempt In Vermont.
c. Tax Is approximately 9t per pack In Hawaii and 8.5t per pack In New Hampshire.
d. Rates apply only to distilled spirits not In excess of 100 proof.e. Monopoly states. Revenues received through markup plus taxes, except
markup only In New Hampshire and Oregon.SOURCE: State Tax Guide, All States Unit, Commerce Clearing House, Inc.;
"The Tax Burden on Tobacco", Vol. 5, Tobacco Tax Council, Inc.,Rlchmond, V a .
2 3

TABLE 16
STATE PERSONAL INCOME TAX DATAA t January 1, 1971
State
Fede ra1 Inc. Tax Deduct.a
Tax RateSteps 1 n
Range
Personal Exemption or Credit^
Min. On First Max. Over S I ng 1 e* DependentHAWAII No 2.25$ $ 500 1 1.0$ $ 30,000 1 1 $ 650*' $ 650Ala. Yes 1.5 1,000 5.0 5,000 4 1 ,500 300Al ska No 16$ of federal liability under federal rates of 12/31/63Ariz. Yes 2.0 1,000 8.0 6,000 7 1 ,000 600Ark. No 1.0 3,000 5.0 25,000 5 17.5* 6*Cal i f . No 1.0 2,000 10.0 1 4,000 10 25* 8*Coio.^ Yes 3.0 1,000 8.0 10,000 1 1 750* 750Conn. No state Income taxDel . Yes 1.5 1,000 1 1 .0 100,000 1 1 600 600Fla. No state Income taxGa. No 1.0 1,000 6.0 10,000 6 1 ,500 600Idaho Yes 2.5 1,000 9.0 5,000 6 650 650III. No 2.5$ Flat Rate 1 ,000 1,000Ind. No 2.0$ Flat Rate 1 ,000b 500Iowa Yes 0.75 1,000 5.25 9,000 7 15*,b 10*Kans. Yes 2.0 2,000 6.5 7,000 5 600^ 600Ky. Yes 2.0 3,000 6.0 8,000 5 20* 20*La. No 2.0 10,000 6.0 50,000 3 2,500e 400eMe. No 1.0 2,000 6.0 50,000 6 I ,000 1,000Md. No 2.0 1,000 5.0 3,000 4 800 800Mass.^ No 4.0$ Flat Rate on Business 1ncome 2,000^,b 600Mich. No 2.6$ Flat Rate 1 ,200^ I,200M inn. Yes 1.5 500 12.0 20,000 1 1 19*,b 19*Miss. No 3.0 5,000 4.0 5,000 2 4,000^ - -
Mo. Yes 1.5 1,000 6.0 9,000 10 1 ,200 400Mont. Yes 2.0 1,000 1 1 .0 35,000 10 600 600Neb. No 10$ of adjusted federa1 tax 1 I ab 1 1 Ity (b) (b)Nev. No state Income taxN. H. No 4.25$ of Interest and dividend Income In excess of $600N. J. No 2.0 1,000 14.0 23,000 13 600 600N. M. No l.O 500 9.0 100,000 16 650 650N. Y. No 2.0 1,000 14.0 23,000 13 650 650N. C, No 3.0 2,000 7.0 10,000 5 1 ,000 600N. 0. Yes 1.0 3,000 1 1.0 15,000 7 650^ 650Ohio No state Income taxOkla. Yes 1.0 1,500 6.0 7,500 6 1 ,000 500Ore. Yes 4.0 500 10.0 5,000 7 650 650Pa. No state Income taxR. I. No 10$ on dI V 1dends , Interest , and certain net gainsS. C. Yes 2.0 2,000 7.0 10,000 6 800 800S. D. No state Income taxTenn. No 10$ on dividends and InterestTexas No state Income taxUtah Yes 2.0 1,000 6.5 5,000 6 600 600Vt. No 25$ of federal tax liab ility + 15$ surcharge (b) (b)Va. No 2.0 3,000 5.0 5,000 3 1 ,000 300Wash. No state Income taxW. Va. No 2.1 2,000 9.6 200,000 24 600 600Wisc . No 2.7 1,000 10.0 14,000 15 10*Wyo. No state Income taxD. C. No 2.0 1,000 10.0 25,000 9 1 ,000t> 500a. Generally limited to consideration of federal taxes paid on Income taxed by
the state; maximum deductible amounts are limited by certain states.b. Tax credits (Indicated by *) which are granted In lieu of personal exemp
tions are deducted directly from tax liability. States granting additional credits designed to relieve the burden of taxes other than Income taxes are: Colorado, District of Columbia, Hawaii, Indiana, Iowa, Kansas, Massachusetts, Michigan, Minnesota, Nebraska, Vermont and Wisconsin.
c. Double exemption for Joint returns except In Massachusetts, Mississippi and North Dakota.
d. Additional rates: Surtaxes - Colorado, 2% on Interest and dividends over$5,000; and Montana, 10% of liability. Massachusetts, Q% on Interest, dividends and capital gains, 2% on annuities.
e. These exemptions must be applied to the first $10,000 of Income.
SOURCE: State Tax Guide, All States Unit, Commerce Clearing House, Inc.
24

TABLE 17
STATE CORPORATION NET INCOME TAXRates and E stim ated Burden on S elec ted Incom es
January 1, 1971
State
State/Federal
Corpor ation
Tax Deductible Tax Rate
Net
O p erating
Lossb
Estimated State
on Net T a x a b 1e
$5,000 $50,000
Income Tax
Income^ of
$500,000
HA W A I I Yes/No 5.85$ to $25,000
6.435$ over $25,000 CF-5, CB-3 S 276 $ 2,886 $ 30,092
Ala. No/Yes 5.0$ 197 1 ,665 1 3,655
Al aska No/No 18.0$ of federal tax
using 12/31/63 rates CF-5, CB-3 270 3,690 45,810Ari z . Yes/Yes 2.0$ on 1st SI,000
8.0$ over $6,000 CF-5, CB-I 130 2,295 20,497Ark. No/No 1.0$ on 1st $3,000
6.0$ over $25,000 CF-3 70 2,440 29,440
C a 1if . No/No 7.0$ - - 350 3,500 35,000
Colo. No/No 5.0$ CF-5, CB-3 250 2,500 25,000
C o n n . Yes/No 5.25$ -- 249 2,494 24,941
Del . No/No 6.0$ - - 300 3,000 30,000
Fla. No State Corporation 1 ncome Tax
Ga. No/No 6.0$ CF-5, CB-3 300 3,000 30,000
Idaho No/No 6.0$ + $10 CF-5, CB-3 310 3,010 30,010
III. No/No 4.0$ CF-5, CB-3 200 2,000 20,000
In d . No/No 2.0$ CF-5, CB-3 100 1 ,000 10,000
Iowa No/Yes^ 4.0$ on 1st $25,0008.0$ over $100,000 CF-5, CB-3 179 2,004 28,7)1
Kans. No/Yes 4.5$ on 1st $25,000
6.75$ over $25,000 CF-5, CB-3 1 77 t ,686 18,010
Ky. No/Yes^ 5.0$ on 1st $25,0007.0$ over $25,000 - - 197 1 ,837 18,786
L a . No/No 4.0$ - - 200 2,000 20,000Me. No/No 4.0$ CF-5, CB-3 200 2,000 20,000Md. No/No 7.0$ - - 350 3,500 35,000
Mass . No/No 7.98$ _ _ 399 3,990 39,900Mich. No/No 5.6$ CF-5, CB-3 280 2,800 28,000
Minn . No/Yes 11.33$ CF-5, CB-3 453 3,894 31 ,931Miss. No/No 3.0$ on 1st $5,000
4,0$ over $5,000 CF-5 1 50 1 ,950 19, 150
Mo. No/Yes 2.0$ - - 78 656 5,582
M o n t . No/No 6.25$ - - 313 3. 125 31,250Neb . Yes/No 2.0$ CF-5. CB-3 98 980 9,800
Nev. No State Corporation 1 ncome Tax
N. H. Yes/No 6.0$ - - 283 2,830 28,302N. J . No/No 4.25$ - - 213 2,125 21 ,250
N. M. Yes/No 5.0$ CF-5, CB-3 238 2,581 23,809
N. Y. No/No 7.0$ CF-5, CB-3 350 3,500 35,000N. C. No/No 6.0$ CF-5 300 3,000 30,000N. D. No/Yes 3.0$ on 1st $3,000
6,0$ over $15,000 CF-5, CB-3 126 1 ,690 I 5,730Ohio No State Corporation 1ncome TaxOkla. Yes/Yes 4.0$ - - 15! 1 ,274 10,443Ore. No/No 6.0$ CF-5 300 3,000 30,000Pa. Yes/No 12.0$ - - 536 5,357 53,571
R. 1 . No/No 8.0$ - - 400 4,000 40,000S. C. No/No 6.0$ - - 300 3,000 30,000S. 0. No State Corporation 1ncome Tax
Te nn. No/No 5.0$ CF-2 250 2,500 25,000Texas No State Corporation 1ncome Tax
Utah No/Yes^ 6.0$ - - 237 2,008 16,464
Vt. Yes/No 6.0$ CF-5, CB-3 283 2,830 28,301
Va. No/No 5.0$ CF-3 250 2,500 25,000Wash. No State Corporation 1ncome TaxW. Va. No/No 6.0$ CF-5, CB-3 300 3,000 30,000Wisc . Yes/Yes® 2.0$ on 1st $1,000
2.0$ over $6,000 CF-2 133 2,762 29,257Wyo. No State Corporation Income Tax
D . c . No/No 6.0$ - - 300 3.000 30.000
E: Taxes for Incomes above $500,000 are obtained for all cases to a good approxi
mation (exactly In 29 cases) by linear extrapolation.
Deduction limited to federal tax on Income taxed by the state, except In Utah. Further limited In Wisconsin to 10$ of net Income; in Iowa to 50$ of federal taxes
paid; and In Kentucky to federal taxes payable on tax rate In effect on 12/31/67.
Number of years carry forward and/or carry back of net operating loss. Certain
states also grant new businesses further relief."Net taxable Income" Is income net of all deductions and exemptions except any
allowed federal or state corporate Income.
SOURCE: State Tax Guide, All States Unit, Commerce Clearing House, Inc.
tax liability computed by the Tax Foundation of Hawaii.Estimated
2 5

Type of Properties
REAL PROPERTY VALUATIONS INFiscal 1971— By Countiesa
(D o llars in Thousands)
TABLE 18
HAWAII
Honolulu MauI Hawaii Kauai Total PercentHomes:^ Fee $1 ,237,026 $105,71 1 $1 19,465 $ 52,036 $1,514,238 19.76?
Leaseho1d 645,971 2,015 4,707 712 653,405 8.53Government: Federal 682,075 1 ,640 5,466 3,605 692,786 9.04
State 692,812 27,605 92,367 17,405 830,189 10.83Count i es 234,443 14,673 8,002 6,070 263,188 3.43
P u b lic Util ities'^ 51,827 2,599 2,854 726 58,006 0.76Miscellaneous Exempt‘d 289,483 20,766 18, 166 6,678 335,093 4.37A l 1 Others 2,514,281 267,631 377,944 156,757 3,316,613 43.28Total Gross Valuations $6,347,918 $442,640 $628,971 $243,989 $7,663,518 100.00?Exempt Properties
Government $1,609,330 $ 43,918 $105,835 $ 27,080 $1,786,163 23.31?Publ ic Util ities*= 51,827 2,599 2,854 726 58,006 0.76Homes:b Fee 472,070 60,780 71 ,220 28,624 632,694 8.26
Leaseho1d 179,091 66 1 1 ,925 508 182,185 2.38Others 289,483 20,766 18,166 6,678 335,093 4.37
Sub-Total Exemptions $2,601,801 $128,724 $200,000 $ 63,616 $2,994, 141 39.07?Taxable Values $3,746, 1 1 7 $313,916 $428,971 $180,373. $4,669,377 60.93?Less: 50% of Appeals 29,948 3,816 1 ,820 6,747 42,331 0.55Net Taxab1e Val ues $3,716,169 $310,100 $427,152 $173,626 $4,627,047 60.38?a. Gross valuations assessed at approximately 70? of market value. Oeta i 1 may not add to tota1 due
rs>o
to rounding.b. Owner occupied homes. Exempt
only on leased property. Basi a maximum $8,000 on properties
c. Exempt from property taxation.d. Includes property used for sch
profit labor unions, corporati
value incl udes land c exempt ion $5,100; val ued at $8,500 o Subject to select
o o l, hospit a l and n ons, societies and
and building on fee simple property, and buildings additional exemption based on graduated schedule to
r more. Multiple exemptions for aged.Ive sales public service companies tax. ursing home, church, and cemetery purposes; nonassociations; and the Hawaiian Homes Commission.
SOURCE: Reports of the Department of Taxation, State of Hawaii.

TRENDS IN REAL PROPERTY TAX BASES tate of H aw aii: By Counties^
(In Thousands)
TABLE 19
Fiscal Y e a r “ Hon o l ulu M a u i County Hawaii County^' Kauai County All Counties^
-J
19 7 1CImproved Residential
Un i m p r o v e d Residential
H o t e l- A p a r t m e n t
C o m m e r c ial
In d u s t r ial
A g r ic u lt u r a l
C o n s e r v a t ion
LandBldg.LandBldg.LandBldg.LandBldg.LandBldg.LandBldg.LandBldg.
$(3,716,169) 1,099,676
525,495 72,109 2,882
308,267 528,256 312,804 341 ,561 274,498 156, 172 71,799 13,022 8,345 I ,283
$(310,100) 60,060 30, 196 20,852
I47,598 3 t ,441 I 2,886 I I,971 13,413 13,439 57,827 8,867 I , 192
355
$ ( 4 2 7 , I 52) 59,012 28,055 25,029
2 , 6 6 8 37,616 34,783 23,434 23,537 10,831 14,694
136,214 I 3,709 16,562 1 ,007
$( I 73,626) 30, 121 I 5,244 13,819 I ,834
27,626 20,483 7,421 9, 190 3,071 5,735
28,722 4,246 5,650
464
$(4,627,047) 1 ,248,869
598,991 I 31,809
7,385 421 ,107 614,962 356,546 386,259 301 ,812 190,041 294,563 39,844 31,749
______ 3.1991970<=1969<=C a l e n d a r Y e a r ‘s 1967 =
1966 = 1965 = 1964 1963 1962 196 I
3,410,696 3 , 0 84,394 2 , 8 8 4 , 2 4 3 2,6 0 1 , 5 2 3 2, 3 43,366 2,166,552 1, 9 4 8 , 146 1,840,902 1,660,997
224,40 I 199,441 198,425 I 75,254 151,585 141 ,583 1 15,444 109,805 106,985
2 9 3 , I 35 253,31 5 234,874 206,693 174,697 162,905 I 40,796 130,910 I 25,608
1 33,828 102,066 98,653 85,596 79,514 73,512 66,517 64,855 64,762
4,062,060 3,639,215 3,416,194 3,069,065 2 ,749,162 2,544,552 2,270,903 2,146,472
NOTE: Detail may not add to totals due to rounding.a. Net a s s e s s e d valua t i o n s for tax rate purposes. V aluations a p p r o x i m a t e l y 70$ of market value.b. Fiscal 1969 base also used for January I, 1968-June 30, 1968 period.c. Excludes federal leased property a s s e s s a b l e to lessee, but not Includable for tax rate purposes as
follows: Hono l u l u $2,24 5 , 9 3 2 in 1971, $ 2,309,290 In 1970, $ 2,519,767 in 1969, $2,200,099 In 1967, $2,12 6 , 1 3 5 In 1966, and $2,04 6 , 9 2 4 In 1965; Hawaii $167,658 In 1971, $156,807 In 1970, $152,203 In 1969, $152 , 0 3 4 In 1967, $143,508 in 1966, and $135,536 In 1965.
SOURCE: C o m p i l e d by the Tax Found a t i o n of Hawaii from records of the Real Property Technical Office,D e p a r t m e n t of Taxation, State of Hawaii.

TABLE 20TRENDS IN REAL PROPERTY TAX COLLECTIONS
S tate of Haw aii: By Counties
Fiscal Year® Honolu1u* Maui Hawaii Kauai All Counti es*-197| $(7! ,388,814) $(4,651,706) $(7,646,537) $(2,604,591) $(86,291,648)
Impr. Res. 31 ,219,535 1,353,840 1,558,500 680,475 34,812,350Unimpr. Res. 1 ,440,643 312,793 496,009 234,800 2,484,245Hotel-Apart. 16,070,814 1 , 185,838 1 ,295,760 721,803 19,274,215Commercial 12,570,833 372,883 841,046 249,165 14,033,927Industrial 8,272,624 402,737 457, 1 15 132,118 9,264,594Agricultura1 1 ,629,41 1 1 ,000,410 2,683,622 494,520 5,807,963Conservation 184,954 23,205 314,485 91,710 614,354
1970 64,690,941 3,430,580 5,545,834 2,169,41 1 75,836,7661969 60,375,044 3,431,929 4,793,775 1 ,693,823 70,294,571Calendar Year*1967 55,393,199 2,936,587 4,243,799 1 ,632,193 64,205,7781966 49,824,636 2,635,836 3,439,502 1,423,384 57,323,3581965 41,772,069 2,276,569 2,895,385 1,307,188 48,251,2111964 31,805,083 I,987,289 2,567,845 1,153,561 37,513,7781963 28,517,185 1 ,611,982 2,056,741 1,030,235 33,216,1431962 25,538,643 1,498,256 1 ,941,959 1 ,003,961 29,982,8191961 23,372,074 1,449,369 1,986,124 1 ,002,724 27,810,291
Collections for Jan. 1, 1960-June 30, 1968 period $27,715,612; Maui, $1,047,596; Hawaii, $1,762,694; counties, $31,355,484.Includes amounts for Honolulu Redevelopment Agency Reduced by $7,138 (I960); $25,158 (1961); $133,955 $198,722 (1964); $592,744 (1965); $275,462 (1966); $333 (1969) for various natural disaster claims. Estimated 1971 "taxes to be raised" - computed by 21 to the valuations In Table 19. All other years lected.
were as follows: HonolKauai, $829,582; and a
u I u, I I
through 1966.( 1962); $169,228 (1963); $215,507 (1967); and
applying the rates In Table i are actual amounts col-
SOURCE: Compiled by the Tax Foundation of Hawaii from reports of the Departmentof Taxation, State of Hawaii.
TABLE 21TRENDS IN REAL PROPERTY TAX RATES
S tate of H aw aii: By Counties (Rates Per $1,000 Taxable Values)
Fisca l Year Honolu lu Maui Hawaii Kauai Average®
1971 Average Rate® SI9.2I $15.00 $17.90 $15.00 $18.65Improved Residential Unimproved Residential
19.21 15.00 17.90 15.00 18.84
Land 19.36 15.00 18.26 ! 5.36 18.04Buil d i ng
Hotel-Apartment15.48 13.28 14.61 12.29 14.37
Land 21 .99 16.30 19.80 16.40 20.78Bui1d ing
Commercial
17.59 13.04 15.84 13.12 17.11
Land 21 .45 16.60 19.90 16.87 21 .08Buil d ing
Industrial17. 16 13,28 15.92 15.49 16.88
Land 20.71 16.67 20.24 17.25 20.48Bui l i ng 16.57 13.33 16. 19 13.80 16.23
Agricultura1 19.21 15.00 17.90 15.00 17.37Conservation 19.21 15.00 1 7.90 15.00 17.62
1970 Average Rateb 19.21 15.00 17.90 16.50 18.791969 Average Rateb 19.21 15.00 17.89 16.50 18.81I96SC Average Rateb Calendar Year
9.61 7.50 9.09 8.25 9.42
1967 Average Rateb 19.21 15,00 17.90 16.50 18.801966 Average Rateb 19.21 15.00 17.90 16.50 18.801965 Average Rateb 17.71 15.00 17.90 16.50 17.531964 Rate 14.66 14.00 17.90 15.50 14.741963 Rate 14.66 14.00 16.10 15.50 14.631962 Rate 13.89 13.61 16.10 15.50 14.06196 1 Rate 13,89 13.61 16, 10 15.50 14.07
NOTE: Includes additional rates for Hono1u 1 u Redevelopment Agency through 1966.
a. State average rates, 1960-1964 computed by dividing total property taxes collected bytotal taxable values; 1965-1971 computed by dividing total "taxes to be raised" bytotal taxable values.
b. County average rates, 1965-1971 computed by dividing total county property "taxes to be raised" by total county taxable values.
c. Rates are for Jan. I, 1968-June 30, 1968 transitional period.SOURCE: Compiled by the Tax Foundation of Hawaii from reports of the Department of
Taxation, State of Hawaii.
28

SOURCES OF COUNTY GOVERNMENT REVENUEPercentage D istribution — By Counties
Fiscal Year 1970
CHART 6
I I T A X E S
L iq u id F u e l T a x
M o to r V e h ic le W e ig h t T ax
K)>o
R e a l P ro p e rty T a x
I N O N -T A X R E V E N U E S
O th e r T axes
I
o th e r R even u es
F e d e ra l G ran ts
S ta te G ran ts
D e p a rtm e n ta l E arn in g s
5 .9 9 % 5 .48% 3 1 .08%sS
40.42% 3 .5 3 % 6 .96% 4 .58%
1 J1 \
5 .2 1 % S .10% 40.16%JOmSS
36 .41% 5 .07% S 3.62%
\ / y ! A
7 .9 4 % 6 .02% 33.94% 2 4 0.10% 7 .7 1 %ss s?
5.93% 7.51%
0% 10% 20%
SOURCE; Tables 22-25 inclusive.
30% M % 50% 60% 70% 80% 90% 100%
TABLE 22
OPERATING REVENUES*-C ITY AND COUNTY OF HONOLULUS elected Years
F i s c a l Ye a r s
Source of Revenues
TAXES
1965 1959
Real Property General Excise^ Liquid Fuel Utili+y Franchi se Motor Vehicle Weight
$ 64,690,941 $60,375,044 $55,502,717
6,505,406 1,654,941 8,235,876
6,042,368 I ,521 , II3 7,490,366
5,485,956 1,411,318 7, 191 ,932
$35,719,553 I I ,893,973 4,616,919 I , 169,76) 4.355.252
14,197,693*^ 8,837,344 3,517,701
750,034
3. 195.928Sub-Total Taxes $81,087,164 $75,428,891 $69,591,923 $57,755,458 $30,498.700
Liquor Licenses & Fees Parking Meter Fees Other Licenses, Permits Fines, Forfeits, etc. Departmental Earnings*^
675,999
I ,556.938 2,297,824
36,745 6,688,467
639,593936,803
3,029,38927,533
5,936,354
$ 487,214I ,088,544 2, 152,027
17,204 4,759,793
377,582 731,986
I ,224,295 I,231,222 4,771,816
309,532590,416860,989818,465
2,788,049
Indigent Pens I oners Salary Adjustment Act 155t>Others
416,340 3,461,319 4, 145,714
351.4803,
343,752 404,336 ,481,891 368.148
2,
321,327 46,481
,566,775 258.293
330,392
329.927
823,223 243,928 690,125
244 .799
Sub-Total State Grants $ 8,374,852 S 4,,598, 127 i 3,, 192,876 $ 660,319 $ 2 .002,075
Federal Grants Hawaii Housing Authority Land Sales Miscellaneous
$ 6,632,606175,535
2,264,5372,080,286
S 2,
3, 1,
.535,270162,486
,473,980.513,493
S 5,,126,752 151,394 557,900 831,036
$ 3 ,764,139 141 ,024 423,679 668,365
$ 2 .045,821 76,279
506,816 794 ,110
Total $111 ,870,955 $98,,281.919 $87,,956,665 $71 .749,885 $41 .091.252
NOTE: Detail may not add to totals due to rounding.a. Includes Operating, Off-Street Parking, Economic Opportunity. Federal Grants
Projects and Honolulu Redevelopment Agency Funds.b. Act 155, SLH 1965, replaced general excise tax sharing with state-ald grants
county's "relative fiscal capacity I relative fiscal need" as defined by thec. Includes rental and interest Incomes, garbage collection fees and others.d. Includes Urban Redevelopment levy.SOURCE: Finance Director's Annual Financial Reports (Controller to I960), City and County of
Honolulu, State of Hawaii.
Spec I a I
based on each legislature.
TABLE 23
OPERATING REVENUES*— COUNTY OF MAUI S elected Years
Fiscal Years Ca lendar Years
Source of Revenues 1970 1969 1968 1964 1959
Taxes
Rea 1 Property S 3,436,654 $3,,431,929 $2,.418,413 $■ ,.987,289 $1 ,249,498General Excised - - - - -- 3,.331,557 2 .410.185Liquid Fuel 803,527 747,426 709,906 596 ,200 513,221U t ility Franchise 70,343 65,937 57,827 47,089 35,004Motor Vehicle Weight 609,686 579,973 514, 105 456,539 381.385
Sub-Total Taxes $ 4,920,210 $4 ,825,265 $3,.700,251 $6,.418,674 $4 ,589,293
Liquor Licenses & Fees $ 1 12,397 $ 1 12,728 $ 79,333 $ 69,643 S 48,885Other Licenses & Permits 233,005 213,183 135,466 105,448 70,323Fines, Forfeits & Penalties 835 621 212 25,446 21 ,305Departmental Earnlngsc 780,399 580,607 410,031 1 ,.585,183 880,315
state qrantsIn d igent - - — — - - 88,965TB Hospit a 1s - - - - - - 695,826 632,519Pensi oners 201 ,704 166,884 177,495 1 77,276 151 ,635Salary Adjustment 354,882 55, 173 5,400 - - 650,278Act I55b 2,923,958 2,,860,008 2,.797,345 - - _ _Others 579,912 687,785 291 .796 196.017 133.487
Sub-Total State Grants $ 4,060,456 ,769,850 $3,.270,036 $' 1.069,119 $1 .656.884
Federal Grants $ - - $ __ $ 47,525 S 58,256 $M isce11aneous 18,395 39,509 66,074 56,339 25, 105
Total $10,125,698 $9,,541,763 $7,,708,928 ,379,109 $7 ,292, 110
NOTE: July-June fiscal years begun July I, 1966 after a six-month transia. Excludes Loan, Bond, Revolving, and certain Trust funds. Water Supply
1967, revenues of functions transferred to the state by Act 97, SLH Ib. Act 155, SLH 1965, replaced general excise tax sharing with state-ald
each county's "relative fiscal capacity and relative fiscal need" ss leg IsIature.
c. Includes rentals. Interest, garbage collection charges and other earn
SOURCE: Auditor's Annual Reports through 1968; and 1969 and 1970 FinanceFinancial Reports, County of Maul, State of Hawaii.
11 on period.Revenues and from
965.grants based on
defined by the
I ngs .
Director's Annual
30

TABLE 24
OPERATING REVENUES*— COUNTY OF HAWAIIS elected Years
Fiscal YearsSource of Revenuest a x e s
Real Property General Excise*’ Liquid Fuel Utility Franchise Motor Vehicle Wei ght
719,033 173,945 841,846
635,459159,963749,499
$ 3,706,156
596,899149,077726,492
S 2,567,845 4,439,673
488,699 I 12,331 613,662
II ,564,326 3,244,956
416,403 84,027
529.512Sub-Total Taxes $ 5,178,624 $ 8 ,2 2 2 , 2 1 0 S5.839.224Liquor Licenses & Fees S 124,268Parking Meter Fees 48,714Other Licenses S. Permits 345,003Fines, Forfeits & Penalties 260Departmental Earnings'^ 699,486
103,839 48,041
370,545 508
57 I ,207
97,65845,878
206,6527,500
809,462
70,070 41 ,944 153,860 58,805
2,323,121
S 60,308 37,528 104, 159 36,204
I,277,574
Indigent — - - — — 134,131TB Hospit a ls - - 728.243 568,097Pensioners (d) 199,960 182,410 166,248 156,366Salary Adjustment (d) 61,513 3,953 - - 1 ,, 106,155Capi t a 1 Improvements (d) 349,345 364,512 I .,159,504 —Act ISS*" 4. 178,922 3,766,892 3,758,696 — - -
Others 849.220 42,871 65.712 190,664 128,072Sub-Total State Grants J 5, 028,142 $ 4,420,581 $ 4,375,283 S 2,,246.659 $2,,092.821Federal Grants S 175,346 J 332,725 $ 1.062,397 $ 35,546 S 62,318Hawaii Housing Authority 14,733 13,929 11,886 9,397 3, 103Land Sales (d) 1 ,257,095 5,533 - - —Miscee1laneous 92,893 173,762 82,238 123,335 37,680Total SI3,.809,523 $15,630,929 SI 1 .883,091 $13,,284.945 $9,.550.919NOTE: July-June fiscal years begun July 1, 1966 after a six -month transition period.a. Excludes Loan, Bond, Revolvinc), certain Trust Funds and Water Supply Reve nues,, After 1966, HI to
Hospital and Act 97 special funds also excluded.Act 155, SLH 1965, repealed general excise tax sharing county’s "relative fiscal capacity and relative fiscal Includes rentals. Interest, garbage collection charges Preliminary data for 1970; detailed breakdown not aval
and authorized state-ald grants based on each need" as defined by the legislature, etc.
lable for all categories.
SOURCE: Auditor's Annual Reports through 1968; Finance Director’s 1969 Annual Report; 1970 preliminary data from the Finance Director's Office, County of Hawaii, State of Hawaii.
TABLE 25
OPERATING REVENUES*— COUNTY OF S elected Years
KAUAI
Fiscal Years Ca 1 endar YearsSource of Revenues 1970 1969 1966 1964 1959Taxes
Rea 1 Property $2.173,353 $1,743,181 $1 ,734,493 $1 ,142,081 $ 833,256General E xcise** - - - - - - 2 .220,371 1,588,792Liquid F u e 1 418,713 385,718 366,091 320,639 278,886U t ility Franchi se 78,811 69,367 58,210 39,780 28,480Motor Vehicle Weight 363,088 352.890 344,484 317.673 289 .862
Sub-Total Taxes $3,053,965 $2,551,156 $2,503,278 $4 .040,544 $3 .019.276Liquor Licenses & Fees $ 58,569 $ 51,770 $ 47,852 $ 32,910 $ 25,982Other Licenses 4 Permits 85, 179 106,668 71,650 53,404 42,705Fines, Forfeits 4 Penalties 238 81 1 100 8, 1 59 5, 105Departmenta1 Earn 1ngsC 246,609 256,666 238,968 146,977 40,728state Grants
Inn d igent — — - - - - 78,753TB H o s p it a 1s — - - - - 605,872 463,413Pensi oners 78,222 76,895 69,268 07,932 81 ,602Salary Adjustment 294, 178 40,941 866 - - 572,207Act I55» 2,358,350 2,333,437 2,304,287 - - —Others 96.253 291 ,242 74,878 206.700 207.555
Sub-Total State Grants $2,827,003 $2,742,515 $2,449,299 $ 900,504 SI .403,530Federa1 Grants $ 486,549 $ 161,106 $ 32,001 $ 16,583 $ 23,065M isce11aneous 235.274 350,272 126.944 108.669 40.274Tota1 $6,993,386 $6,220,966 $5,470,092 $5 ,309,750 $4 ,601 ,465NOTE: July-June fiscal yearsa. Excludes Loan, Bond, Revolv
revenues of functions transb. Act 155, SLH 1965, replaced
county's "relative fiscalc. Includes rentals. Interest, SOURCE: County Auditor's Annua
Annual Reports, County
egun July I, 1966 after a six-month transition period.ing and certain Trust Funds, Water Supply Revenues; and from 1967,ferred to the State by Act 97, SLH 1965.general excise tax sharing with state-ald grants based on each
apacity and relative fiscal need” as defined by the Legislature, garbage collection charges, and other earnings.I Reports through 1968; and 1969 and 1970 Finance Director's of Kauai, State of Hawaii,
31

TABLE 26
TAXES LEVIED IN HAWAIIAs of January 1, 1971
KIND OF TAX. LEGAL REFERENCE, BRIEF DESCRIPTION AND REVENUE DISTRIBUTION. REPORTS DUE & % OF TOTAL COLLECTIONS'PERSONAL INCOME TAX (Chapter 235) - On net incomes of individuals. Rates are: first $500,2.25%; next $500, 3.25%; next $500, i*.5%; next $500, 5%; next $1,000, 6.5%; next $2,000, 7.5%; next $5,000, 8.5%; next $4,000, 9.5%; next $6,000, 10%; next $10,000, 10.5%; and over $30,000, 11%. Capital gains taxed at maximum 4%. Deductions generally follow federal law; including among others, state and local taxes (federal taxes are not deductible), contributions, interest paid, medical expenses, union and professional dues. Exemptions are: individuals, $650 perpersonal exemption (double exemption for those over 65); blind, deaf, or disabled persons, $5,000; estates, $400; simple trusts, $200; complex trusts, $80; and 1st $500 income from service as a military reservist. Military pay of residents is taxable. Joint returns with split income permitted. Taxes withheld by employers; other taxpayers must file estimated income returns and pay estimated taxes quarterly. Distribution: State general fund.
Individual income tax credits based on two types of income ("modified adjusted gross" and "adjusted gross") are granted, with income raaximums ranging from $6,999 to $14,999. Variable sales and education credits range from $50 to $1; drug-medical and renter credits for incomes up to $13,999 and $14,999 respectively range from 4% to 1% of drug-medical expense and 2% to1% for rent. Sellers of glue, paints and solvents granted 4% credit of sales price if productshave been treated to deter abuse by inhalation.
CORPORATE INCOME TAX (Chapter 235) - On net income of corporations up to $25 ,000 at 5.85%, and6.435% over $25,000. Capital gains rate is 3.08%. Deductions include bad debts, depreciation, business expenses, interest on loans, losses from operations (carried backward three years and forward five years), and state and local taxes (federal income taxes are not deductible).Distribution: State general fund.
INHERITANCE AND ESTATE TAXES (Chapter 235) - On shares of net estate having situs in Hawaii. Bequests to (a) spouse, exemption $20,000, rates graduated from 2% on first remaining $15,000 to 6% on remaining amounts over $250,000; (b) parent, child, grandchild or adopted child, exemption $5,000, rates graduated from 1.5% on first $15,000 to 7.5% over $250,000; (c) allothers, exemption $500, rates graduated from 3.5% on first $4,500 to 9% over $100,000. Estatetax incorporating the 80% credit allowed by the federal estate tax is imposed. Distribution: State general fund.
GENERAL EXCISE (Gross Income) TAX (Chapter 237) - On gross income, gross receipts, or gross proceeds of all business activities at following rates; 0.5% on wholesaling, intermediary services, manufacturing, producing, canning, and blind persons; 2% on insurance solicitors; 4% on retail sales of goods, services, and other activities. Distribution: State general fund.
USE TAX (Chapter 238) - On tangible personal property imported or purchased from an unlicensed seller. Rates are 0.5% on goods imported for resale at retail; 4% on all other imports.Distribution: State general fund.
PUBLIC SERVICE COMPANIES TAX (Chapter 239) - On public utility gross incomes at graduated ratesbased on ratio of net to gross income. Minimum rate, 5.885%; maximum, 8.2% except that land carriers are taxed at 5.35%. Utilities are exempt from general excise and property taxes. Airlines, motor carriers, common carriers by water, and contract carriers taxed at 4% of gross income. (No exemption for property tax.) Distribution: State general fund.
20th day of 4th month after close of income year. Withholding returns due on or before last day of following month. Estimates of income on 20th of April, June, September and January.
20th day of 4th month after end of income year. Income estimates due 20th of September and January.
Executor or administrator to decedent's estate to file a return. Payment is due within 18 months after death.
Monthly by the end of the following month. Annual summary and reconcilation return by April 20 following the tax year.
Monthly by the end of the following month.
On or before April 20th.
COCO
PUBLIC UTILITY FRANCHISE TAX (Chapter 240) - On gross operating income of certain public utilities (electric and gas companies) at 2.5% rate. Distribution: County highway funds.
BANKS AND OTHER FINANCIAL CORPORATIONS TAX (Chapter 241) - On net incomes, as defined, at 11.7% on banks, building and loan associations, industrial loan companies and other financial corporations. Federal income taxes upon income from sources in the state are deductible. Distribution ; State general fund.
FUEL TAX (Chapter 243) - On distributors at 8<: per gallon in Hawaii County to 10< in Maui for highway use (includes 5<; state tax) except LPG at 2/3 of rates. Off-highway rates for diesel, LPG and aviation fuel at K per gallon. Agricultural equipment refunds on gasoline for off- highwav use granted. Distribution: Aviation to state airport fund; small boat fuel to stategeneral fund; county fuel to county highway fund; and balance to state highway fund.
LIQUOR TAX (Chapter 24H) - On dealers at 20% of wholesale price. Distribution: State generalfund.TOBACCO TAX (Chapter 245) - On wholesalers at 40% of wholesale price of all tobacco products.Distribution: State general fund. •PROPERTY TAX (Chapter 246) - On real property, land and improvements. Assessments are at 70% of "fair market value". A maximum $8,000 home exemption is granted (maximum of $16,000 for persons over 60 and $20,000 for those over 70). Higher rates levied on land than on buildings for property classed unimproved residential, hotel-apartment, industrial and commercial; single rate levied on property classed improved residential, agricultural and conservation. Average 1971 rates per $1,000 net assessed value are: Oahu $19.21; Kauai $15.00; Hawaii $17.90; Maui $15.00. Personal property is not taxed. Distribution; Respective county general funds.CONVEYANCE TAX (Chapter 247) - On actual and full consideration paid for the transfer of realty, including leases and subleases, a tax of 5< per $100 is imposed. Minimum tax on each transaction is $1.00. Certain exemptions allowed. Distribution: State general fund.
MOTOR VEHICLE WEIGHT TAX (Chapter 249) - On weight as follows: Oahu, commercial vehicle, 1.54per pound; passenger vehicle, .754 per pound. Minimum $12 annually on motor vehicles, $1 onother vehicles. Hawaii, Maui and Kauai counties, commercial 14 per pound; passenger .54 per pound; and a $6 minimum on motor vehicles. Tax prorated over the year. Distribution: Countyhighway funds.INSURANCE PREMIUMS TAX (Chapter 431) - In lieu of general excise and net income taxes, on gross prejniums as follows: life insurance, 1.755% for domestic and 2.925% for foreign firms; surpluslines brokers, 4.68%; casualty and other insurance, 2.6325% for domestic and 3.8025% for for- eigh firms. Cash surrender values not deductible. Ocean marine insurance 0.8775% of gross underwriting profits. Distribution: State general fund,LICENSES, FEES AND PERMITS - Various business, occupation, and nonbusiness licenses, fees and permits are imposed by either the state or county governments. Distribution: State andcounties' general and special funds, depending on levy.
One month after end of calendar year.
April 20, or 20th of 4th month after fiscal year ends. Other installments due 20th of 2nd, 5th, and 8th months.
Monthly on or before end of following month.
Monthly on or before end of following month.Monthly on or before end of following month.
Assessment notices to taxpayer by Aug. 31. Appeals not later than Sept. 25. Net assessable set on or before Oct. 5. Tax rates set by Oct. 26. Payments may be made semi-annually.
Not later than 90 days after the taxable transaction.
On or before April 1st.
On or before March 15 with the Insurance Commissioner.
0.45
0.49
1.70
1.32
a. Legal reference is to Hawaii Revised Statutes (1968), as amended.b. Based on fiscal 1970 State and county tax collections (see Table 11), excluding unemployment compensation.c. The 4% tax on retail sales of goods and certain services is deductible as "sales tax" in computing state and federal income
taxes.SOURCE: Compiled from the Hawaii Revised Statutes (1968), as amended.

TABLE 27
FEDERAL TAX COLLECTIONS IN HAWAIISelected Fiscal Years
(In Thousands)
Source_________________________Indiv. Income & Employment®Corp. Income & Excess ProfitsAdmissionsManufacturer's Excise Retailer's Excise Alcohol^CommunicationsTransportation of Persons^EstateG iftTobacco*^Unemployment Insurance Al 1 Other‘S
1970 1969 1968 1965 I960$490,711 $410,939 $566,171 $218,295 $162,086
84,519 81 ,138 53,611 53,039 41 ,486(e) — — 1 , 128 1,116(a) 1 ,089 727 362 453(e) — — t ,977 1 ,264(e) 5,301 5,047 2, 860 1 ,668(e) 4,258 2,766 3, 104 1 ,949(e) 981 695 599 1 ,266
{ (f) 17,980 5,631 5,388 3,355{ 12,322 2, 180 1 ,203 584 545
(e) 8 6 I 3 202,340 1 ,807 1 ,664 1 ,422 85210,734 943 2,714 1 ,393 879
Total $600,626 $526,624 $440,237 $290,164 $216,939NOTE: Preliminary 1970 data.a. Includes withholding, FICA, Individual Income and Railroad Retirement.b. Includes receipts from customs.c. Includes tax on transportation of property prior to 1961.d. Includes stamp taxes, club dues. Initiation fees, etc.e. Breakdown not available but Included In "All Other".f. Included In "Gift" tax collections.SOURCE: Annual Report, Commissioner of Internal Revenue, U. S. Treasury.
TABLE 28
FEDERAL GRANTS TO HAWAIISelected Fiscal Years
Purpose 1970 1969 1968 1965 I960H 1ghways $ 33,202,349 $ 29,066,356 $ 23,879,125 $11,050,712 $ 4,379,282Alrports 2,313,948 1 , 377,015 363,600 2,075,178 2,146,246National Guard 15, 1 17,093 12,098,082 12,501,533 10,571,828 17,637,802Hea1th & HospIta1s Hosplta1 Construction 897,597 806,806 863,096 373,885 758,052Public Hea 1 th 2,941,730 2,336,935 2,205,660 1 ,347,276 607 ,484Hansen's 01sease 1 ,490,982 1 ,468,896 1,185,572 1 . 194, 460 1 ,065 ,435
Education Elem. - Secondary Act 4,017,783 3,768,155 2,721 ,022 _ _ _ _
Other Education 37,067,968 37,687,840 30 , 127,326 13,844,412 6,604,397School Construction 2,284,745 2,614,123 I ,629,1 14 201 ,656 2,330,962
Pub 1 1c We 1 fare Dependent ChiIdren 9,357,091 6,590,236 6.014,627 3,397,601 2,581,445Aged & Others 10,799,342 7,960,271 7, 1 14,785 2,635,247 1 ,364,277
Veterans' Assistance — - * - - - - 850,029Natural Resources 1,918,432 1 ,837,578 1 ,788,919 1,262,780 983,659Employment Security 2,92 1 ,669 2,504,640 2,510,585 1,573,452 1 ,026 ,381Unemp. Comp. Benefits 2,731,225 1 .703,000 1 ,652,675 1 , 135, 197 - -
East-West Center 4.514,517 5,857,853 5,363,292 5, 103,252 - -
Peace Corps -- -- 437,010 1 , 129 ,397 —Econ. Opportunity Act 3,580,104 3,373,985 2,657,264 323,483 - -
Ml see I 1aneous 4,255,253 2, I 19,652 1 .541,900 I ,342,899 440,686Tota 1 $139,411.826 $123,171.425 $104,557 , 1 13 $58,562,715 $42,776,337
SOURCE: Compiled by the Tax Foundation of Hawaii from the Annual Reports of the Comptroller, Department of Accounting and General Services, State of Hawaii.
34

FEDERAL BUDGET RECEIPTS, EXPENDITURES, AND PUBLIC DEBTSelected Fiscal Years
(Dollars in M illions)
TABLE 29
1970 1969 1968 1965 1960
Amount% of Total Amount
% of Total Amount
i of Tota 1 Amount
* of Tota 1 Amount
% of Tota 1
BUDGET RECEIPTSIndividual Income Taxes $ 90,412 46.7 $ 87,249 46.5 $ 68,726 44,7 $ 48,792 41.8 $ 40,741 44. 1Corporate Income Taxes 32,829 16.9 36,678 19.5 28,665 18.7 25,461 21 .8 21,494 23.2Employ. Taxes & Contributions 39,133 20.2 34,236 18.2 29,224 19.0 17,359 14.9 1 1,248 12.2Unemployment 1nsurance® 3,464 1.8 3,328 1 .8 3,346 2.2 3,819 3.3 2,667® 2.9Other Ins. i Retire. Contrib. 2,701 I .4 2,353 1.3 2,052 1.3 1 .081 0.9 768 0.8Excise Taxes
Federal Funds 10,352 5.3 10,585 5.6 9,700 6.3 10,91i 9.3 9, 1 37 9.9Highway Trust Fund 5,354 2.8 4,637 2.5 4,379 2.9 3,659 3. 1 2,539 2.7
Estate & Gift Taxes 3,644 1.9 3,491 1 .9 3,051 2.0 2,716 2.3 1 ,606 1 .7Customs Duties 2,430 1.3 2,319 1 .2 2,038 1.3 1,442 1 .2 1 , 105 1 .2Miscellaneous Receipts^ 3,424 1.7 2,916 1 .5 2,491 1 .6 1 .594 1 .4 1 . 187 1 .3
TOTAL RECEIPTS $193,743 100.0 $187,792 100.0 $153,671 100.0 $1 16,833 100.0 $ 92,492 100.0BUDGET e x p e n d i t u r e s '
National Defense $ 80,295 40.8 $ 81,240 44.0 $ 80,517 45.0 $ 49,578 41 .9 $ 45,908 49.8Internatl. Affairs & Finance 3,570 1 .8 3,785 2. 1 4,619 2.6 4,340 3.7 3,054 3.3Space Research & Technology 3,749 1 .9 4,247 2.3 4,721 2.6 5,091 4.3 401 0.4Agr. & Rural Development 6,201 3.2 6,221 3.4 5,943 3.3 4,807 4. 1 3,322 3.6Natural Resources 2,480 1 .3 2,001 1 . 1 1 ,655 0.9 2,028 1 .7 1 ,019 1 . 1Commerce & Transportation 9,310 4.7 7,921 4.3 8,094 4.5 7,399 6.2 4,774 5.2Community Dev. & Housing 2,965 1.5 1 ,961 I .0 4,076 2.3 288 0.2 971 1 . 1Education & Manpower 7,289 3.7 6,525 3.6 6,739 3.8 2,284 1 .9 1 ,286 1 . 4Hea1th 12,995 6.6 1 1 ,696 6.3 9,672 5.5 1 ,730 1.5 756 0.8Income Security 43,790 22. 3 37,699 20.4 34,108 19.1 25,702 21 .7 17,977 19.5Vet. Benefits & Services 8,677 4.4 7,640 4. I 6,882 3.8 5,722 4.8 5,426 5.9Interest 18,312 9.3 15,791 8.6 13,744 7.7 10,357 8.7 8,299 9.0General Government 3,336 1.7 2,866 1.6 2,561 1 ,4 2,210 1.9 I ,327 1 .4Less: Undistributed Intra-
governmentaI Transactions - 6,380 - 3,2 - 5,117 - 2.8 - 4,499 - 2.5 - 3,109 - 2.6 - 2,296 - 2.5TOTAL BUDGET EXPENDITURES $196,588 100.0 $184,548 100.0 $178,833 100.0 $118,430 100.0 $ 92,223 100.0Deficit (-) or Surplus (+) -$ 2,845 -- -S 3,236 -$ 25,162 -$ 1,596 _ + 269 —Gross Federal Debt^ 382,603 -- 367,144 -- 369,769 -- 323,154 -- 290,862 ”a. Includes federal funds of $339 mllion Inb. Includes both federal and trust funds.c. At end of fiscal year.SOURCE: "The U. S. Budget In Brief" for 1972,
Bureau of the Budget.U, S. Office of Management and Budget; "The Budget In Brief" for 1971,

CHART 1TAX COLLECTIONS IN HAWAII
Total, Federal, and State-Local
(In M illions of Dollars)
$1,000 —
$900 —
$800 —
$700 —
$600 —
$500 —
$400 —
$300 —
$200 —
$100 —
— $1,000
$900
$800
— $700
— $600
— $500
$400
$300
$200
$100
0 — F IS C A LY E A R S 1960 1961 1962 1963 1964 1965 1966 1967 1968 1969 1970
NOTE: Excludes Unemploym ent Compensation tax. 1967 and 1968 adjusted for an estim ated $29.5 m illio n inreal property tax due in 1967 but co llected in 1968.
SOURCE: Compiled by the Tax Foundation o f Hawaii from reports of the County Auditors and Directors ofFinance, and State Department of Taxation, State of Hawaii; and reports of the U.S. InternalRevenue Service.
3 6

TABLE 30
HAWAII STATE GENERAL FUND FINANCESFiscal Years Ending June 30
(In Thousands)®
Fi scal Year
Excess or Receipts Expenditures Deficiency
Cash Unexpended Balance Appropriations
Unappropriated Surplus
1970 $463,748 $452,,111 $10,971 $84,292 $59,489 $24,8031969 398,957 382,,406 16,551 73,320 49,481 23,8391968 339,836 331 ► 155 8,681 56,770 31 ,341 25,4291967 310,270 297,r3l4 12,956 48,089 28,123 19,9661966 258,327 243,,926 14,401 35,133 22,283 12,8501965 182,296 177,,439 4,857 20,732 11,314 9,4181964 176,198 175,,779 419 15,875 9,617 6,2581963 168,519 1 82,,713 - 14, 194 15,456 16,001 - 5451962 163,501 167,,220 - 3,719 29,650 21,516 8, 134196 1 154,012 149,,737 4,275 33,369 20,864 12,505I960 121,418 1 10,,954 ---- L0,164_ 29,094 31.731 - 2,637
a. Includes federal funds earmarked for s quent data Include certain revenues an funds, such as federal funds for Hawal covered In the treasury.
SOURCE: Annual Reports of the ComptrollerServices, State of Hawaii.
. 1961...........a expend iTures formerly under special I National Guard, or In funds not
Department of Accounting and General
CHART 8GENERAL FUND FINANCIAL POSITION
State of Hawaii— Cash and Unappropriated Surpluses and DeficitsAs at June 30— Selected Years (M illions of Dollars)
Millions of Dollars
Millions of Dollars
SOURCE: Table 30.
37

HOW GOVERNMENT SPENDS ITS MONEYHAWAII STATE AND COUNTIES
Operating expenditures of the State and oountiee exceeded $706 million in fisoal 1970. Over 80% ($570 million) of this total was spent by theState government. Public education outlays were the single most expensive item for the State while the costs of public safety led in the counties. Fiscal 1970 total expenditures exceeded the 1969 figure by $lOO million, (16.5%).
Although Hawaii ranks as the 5th highest state in the nation in total per capita direct general expenditures ($797 as compared with the national average of $578), it is not among the top 10 states in the usually high per capita spending areas of public education, welfare and highways. The 50th State's top rankings in comparison with the other states were in "all other" (2nd highest at $225 per capita), general government (3rd at $36), police and fire protection, interest paid on debt, and higher education (all Sth at $39, $23, and $92 respectively).
Public employes in Hawaii earn more on the average than those in all but four other states. The average amount for full-time equivalent employes in Hawaii is $735 per month as compared with the U. S. average of $699. The highest average wage goes to higher education employes ($879). Coupled with the higher than average salaries, the number of public employes per 10,000 population stands at 991 - up from 926 in 1969 and well above the national average of 909. Public school teachers in Hawaii receive an average salary of $10,190 per year - 6th highest in the nation.
STATE OF HAWAII
Spending for public education^ libraries and the University of Hawaii reached $217.9 million or 28% of the total State expenditures for the year. Cash utilized for capital improvements (primarily highways) represented 11% of the total, and health and welfare expenditures reached $85 million (15%).
The Employees' Betirement System's earnings dropped from 4.4% to 4.0% in 1970. Contributions of $22 million by employes and $23 million by State and County governments totaled $95 million - 6% above 1969 contributions.
Bond funds increased the Airports Division's revenues by $64 million. These funds are being used to develop and improve airports throughout the State. Expenditures for airport capital improvements reached $62 million in 1970.
THE COUNTIES
County expenditures were $126 million for fiscal 1970. Police, fire and other public safety costs represented 27% ($36.9 million) of the total. Debt service (principal and interest payments) on county bonds ranked next at 19% ($19 million). General government and staff agencies made up another 12.5% ($17 million).
Honolulu City and County expenditures totalled $106 million - 78% of the total for all four county governments. Public safety costs of $28 million (27%) were the largest item followed by debt service of $16 million or16%. General government and health and sanitation accounted for 12% and 8%respectively.
Maui County's expenditures were close to $10 million. As with the other counties, public safety was the primary object of expenditures ($2 million - 26%) with highways next at over $1.7 million (17%). General government was 3rd (19%), and pension and retirement expenditures 9th (11%).
Hawaii County outlays totalled $12.6 million. Public safety accountedfor $9 million (29%). Government control and staff agencies were next with $2.3 million (17%), then pension and retirement costs 3rd at 10%.
Kauai County costa were $7 million. Public safety took 27%, highways20%, general government 15%, and pension and retirement 10%.
38

TABLE 31
PER CAPITA DIRECT GENERAL EXPENDITURESS tate and Local G overnm ent— Fiscal 1969>
state RankPublic Higher
Total Educ. Educ, Hwys.Heal th P o lice
Welfare‘s FireGen. Int. on AII Con.^ Debt Other^
$ 797 $172 $ 92 $ 99 $116 $34 $36 $23 $225U. S. Av. 570 177 57 76 I 17 28 20 84Ala.Al aska Ari z . Ark. Calif. Col o . Conn. Del . Fla.Ga.IdahoIII.Ind.Iowa Kans. Ky.La.Me.Md.Mass.Mich.Minn.Miss.Mo.Mont.Neb.Nev.N. H, N. J. N. M. N. Y. N. C. N. D. Ohio Okla. Ore. Pa.R. I .S. C.S. D.Tenn.TexasUtahVt.Va. Wash. W. Va. Wisc . Wyo.D. C.
451
2646 6I 923 8
374 I352739 2233343040 I 7 I 3 16 I I 4036 2528 7
38 291 0 4
5014423115322 I5 I 20 494724 12 44 I 043 92 3
445 1,2 16 576 443 111
606 588 706 485 475 496 557484595 50750 I528479 6 13636 615 640 436480 580 530 769485529 608 816 390 625 474 5 I 3 62551 I596 380 601 433 442 586637 455 649 465 651 948 832
127269193 I 20204 181I 83 229 167 151 143 166 169 20 I I 6 I136148 I 45 207 159 209 216 121I 56 171 I 80194137 I 83 200 233 I 28 I 78149 137205185 16 1 I 40 198 125 I 50 203 163 I 59206 137186 224 194
51 I 22933772102306940505257 78 7271 6450 4549 30 8472 5252 66 64 61 63 29 95 44 54 0451 67 90 2850 39 82 5053 10988448958 105 I 1229
69 247837475 7470123 53 5 I 98 74 60104 85105 0490 63 62 60103 73 6813888124 10180 94 72 59 I I 476 79858486 4414171 7 I 93I 56 7991104 98
22582
89 9 I67 70I 00 1 17 I 19 97 86 I 12 7510374 94 02 88I 24 79 132 204 I I 8 I 1772104 78 811297384 103 225647585 125028812865 60 84 7376 10768 10975 I 10 I 10 235
1 5 32 28 I I 4323 32 2124171831 20 18 18 17 22 21 37 41 28 19 (325 17 22 53 22 36 22 50 16 I 4 23 I 8 25 2232 I 4 14 I 8 2! 17 I 819 27 I I20 21 86
1 2 6 I 24 1231 26 26 26 22 162 I I 8 I 5 20 I 7 I 3 I 519 2123 2120 101524 19 45 17 22 24 28 1 4 211617 281823 12 22 I 3 I 4 1824 16 23 13 21 2732
20 4 I I I 16 22 1230 40 15 156 I 8 I I 10 12 23 23 13 22 22 18 20 I 5 13 12 I 1 26 I 4 17 1231 9I I 15 I 815 21 227 5 I 516 I 0 I 7 I 3 16 16 15 I 7 I 7
613547895 I 497 I 91 101 70 63 83 9049 77 62 54 62 67 829677 7378 54 73 66136507950 I 34461295951 96 66 9359 70 58 4360 65 57 88 50 79
214156
Includes capital outlay. Detail may not add to total due to rounding. Includes vendor payments under welfare programs. Institutional care of the needy, administration of welfare activities; and health, hospitals, sewerage and other sanitation expenditures.Includes financial administration.Includes housing and urban renewal, water transport and terminals, air transportatio n , parks and recreation, correction, unemployment compensation, and all other unallocable.
SOURCE: "Governmental Finances In 1968-69," Series GF69 No. 5, U. S. Department of Commerce, Washington, D. C., September, 1970.
39

CHART 9
HOW STATE GOVERNMENT DOLLARS ARE SPENTO perating E xpenditures— By Functions
S tate of H aw aii— Fiscal 1970
STATE GENERAL FUND STATE GENERAL AND SPECIAL FUNDS
O
LIBRARIES & OTHER EOUC. $6,778,388 — 1.50%LIBRARIES & OTHER EOUC. $6,779,398 — 1.19%
NOTE; See Table 32 for further detail.SOURCE; Compiled by The Tax Foundation of Hawaii from the 1970 Annual Report of the Comptroller. State of Hawaii.

TABLE 32
STATE GOVERNMENT OPERATING EXPENDITURESS tate of H aw aii— S elected F iscal Years®
F u n c t ions 1970 1969 1968 1965
Total $570,2 1 5 , 5 3 9 $480,624,751 $416,453,187 $229,015,909
I960General G o v e r n m e n t - Control $ 10,325,822 $ 9, 6 3 0 , 0 0 5 $ 6 , 7 34,529 $ 4 , 4 41,709 $ 4,302,763
- Staff 20,51 2 , 1 9 4 2 1 , 6 8 5 , 8 3 8 16,583,843 9, 9 4 0 , 2 2 0 6,494,025Public Safety - Pol i c e & Fire 120,659 86,415 80,772 63, 8 6 3 161,874
- O ther P r o t e c t i o n 24,68 9 , 7 0 9 19,835,561 20,27 2 , 7 4 9 16,107,114 22,475,120Highw a y s 11,889,788 45,01 3 , 1 1 2 3 6,222,695 17,685,546 12,321,368Natural Re s o u r c e s 14,588,591 15,230,787 13,963,018 8, 9 1 0 , 3 7 3 4,668,849Health 4 S a n i t a t i o n 8 , 5 68,303 7 , 4 06,212 6 , 8 98,657 4 , 4 96,612 5,134,440Ho s p i t a l s 4 Institutions 2 7 , 0 1 8 , 7 1 8 2 0 , 9 2 9 , 8 5 7 18,628,288 11,951,948 9,752,304P u b l ic W e l f a r e 4 8,795,697 37,61 4 , 5 7 7 3 1,436,433 14,930,618 8,571,051Ed u c a t i o n - H i g h e r 76,55 0 , 4 3 8 7 2 , 8 4 i , 7 i 2 63,00 7 , 3 5 2 28,50 0 , 4 9 0 9,796,374
- P u b lic Schools 134,533,591 119,301,252 104,684,433 5 9,474,659 39,135,711- Libraries 4 Other 6 , 7 7 9 , 3 9 8 3,795,891 3,945,427 1,882,057 1,241,080
R e c r e a t i o n 1,345,632 2, 1 7 4 , 3 0 0 2 , 0 84,485 478,437 1,183,392U t i lities 4 O t h e r Ent e r p r i s e s 18,642,460 2 1 , 5 4 1 , 7 3 3 15,627,069 7,977,221 9,342,738Interest^’ 12,290,347 10,025,631 7,763,717 5,617,357 3,627,762Bond R e d e m p t ions^' 15,868,000 15,434,200 13,633,600 8,648,000 5,267,000R e t i r e m e n t 4 Pension 23,58 0 , 9 8 6 2 2 , 5 2 8 , 1 2 5 18,886,717 10,529,379 6,511,061Employees' Health & Hosp. Ins. 4, 8 7 0 , 2 0 8 4 , 5 79,056 3 , 5 65,773 2,041,443 -Salary Increases 4 Adjustments'^ 4 , 8 53,674 -- -- -- 2,788,179U n e m p l o y m e n t C o m p e n s a t i o n 17,376,995 12,097,725 13,760,670 10,982,661 5,880,833G r a n t s - l n - A i d to Coun t i e s 13,606,944 12,442,228 11,427,103 -- - M i s c e l l a n e o u s 7 , 9 74,097 6 , 4 3 0 , 5 0 4 7,245,857 4 , 3 56,202 2,287,123Cash Capital Improvements'^________________ 65,431_,295__________ --_________________--___________________--__________________ --______
$160,943,047a. Includes general and special fund e xpenditures. Interfund transfers elimi n a t e d to avoid duplication.
C hanges in method of r e p orting make 1970 not strictly c o m p a r a b l e with prior years.b. Debt s e rvice reimb u r s a b l e from highway funds Included in Highways; from a i rport funds under Utilities; from
Sand Island receipts. Land Revolving, and Veterans' Home Loan funds under Miscellaneous.c. A mounts not al l o c a t e d by function.d. Cash for capital improvements; includes federal funds; a l l ocated by function prior to 1970. 1970 amount
Includes $ 4 3 , 3 7 0 , 0 8 2 in special funds (highways, $36,302,000; natural resources, $779,715; utilities and o t h e r e n t e r p r i s e s , $6,117,271; and miscel l a n e o u s , $171,097).
SOURCE: C o m p i l e d by the Tax Found a t i o n of Hawaii from the Annual Reports of the C o mptroller, Department ofA c c o u n t i n g and General Services, State of Hawaii.
TABLE 33
OPERATING EXPENDITURES*— CITY AND COUNTY OF HONOLULUS elected Years
Fiscal Years^ = = 1 Calendar Year
Object of Expenditure 1970 1969 1968 1965 1959General Government
Control $ 987,540 $ 929,204 $ 818,550 $ 1,218,722 $ 454,892Staff 1 1 ,34),885 8,830,207 7,025,200 4, 181,397 2,059,180
Public Safety Poli ce & Fire 22,577,564 18,484,216 17,290,074 1 1 ,674,742 6,845,536Other Protection 5,500,670 5,098,041 4,237,765 3,088,973 1 ,415,610
H ighways 7,466,637 6,830,733 6,522,386 5,514,009 5,675,871Health, Sanitation 8,781,625 7,823,540 7,405,439 6,440,713 3,733,925Hospitals, Inst. - - - - - - 63,456 (b)Public Wel fare - - - - - - 941 ,084 1,800,293Public Schoo1s 50,752 - - 156,817 6,627,900 6,224,887Recreation 7,910,540 7,033,937 5,908,369 4,117,045 2, 172,812Interest 5,900,212 5,437,080 5,175,686 4,831,218 2,713,321Bond Redemption 10,522,584 10,773,462 9,572,210 7,080,711 2,763,055Pension & Retirement 5,634,548 5,843,784 4,515,856 3,705,102 2,071,504Urban Redevelopment 4,621,131 4,826,834 2,604,757 1 ,673,392 553,845Miscellaneous 2,507,520 1 ,602,608 1,544,253 392,086 1 16,697Cash Cap. Improvement 12,089,646 12,837,103 11,753,622 7,308,069 --Total S105.892.855 $96,350.749 $84,530,964 $68.858.619NOTE: Detail may not add to total due to rounding.a. Includes all funds expended by the county, Including state-ald grants to county,
except: certain bond, revolving and Act 97, SLH 1965 fund expenditures, loan payments and urban redevelopment real estate purchases. Note that certain functions were transferred to the State after 1965, Including school maintenance, hospitals, and public welfare.
b. General hospital amount not shown In Annual Financial Reports.SOURCE: Finance Director's Annual Financial Reports (Controller to I960), City and
County of Honolulu, State of Hawaii.
TABLE 34
OPERATING EXPENDITURES*-COUNTY OF MAUIS elected Years
Fiscal Years Ca1endar YearsObject of Expenditure 1970 1969 1968 1964 1959Genera1 Government
Contro1 $ 218,524 $ 174,722 $ 172,766 $ 180,641 $ 126,978Staff 1 , 125,143 1,1 12,450 1 ,069,400 774,577 569,356
Pub1i c Safety Po1ice & Fire 2,327,863 2,145,514 1 .962,263 1,477,714 1 ,050,305Other Protection 187,233 155,657 192,280 104,445 112,817
Highways 1 ,719,090 1,929,71 I 1 ,444, 542 1 ,069,614 895,601Health & Sanitation 431,043 500,040 354,881 286,106 207,297Hospitals & Institutions 190 70 175,172 2,662,665 1,840,314Public We1fare 36,259 40,127 34,957 25,976 141,684Pub1ic Schools 74,839 128,434 15,547 818,340 487,736Recreation 939,932 1,048,832 751 ,535 459,553 240,770Utilities - - - - — 180,602Interest 364,673 385,415 223,256 245,628 187,061Bond Redemption 619,529 620,404 620,404 514,404 319, 168Pension & Retirement I,042,551 1, 142,403 979,705 786,032 548,975Misce11aneous 334,853 257,607 263,064 1 12,807 42.430Cash Capital Improvement^ 390.051 _ _ __ _ _
Total $9,811,773 $9 ,641 ,386 $8,259,772 $9,518,502 $6,951,094July-June fiscal years begun July I, 1966 after a six-month transition:period. Certain county functions, Including school maintenance, hospitals and public welfare transferred to the state after 1965.
a. All funds expended by county with the exception of certain revolving and bond fundexpenditures, loan repayments and Act 97, SLH 1965 expenditures. Interfund transfers eliminated to avoid duplication.
b. Cash capital Improvements allocated to the appropriate function prior to fiscalyear 1970.
SOURCE: Annual Reports of the Auditor through 1968; 1969 and 1970 Finance Director'sAnnual Financial Reports, County of Maul, State of Hawaii.
4 2

TABLE 35
OPERATING EXPENDITURES*— COUNTY OF HAWAIIS elected Years
Object of Expenditure I970<*F1 sea I Years CaIendar Years
1969 1966 1964 1959General Government
Control Staff
Public Safety Polivr & FIre Other Protection
HIghwaysHealth & Sanitation Hospitals & Institutions Public Wel fare Public Schools Recreation Interest Bond Redemption Pension & Retirement Pay Adjustment^MiscellaneousCash Capital Improve.^
$ 266,592 $ 167,266 % 139,402 $ 178,211 $2,071,188 2,381,365 2,110,741 2,272,501
3,540,940 402,286
I ,254,599 377,587
55,024 I 44,865
I,247,019 279,244 799,130
I,424,583
429,909 I,285,29 I
2,956,078 841,102
2,313,491 372,809
4,869 37,332 55,561
I ,596,202 303,806 729,267
I ,519,140
283,882
2,828,136 263,424
I ,684,903 226,913
804 25,955 25,868
I ,275,091 511,917
I , 180, 126 I ,275,235
432,433
I,873,065 149,550
I ,386,268 121 ,355
3,116,119 7,557
2,187,514 570,154 415,015 683,510
I ,072,925
148,694
131,734 583,032
I ,326,667 95,266
I ,309,485 87,150
2,566,41 I 256,659 818,436 433,992 182,481 304,571 699,227 551 ,546 64,873
Tota I $13,578,257 $13,562,170 $11,980,948 $14,182,438 $9,411,530NOTE; July-June fiscal years begun July I, 1966 after a six-month transition peri
od. Certain county functions. Including school maintenance, hospitals and public welfare transferred to the State after (965.
a. All funds expended by county with the exception of certain revolving and bond fund expenditures, loan repayments, SLH Act 97 fund and, from 1967, Hilo Hospital special fund. Interfund transfers eliminated to avoid duplication.
b. Amount not allocated by functions.c. Cash capital Improvements allocated to the appropriate function prior to fiscal
year 1970.d. 1970 data preliminary.SOURCE: Annual Reports of the Auditor through 1968; Finance Director's 1969 Annual
Report; and 1970 preliminary data from the Finance Director's Office, County of Hawaii, State of Hawaii.
TABLE 36
OPERATING EXPENDITURES*— COUNTY OF KAUAI S elected Years
Object of ExpenditureFiscal Years Calendar Years
1970 1969 1966 1964 1959General Government
Control $ 198,354 $ 162,319 $ 163,997 $ 148,044 $ 126,184Staff 860,968 783,420 684, 1 12 387,217 280,937
Public SafetyPolIce & Fire 1 ,702,633 1 ,648,750 1,571,988 1,136,041 825,301Other Protection 179,651 175,29 1 258,101 139,811 107,764
Highways 1,364,131 1 ,340,452 1,218,651 794, 1 15 696,000Health & Sanitation 208,238 441,986 241,162 1 1 I ,358 138,129Hospitals & Institutions - - - - - - 720,296 507,884Public Welfare - - 321 48 3,662 154,041Public Schoo1s 41 ,492 39,981 - - 430,581 464,361Recreation 392.507 443,952 386,650 251 ,815 175,475Interest ■ 95,814 105,411 125,179 92,844 124,332Bond Redemption 262,46) 267,373 245,027 230,027 231 .597Pension & Retirement 692,438 696,451 599,089 547,259 293,705Salary Adjustmentb 2,261 14,890 - - - - 456,675Cash Capital Improvementc 667,824 - - - - - - - -
Misce11aneous 267,029 212,441 137,766 83,025 58,913Total $6,935,801 $6,335,038 $5 ,629jJ770 $5,076,095 $4,641,298NOTE: July-June fiscal years begun July I, 1966 after a six-month transition period. Cer
tain county functions. Including school maintenance, hospitals and public welfare transferred to the State after 1965.
a. All funds expended by county with the exception of certain revolving and bond fund expenditures, loan repayments and Act 97, SLH 1965 expenditures. Interfund transfers eliminated to avoid duplication.
b. Amount not allocated by function.c. Cash capital Improvements allocated to the appropriate function prior to fiscal year
1970.SOURCE; Annual Reports of the Auditor through 1968; 1969 and 1970 Finance Director's Annu
al Financial Reports, County of Kauai, State of Hawaii.
43

OBJECTS OF COUNTY GOVERNMENT EXPENDITURESPercentage D istribution — By Counties
Fiscal Year 1970
CHART 10
G e n e ra lG o v e rn m e n t P u b lic S a fe ty
0% 10% 20% SOURCE: Tables 33-36 inclusive.
3 0 %
R e c re a tio n
R e tire . & P e n
sion
I 9 .5 8 % | 10.63%
9 .18% 10.49%
1WM
i5 66” .
40 % 50% 60 % 7 0 %
9 .98% :
80 %
O th er
7 4 7 % 5.32% 11.42%
@
3 .98% ■
9.47% > 4.64% :
9.63%
9 0 % 100%

TABLE 37
PUBLIC EMPLOYMENT S tate and Local Governm ent Fu ll-T im e E qu iva lent Employees
Per 10,000 P opulation , By Function; October 1969
Public Higher H lth. Police Parks Gen. AllState Rank Total Educ.® Educ. Hwys. Hosp. Fire' Rec.^ Water Con.'^ Other'*HAWAI I 15 441 163______ 60 24 38______ 53 28 10 28 59US AV. 404 163 39 28 46 30 13 22 59Ala. 43 363 141 34 41 45Alaska 3 524 197 36 71 30Arlz. 21 426 174 56 37 26Ark. 47 352 143 36 34 44Calif. 14 444 166 46 20 43Colo. 8 478 196 75 31 48Conn. 42 366 156 24 32 35Del. 17 434 166 62 34 37Fla. 18 433 166 41 26 60Ga. 32 391 149 31 29 72Idaho 19 428 166 48 41 41III. 39 371 152 33 21 40Ind. 41 368 158 48 22 45Iowa 22 424 192 47 36 42Kans. 16 437 180 52 41 49Ky. 50 349 148 38 33 34La. 23 423 173 42 35 50Me. 27 403 170 38 52 27Md. 24 422 179 43 24 47Mass. 28 402 158 15 26 56Mich. 30 399 170 53 21 48Minn. 26 413 180 45 34 49Miss. 35 377 147 43 39 54Mo. 37 375 159 34 25 49Mont. 12 451 161 70 52 38Neb. 5 493 201 59 35 50Nev. 4 524 183 42 48 64N. H. 44 356 132 43 45 29-N. J. 45 355 153 18 23 38N. M. 9 474 188 70 35 44N. Y. 6 489 166 28 24 71N. C. 48 352 158 36 26 34N. D. 13 448 180 72 44 28Ohio 46 353 153 35 23 34Okla. 29 401 159 49 34 43Ore. 10 453 187 62 34 35Pa. 51 342 145 18 28 31R. I. 40 371 134 34 23 36S. C. 49 351 157 26 24 50S. 0. 7 489 230 54 50 31Tenn. 31 396 148 35 34 57Texas 36 377 167 37 28 38Utah 20 428 193 70 32 28Vt. 34 383 148 45 51 26Va. 33 387 170 42 33 37Wash. II 453 175 63 35 35W. Va. 38 375 160 42 46 34Wise. 25 417 i57 61 31 44Wyo. I 598 222 66 67 85D. C. 2 563 173 13 19 74NOTE: Because of rounding, detail may not add to total.a. Includes local libraries.b. Includes natural resources.c. Includes finance administration, and other general government control.d. Includes employees In special schools, welfare, sewerage and other
sanitation, correction, public service enterprises other than water,employment security administration, state liquor stores, and all other general government functions.
SOURCE: "Public Employment In 1969," U. S. Department of Commerce, Bureauof the Census, Series GE69 No. I, April, 1970.
23 2 I 29 22 3827 3325 322426 3525 21 25 2128 25 37 45 28 2019 292523 52 293726 4720 20 26 2529 2738 17 192425 22 19 2426 1630 29 81
10 2 I I 3 1319 159I 320 15 32
12 1 3 I 3 I 719 I I8
toI I I 4 12 1820 21 I I9 18 I 4 10 22 8 17 19 8 6 10 21 I 4 I I 15 19 13 17 1 I 15 29 9
5 36 678 33 554645 84 8556 5 445 5 534455 4 46 7 6 4 6 4 4 6 7 634 6 4 4 6
I 5 4329 16 2630 21 3024 I 6 271920 232515 (8 21 18 23 21 2316 20 3427 40 15 2328 30 1 8 27 21 23 27 23 2215 3416 20 2226 16 25 16 23 33
51 1015238 7950 52 63 59464456394745 41 52 45 58 654348404049 74 7 I48 5 I 6110545524945 5557724846 624441 464973 4651 61161
45

TABLE 38
AVERAGE MONTHLY EARNINGS OF PUBLIC EMPLOYEESS tate and Local Governm ent Fu ll-T im e E qu iva lent Employees^
O ctober 1969: By Functions
State Public Higher HIth, Police Parks Gen. AllState Rank Av. Educ.^ Educ. Hwys. Hosp. Fire Rec.^ Water Con.^ Other^HAWAII 4 $735 $715 $ 874 $ 718 $629 $785 $670 $ 726 $786 $706US AV. 644 680 755 567 510 693 587 59 I 595 62 IAla.Al aska A r iz. Ark.Cal i f . Colo . Conn. Del . Fla. Ga. Idaho III. Ind.Iowa Kans. Ky.La.Me.Md. Mass. Mich. Minn. Miss. Mo. Mont. Neb. Nev.N. H. N. J. N. M. N. Y. N. C. N. D. Ohi o Okla. Ore. Pa.R. I . S. C. S. D. Tenn. Texas Utah Vt.Va. Wash. W. Va. Wisc . Wyo.D. C ^
481
I 4 502
24 8
2527 4743 I I 23 2238 40 453915 I 73 10 5 I28 31 369
33 I 3 355
34 30 204416
194941 46 37 21 26 296
42 12 32
492 886 674 439 82 I 597 704 595 580 494 516 687 601 602 544 527512 531 668 647 742 692 428 579 562 554 696 558 677 556 734 556 565 6 I I513 658 639 623 488 524 504 551 604 593 579 717 519 687 562 707
508806740456849595739726647548 531 743 685 629 569549 528 551730 670 802731 447 605 601 595 712582 764 593 81 I 559583 645 545648 693 700 497 541 548 554 583 599 626 739 563 697 615 715
690 I ,000
820592892715768485658552614819735774709717650446669698754923563707 640 604 770 655 648665 785 741693 735 655 815 783708694 652 592 774 795 715 693 789 708666691 919
378 I .036
585 397 812557 602526 487 440 525 682447 543 497448 456 515 603 641 678 661 340558 623 519 717 464 59 I 501 640 525 483 564 410 688 546 509 431 512 402 534 600527 436 745 392 591 595 791
undatlon of Haw and other loca
386 523 513671 875 808486 646 585317 438 488668 882 757526 618 552607 739 633507 651 519439 636 482394 517 454435 489 512542 679 594428 578 445442 632 550405 536 563414 503 437420 506 531514 551 536558 705 62255! 692 540597 797 671516 707 643321 457 433444 626 640407 478 582399 577 514565 749 676480 546 585522 691 565392 556 525592 816 597500 560 547416 548 467463 671 610377 507 447517 684 623566 636 596505 618 606379 498 515363 512 588379 583 406410 608 467460 578 630650 562 527463 614 553564 722 716396 491 491531 690 630400 514 534674 787 766
October 1969 payroll data. I school staff, and local library
422 I ,222
552 359 822588 70144 I 488 433 420 627 454 594 533 522 388 464 531 557 665 641 399 514506 590 683507553 385 77245 I502 572 436 634589503 426 494 506 480 560 552 472 648 382 663 530 448
514932541416785527 70 1528 576 524 436 570 434 518 458473 513 503 671 610 669 602474 436 445 456 690 570 588 545 687 506 510 531 51 1 592 547 561 473 414 527516517 559 536 606 441 640 485 812
484 954 585 418 804 578 689488 534 467 519 635 528 547492493489 568 590 670 707 588 417 550 524 562 695 544 564 495 709485567 547 492 618 592 572 488 476 503 505 549568 517 703 470645 508646
a.b.
c.d.
Computed by the Tax Fo Includes Instructional personneI.Includes natural resou Includes finance admin Includes special schoo 1 1 on , publ i c service e administration, and a
rces.Istratlon and other general control.I, welfare, sewerage and other sanitation, correc- nterprlses other than water, employment security I other general government functions.
SOURCE: "Public Employment In 1969", U. S. Department of Commerce, Bureauof the Census, Series GE69 No. I, April, 1970.
4 6

EMPLOYEES’ RETIREMENT SYSTEMR eceipts, Expenditures, and Reserves
S tate of H aw aii— S elected Fiscal Years (In Thousands)
TABLE 39
1970 1969 1968 1965 I960SOURCE OF RECEIPTS
Retirement System ContributionsState $ 16,957 $ 16,913 $ 12,849 S 7, 123 $ 4,796Counties 5,790 6,378 5,017 4,012 2, 123Emp1oyees 21 ,807 18,704 16,913 9,464 5,927
Social Security Contributions*State and Counties 10,083 8,647 7,208 3,644 2, 189Employees 10,653 8,647 7,207 3,643 2,188
Administration 338 294 253 201 176Earnings from Investments 14,795 15,041 14,067 8,579 4,864TOTAL $ 80,423 $ 74,624 $ 63,514 $ 36,666 $ 22,261
OBJECT OF EXPENDITURESAdministration $ 337 $ 294 $ 253 $ 201 $ 176Benefits 19,885 I 8,070 14,654 5, 147 4,067Refunds and Withdrawals 2,737 4,827 1 ,870 3,058 1 ,753Social Security 20,704 17,294 14,415 7.287 4,377TOTAL $ 43.663 $ 40.485 $ 31 . 172 $ 15.693 $ 10.373
CASH AND INVESTMENTS AS OF JUNE ?P.Cash $ 4,281 $ 617 $ 2,493 $ 4,638 $ I ,887Certificates of Deposit 24,108 20,993 16,840 7,378 12,896Investments (337,602) (315,570) (287,370) (215,664) ( 122, 129)
Bonds 116,411 122,620 128,111 124,180 82,888Stocks 137,307 115,974 86,403 46,555 16,940Mortgages 83,884 77. 107 72,856 44,929 22,301
TOTAL $365,991 $337.311 $306,703 $227,680 $136,912MEMBERS IN SYSTEM 38.9 36.4 35.4 28.7 24. IEARNINGS AS % OF INVESTMENTS^ 4.0« 4.4^ 4.5;t 4..I? . 4.0?NOTE; 1970 preliminary data pa. Calculated by dividing socb. "Earnings from Investments SOURCE: "Finances of Employee
the Census GF 69, No. "Annual Reports of th
repared by Employees' Retirement System. Footnotes not applicable, iai security disbursements In half." divided by total "Investments."-Retirement Systems of State & Local Governments," U. S. Department of Commerce, Bureau of 2, Mar. 1970; GF 6 8, No. 2, Feb. 1969; GF-No. 2, Jan. 1966; G-GF6O-N0 . 3, April 1961; and
e Employees' Retirement System of the State of Hawaii," Publications No. 32, 37, 40, and 41.

TABLE 40
COMPENSATION RATES IN SELECTED POSITIONSPrivate Industry and S tate-County Governm ents
Job Class i fI cat i on
Prlvate Industry®
Min. Max.
State-County Governments® Min. Max.
Prlvate I ndustry
Median Mean
State-County Governments Median Mean
Monthly Salary Rates Account Clerk $442 $Bkkp. Mach. Oper. 396Cashier 382ClvlI Engr. (Entry) 737 ICivlI Engr. (Lie.) 983 IClerk 383Clerk, Jr. 349Clerk, Sr. 469Clerk-Steno. 399Custom. Serv. Clerk 414Draftsman 557Engr. Draftsman 624Instrumentman 590Keypunch Oper. 396Med. Lab. Tech. 617Nurse, Practical 417Nurse, Staff 622Rodman & Chalnman 400Secretary, Private 541Switchboard Oper. 373Sw 1tchboard-Recept. 366Typist (Junior) 341
Hourly Wage Rates Auto Mechanic $2.79Auto Mech. (Helper) 2.70Bldg. Malnt. Man 2.56Carpenter (Malnt.) 2.93Cook, Asst. 2,24Cook, Gen. 2.61Electric. (Helper) 2.53Electric. (Malnt.) 3.31Groundskeeper I.97Janitor (Heavy) 2.18Jan I tor (LIght) I.96Kitchen Helper 2.14Laborer (Heavy) 2.19Laborer (LIght) I . 95Pai nte r (Malnt.) 2.93P 1umber (Malnt.) 2.94Stock Select. Clerk 2.40Truck Drl ver A > 2. 34Truck Driver B^ 2.63Truck Driver C^ 3.33Watchman (Night) 1.96Welder (Malnt.) 2.58
614 525 529
,033 ,480 533 472 645 560 559 771 870 9 I 8 555 790 557 760 515 751 513 489 463
$4. 15 3.803.72 4.35 3. 16 3. 493.73 4.71 2.84 3.082.59 2.57 3.22 3.694.414.74 3.28 3.253.42 3.882.60 4.20
$480 435 480 675 949 4 I 4 357 480 457 480 457 675 675 414 709 480 709 504 583 375 41 4 375
$3.592.703.433.432.70 3.232.703.592.312.31 2. 152.31 2.35 2.3!3.433.59 2.39 2.52 2.87 3.06 2. 163.59
; 612 555 612 861
1,211 529 457 612 583 6 I 2 583 86 I 86 I 529 904 612 904 643 904 529 529 480
$4.503.28 4. 18 4.183.28 3.923.284.37 2.80 2.80 2.62 2.80 2.86 2.80 4. 184.373.053.063. 49 3.72 2.774. 37
i 503 445 458 900
I ,224 425 365 535 460 485 560 739 624 448 676 458 655 447 640 439 400 370
$3.652.943.333.392.75 3. 353.23 3.96 2.372.362.24 2.272.372.243.413.392.75 3.00 3. !6 2.83 2. 303.41
; 509461 451 866
I ,268 443 377 546 474 493 550 752 707 454 704 463 666
478 648 447 409 372
$3.79 3. 14 3.373.57 2.743.343.30 3.93 2.36 2.40 2.212.34 2.502. 393. 493.572.892.90 3. I I3.31 2.33 3.81
> 643 $457 659 904
I ,272 457 357 583 504 643 457 904 861 480 820 643 820 504 820 4 I 4 435 375
607 472 656 904 ,268 472 376 587 530 628 482 867 839 481 825 6 19 802 513 817 447 480 388
$4.152.983.983.98 3. 13 3. 74 2.83 3,962.422.42 2.49 2.67 2.592.423.984.16 3.45 2.78 3. 17 3.54 3.054.16
$4.052.97 3.893.87 3. 10 3.712.88
3.97 2.54 2.52 2.42 2.60 2.622.48 3.944.04 3.30 2.82 3.213.48 2.88
4.04NOTE; Results of sampling 560 private establishments and 14 government
agencies employing 142,788 persons (46.1$ of estimated civilian employee population) during May-July, 1970. Caution must be exercised In making comparisons due to variations among jobs and their fringe benefIts.
a. Average of salary ranges.b. A = Capacity under 1.5 tons; B = Capacity, 1.5 to 4 tons; C = Capacity,
5 tons and over.SOURCE: Hawaii Employer's Council, Research Report; "Pay Rates In Hawaii,
Private Employment, Government Employment," Special Publication Number 91, September, 1970. (Survey conducted by the Council and the State and Counties' Personnel Services departments.)
4 8
TABLE 41
CLASSROOM TEACHERS’ SALARIES: 1970-1971E stim ated Average Annual S alaries and D istribution ''
state
Average S a 1 a ry
Amount Rank
DI str I b ut I ont>Be low $6500
$65007499
$75008499
$8500 $ 9,5009499 10,499
$10,500 & Above
HAWAI1 $10,140 0.156 0-1^ 1 8 . 2 0 . 2 ? 13.456 47.4jU. S. Average 9,265 3.7 15.6 18.4 16.7 14.9 25.8AI abamaC Alaska^ArlzonaArkansasCCaI I forn I Co Iorado^ Connect I cute De I awaree FlorldaCGeorg I a Idahoc I I I)nolse1 ndIanae I owa Kansas Kentucky^Lou IsIanaeMainecMary 1 and Massachusetts MlchIgane MInnesota Ml ssIssIpp I c MIssourleMontanaeNebraskaNevadaNew MampshI re New Jersey New Mexico New York North Carol Ina North Dakota^ Ohio Ok I ahoma OregonPennsyI van 1 a Rhode Island^ South Caro I Ina South Dakota Tennessee Texas UtahC Vermont Virginia Wash Ington West VIrglnla^ WI scons In WyomIng
7,576 13,570 9,285 6,668
I I,022 8,260 9,600 9,780 8,805 7, 7787.059 10,2339,272 9, 129 8,0347, 190 8,3408, 127 10,09 I9,613 10,647 9,271 6,008 8,373 8, 173 8 , 1 2 0 9,5518.297 10,0508,214 I I , 100 8, 1687.060 8,798 7,3609.298 9,300 9,442 7,000 6,793 7,400 8,325 8,073 8,420 8,700 9,520 7,800 9,640 8,687
421
18493
31 129
224046 519 2 I3844 28357 I I4
2050 273336 13 308
322
34452343 17 16 15474841 2937 2624 I 4391025
4.5 0.07.0
49.4 0. I14. I
0 . 0 I .0 I .7
16.244.7 0.0
2.94.2
1 0 . 831.0 12.79. I 0 . 2 0 . 21.2 0.7
84.34.68.517.5 0.07.9 0 . I10.52.0
31.940.012.510.0 0.75.04.0
32.0 49. 427.620.019.75.5 9.2 0. I6.9 0.2
4.6
65.0 0.017.534.6 0. 1
24.017.09.019.325.328.46.318.313.733.738.518.3 28. I15.610.42 . 010.5 I I . 014.728.623.7 3.8
31.88.4
21.53.0
18.428.0 21.1 51 .913.5 16.03.0
33.0 20, 4 34. I20.8 14.2 23.92 0 . 0 19. I 34. 48. I
21.4
14.0 0.015.0 7.211.626.017.0 10. I 27.938.81 0 . 819.216.9 21.5 29. II 3.016.922.718.217.45.0
23.8 3.5
44.429.519.0 21 .419.124.231.15.0
44.617.0 20.517.92 0 . 015.013.331.013.417.2 I i .02 0 . 035.2 26.018.540.925.9 21.8
I I .0 0.015.53.317.2 16.015.017.023.9 I I .59. I
28.919.515.611.2 I I . 0 27. 124.010.9 !9.315.0 27. 81.2
17.4 17. I16.5 24. I16.015.720.715.0 I .68.715.99.8
20. I17.037.4 3.59.4 11.220.831.015.514.016.0 8.3
20.9 21.8
5.04.013.52.518.9 1 0 . 016.536.014.07.73.5
16.911.72 2 . 89.83.019.010.511.915.024.519.1 0.0
I I . 07.813.217.9 15.711.913.6 20.0
2.73.011.98.5
23.619.022.0 0.54.8 5.218. I1 0 . 64.8 12.015.04.8
29.919.1
0.596.0 31 .53.0
52. I9.9
34.5 26.913.2 0.5 3.5
28.730.722.25.43.54.05.6
43.237.752.3 18. I0.07.98.5
10. I32.89.5
39.72.6
55.0 0 . 83.3 18. I1.9
22. I28.020.3 0,0 2.6
4.79.3 4.515.218.831.34.7 15.011.3
a. Limited to classroom teachers excluding principals, supervisors, librarians, guidance and psychological personnel, and related Instructional workers. U. S. average Includes 50 states and the District of Columbia.
b. DetalI may not add to 100$ because of rounding.
c. Percent distributions estimated by NEA Research Division. Maine, Rhode Island, Alabama and Indiana salaries also estimated by NEA.
SOURCE: "Estimates of School Statistics, 1970-71," Research Division,National Education Association, 1970 (copyright 1970).
4 9

TABLE 42
ESTIMATED PUPIL-TEACHER RATIOS AND PER CAPITA DIRECT SCHOOL EXPENDITURES
Pud I I-Teacher Ratios^ Elementary Secondary Total
Per Capita Direct Expenditures - Local Schools^Cap i taI Out I ay Other
TotaI Expend 1tures Amount Rank
HAWAII 23.0 $165.67U.S. Av. 25.0 19.4 22.5 22. 18 I 44.79 167.15Ala. Alaska Arl z. Ark. CalIt. Colo. Conn. Del . Fla. 6a.I daho III.I nd.I owa Kans. Ky.La.Me.Md. Mass. Mich. Ml nn. Mkss. Mo. Mont. Neb . Nev.N. H. N. J.N . M.N.N.N.Oh 1 o Okla. Ore. Pa.R. I . S, C. S. D. Tenn. Texas Utah Vt.Va. Wash. W. Va. Wise. Wyo.D. C.
26. 325.522.5 26.2 26.2 25.925.224.324. I25.325. 1 23. 126. 327.623.225.023.723.824.524.629.422.925.425.719.921.3 26. 524.023.425.420.9 25. I22.430.623.623.322.524.525.019.326.930.5 28. 323.623.225.325.3 22.519.920.9
22.5 12.823.02 1 . 124.5 21.013.519.7 21.4 21.122.319.821.713.016.421.919.617.519.92 1 . 018.518.721.7 20.219.316.823.3 20. I17.323.6 18.021.918.414.421.720.8 20. 8 17.320.717.6 23. I12.725.216.218.523.622.6
17.717.717.8
24. 3 2 0 . 622.723.625.623.5 20. 4 22.02 2 . 823.723.72 1 . 824. I 20 . 819.823.821.92 1 . 622.322.923.4 20. 723.724.019.719.225. I22.320.924.519.5 24. I2 1 . 023.222.722.221.720.9 23. 1 I 8. 825.4 22.226. 8 20.2 21.224.5 24.0 20. 318.819.6
13.40 38.03 21 .37 16.82 18.8216.17 24.1355.47 2 I .66 24. 18 18.50 19.4319.18 19.6615.02 19.7420.48 17.87 38.63 21.16 30.73 32.7113.3719.3716.99 17.89 22.39 22. 18 19.5319.03 27.33 16.24 26.82 16.91I I .68 20.30 24.4715.99 16.8630.0517.06 24.01 34.9623.41 25.57 33, 46 12. 19 27.56 16.28 34.59
99.54217.72 161 .2993.72179.70155.67 145.45145.68138.41 I 17.59 I 15.54140.76141.22172.22 139.60105.39 121 .65 I I 3.96 161 .77129.99 165.87 I 77.3498.63131.69 146.50145.52 163.93104.82152.53171.39 191 .23104.99138.76 129.08 I 16.82 175.68 137.30 I 15.52 105.52 159.0699.31121.83 I 58.95120.41 I 20.35165.42 I 14.54 I 46.93189.73
M2.95 255.76 I 82.67 I 10.55 198.53 171.85169.58 20 1 . 15 160.07 141.78134.05 160.19 160.41191.88 154.63125.14142.14 131 .84200.40 151.16 196.60210.06 112.01151.06163.49163.41186.33127.01172.07190.42 218.56 121.23165.58 145.99 128.70 195,98 161 .77 131.51 122.38189.1 I I 16.38 I 45.85193.92 143.83145.92198.88 126.73174.50206.01194.33
17 518
20215
293839 28 27133045 37406
31 93
50322425 1643 1914 2
47 2333 42 10264146 I 54835 123634 7
44184
NOTE: Data on per capita expenditures do not correspond with Table 31 since expenditures for supervision of local schools, state schools for the handicapped, and other similar special educational programs have been eliminated.
a. Estimated for the 1970-71 school year by dividing public school fall enrollment by number of classroom teachers as reported by the National EducationAssoclat I on.
b. As reported by the U. S. Commerce Department for fiscal 1969. Detail may not add to total due to rounding,
SOURCE: "Estimates of School Statistics, 1970-71", Research Division, NationalEducation Association, 1970 (copyright (970); "Governmental Finances In 1968-69", Series GF69 No. 5, U. S. Department of Commerce, Washington,D. C., September, 1970.
5 0

TABLE 43
HAWAII PUBLIC SCHOOL COSTSS elected Fiscal Years®
Object of Expenditure 1970 1969 1968 1965 I960A d m l n 1s t r a t 1 on $ 9,125,802 $ 7,207,797 $ 7,480,337 $ 3,280,724 $ 758,895Instruction; Personal Services 83,495,906 69,168,512 64,644,574 38,534,755 33,026,284
Supplies $ Other 6,602,974 8,504,662 6,717,778 5,426,971 2,349,566Food Services; Personal Services 5,073,293 4,900,819 3,873,085 3,210,730 (
Supplies 6,945,547 8,519,337 7,692,856 5,616,825 ( 3,I22,509«Attendance $ Health Services 2,129,738 2,287,646 2,027,947 1,129,659 (Pupil Transportation Services 2,486,028 1,684,704 1,185,151 525,546 (Operation of School Plants 4,826, 1 1 1 4,450,557 3,697,525 3,223,608 2,870,291Maintenance of School Plants 6,923,940 7,149,531 5,700,000 2,776,808 2,221,549Retirement, Social Security, Medical
Insurance Contributions 12,292,795 12,174,273 7,129,217 4,865,294 2,251,518Workmen's Compensation^ 141,909 294,206 403,067 528,846 41,2071 n teres t 1,589, 1 16 1,728,352 1,872,732 2,077,948 1 ,248,569Debt Retirement 4,474, 1 13 4,479,573 4,303,384 3,345,833 1,433,442S u b - T o t a 1 $146,107,272 $132,549,969 $1 16,727,680 $74,543,547 $49,323,830Capital Outlay'^ $ 31,501,104 $ 17,250,209 $ 17,831,155 $13,219,292 $ 3,757,853Adult Education 4 Other Projects 1,165,302 2, 122, 104 1,901,256 1 ,279,865 “ 263,537Technical Schools -- 655,307 796,678 1 ,365,534 (e)Pub lie L 1brarles 5,371,887 3,355,612 2,964,224 1,773,441 - -
Summer School 588,340 558,038 552,768 -- --
Athletic Funds 678,814 532,302 504,637 -- --Tota 1 $185,412,719 $157,023,541 $141,278,398 $92,181,679 $53,345,220Average D a i ly Enrollment 179,364 171,957 168,347 158,787 140,331Average Daily Attendance 167,444 160,366 158,1 I 1 148,702 132,014NOTE; Data prior to 1965 not strictly comparable due to a revised method of reporting.a. Includes expenditures from federal,, state and county funds, but does not 1nc 1 ude a 1 1 costs attributable to opera-
tion of educetlon department.b. Includes unemployment compensation from 1965 onward.c. Bond fund expenditures not Included.d. Includes $781,148 for vocational rehabilitation.e. Breakdown not available, but Included in total.SOURCE: Annual Reports of the Department of Education, 1960-1968; 1969 and 1970 data from Office of Business
Services, Department of Education, State of Hawaii.

C H A RT 11TRENDS IN HAWAII SCHOOL ENROLLMENT
19G0-1970 Fall E nrollm ent
(000)
<71K>
/‘V S o ^ X
247,125
1960 1961 1962 1963 1964 1965 1966 1967 1968 1969 1970
NOTE: 1970 data prelim inary.a. Includes enro llm ent fo r partia l as well as fu ll federal impact-area aid.b. Fall fu ll- and part-tim e enro llm ent in day tim e cred it courses. Includes U niversity of Hawaii system, and enrollm ent in techn ica l schools.
SOURCE: Department o f Education, Research and S ta tis tics D ivision, State of Hawaii; U niversity of Hawaii.

TABLE 44
UNIVERSITY OF HAWAII C urrent Incom e and Expenditures— S elected Fiscal Years^
1970 1969 1968 1965 19-60
For Educational Purposes $(84,333,326)Federal Funds 28,044,561State Appropriations 50,557,525^University Funds ( 5,731,240)
Student Fees^^ 2,974, 144Departmental Earnings 591,078Gifts and Grants 2,009,941AlI Other 156,077
For Non-EducatlonaI Purposes ( 5,651,177)Auxiliary Enterprises 5,369,226Other Sources____________________________ 281 ,951
REVENUES $(69,647,772)
27,918,104 37,346,232
( 4,383,436) 2,548,037
912,364 709,916 213,I 19
{ 4,877,385) 4,609,513
267,872
$(62,995,121 ) 26,626,945 32,557,646
( 3,810,530) 2,240,806
459,729 932,263 177,732
3,805,184) 3,453,699
$(30,444,974) I I ,892,687 16,365,908
{ 2, 186,379) I ,286,289
82,789 657,974 159,327
2,516,858) 2,273,142
$( 10,761,840) 2,118,051 6,20 I ,074
( 2,442,715) I ,942,244
155,300 178,623 166,548
I ,534,638) 1,214,118
(
(71U>
TOTAL REVENUES $ 89,984,503
For Educational Purposes $(80,403,928)Instruction & Re I. Act. 27,549,288Community Colleges*^ 8,142,576Organized Research 18,351,345Extension Service 3,731,340Libraries 2,545,409Plant Oper. & Malnt. 2,884,771Public Services 10,662,782Admin. & General Expenses 6,536,417
For Non-EducatlonaI Purposes ( 5,186,545)Auxiliary Enterprises 4,858,188Others_____________________________________328,357
$ 74,525,157 $ 66,800,305 $ 32,961,832EXPENDITURES
$(69,151,462) 22,980,183 5,701 ,671 16,867,400 3,229,3532, 145,9073, 121,293 10, 158,3434,947,312
( 4,623,787) 4,146,518
477.269
$(63,058,398) 20,994,903 3,425,471
15,912,308 I ,353,574 I ,850,293 2,712,564 I I ,66 I .200 5,148,085
( 3,564,333) 3, 195,984
368,349
$(30,476,321) I I ,200,347
7,542,966 I ,049,591
815,353 I ,316,226 7,090,756 1 ,461 ,082
( 2,219,712) I ,999,670
220,042
$ 12,296,478
$( 10 4
( I
,563,533),890,266
,937,771 888,471 334,425 819,281 957,132 736,187 ,438,645) , 108, 108 330,537
TOTAL EXPENDITURES $ 85,590,473 $ 73,775,249 $ 66,622,731 $ 32,696,033 $ 12,002,178Encumbrances of funds not Included not absolutely comparable between Since 1962, fees from special prog Certain technical schools formerly System.Includes appropriated rece Education for Hawaii Techn Act Income; and others.
SOURCE: Business Office Data, and Financial Reports, University of Hawaii.
d.
In expendl years becau rams only.under the Department of Education transferred to the new Community College
ture data; revenues may Include advances by federal agencies, se of changes In reporting.
Detal I
Ipts; e.g., $1,801,316 Leahi Hospital receipts; $312,671 transfer from Department of leal School (Hawaii Community College); $280,193 Increase from Investment of MorrI I I

TABLE 45
DIVISION OF AIRPORTSD epartm ent of Transportation— S tate of Hawaii
Revenues and Expenditures— S elected Fiscal Years
1970 1969 1968 1965 I960
Fuel Tax^’A irport Use Fees Concessions 4 Other Rentals Bond Funds Federa1 Grants A 11 Other Revenues
$ 4,601 ,581 321,773
6,466,635 63,842,499 2,313,948 2,660,71 1
REVENUES^$ 4,068,103
10,338 5,279,769
39,270,321 1,377,016 1,165,686
$3,684,280418,863
3,668,444
363,600 1 ,369,797
$1 ,621 ,614 1,564,754 1,878,539 894,533
2,075,178 238,712
$2,1 16,799 92,478
686,412
2, 146,246 190,962
TOTAL $80,207,147 $51,171,233 $9,504,984 $8,273,330 $5,232,897
EXPENDI TURFS'^Personal ServicesOther Operating ExpensesCapital OutlayBond InterestAll Other Expenditures
$ 2, 1 34,681 2,890,966
62,403,108 5,569,929 1,099,004
$ 1,880,773 2,160,401 15,115,360
954,081 917,028
$1 ,640,251 3,425,808 1 ,518,107
806,754 832,526
$1 ,091 ,865 993,016
2,023, 161 859,275 638,640
$ 718,348 648,820
2,242,715 940 , 159
9,567TOTAL $74,097,688 $21 ,027,643 $8,223,446 $5,605,957 $4,559,609a .
b .
c .
Excludes advances from Treasurer and investments redeemed; Includes general fund appro- pr I ati ons.Rate 3.5t per gallon to 5-21-62, and K thereafter.Excludes bond principal payments since expenditures from bond funds are Included; also excludes investments purchased and transfers.
SOURCE: Consolidated Statements of Receipts and Expenditures, Airports Division, Departmentof Transportation, State of Hawaii.

TABLE 46
DIVISION OF HARBORS D ep artm ent of Transportation— S tate of Hawaii
Revenues and Expenditures— S elected F iscal Yearsa
1970 1969 1968 1965 I960
Wharfage $ 4 ,678,058REVENUES
$4,036,780 $3,579,532 $1 ,418,672 $ 867,526P i 1otage Fees 550,837 482,402 453,747 25 1 ,672 251,771Docking and M o oring Fees 747,268 811,769 577,757 390,184 326,41 8Renta 1 s 2,531,759 2 ,501,600 1 ,861,305 832,785 681,822Sales of Services and Materials 612,061 46 1 ,268 310,207 174,696 136,917Income on Investments 536,842 672,964 394,206 87,536 39,902M i s cel l a n e o u s 135,558 130,302 102,785 42.051 2.822Total Revenues $9,792,383 $9,097,085 $7,279,539 $3 , 197,596 $2,307,178
Admi n 1 stration = $ 526,621E X PENDITURES
$ 409,137 $ 555,846 $ 211,314 $ 144,082Harbor Operations 1,253,940 1,409,016 1,015,013 674,673 406,075General M a i n t enance 900,632 894,037 780,278 461,882 337,528E n g i neering Services and Overhead 296,041 172,505 146,589 74,306 49,866R etir e m e n t Contribution 248,45 1 214,860 165,684 79,444 40,5515$ Surcharge oh Gross Receipts 341,529 303,991 206,463 124,257 78,017Interest on Bonded Debt 1,955,244 2,569,723 1,443,045 355,131 117,000Debt Ret 1rement 395,000 385,000 373,825 385,625 241,000City and County FI reboat 328,952 265,579 249,043 208,927 - -
DeprecI at 1 on 922,956 825,844 752,400 632,748 493,486Ml see 1 1aneous 187,270 128,478 99,375 68,6 10 40,518Total Expenditures $7,356,636 $7,578,170 $5,787,561 $3 ,276,917 $1 ,948,123a. Report of the "public u n d e r taking," as defined in the resolution a u t h orizing issuance of Harbor Revenue Bonds
as all harbors and w a t e r f r o n t Improvements and other p roperties under the Harbors Division, except thosep r i n cipally used for recreation and landing of
b. Includes permits to o p erate small power boats.fish.recoveries for damages to property. and sales of utllitles.
etc.c. Includes cont r i b u t i o n s to the Depar t m e n t of T r a nsportation for general administrative e x p e n s e s : $165,033 In
1970, $134,852 In 1969, $135, 335 in 1968, and $136,596 In 1965 .
<71<71
SOURCE: Audit Section, Annual Reports of the Board of Harbor Commisslone Harbors Division, D e p a r t m e n t of T r a n s p o rtation, State of Hawaii,
r s , I960; and Ac 1965 and 1968-1
countant's Reports, 970 .

oiO '
TABLE 47
DIVISION OF HIGHWAYS D epartm ent of Transportation — S tate of Haw aii
Revenue and Expenditures — S elected Fiscal Years®
1 970 1969 1968 1965 I960R E V E N U E S
F e d e r a l - A i d H i g h w a y sP r i m a r y & S e c o n d a r y $ 3 , 3 5 5 , 7 1 8 $ 2 , 3 9 5 , 5 4 7 $ 4 , 5 3 4 , 0 8 3 $ 4 , 6 6 5 , 2 4 4 $ 4 , 3 7 9 , 2 8 2I n t e r s t a t e & D e f e n s e 2 9 , 5 9 6 , 7 0 5 2 6 , 6 4 0 , 3 6 8 19 , 2 9 9 , 8 3 7 5 , 3 7 1 , 4 9 8D e f e n s e A c c e s s Roads 5 , 0 8 8 -- 2 0 , 2 0 0 1 ,0 1 3,970 __
C o u n t y C o n t r i b u t i o n s -- 8 ,027 __ __ _ _S t a t e Funds
Ge n e r a l Fund Cash 2 , 0 7 8 , 0 0 0 7 , 0 0 0 , 0 0 0 -- -- 8 6 7 , 5 0 0Bon d Rea 1 I zat I on*^ 2 0 , 7 5 6 , 0 0 0 1 5 , 8 3 4 , 0 0 0 1 9 , 3 5 0 , 5 0 0 8 , 5 6 3 , 0 6 4 3 , 4 0 0 , 0 0 0Fuel Tax 1 3 , 0 8 6 , 1 9 0 1 1 , 9 9 9 , 6 1 6 1 1 ,020 , 6 9 5 9 , 3 3 4 , 2 9 7 7 , 5 2 6 , 8 9 01 n t e r e s t E a r n e d 4 , 7 0 9 -- -- 1 51 ,109 4 3 2 , 5 6 4Rental of B u i l d i n g s 45 , 9 0 4 6 9 , 6 2 2 130,188 114,764 2 4 4 , 8 5 4Sal e of Land & C o n d e m n e d Improve. 149,907 3 0 7 , 4 1 0 276,131 145,178 31.595P r i v a t e C o n t r i b u t i o n s 3 5 9 , 9 3 4 8 2 , 3 7 3 140,465 __Mi see 1 1 a n e o u s 19,142 150,915 2 8 , 0 8 5 8.240 1 3.039
T o t a 1 $ 6 9 , 4 5 7 , 2 9 7 $ 6 4 , 4 8 7 , 8 7 8 $ 5 4 , 8 0 0 , 1 8 4 $ 2 9 , 3 6 7 , 3 6 4 $ 1 6 , 8 9 5 , 7 2 5E X P E N D I T U R E S
A d m l n I s t r a t I on $ 1 , 0 48,239 $ 9 1 6 , 5 6 7 $ 8 2 6 , 6 7 6 $ 5 3 0 , 9 5 7 $ 5 0 6 , 2 2 35* S u r c h a r g e 4 0 9 , 5 8 8 3 7 4 , 5 9 3 3 4 3 , 9 1 7 2 9 3 , 5 0 8 __M a I n t e n a n c e 4 , 8 3 3 , 8 7 3 4 , 6 40,941 4 , 0 5 2 , 2 1 4 3 , 0 8 8 , 5 2 2 2 , 2 7 4 , 8 6 6Land A c q u i s i t i o n 4 , 0 6 0 , 5 3 2 5 , 0 6 0 , 9 9 6 6 , 0 9 3 , 9 7 2 4 , 2 9 1 , 6 7 3 __D e s i g n & C o n s t r u c t i o n 4 3 , 5 0 4 , 6 1 5 3 8 , 2 7 0 , 6 2 9 2 6 , 4 0 4 , 0 5 5 15, 127,764 1 2 , 0 1 7 , 5 5 0I n t e r e s t Paid 2 , 1 5 8 , 6 3 7 1 , 9 98,209 1, 8 71,699 2 , 2 5 5 , 3 1 2 2 , 1 4 1 , 1 1 5Mi see 1 1ane o u s -- -- -- - - 139.467Total $ 5 6 , 0 1 5 , 4 8 4 $5 1 ,261 , 9 3 5 $ 3 9 , 5 9 2 , 5 3 3 $ 2 5 , 5 8 7 , 7 3 6 $17 , 0 7 9 , 2 3 1a. E x c l u d e s income fr o m s a l e of i n v e s t m e n t s and r e i m b u r s e m e n t s and e x p e n d i t u r e s for invest m e n t s .
S i n c e bond funds are included, bond pr i n c i p a l p a y m e n t s are e x c l u d e d to e l i m i n a t e d u p l i c a t i o n .b. Bon d fund a p p r o p r i a t i o n s .S O U R C E : Annual R e p o r t s , D e p a r t m e n t of P u b l i c W o r k s , and D e p a r t m e n t of T r a n s p o r t a t i o n , S t a t e of H a waii.
1 9 6 8 - 1 9 7 0 dat a c o m p i l e d by the Fiscal S e c t i o n , D e p a r t m e n t of T r a n s p o r t a t i o n , S t a t e of Hawaii.

THE LONG TERM PUBLIC BONDED DEBT
HAWAII STATE AND COUNTIES
State and looal long-term per capita debt at June 30, 1969 w as$833, $222 above the national per capita average of $611. Only four states have more debt outstanding on a per capita basis. When debt is related to personal income, Hawaii ranks 11th highest in the country. Debt in Hawaii is 174% of tax collections for a ranking of 19th.
Public bonded debt outstanding at December 31, 1970 increased 18% over the 1989 amount outstanding and now totals $742 million. Of this amount, 74% ($545.9 million) are general obligation bonds chargeable directly to general revenues of the State and/or counties. The remaining $196 million are revenue bonds repaid from special earmarked receipts which include airport earnings, harbor funds, fuel taxes, and highway revenues. Other revenue issues included in the total but repaid from earnings or fees include: water utilities. University ofHawaii student housing, and the multi-deck parking structure of the State. The public bonded debt excludes Hawaii Housing Authority revenue bonds (which are backed by the federal government) and Improvement District Bonds of the City and County of Honolulu and HawaiiCounty since they are payable from special assessments made on real property owners.
STATE OF HAWAII
The Constitution of Hawaii limits debt to 3.5 times defined average general fund revenues of the three fiscal years immediately preceding the session of the Legislature authorizing such debt. Underthis provision, the limit on November 1, 1970 was over $1 billion (3.5 times average revenues of $302.3 million).
Total funded debt chargeable to this limit on December 31, 1970 was $759.4 million. Outstanding bonds of $263.4 million amounted to 35% of the funded debt; authorized but as yet unissued bonds accounted for the remaining $496 million (65%). The debt margin was $298.5 million.
In addition, the State has $131.2 million in outstanding and $59.1 million in authorized-unissued general obligation debt for which the State has pledged its full faith and credit but does not count against the debt limit.
Revenue bonds issued by the State equalled $160.8 million, withairport bonds amounting to $130 million constituting the major portion of this sum. Harbor bonds amounted to $29 million. University of Hawaii housing bonds came to $1.2 million, and the multi-deck parking structure added the remaining $0.7 million.
THE COUNTIES
County debt is limited by the Constitution to 15% of the net property valuations within the respective county. At December 31, 1970, general obligation debt outstanding for the four counties was $170.6 million. Of this amount, $156.7 million were county issues, and $13.9 million were issued for the counties by the State but are chargeable against the counties' debt limit and are payable from county revenues. Authorized-unissued bonds amounted to $35 million.
Water revenue bonds outstanding at the end of the year totalled $35.3 million. General obligation bonds of the counties issued for the counties' water authorities and to be reimbursed from water authority revenues amounted to $6.8 million.
5 7

TABLE 48STATE AND LOCAL LONG-TERM DEBT
R elated to Population , Personal Incom e, and Tax Collections D ebt O utstanding a t June 30 ,1969— By States
StatePer Cap i t a Debt Amount Rank
Per Cap. Debt as a ? of Per Cap. P ersona l I n c o m ^ Tax Col lecti o n ^ P ercent Rank Percent Rank
HAWAII 833.44 2 I .22 I I 173.55 I 9U. S. Average 6 I I.46 16.58 160.94A IabamaAlaskaArlzonaArkansasCaI I torn I aCo IoradoC o n n e c t I cutDeIawa reFloridaG e o r g I aI dahoI I I I no I sI nd I anaI owaKansasKentuckyLou IsI anaMa I neMary I andM a s s a c h u s e t t sM lchIganMi nnesotaMississippiMissouriMontanaNeb raskaNevadaNew Hampsh i re New Jersey New Mexico New York North Ca roIi na North Dakota OhioOk I ahoma OregonPennsyI van i a Rhode Island South Ca roI Ina South Dakota T e n nessee Texas Utah Vermont Virginia Wash i ngton West Virginia WI scons i n WyomIn g
of Co IumbI a
582. I ,222.
535. 462. 783. 5 14. 785.
I ,329. 55 I . 485. 255. 512. 348. 300. 453. 729. 726. 37 I . 829. 649. 519. 605. 483. 415. 340. 818. 735. 395. 540. 418.
1,016. 303. 347.4 15. 598. 602. 654. 636. 284. 205.5 18. 584. 562. 543. 415.
I , 190 394 473 739 467
3160
. 18
.81
. 30
.36
.22
.98
. 53
.95
.97
.60
. 48
. 46
. 02
.22
.01
.96
. 79
.29
.56
. I 8
.35
.9 1
.81
. 80
.50
.55
.04
. 56
.87
.56
.54
.9 1 . 86
. I I
.62
.90
.81
. I 7
. 17
.31
.55
. 35
.09
.88
.55
.82
.94
.55
2 I 2
26359
29 8 I
2331 5030444836 12 I 3 436
I 527 17323846 7
I I4 I 2537 4
47453919 I 8 I 4 16495 I2820 222440 3
423310
22. 55 27.41 15.87 18.60 18.26 14.27 I 7.09 32.3815.65 15.828.67
I I .96 9.45 8. 47
12.9925.6 1 26. I I 12.18 20.37 15.62 13.0116.65 21 .79 12.0310.89 22.6916.50 I I .4012.7314.45 22. 8910.51 I I .54 11.1319.65 16.8517.8916.51 10.926. 78
18.45 I 7.93 I 8.7716.73 I 2.55 30.95 15.16 I 3.0522.07 9.90
3 26 I 5 1732 201
28274940 48503554
38 1229 34231 03945 7
254236 316
464143 132 I 192444 5 I 16 I 8 I 4 22372
3033 9
47
259.42 313.09 138.44 209.59 145.06133.32 200.23357.36167.20180.21 78.05
137.50 104.28 77. 32
I 30.78262.76 243.73 120.72 202. 10 143.46121.32 149.00199.77 138.1797.01
226. I I 157.70 132. 13 I 33.00129.36 176.69 I 17.29 102.80 136.02 208.63 155.58 192.81 168.20 I 26.6758. 15
205.37 211.97171.92141.43132.32290.37 150. 12107.92 178.85109.32
5 2
30 9
2734 13I
22164932465038 46
42 12284 I 26 I 431 487
23 373539 I 8434733 1024 I 5 21405 I I I8
20
2936 3
25 45 17
_44_a. C a l e n d a r 1969.b. Fiscal 1969.SOURCE: " Governmental Finances in 1968-69", GF69 No.
Cu r r e n t B usiness", August, 1970, U. S. Dept.5; "Survey of of Commerce.
58

PUBLIC BONDED DEBT IN HAWAIIBonds O utstanding by Agencies and Funds
A t Decem ber 31, 1970 and June 30, 1971a
TABLE 49
Governmental Unit and Funds Charged with Debt Service Costs:
Outstanding December 31,Bonds Issued by:
State Tota I
Estimated Outstanding June 30, 1971Bonds Issued by:
State Counties Tota i_
CJl>o
STATE General Fund^Highway Fund A irport Fund Harbor Fund Land Revolving Fund Sand Island Receipts Veterans' Loan Fund
$(536,123,852) $26 I,I 40,033 69,137,518 18,404,479 10, 154,000 4,855.256 1 ,226,643
10,403,923
$(536,123,852)261,140,033 69. 137,518 18,404,479 10, 154,000 4,855,256 I ,226,643
10
$(526,188,857)254,461 ,363 67,62 I,368 17,777,901 10, 154,000 4,655,027 I , 146,976
.222
$(526,188,857) 254,461,363 67,62 I.368 17,777,901 10,154,000 4,655,027 I ,146,976
,222Airport Revenues^ 130,000,000 _ _ 130,000,000 130,000,000 _ 130,000,000University of Hawaii Revenues^ 1,256,000 -- 1 ,256,000 1 ,244,000 __ 1 ,244,000Multi-Deck Parking Revenues^ 693,000 _ - 693,000 693,000 __ 693,000Harbor Revenues^ 28,853,000 -- 28,853,000 28,853,000 __ 28,853,000CITY 4 COUNTY OF HONOLULU ( 9,607,561) ( 162,900,000) ( 1 72,507,561) ( 8,905,055) 1[ 158,843,000) { 167,748,055)General Fund 9,607,561 113,351.532 122,959,093 8,905,055 109,960,782 118,865,837Highway Fund -- 1 1 ,06i.468 1 1 ,061 ,468 -- 10,834,218 10,834,218Water Fund -- 5,760,000 5,760,000 -- 5,760,000 5,760,000Water Revenues'^ — 32,727.000 32,727,000 -- 32,288,000 32,288,000MAUI COUNTY ( 576,647) ( 9,780,000) ( 10,356,647) ( 499,376) 1[ 9,376,000) ( 9,875,376)General Fund 576,647 7,937,000 8,513,647 499,376 7,572,000 8,071,376Water Revenues^ — 1,843,000 1 ,843,000 - - 1 ,804,000 1 ,804,000HAWAII COUNTY ( 3,191,745) ( 14,737,000) ( 17,928,745) ( 3,052,349) <: 14,737,000) ( 17,789,349)General Fund 3,038,578 13,925,000 16,963,578 2,910,016 13,925,000 16,835,016Water Fund 153,167 96,000 249,167 142,533 96,000 238,333Water Revenues*^ - - 716,000 716,000 _ _ 716,000 716,000
KAUAI COUNTY ( 560,194) ( 4,560,000) ( 5,120,194) ( 524,362) 1: 4,560,000) ( 5,084,362)General Fund 467,842 3,496,000 3,963,842 439,225 3,496,000 3,935,225H 1ghway Fund -- 132,000 132,000 -- 132,000 132,000Water Fund 92,352 932,000 1 ,024,352 85.137 932.000 1 .017.137
Tota 1 $ 550,060,000 $ 191,977,000 $ 742,037,000 $ 559,170,000 $ 187,516,000 $ 726.686.000NOTE: Outstanding debt based on date upon which principal payments are made to the bearers of the bonds.a. Based on gross debt exclusive of cash reserves. Excludes bonds not chargeable to public funds. June 30, 197! data based
on bonds outstanding at December 31, 1970 and do not Include contemplated Issues.b. Includes bonds reimbursable from future Hawaii Water Authority revenues on which legislature granted moratorium on re
payment for 10 years from Initial service.c. Revenue bonds.SOURCE: Prepared by the Tax Foundation of Hawaii from data received from the State Department of Budget 4 Finance and County
Finance Departments.

THE STATE OF HAWAII FUNDED DEBTAm ounts Charged to C onstitu tiona l Lim its^
A t D ecem ber 31
CHART 12
MILLIONS
$400 -
MILLIONS
$300 -
$20 0 —
$10 0 —
$100 —
$ 20 0 —
$300 —
$400 —
$500 -
$600 —
$700 —
$750 —
MARGIN
AUTHORIZEDUNISSUED
OUTSTANDING
412.4
787.2907.6
1,058.0
1960 1965 1968 1969 1970
a. Debt lim its : 1960*1965, 15% of net assessed valuations; 1968-1970, 3.5 tim es defined average general fund ■ revenues of the three fisca l years im m ediately preceding the session of the legislature authoriz ing such debt. The de fin itio n o f debt charged to the lim it has varied somewhat from year to year.
SOURCE: Prepared by the Tax Foundation of Hawaii from data provided by the Department of Budget and Finance, State of Hawaii.
60

CHART 13OUTSTANDING GENERAL OBLIGATION BONDS
S tate of Haw aii — By Fund A t D ecem ber 3 1 — (In M illio n s)
M illio n s M illio n s
$300 — $300
$200-
$ 10 0 —
$200
a. Reimbursable from : A irport Special Fund, Harbor Special Fund, Land Revolving Fund, Sand Island Receipts, Veterans’ Loan Fund, and W orld’s Fair Fund.SOURCE: State Department of Budget & Finance.
61

TABLE 50
COUNTY GENERAL OBLIGATION BONOSS tate of H aw aii— By Counties: D ecem ber 31, 1970
D e s c r iption H o n o 1u 1u Mau I H a w a ii Kaua I A 11 Count 1esAMOyNJ OF GENERAL OBLIGATION DEBT
Issued i Outstanding® $( 139,780,561 ) $( 8,513,647) $( 17,212,745) $( 5, 120,194) $( 170,627,147)State Bonds*> 9,607,561 576,647 3,191 ,745 560,194 13,936,147County Bonds 130,173,000 7,937,000 14,021,000 4,560,000 156,691,000
Authorized-Unissued Debt 35,279,619 — — -- 35,279,619Total Authorized Debt $( 1 75,060, 180) $( 8,513,647) $( 17,212,745) $( 5,120,194) $( 205,906,766)
State Bonds'’ 9,607,561 576,647 3, 191,745 560,194 13,936,147County Bonds 165,452,619 7,937,000 14,021,000 4,560,000 191,970,619
DEBT LIm It a n d MARGINFiscal 1971 Property Values $3,,716,168,650 $310,100,239 $427,151,553 $173,626,122 $4 ,627,046,564
Legal Debt Limits 557,425,298 46,515,036 64,072,733 26,043,918 694,056,985Debt Charged to Limit 126,700,055 8,071,376 16,835,016 5,084,362 156,690,809Debt Margin 430,725,243 38,443,660 47,237,717 20,959,556 537,366,176
DEBT AS A * OF NET ASSESSED VALUESIssued & Outstanding® (3.76*) (2.75*) \ (4.03*) (2.94*) (3.69*)
State Bonds'* 0.26 0.19 0.75 0.32 0.30County Bonds 3.50 2.56 : 3.28 2.63 3.39
Authorized-Unissued Debt 0.95 -- : — -- 0.76Debt Charged to Limit 3.41* 2.60* ' 3.94* 2.93* 3.39*Debt Margin 1 1 .59 12.40 1 1 .06 12.07 11.61
O'N>
a. Based on gross debt exclusive of cash reserves.b. State bonds Issued for county purposes are re I mburseabIe to the State general fund by each respective county.c. State Constitution limits debt to 15* of net assessed property valuations In each county.
SOURCE: Prepared by the Tax Foundation of Hawaii from data received from and verified by the Counties' Departmentsof Finance.

TABLE 51
STATE GENERAL OBLIGATION BONDSS tate of Haw aii — D ecem ber 31, 1970
Principal and Interest Issued and AuthorizedPayments Chargeable to:a______ Out s t a n d i n g But Unissued Tota IGeneral Fund Highway Special Fund A irport S p e cial Fund Harbor Special Fund Land Revolving Fund Sand Island Receipts Veterans' Loan Fund Home Loan Fund University of Hawaii*’ County Funds
H onolulu CIty-County Maul County HawaI I County Kauai County___________
$261,140,033 69, 137,51818,404,47910,154,000 4,855,256I,226,643
10,403,923
9,607,561576,647
3, 19 I,745 560,194
$458,172,417 44,617,78710.915.000
3,597,723
21 I,5005,500,000
21.764.000
$719,312,450 I I 3,755,30529,319,47910,154,000 8,452,979I,226,643
10,615,4235,500,000
21 ,764,000
9,607,561576,647
3,191,745 _______ 560,194
Tota I $389,258,000 $934,036,427Debt service on State issued general against the State's general revenues the Constitution) and special fund a to reimburse the State general fund certain bonds Issued for them by the
Ob I Igatlon bonds however, the cou
gene Ies (by I aw ) a tor debt service c S t a t e .
Is a charge ntles (In re required harges on
b. Either general obligation or revenue bonds may be Issued.
SOURCE: Computed by the Tax Foundation of Hawaii from Informationsupplied by the State Department of Budget 4 Finance.
TABLE 52
STATE BONDS CHARGED TO DEBT LIMIT S tate of H aw aii— Novem ber 1, 1970
Type of DebtGross
1 ndebtednessCharged to Debt Limit
General Obligations - Issued $ 394,529,000 $ 263,354,925
- Unissued 544,778,427 485,647,917
Revenue Bonds - Issued 160,802,000 --
- Unissued 115,485,249 --
Instruments of Indebtedness- Unissued 10,375,000 10,375,000
Tota 1 $1,225,969,676 $ 759,377,842
Debt Limlta $11 ,057,909,408
Debt Margin $ 298,531,566a. Limit is computed by multiplying the average net general fund rev
enues for 1968, 1969 and 1970 ($302,259,831) by 3.5. This debt limit is in effect for authorizations made during the 1971 legislative session.
SOURCE: " C e rtificate of Total Indebtedness of the State of Hawaii asof Nov. I, 1970", Dept, of Budget 4 Finance, State of Hawaii.
6 3

INDEX TO TABLES AND CHARTS— GOVERNMENT IN HAWAII 1971
Airport Finance.................. 54Alcoholic Beverage Tax (See Liquor) Allocation of State and County Taxes... 19Assessed Valuations (See Real Property)
BBalance of Payments.............. 6Bank Deposits in Hawaii......... 6,10Bonds (See Debt)
Excise Taxes.........Cover, 17,18,20,21,32Expenditures
Direct General, Per Capita.......... 39Federal Government.................. . 35General Information.................. 38Hawaii, County of................. 43,44Honolulu, City S County.......... 42,44Kauai, County of.................. 43,44Maui, County of................... 42,44State of Hawaii................... 40,41Visitor.............................. 6
Comparative Data, by StateCorporate Income Tax Rates 2 5Debt, Long-Term Bonded.............. 58Employees, Public.................... 45Expenditures, Per Capita............ 39Income, Per Capita Personal......... 11Liquid Fuel Tax...................... 23Liquor Tax 2 3Personal Net Income Tax............. 24Salaries, Classroom Teachers........ 49Salaries, Public Employees.......... 46State and Local Sales Tax........... 22Tax Burden........................... ISTeacher-Pupil Ratios................. 50Tobacco Tax 2 3
Contracting.......................... 10 ,17Conveyance Tax................... 18,19,33Corporate Income Tax................ 25,32Cost of Living - Hawaii................ 6County Information
Allocation of Taxes............... 17,19Bank Deposits........................ 10Bonded Debt.......................... 62Employment........................... 10Expenditures................... 38,42-44Fuel Tax Collections....... 16,30,31,34Liquor License Revenues 18,19,29-31Motor Vehicle Registrations......... 10Motor Vehicle Weight Tax..18,19,29-31,33Per Capita Personal Income.......... 9Population........................... 8Real Property Data............ 10,26-28Revenues....................... 14 ,29-31State Grants-in-Aid........... 17,29-32Sugar Income......................... 10Unemployment Rate.................... 10
DDebt
County............................... 62Federal.............................. 35General Information.............. 57Limitations..... '.............. 5 7,62 ,63State and Local Per Capita.......... 58Trends......................... 5,60,61
Drugs, States Taxing................... 22E
Earmarked Taxes in Hawaii............. 14Economy of Hawaii
County Statistics.................... 10General Information.................. 4State Growth......................... 6
EducationClassroom Teachers’ Salaries........ 49Enrollment in Hawaii 5 2Expenditures............ 38 ,42 ,43,50 ,51Teacher-Pupil Ratios................. 50University of Hawaii................. 53
EmploymentBy Industry.......................... 12Civilian Labor Force.............. 6,10Government........................ 12,13Trends............................... 13Unemployed................... 4, 6 ,10,12
Estate Taxes..................... 18,19,32
Federal GovernmentAdministrative Budget................. 34
Debt................................. 34Employment in Hawaii.............. 12,13
Grants to Hawaii 20 ,21,29-31,34,56
Military Expenditures.............. 4, 6Tax Collections in Hawaii......... 34,36
Financial InstitutionsBank Deposits..................... 6,10Tax............................ 18,19,33
Food, States Taxing.................... 22
Franchise Tax (See Public Utility)Fuel Tax (See Liquid Fuel Tax)
GGeneral Excise Tax... Cover,17,18,20,21,32General Fund Finances.................. 37
Government Costs by County......... 41-43
HHarbor Finance......................... 55
Hawaii, County ofDebt........................... 59 ,62 ,63
Expenditures...................... 43,44
Grants-in-Aid..................... 29,31Liquid Fuel Tax...................... 16
Personal Income...................... 9
Population Trends.................... 8Real Property Tax................. 26-28Revenues.......................... 29,31
Health Expenditures •County............................ 42-44Per Capita, by State............. . 39
State of Hawaii................... 40,41Highway Finance........................ 56
Honolulu, City and County ofDebt........................... 59 ,62 ,63
Expenditures...................... 42,44
Grants-in-Aid..................... 29,30Liquid Fuel Tax...................... 16
Per Capita Personal Income.......... 9
Population Trends.................... 8
Real Property Tax................. 26-28Revenues.......................... 29,30
Hotel Inventory..................... 6,10Housing Units.......................... 6
I
Income, PersonalPer Capita, by State................. 11
by County............... 9
Sources of........................... 7
Trends............................... 5
Income TaxCollections......... Cover ,14 ,18-21,34 , 35Corporate......................... 25,32Credits........................ 22 ,24 ,32
Personal.......................... 24,32
Rates.......................... 24 ,25 ,32Inheritance Tax.................. 18,19,32
Insurance Tax.................... 17-19,33
KKauai, County of
Debt.......... 5 9 , 6 2 , 6 3
6 4

Expenditures.....................Grants-in-Aid.................... 29,31Liquid Fuel Tax...................... 16Per Capita Personal Income.......... 9Population Trends................... 8Real Property Tax................ 26-28Revenues.......................... 29,31
Labor (See Employment)Licenses and Permits....... 17-19,30,31,33Liquid Fuel Tax
Collections....... Cover ,16 ,18,19 ,31,54Description.......................... 32Rates, by State..................... 2 3
Liquor TaxesCollections............. 18,19,30,31,33Rates, by State...................... 23
MManufacturing in Hawaii......... 6,10,17Maui, County of
Debt........................... 59 ,62 ,63Expenditures..................... 42 ,44Grants-in-Aid.................... 29 , 30Liquid Fuel Tax...................... 16Per Capita Personal Income.......... 9Population Trends................... 18Real Property Tax................ 26-28Revenues.......................... 29,30
MilitaryEmployment by........................ 12Expenditures..................... 4, 6Personal Income Source.. ......... 7Population ^n Hawaii.............. 8
Motor Carrier Taxes (See Public Service) Motor Vehicles
Gasoline Tax (See Liquid Fuel)Registration in Hawaii........... 6,10Weight Tax.............. 18,19,29-31,33
Parking Meter Collections.......... 30,31
Personal IncomePer Capita, by County............... 9
by State................ 11
Sources.............................. 7
Total in Hawaii.................. 5, 6Personal Income Tax................ 24,32
PineappleCanning......................... 6,10,17
Employment........................... 12Tax............................... 17,32Value of............................. 6
PopulationCivilian............................. 8Military............................. 8
Trends............................ 5 , 8Prescription Drugs, Taxing of......... 22Public Service Co. Tax.......... 18,19,33Public Utility Tax........ 18,19,30,31,33
Real PropertyAssessed Valuations........ 6,10,26,27Conveyance Tax................... 18,33Home Exemption................... 26,33Land Use Classes................. 26-28Tax Collections............... 18,28-31Tax Rates 2 8,33
Rentals, County........................ 10Retail Sales........................ 6,10Retirement System, State Employees'.... 47 Re venues
Airports 5 4Counties.................... 18,19,29-31Federal.............................. 35
General Information................. 14Harbors.............................. 55Highways............................. 56Major Sources................. 14,20,29State of Hawaii............... 14,20,21University of Hawaii 5 3
SSalary DataClassroom Teachers.................. 49Private Industry.................... 48Public Employees................. 46,48Sources of Personal Income.......... 7
Sales Tax.............................. 22Schools (See Education)State Grants to Counties........ 17,29-31Sugar
Employment........................... 12Tax............................... 17,32Value............................. 6,10
TaxBurden............................... 15Cigarette......................... 23,33Collections
County................... 18 ,19 ,29-31Federal......................... 34-36State..................... Cover,18-21Trends.......................... 5,36
Conveyance.......... %............ 18,33Corporate Income................. 25,32Credits........................ 22 ,24,32Earmarked............................ 14Financial Institutions........ 18,19,33General Excise................ 17-21,32Inheritance and Estate........ 18,19,33Insurance..................... 17-19 ,33Levied in Hawaii................. 32,33Liquid Fuel.......... 16 ,18,19 ,23,30-32Liquor............... 18 ,19 ,23 ,30 , 31 , 33Motor Vehicle Weight....... 18,19,29,33Per Capita Tax Burden...............6,15Percent of Income................... 15Personal Net Income.............. 24,32Public Service Company........ 18,19,32Public Utility Franchise.... 18,19,30-32Real Property................. 26-28 , 33Sales Tax......................... 22,32Structure - Hawaii............ 14,32,33Tobacco Products................. 2 3,33Trends............................ 5,36Unemployment Compensation... Cover,18,19Use Tax........................... 17,32
Tax Foundation of HawaiiTrustees 6 Officers.. Inside Front CoverDescription.......................... 1
Teachers (See Education)Telephones, by Counties............... 10Tourism (See Visitors)
UUnemployment
Compensation Tax................. 18-21Rate of 6,10 ,12
University of Hawaii.................. 53Use Tax.......................... 17-19 ,32
VisitorsExpenditures..................... 6 ,10Number of......................... 6 ,10
Wholesale Sales Value.............. 6,10

H J 3 8 9 . 5
T391 Tax Foundation of Hawaii, U1971 ___ _____
v e r r m e n t ^ J j i - - H a w a i i
„.:BR,5 .7 yDEPARTMi:’; 7 - ' ' y . ,
e c o n o m ^ 0 , a nP- o. Dox 2.359
»onoluh, Hawa.i .96804
< -I is HX 3 ‘
“ cb.O g> :_
i | i<Q
0) -
3 5< oO «
X o < eo P (O