government of karnataka - · pdf filestate finance commission’s (sfcs) ... introduction...
TRANSCRIPT

Government of Karnataka
Report:
URBAN LOCAL BODIES IN KARNATAKA:
STRUCTURE AND FINANCES
Center for Financial Accountability and Decentralization
Fiscal Policy Institute
Kengeri, Bengaluru-60
December, 2016
ii

iii
TABLE OF CONTENTS
Abstract ii
Executive Summary iii
List of Chapters v
List of Tables vi
List of Illustrations vi
List of Appendices vi
List of Abbreviations vii

iv
ABSTRACT
Karnataka is one of the fastest urbanizing States in India with the urban population constituting
nearly 39% of the total population. In the background of high urbanization there is also a need
for high investments in urban infrastructure to deliver the basic and obligatory services. Urban
Local Bodies (ULBs) has an important role to play in meeting these requirements. This study
makes an attempt to review the financial status of ULBs in Karnataka. The study finds that own
tax revenue sources of ULBs are not even contributing 20% of the total revenues and ULBs
are dependent on the transfers from the Centre and State Government. At the same time, it was
noticed that only 38% of 13th Finance Commission’s general grants released are being utilized
by the ULBs. Many of the Municipal Corporations in Karnataka are showing surplus in their
accounts and this scenario is mainly owing to grants they are receiving from the Centre and
State Government’s new urban development initiatives such as AMRUT, Smart Cities Mission
& Nagorothana Scheme. Present level of ULBs expenditure in Karnataka is not even covering
one-third of required investments. In the context of huge infrastructural investment
requirements and budget constraints, ULBs have to raise the needed capital through Public
Private Partnership and Bond Financing approach. It is difficult for lower tier of ULBs to reach
the bond markets and hence this study suggests to strengthen the system of ‘Pooled Financing’
and advocates that the Government take an initiative to form an ‘Organization’ which could
approach and raise funds from the bond market and allocate the same for participating ULBs.

v
EXECUTIVE SUMMARY
As per the 2011 Census, Urban population in Karnataka constitutes nearly 39% of the total
population and it is expected to reach 44% by 2021. Karnataka, being the 5th most urbanized
State in India, has to invest more on urban infrastructure to meet the basic requirements of
urban population. Governance of urban areas lies under the Urban Local Bodies and their role
becomes vital in the context of rapid urbanization.
Decentralized structure in India got strengthened with the 73rd and 74th amendment of the
Indian Constitution. With these amendments many of the functional and administrative
responsibilities have been assigned to local bodies. In Karnataka, ‘The Karnataka
Municipalities Act, 1964’ governs the City Municipal Councils and Town Municipal Councils
and ‘Karnataka Municipal Corporation Act, 1976’ governs Municipalities.
As per Article 280(3) of Indian Constitution, Central Finance Commissions (CFCs) have to
recommend measures to augment the consolidated fund of the State Governments based on
State Finance Commission’s (SFCs) report. However, CFCs have complained about untimely
submission of SFC reports, the quality of the reports and severe data problem faced by SFCs.
In order to solve these issues, CFCs have kept aside a lump sum grant to address the data
problem. However, despite these initiatives the problem of data availability still persists. CFCs
primarily adopted two criteria namely area and population for fund devolution to States and in
addition, other important criteria like devolution index, revenue efforts, decentralization index
etc have also been used. Karnataka Government has constituted three SFCs till now and fourth
SFC is constituted recently and is yet to submit its report. SFCs have to make recommendations
to Governor of the State regarding devolutions to local bodies.
Review of ULBs finances in Karnataka reveals that own tax revenue source of ULBs are just
around 20% of total revenue. This scenario is exactly the opposite in several countries like
Canada, where share of own tax revenue constitutes more than 80% of the total revenue. It
implies that ULBs in Karnataka are highly dependent on transfers from the upper level of
Government. Property tax is the major source of tax revenue but collections vary across tiers
of ULBs. It was observed that, in recent years, major share of grants from State Government is
being transferred to city corporations. This trend reveals the emerging need for higher spending
to address the problem of urban agglomeration. Surprisingly, it was found that only 48% of the
released general grants by 13th Finance Commission is being utilized by the ULBs. Utilization
is critical even with regard to performance grants.

vi
Expenditure on salaries and wages and maintenance tops the spending list of ULBs followed
by capital spending. Interestingly, it was observed that all the city corporations, excepting a
few show surplus in their budget and also have remarkable closing balances. This scenario is
mainly owing to extraordinary receipts which they are receiving from the higher levels of
Government. The extraordinary receipts mainly consist of grants from Central and State
Governments for implementation of new urban development initiatives namely AMRUT
scheme, Smart City project and Nagarothana scheme. Extraordinary receipts constitute nearly
30% of total receipts of the city corporations.
It was observed that with the present level of spending by the ULBs it would be difficult to
meet the urban infrastructural requirements. An exercise undertaken in the present study to find
out the required investments by the ULBs (mostly for the urban infrastructure development)
revealed that actual spending is just around 30% of required investments. In the context of huge
infrastructural investment requirements and budget constraints, ULBs have to raise the needed
capital through Public Private Partnership and Bond Financing approach. It will be difficult for
lower tier of ULBs to reach the bond markets and hence this study suggests to strengthen the
system of ‘Pooled Financing’ and advocates the Government to take the initiative to form an
‘Organization’ which could approach and raise funds from the bond market and allocate the
same for participating ULBs.

vii
List of Chapters
Chapter-1: Introduction 1 - 5
1.1 Constitutional Amendments and Local Bodies 1 - 2
1.2 Constitutional Amendments and Developments in Karnataka 2 - 5
1.2.1 The Karnataka Municipalities Act, 1964 2 - 4
1.2.2 The Karnataka Municipal Corporation Act, 1976 4 - 5
Chapter-2: Finance Commissions 6 - 13
2.1 Central Finance Commissions 6 - 11
2.1.1 Criteria adopted by Finance Commissions for Distribution of Grants 9 - 11
2.2 State Finance Commissions 11 - 13
2.2.1 SFC Devolution Criteria 12 - 13
Chapter-3: Urban Local Bodies Structure in Karnataka 23 - 25
3.1 Urbanization in Karnataka 23 - 24
3.2 Structure of ULBs 24 - 25
Chapter-4: Finances of Urban Local Bodies in Karnataka 26 - 38
4.1 Revenues of ULBs: Own Source, Transfers and Grants 26 - 30
4.2 Expenditure of ULBs 31- 32
4.3 Finances of Select Municipal Corporations 32 - 33
4.4 Urban Development: Recent Initiatives 34 - 35
4.5 Urban Infrastructure: Current Status and Required Investments 35 - 38
Chapter-5: Conclusion 39 - 40
Bibliography 41 - 42
Appendix 43 - 44

viii
List of Tables
2.1 Parameters for Finance Commission Grants Distribution amongst the States 10
2.2 Indicators of Devolution of Resources to ULBs 13
3.1 Classification of Towns in Karnataka 16
4.1 Revenue Composition of ULBs 17
4.2 Detailed Description of Revenue Sources of ULBs 18
4.3 Grant Transfers from State to ULBs 20
4.4 Grants Released as a % of Budgeted Transfers 20
4.5 Share of State Government Grants to Tiers of ULBs 20
4.6 13th Finance Commission Grants to ULBs in Karnataka 21
4.7 Grants Allotted for ULBs from 14th Finance Commission 22
4.8 Detailed Item Wise Expenditure of ULBs 23
4.9 Financial Position of Municipal Corporations 25
4.10 Fund Sharing Pattern for AMRUT Mission in Karnataka 26
4.11 Sector wise Allocation for the AMRUT Mission in Karnataka 26
4.12 Financing Gap in Urban Infrastructure 38
List of Illustrations
3.1 Decadal Growth of Urban Population 14
3.2 Level of Urbanization in India & Karnataka 15
4.1 Transfers to ULBs as a % to Revenue Expenditure of State Government 19
4.2 Plan & Non-Plan Transfers to ULBs from the State Government 19
4.3 Item Wise Expenditure of ULBs in Karnataka 22
4.4 Major Components of Receipts and Payments of Municipal Corporations 24
List of Appendices
1 Projections on Upgradation of Lower Tiers of ULBs 35

ix
List of Abbreviations
AMRUT: Atal Mission for Rejuvenation and Urban Transformation
BBMP: Bruhat Bengaluru Mahanagara Palike
CAG: Comptroller and Auditor General
CARE: Credit Analysis and Research Limited
CFC: Central Finance Commission
CMCs: City Municipal Corporations
FIRE-D: Financial Institution Reform and Expansion
GDP: Gross Domestic Product
GSDP: Gross State Domestic Product
HPEC: High-Powered Expert Committee
KFRA: Karnataka Fiscal Responsibility Act
NIPFP: National Institute of Public Finance and Policy
PCI: Per Capita Income
PPP: Public Private Partnership
PRI: Panchayat Raj Institutions
SAAP: State Annual Action Plan
SFC: State Finance Commission
TMCs: Town Municipal Corporations
TPs: Town Panchayats
ULBs: Urban Local Bodies

1
CHAPTER- 1
INTRODUCTION
Karnataka is one of the progressive States in India with consistent growth performance. The
sectoral composition of the State’s economy is moving towards the service sector, which
accounts for around 59% of total Gross State Domestic Product (GSDP). However, dependency
on primary sectoral occupation is still higher. As far as the fiscal indicators of the State are
concerned, all the deficit indicators are well within the prescribed limit. In fact, Karnataka was
the first State to enact Fiscal Responsibility Act in the year 2002, much ahead of the Union
Government. With wide ranging fiscal reforms, there were significant changes in the fiscal
scenario of State in terms of reduction in deficits, increase in capital expenditure and decline
in capital receipts.
With economic development, nations progressively become more and more urbanized.
Karnataka is not an exception to this scenario. Urban population accounted for 33.99% of the
total population of the State in 2001 which increased to 38.7% in 2011 with the decadal growth
in urban population being 31.5%. In comparison, rural population has grown by only 7.4%
between 2001 and 2011. Available projections indicate that urban population would account
for 43.6% by the year 2021 (GoK, 2013). Given these facts, higher investments in urban
infrastructure and governance to meet the upcoming needs are of utmost importance. In these
circumstances, role of Urban Local Bodies (ULBs) in meeting these needs becomes prominent.
1.1 Constitutional Amendments and Local Bodies:
The 73rd and 74th Amendment to the Constitution of India in 1992 paved the way for
strengthening of decentralized structure in India by providing special powers to local bodies.
The 73rd amendment relates to rural local bodies (Panchayat Raj Institutions) while the 74th
amendment of constitution refers to ULBs. In order to improve the performance and
accountability of local bodies, an attempt was made by these amendments to include important
functions like devolution of financial and administrative responsibilities to the third tier of
Governments, thereby paving the way for fiscal federalism (Singh & Singh, 2015).
Prior to the 74th Amendment, ULBs were not able to perform effectively due to inadequate
devolution of powers and functions. However, 74th Amendment has provided a firm
relationship between State Government and ULBs with respect to functions and taxation
powers, revenue sharing, conduct of elections, representation for weaker sections of the society
etc. 74th Amendment constituted three types of Municipalities, namely:

2
1. Nagar Panchayats – areas of transition from rural to urban
2. Municipal Council- smaller urban area
3. Municipal Corporations- larger urban area
Soon after the 74th Amendment to the Constitution, many of the State Governments in India
have taken steps to implement the recommendations and established ULBs. All States except
Jharkhand and Pondicherry have conducted elections to the local bodies (GoI, 2016). It was
required of all the State Governments to review the existing municipal laws to be consistent
with 74th Amendment as per Article 243ZE of the Indian Constitution.
1.2 Constitutional Amendments and Developments in Karnataka:
1.2.1 The Karnataka Municipalities Act, 1964
The city municipal councils and town municipal councils are governed by “The Karnataka
Municipalities Act, 1964”. Prior to this enactment, municipal councils in the State were
governed by seven different enactments in different areas and in order to have uniformity in
law, this Bill was legislated.
Salient Features
Town Panchayats
1. The Town Panchayats are transitional areas which are constituted based on set
following criteria:
a. Population (10000 – 20000)
b. Density of Population (not less than 400 per square kilometer)
c. Occupation (not less than 50% of population should be non-agriculturists)
2. Constitution
a. Consists of directly elected councilor (number of councilors are prescribed
based on population of Transitional area)
b. Nominated members (not more than three, they should be experienced and have
knowledge of administration)
c. Members of House of People and State Legislative Assembly pertaining to the
transitional area
d. Members of Council of States and State Legislative Council pertaining to the
transition area

3
City Municipal Councils or Town Municipal Councils
1. Constitution
a. Elected members (Number of councilors are prescribed based on Population of
Municipal area)
b. Five Government nominated members
c. Local Member of Legislative Assembly and Member of Parliament
d. Reservation (Representation for Scheduled Caste and Scheduled Tribes based
on their population and 1/3rd of the seats are reserved for women)
2. Constitution of Standing Committees for the following
a. Taxation, finance and appeals
b. Public health, education and social justice
c. Town planning and improvement
d. Accounts
3. Municipal Property (Can acquire and hold both movable and immovable property for
the purpose of this Act)
4. Municipal Funds (Consists of all money received by or on behalf of municipal council
by virtue of this Act)
5. Municipal Funds can be applied for the purpose specified in the Act
6. Municipals have powers to deposit, invest & borrow money
7. Municipal Taxation
a. Property Tax (Buildings or vacant lands or both within the Municipal area with
some exception)
b. Duty on transfers of immovable property
c. Tax on advertisements
8. Municipal Accounts and Administrative Reports
a. Prohibition of expenditure not budgeted for
b. Presentation of Accounts- Commissioner shall submit to Municipal council a
detailed budget stating estimation of income and expenditure for ensuing year
with in 15th January of every year. It also should include actual and expected
receipts and expenditure for the official year till 31st March.
c. Maintenance of accounts and restrictions on expenditure as per the rules
d. Accounts should be audited by recognized auditor at least once in a year. The
audit report may sent to certain officers and bodies as Government may direct.

4
e. Annual Administration Report should be submitted to the Director of Municipal
Administration and Government every year
f. Development Plan should be prepared and submitted District Planning Committee
every year
g. Finance Commissions constituted by Government will review financial position
and make recommendations
9. Control- Director of Municipal Administration will be the chief controlling authority.
10. Rules and Bye-Laws- Government by notification may make rules and bye-laws
1.2.2 Karnataka Municipal Corporation Act, 1976
All Municipal corporations except Bruhat Bengaluru Mahanagara Palike (BBMP) are governed
in the State of Karnataka by the “Karnataka Municipal Corporation Act, 1976”. Municipal
governance in BBMP is facilitated directly by the Government of Karnataka. Municipal
corporations are for the larger urban areas. The salient features of Karnataka Municipal
Corporation Act, 1976 are as follows:
1. Specification or Establishment of Corporation
a. Population (not less than three lakh)
b. Density of Population (not less than three thousand inhabitants per square km)
c. Revenue generation (revenue generation of not less than six crore in the year of
last preceding census or rupees two hundred per capita per annum)
d. Employment in non-agriculture sector should not be less than 50% of total
employment.
2. Constitution of Corporation
a. Elected members
b. Government nominees (not more than five)
c. Members of Parliament, Members of Legislative Assembly, Members of Council
of State and Members of State legislative Councils representing the city or part of
the city.
d. Not less than 1/3rd of the seats should be reserved for Scheduled Caste, Scheduled
Tribes and Other Backward Class people.
e. Formation of Standing Committee and Ward Committee
3. Obligatory Functions of the Corporation
a. Solid waste management
b. Construction, maintenance and cleaning of drainage

5
c. Public lighting
d. Maintenance of corporation office, public monuments, public markets etc
4. Taxation
a. Property Tax (Buildings or vacant lands or both within the Municipal area with
some exception. Percent of levy should be less than 0.3% and not more than 0.6%
of the capital value of the property)
a. Duty on transfers of immovable property
b. Tax on advertisements
c. Water supply Cess
d. Levy of infrastructure and solid waste management cess
5. Finance, Accounts and Audit
a. Accounts of all receipts and expenditure of the corporation shall be kept in
prescribed manner
b. The Government shall appoint one of its officer as Corporation Chief Auditor to
conduct auditing of the Corporation finances.
c. Corporation have powers to borrow money with certain pre-conditions

6
CHAPTER-2
FINANCE COMMISSIONS
2.1 Central Finance Commissions
There has been considerable progress in the empowerment of Panchayat Raj institutions and
Municipalities in India after the constitutional amendments. 10th Finance Commission first
made the provision for explicitly supporting local bodies through grants (GoI, 2009). Under
article 280 (3), the Finance Commission has the responsibility to make recommendations to
the President of India regarding the “measures needed to augment the consolidated fund of a
State” once the recommendations of State Finance Commissions (SFCs) become available to
it (GoI, 1994). As the SFC reports were not available at that time, 10th Finance Commission
did not make any recommendation. However, it recommended lump sum grant of Rs. 1000
crore for ULBs to meet their primary obligations.
Timely submission of the State Finance Commission reports are crucial for accomplishment of
Central Finance Commission Grants. Both Eleventh Finance Commission and Twelfth Finance
Commission have recommended grants on an ad hoc basis due to non-furnishing of data by
States as well as the SFC reports in order to provide required funds based on proper estimation.
Eleventh Finance Commission earmarked that released funds should be used for operation and
maintenance of core civic services like education, health, drinking water, street lighting and
sanitation and should not be used for payment of salaries and wages. With the intention of
removing data constraints, the Eleventh Finance Commission set apart grants of Rs 98.6 crore
for maintenance of accounts and Rs 200 crore for creation of database of Finances of local
bodies. Unfortunately, only 30% of the money allocated for creation and maintenance of the
data base was utilized (GoI, 2004). Twelfth Finance Commission also noted the importance of
maintaining data bases of local bodies and urged that part of the grants sanctioned should be
earmarked by State Governments for this purpose. The Twelfth Finance Commission
recommended an amount of Rs. 5000 crore for ULBs across India and stipulated that at least
50% of grants provided should be assigned for solid waste management through Public Private
Partnership (PPP).
The Twelfth Finance Commission also made number of recommendations with regard to the
constitution, composition, mode and methodology of working of State Finance Commissions
which aimed at improving their functioning (GoI, 2009).
7
Main recommendations made by Twelfth Finance Commission regarding SFCs were as
follows:
1. The States should avoid delays in constitution of SFCs, submission of reports. It is
desirable to constitute SFCs at least two years before the required date of
submission.
2. SFCs reports should be readily available for Central Finance Commission.
3. SFCs should follow similar format and procedure for data acquisition as well as
report writing as adopted by Finance Commission.
4. SFCs should be constituted with people of eminent, qualified and experienced in
relevant fields.
5. The convention established at national level of accepting principal recommendation
should be followed by SFCs.
6. It is desirable to follow the procedure adopted by Central Finance Commissions to
transfers resources from Centre to States while transferring resources to local
bodies.
7. While estimating the resources of local bodies, SFCs should follow a normative
approach in the assessment of revenues and expenditure rather than make forecasts
based on historical trends.
8. A permanent SFC cell may be created under Finance Departments of respective
States.
While Twelfth Finance Commission relaxed many stipulated conditions for the States in
drawing grants, it made providing Utilization Certificates for previous instalments a must for
further transfers. Despite such a liberal approach few States were not able to draw down the
grants (GoI, 2009).
In a memorandum to Thirteenth Finance Commission, Ministry of Urban Development
contended that combined expenditure of ULBs shrank from 1.74% of GDP in 1998-99 to
1.54% in 2007-08. Own resource did not cover even 50% of required expenditure while
transfers (as significant part of it was tied and discretionary) are not adequate to meet the
expenditure which increased significantly due to implementation of the Sixth Pay Commission
recommendations, additional operation and maintenance costs due to larger investments in
civic infrastructure and additional investment necessary for improving the accounting system,
computerization of operations, tax administration and project monitoring (GoI, 2009). It also

8
added that previous Central Finance Commissions (CFCs) have adopted an ad hoc approach in
releasing funds to local bodies and the quantum is also low.
Thirteenth Finance Commission claimed that the data provided to the Commission varied in
quality across States. It was inconsistent with the data provided by earlier Finance
Commissions. Quality, scope and analysis of submitted SFC reports were widely divergent
(GoI, 2009). As per Article 243-I of the Indian Constitution, SFCs should be appointed on the
expiration of every fifth year with the intention that all the transfers to local bodies from the
Government to be governed by mandate of current SFC. The mandate is applicable only for
period of five years and should not be extended. In contrast, it was observed by Thirteenth
Finance Commission that in one of the States, SFC report for the period 2005-06 to 2009-10
was submitted as late as 31st March 2009. Thirteenth Finance Commission urged the need of
synchronizing the period covered by SFCs with Central Finance Commissions.
Thirteenth Finance Commission recommended grants under heads of ‘general basic grants’
‘general special area basic grants’ ‘general performance grants’ and ‘general special area
performance grants’. State Governments would be eligible for drawing the general
performance grants if they complied with following conditions:
1. A supplement of budget document be prepared by State Governments showing details
of Plan and non-Plan wise classification of transfers separately for all categories of
ULBs from major head to object head. It should indicate details of funds transferred
directly to local bodies outside State Government’s Budget.
2. State Government must put in place an audit system for local bodies.
3. State Government must put in place a system of independent local body ombudsmen
who will look into complaints of corruption and maladministration against the
functionaries of local bodies.
4. The State Government must put in place a system to electronically transfer local body
grants provided by the Finance Commission to the respective local bodies within five
days of their receipt from Central Government.
5. State Government must prescribe through an Act the qualification of persons eligible
for appointment as members of SFC.
6. All local bodies should be fully enabled to levy property tax and any hindrance in this
regard must be removed.

9
7. State Government must put in place a State level Property Tax Board, which will assist
all municipalities and municipal corporations.
8. Municipalities and Municipal Corporations’ service standards for four services water
supply, sewerage, storm water drainage and solid waste management to be notified by
State Government.
9. All municipal corporations with a population of more than 1 million (2001 census)
should put in place a fire hazard response and mitigation plan for their respective
jurisdictions.
Fourteenth Finance commission too could not base their recommendation entirely on SFCs
reports due to variations in approaches adopted by SFCs, difference in periods covered, non-
synchronization of SFC report period with that of Central Finance Commission and quality of
SFC reports (GoI, 2015). SFCs have pointed out to Fourteenth Finance Commission that there
is lack of coordination between the Finance Department and those dealing with the Rural and
Urban Affairs which hinders the implementation of measures for augmentation of resources
suggested by the SFCs.
It was decided by the Fourteenth Finance Commission to disburse the grants under two heads
namely basic grants and performance grants. Basic grants constitute 80% of total grants and
remaining 20% would be performance grants for ULBs. It was suggested that a detailed
procedure for the disbursal of the performance grant to ULBs be designed by the State
Government concerned, subject to certain eligibility criteria. To be eligible, ULBs should
furnish the following.
1. Submit audited annual accounts that relate to a year not earlier than two years preceding
the year in which it seeks to claim performance grants.
2. It will also have to show an increase in own revenues over the preceding year, as
reflected in these audited accounts.
3. It must publish the service level benchmarks relating to basic urban services each year
for the period of the award and make it publically available. The service level bench
marks of Ministry of Urban Development may be used for this purpose.
2.1.1 Criteria adopted by Finance Commissions for Distribution of Grants
Population and geographical area are two parameters which were adopted by all the Finances
commissions starting from Eleventh to Fourteenth Finance Commissions. Eleventh Finance
Commission has constructed an index of decentralization and assigned weight of 20% (refer

10
Table-2.1). The index was constructed considering ten parameters broadly relating to the
implementation aspects of the 73rd and 74th Amendments of the constitution by local bodies.
The Twelfth Finance Commission gave a weight of 20% for revenue efforts of the States and
10% for Index of Deprivation. This index was constructed based on data relating to minimum
needs of the people namely, percentage of households fetching water from distance, percentage
of the population without latrine and percentage of population without drainage.
Table-2.1
Parameters for Finance Commission Grants Distribution amongst the States
Sl.
No
Parameters 11th Fin Com 12th Fin Com 13th Fin Com 14th Fin Com
1 Population 40% 40% 50% 90%
2 Distance from Higher PCI
a. Distance from higher
Per Capita Sectoral
Income
20% 20%
20%
-
3 Revenue Efforts
a. Rev Efforts with
respect to State Govt’s
Own Rev
b. Rev Efforts with
respect to GSDP of the
State
10%
10%
10%
- -
4 Geographical Area 10% 10% 10% 10%
5 Index of Decentralisation 20% - -
6 Index of Deprivation - 10% - -
7 Index of Devolution - - 15% -
8 Fin Com Local body Grants
Utilisation Index
- - 5% -
Source: Central Finance Commission Reports
It was found by the Thirteenth Finance Commission that significant proportion of grants has
not been drawn by the ULBs and hence it included index of Finance Commission grants
utilization as a parameter for disbursement of grants. The state wise devolution index was
constructed based on amount transferred to ULBs from States own revenue sources adjusting
for population and it was assigned a weight of 15%.
Apart from adopting these criteria, the Fourteenth Finance Commission retained population
and geographical area as parameters for grant devolution. Commission noted that there are
practical differences in considering appropriate indices for devolution and even assuming an
index, it is difficult to measure actual level of devolution to optimal level due to unavailability
11
of accurate data. Under the Constitution, only State Legislature has discretion to assign
functions to local bodies. As neither the Terms of Reference to Finance Commission nor Indian
Constitution permit the Finance Commission to play any role in devolution of powers to local
bodies, Fourteenth Finance Commission considered it appropriate not to use an index of
devolution or decentralization for the purpose of transfers of resources to local bodies. Thus,
the Commission recommended transfers based on population and area parameter by giving
weight of 90% and 10% respectively.
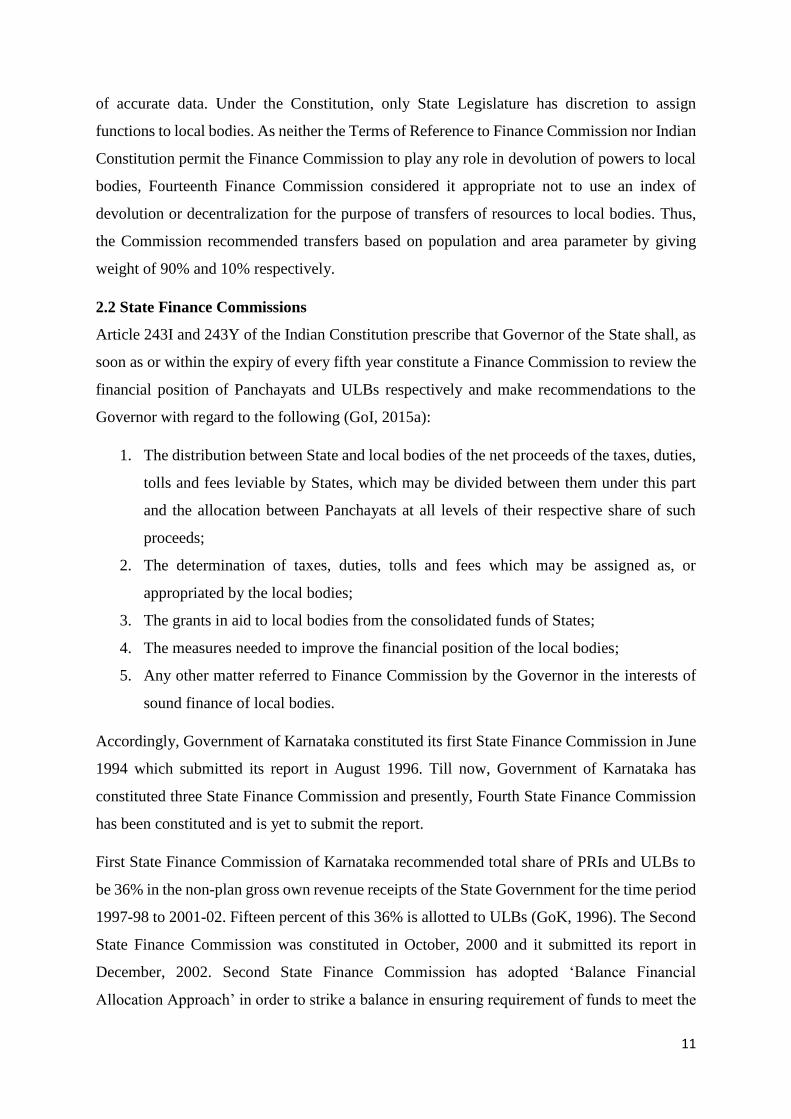
2.2 State Finance Commissions
Article 243I and 243Y of the Indian Constitution prescribe that Governor of the State shall, as
soon as or within the expiry of every fifth year constitute a Finance Commission to review the
financial position of Panchayats and ULBs respectively and make recommendations to the
Governor with regard to the following (GoI, 2015a):
1. The distribution between State and local bodies of the net proceeds of the taxes, duties,
tolls and fees leviable by States, which may be divided between them under this part
and the allocation between Panchayats at all levels of their respective share of such
proceeds;
2. The determination of taxes, duties, tolls and fees which may be assigned as, or
appropriated by the local bodies;
3. The grants in aid to local bodies from the consolidated funds of States;
4. The measures needed to improve the financial position of the local bodies;
5. Any other matter referred to Finance Commission by the Governor in the interests of
sound finance of local bodies.
Accordingly, Government of Karnataka constituted its first State Finance Commission in June
1994 which submitted its report in August 1996. Till now, Government of Karnataka has
constituted three State Finance Commission and presently, Fourth State Finance Commission
has been constituted and is yet to submit the report.
First State Finance Commission of Karnataka recommended total share of PRIs and ULBs to
be 36% in the non-plan gross own revenue receipts of the State Government for the time period
1997-98 to 2001-02. Fifteen percent of this 36% is allotted to ULBs (GoK, 1996). The Second
State Finance Commission was constituted in October, 2000 and it submitted its report in
December, 2002. Second State Finance Commission has adopted ‘Balance Financial
Allocation Approach’ in order to strike a balance in ensuring requirement of funds to meet the

12
responsibilities of local bodies on the one hand and State Government on the other. It
recommended an increase in the share of local bodes in State’s non-plan Gross Own Revenue
Receipts to 40% (GoK, 2002). Around 20% of the devolution was allotted to ULBs (8% for
ULBs and 32% for PRIs out of 40%). Second State Finance Commission observed the need
for maintaining reliable data base and it recommended a ‘Common Purpose Fund’ to facilitate
development of comprehensive data base, computerization, development of software required
for ULBs, training in preparation of draft documents, agreements etc. It recommended a sum
of Rs. 5 crore to be set apart each year out of the total share in devolution to ULBs. Second
State Finance Commission also initiated the incentive scheme for ULBs and an amount of Rs.
10 crore was earmarked for this purpose. A fixed amount of Rs 2 lakh is assured as incentives
to those ULBs whose internal revenue mobilization is 60% and above to the total demand
(including opening balance and inclusive of all taxes, rates, fees etc) in each year for three
consecutive preceding financial year.
Third State Finance Commission was constituted on August 2006 and it submitted its report
on December 2008. The commission recommended a devolution of 33% of States net own
revenue receipts to local bodies. While 30% of the total devolution was assigned to ULBs
(GoK, 2008).
Third State Finance Commission observed that there was considerable delay on the part of
State Government in reacting to recommendations of the Second State Finance Commission.
The Second State Finance Commission submitted its report at the end of year 2002, however,
its implementation started only in the year 2006-07.
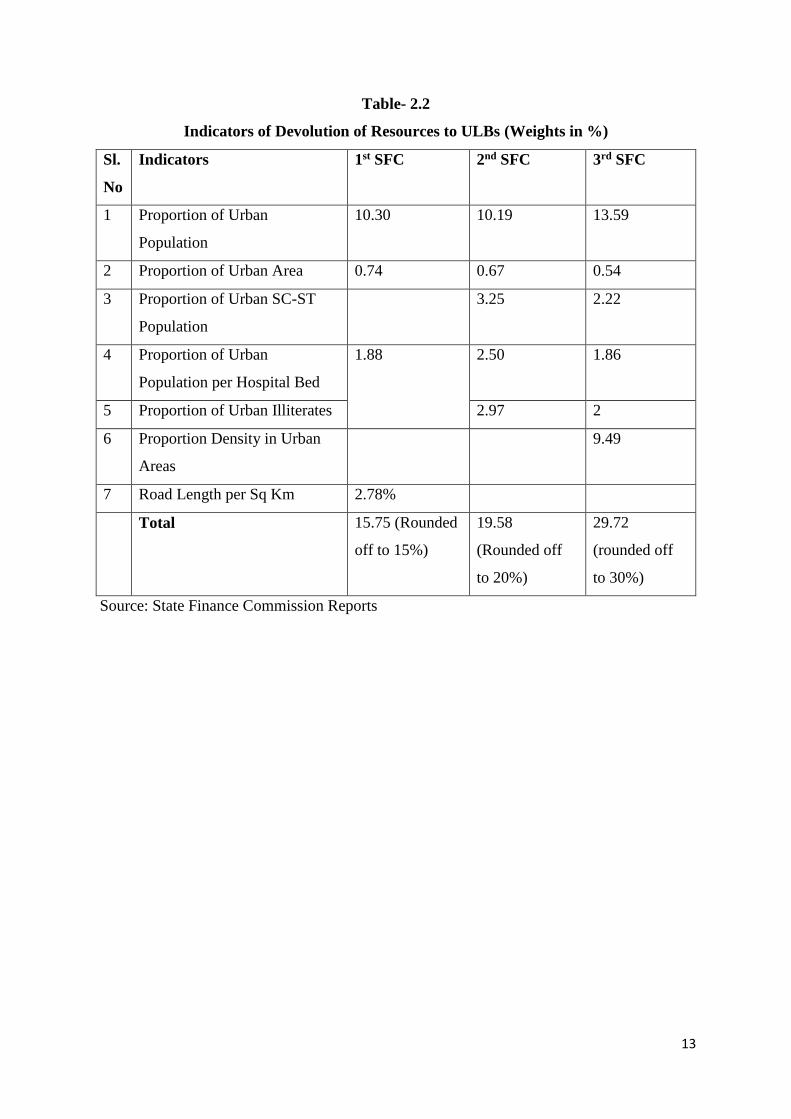
4.4.1 SFC Devolution Criteria:
Population and Area are the common indicators used in all the State Finance Commissions.
Percentage of urban population and also the density of population has were given more
weightage by the Third State Finance Commission. The Second State Finance Commission
developed an index of backwardness comprising three indicators, namely illiteracy rate, SC-
ST population and persons per hospital bed. The trend in the percent of devolution to ULBs
clearly indicates the rising trend to meet the needs of growing urban population over the years
as may be seen from the Table-2.2.
13
Table- 2.2
Indicators of Devolution of Resources to ULBs (Weights in %)
Sl.
No
Indicators 1st SFC 2nd SFC 3rd SFC
1 Proportion of Urban
Population
10.30 10.19 13.59
2 Proportion of Urban Area 0.74 0.67 0.54
3 Proportion of Urban SC-ST
Population
3.25 2.22
4 Proportion of Urban
Population per Hospital Bed
1.88 2.50 1.86
5 Proportion of Urban Illiterates 2.97 2
6 Proportion Density in Urban
Areas
9.49
7 Road Length per Sq Km 2.78%
Total 15.75 (Rounded
off to 15%)
19.58
(Rounded off
to 20%)
29.72
(rounded off
to 30%)
Source: State Finance Commission Reports

14
CHAPTER- 3
Urban Local Bodies Structure in Karnataka
3.1 Urbanization in Karnataka
Urbanization in Karnataka has increased from 22% in 1951 to 39.48% in 2011. This trend has
resulted in the State being declared as the fifth most urbanized State in India and it is estimated
to maintain the same position by 2030 (Prabhu, 2013). As per available projections, urban
population in Karnataka will move up to 43.6% by 2021 (DES, 2013). Bangalore is the most
urbanized district in Karnataka followed by Dharwad, Dakshina Kannada and Mysore. Among
the districts Bangalore has witnessed highest decennial growth rate of 47.18%. Decadal growth
of urban population in Karnataka has surpassed the overall India’s decadal growth of urban
population (Refer Figure-3.1). Level of urbanization (% of urban population in total
population) in Karnataka is significantly higher than that of India throughout last five decades
(Refer Figure-3.2). The pace of urbanization in the last decade is higher when compared to
earlier years. Given these facts, urban governance and administration attains greater
importance. In the process of urbanization, ULBs get the prime role in meeting the needs of
people.
Figure-3.1
Decadal Growth of Urban Population (in %)
Source: Census of India, Various Issues
0
10
20
30
40
50
60
70
1 9 5 1 - 6 1 1 9 6 1 - 7 1 1 9 7 1 - 8 1 1 9 8 1 - 9 1 1 9 9 1 - 0 1 2 0 0 1 - 1 1
IN %
YEAR
India Karnataka

15
Figure-3.2
Level of Urbanization in India & Karnataka
(Urban Population as a % of Total Population)
Source: Census of India, Various Issues
3.2 Structure of ULBs
In Karnataka, Urban Local Bodies have been classified into five categories and they are as
follows:
1. Municipal Corporations
2. City Municipal Council
3. Town Municipal Councils
4. Town Panchayats
5. Notified Area Committees
Classification of towns is based primarily on Population criteria and other criteria like density,
percent of contribution from non-agricultural sectors etc. Table- 3.1 provides classification of
towns in Karnataka based on population criteria.
As of November 2016 there are 10 Municipal Corporations, 57 City Municipal Councils, 112
Town Municipal Councils, 91 Town Panchayats and five Notified Area Committees in
Karnataka. The Directorate of Municipal Administration oversees the functioning of
municipalities in Karnataka. Between 2001 and 2011, 8 Town Panchayats became Town
Municipal Councils, 16 Town Municipal Councils became as City Municipal Councils and two
City Municipal Council were upgraded to as Municipal Corporations. This trend is expected to
0
5
10
15
20
25
30
35
40
45
1 9 6 1 1 9 7 1 1 9 8 1 1 9 9 1 2 0 0 1 2 0 1 1
IN %
YEAR
India Karnataka

16
continue. By extrapolating the population growth (assuming population growth between 2001
and 2011 would continue till 2021) it was found that nearly 12 Town Panchayats would be
upgraded as Town Municipal Councils and 9 TMCs may become City Municipal Councils by
2011 (Please Refer Appendix-1 for details).
Table- 3.1
Classification of Towns in Karnataka
Classification Population
Municipal Corporations Above 3 lakh
City Municipal Councils 50000 - 300000
Town Municipal Councils 20000 - 50000
Town panchayats 10000 - 20000
Notified Area Committees Special areas
Source: Directorate of Municipal Administration, GoK, 2016.
17
CHAPTER- 4
Finances of Urban Local Bodies in Karnataka
There is a shift towards urban based activities in last two decades and contribution from tertiary
sector to GDP is more than 50%. While the economic base is shifting to cities, prioritization of
the municipal sector to manage the process of growth and urbanization has proceeded slowly
(NIPFP, 2011). Report by NIPFP (2011) on Municipal Finances observed that Municipal
Governments have been passive participants in the process of economic growth and the
municipal contribution to India’s GDP is as low as 0.54%. Such evidence raise questions on
financial conditions of municipalities and proper disbursal. Karnataka being one of the most
urbanized States in India requires greater attention to be paid to municipal finances.
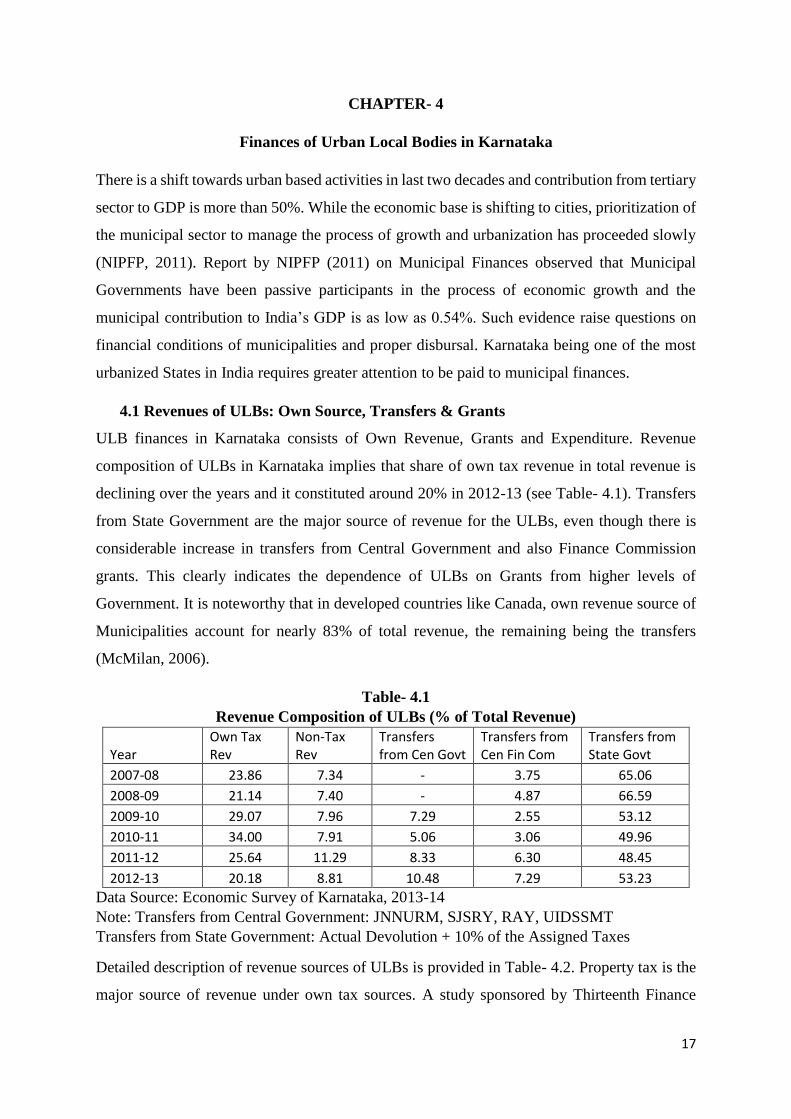
4.1 Revenues of ULBs: Own Source, Transfers & Grants
ULB finances in Karnataka consists of Own Revenue, Grants and Expenditure. Revenue
composition of ULBs in Karnataka implies that share of own tax revenue in total revenue is
declining over the years and it constituted around 20% in 2012-13 (see Table- 4.1). Transfers
from State Government are the major source of revenue for the ULBs, even though there is
considerable increase in transfers from Central Government and also Finance Commission
grants. This clearly indicates the dependence of ULBs on Grants from higher levels of
Government. It is noteworthy that in developed countries like Canada, own revenue source of
Municipalities account for nearly 83% of total revenue, the remaining being the transfers
(McMilan, 2006).
Table- 4.1
Revenue Composition of ULBs (% of Total Revenue)
Year Own Tax Rev
Non-Tax Rev
Transfers from Cen Govt
Transfers from Cen Fin Com
Transfers from State Govt
2007-08 23.86 7.34 - 3.75 65.06
2008-09 21.14 7.40 - 4.87 66.59
2009-10 29.07 7.96 7.29 2.55 53.12
2010-11 34.00 7.91 5.06 3.06 49.96
2011-12 25.64 11.29 8.33 6.30 48.45
2012-13 20.18 8.81 10.48 7.29 53.23
Data Source: Economic Survey of Karnataka, 2013-14
Note: Transfers from Central Government: JNNURM, SJSRY, RAY, UIDSSMT
Transfers from State Government: Actual Devolution + 10% of the Assigned Taxes
Detailed description of revenue sources of ULBs is provided in Table- 4.2. Property tax is the
major source of revenue under own tax sources. A study sponsored by Thirteenth Finance

18
Commission found that there exist large intercity variations in property tax revenues. For
instance, Mumbai Municipal Corporation registered a per capita annual revenue of Rs. 1334 as
against Rs. 25 for the Patna Municipal Corporation. It is interesting to note that composition of
revenue moves across different tiers of ULBs. For instance, for municipal corporations
property tax accounts around 30% in 2012-13 where as it is 5.7% and 2% for municipalities
and Nagar Panchayats at all India level. Being at lower tier these ULBs require higher financial
support from the State Government. In accordance, transfers from State Government accounts
more than 80% of total revenue for municipalities and Nagar panchayats. It is also notable from
Table- 4.2 that Central Finance Commission transfers are showing an increasing trend over the
years for all the tiers of ULBs.
Table- 4.2
Detailed Description of Revenue Sources of ULBs (% of Total Revenue)
Year
Immovable Property Tax
Other Tax
Non-Tax (incl of User charges)
Transfers from Cen Govt
Transfers from 12th & 13th Fin Com
Assigned + Devolution from State Govt
Municipal Corporations
2007-08 35.41 5.69 11.65 - 2.09 45.15
2008-09 35.67 1.74 12.68 - 1.74 48.16
2009-10 42.35 1.33 11.48 11.66 1.51 31.67
2010-11 51.19 1.17 11.44 5.26 1.84 29.10
2011-12 37.78 1.13 17.31 11.82 4.04 27.92
2012-13 29.50 1.69 14.14 17.96 4.68 32.03
Municipalities
2007-08 6.84 0.79 3.65 - 5.89 82.82
2008-09 6.81 0.67 3.04 - 7.70 81.77
2009-10 7.76 0.81 3.40 1.06 3.55 83.40
2010-11 6.86 0.64 2.93 3.98 4.89 80.70
2011-12 5.49 0.73 2.31 3.73 9.78 77.95
2012-13 5.71 0.54 1.93 0.54 10.86 80.42
Nagar Panchayats
2007-08 4.20 0.55 1.21 - 3.42 90.62
2008-09 2.35 0.38 1.12 - 7.67 88.48
2009-10 8.36 1.41 2.05 1.82 5.44 80.92
2010-11 2.35 1.12 1.73 7.52 4.86 82.42
2011-12 2.04 1.40 1.86 0.57 9.44 84.68
2012-13 2.06 0.64 0.87 0.30 10.48 85.65
Data Source: Economic Survey of Karnataka, 2013-14
State Government is transferring nearly 6% of its revenue expenditure to ULBs (see Figure-
4.1). Transfers to ULBs from the State Government was around 5% of revenue expenditure in
2006-07 and it increased to 6.67% in 2011-12. As per the Budget Estimates for the year 2015-

19
16, transfers to ULBs from the State Government will be around 5.67% of revenue expenditure.
Figure- 4.2 provides the plan and non-plan transfers to ULBs. Plan transfers were absolutely
nil in 2007-08 and there is an increasing trend thereafter. In 2013-14 plan transfers constituted
around 42% and remaining being the non-plan transfers.
Figure- 4.1
Transfers to ULBs as a % to Revenue Expenditure of State Government (in %)
Source: Accounts at Glance, 2016, Finance Department, GoK
Figure-4.2
Plan and Non-Plan Transfers to ULBs from the State Government
Source: Accounts at Glance, 2016, Finance Department, GoK
Budgeted and released amount of grants from State Government to ULBs in absolute terms are
provided in Table- 4.3. Total grants released increased from Rs. 2472 crore in 2009-10 to Rs.
6010 crore in 2014-15. There is substantial increase in grants released to city corporations.
Grants released to city municipal councils and town municipal councils are nearly stagnant.
There is a decline in grants transferred to town panchayats.
012345678
% o
f R
ev E
xp
Year
Transfers to ULBs
0
20
40
60
80
100
120
% O
F TO
TAL
TRA
NSF
ERS
YEARPlan Non-Plan

20
Table- 4.3
Grant Transfers from State to ULBs (in Rs. Crore)
Year
CC CMCs/TMCs TPs/NACs Total
Budget
Grant
Released Budget
Grant
Released Budget
Grant
Released Budget
Grant
Released
2009-10 679 662 1,335 1,372 351 438 2,365 2,472
2010-11 617 616 1,789 1,936 474 423 2,880 2,975
2011-12 2800 2864 1252 1126 285 258 4337 4248
2012-13 3544 2669 1513 1126 290 214 5347 4009
2013-14 4348 3632 1629 1139 344 248 6321 5019
2014-15 4956 4372 1589 1365 312 273 6857 6010
Source: Audit Reports
Grants released as a percent to budgeted amount was 104% in 2009-10 and it declined to 87%
in 2014-15 (See Table-4.4). All the tiers of ULBs are facing decline in the actual grants released
than the budgeted. In 2012-13 and 2013-14 nearly one quarter of budgeted grants has not been
transferred.
Table- 4.4
Grants Released as a % of Budgeted Transfers (in %)
Year CC CMCs/TMCs TPs/NACs TOTAL
2009-10 97.50 102.77 124.79 104.52
2010-11 99.84 108.22 89.24 103.30
2011-12 102.29 89.94 90.53 97.95
2012-13 75.31 74.42 73.79 74.98
2013-14 83.53 69.92 72.09 79.40
2014-15 88.22 85.90 87.50 87.65
Data Source: Report of CAG on Local Bodies, 2016, GoK
Table- 4.5
Share of State Government Grants to Tiers of ULBs (in %)
Year CC CMCs/TMCs TPs/NACs
2009-10 26.78 55.50 17.72
2010-11 20.71 65.08 14.22
2011-12 67.42 26.51 6.07
2012-13 66.58 28.09 5.34
2013-14 72.37 22.69 4.94
2014-15 72.75 22.71 4.54
Data Source: Report of CAG on Local Bodies, 2016, GoK
It is also to be noted that out of total grants from the State Government, share of city
corporations is more than one-third. The share of City Corporation in total grants has drastically
increased from 26% in 2009-10 to 72% in 2014-15. In contrast, share of city municipal councils

21
and town municipal councils has declined substantially from 55% in 2009-10 to 22.7% in 2014-
15. Even the share of town panchayats has declined significantly. This trend may be owing to
problem of population agglomeration in big cities of the State.
Thirteenth Finance Commission has allocated grants under the heads of General Basic Grants,
General Performance Grants and Grants for construction of Roads and Bridges to ULBs in
Karnataka (see Table- 4.6). As for as basic grants are concerned, between 2011 and 2014
released amount was more than allocated. However, there is drastic decline in 2014-15 to 38%.
In the tenure of Thirteenth Finance Commission, ULBs have received around 86% of total
allocated amount under basic grants. However, it is depressing to note that only 48% of the
released amount has been expended. This situation is even worse under performance grants.
ULBs have utilized only 60% of total grants given for building roads and bridges. CAG report
on Local Bodies Finances, 2015 found that Mysore City Council has utilized only 37% of
grants released between 2010-11 and 2013-14.
Table- 4.6
13th Finance Commission Grants to ULBs in Karnataka
Year
Allocated
Amount
Released
Amount Expenditure
Released amount
as % of Allocated
Expenditure as % of
Released Amount
General Basic Grants
2010-11 144.13 144.12 118.32 99.99 82.10
2011-12 167.15 180.67 142.07 108.09 78.64
2012-13 195.37 205.23 108.9 105.05 53.06
2013-14 231.46 235.71 54.23 101.84 23.01
2014-15 274.05 105.35 0.3 38.44 0.28
2010-15 1012.16 871.08 423.82 86.06 48.65
General Performance Grants
2011-12 58.81 93.28 40 158.61 42.88
2012-13 166.82 238.12 42.48 142.74 17.84
2013-14 196.77 202.55 1.87 102.94 0.92
2011-14 422.4 533.9 84.3 126.4 15.8
Roads and Bridges
2011-12 65.25 65.25 55.6 100 85.21
2012-13 69.53 69.53 59.64 100 85.78
2013-14 74.33 74.33 30.63 100 41.21
2014-15 112.25 32.56 0 29.01 0.00
2011-15 321.36 241.67 145.87 75.20 60.36
Data Source: Economic Survey of Karnataka, 2014-15
Note: Excluding BBMP

22
Table-4.7
Grants Allotted for ULBs from 14th Finance Commission (in Rs. Crore)
Year Basic Grants Performance Grants
2015-16 562.08 -
2016-17 778.29 229.7
2017-18 899.25 259.94
2018-19 1040.27 295.2
2019-20 1405.62 386.54
2015-20 4685.5 1171.38
Source: Report of Fourteenth Finance Commission, GoI (2015)
Allocation by the Fourteenth Finance Commission to ULBs seems to have increased
significantly compared to Thirteenth Finance Commission. However, receiving the
performance grants again depends on fulfillment of required conditions.
4.2 Expenditure of ULBs
Figure- 4.2
Item Wise Expenditure of ULBs in Karnataka (%)
Source: Economic Survey of Karnataka, 2013-14
Major items of expenditure of ULBs consists of Establishment expenditure, Maintenance,
capital expenditure, welfare expenditure and others. Figure- 4.2 indicates that Establishment
expenditure constituted 24% of total expenditure in 2007-08 which increased to 34% in 2013-
Establishment
24%
Maintanance34%
Capital Exp36%
Welfare Exp2%
Others4%
2007-08
Establishment
21%
Maintanance26%
Capital Exp45%
Welfare Exp4%
Others4%
2010-11
Establishment
34%
Maintanance
25%
Capital Exp34%
Welfare Exp3%
Others4%
2013-14

23
14. The maintenance expenditure declined from 34% to 25% between 2007-08 and 2013-14,
whereas the capital expenditure remained almost the same.
Table- 4.8 provides detailed item wise expenditure by ULBs. It clearly indicates that
expenditure on Salaries and wages consistently remains at top. It is followed by maintenance
expenditure like electricity charges, water supply and roads. Among the Capital expenditure,
spending on building of roads is highest followed by water supply and buildings. Welfare
expenditure for citizens constitutes only a smaller portion in the overall expenditure.
Table-4.8
Detailed Item Wise Expenditure of ULBs (as a % of Total Expenditure)
S.No. Item 2007-08
2008-09
2009-10
2010-11
2011-12
2012-13
2013-14
1 Establishment
a) Salaries & wages for Employees 23.01 24.22 20.90 18.94 25.60 32.36 32.36
b) Pension etc. for Employees 0.46 2.75 1.40 1.00 1.65 0.87 0.87
c) Any other (Office Expenses) 0.74 0.88 0.78 0.82 1.04 0.85 0.85
2 Maintenance
a) Water Supply 5.67 7.77 5.13 6.12 5.45 4.94 4.94
b) Buildings 0.67 0.72 0.69 0.77 0.76 0.68 0.68
c) Roads 3.96 3.45 4.24 3.45 3.19 2.66 2.66
d) Any other maintenance Exp (Electricity charges) 23.87 19.46 15.02 15.55 17.21 16.25 16.25
3 Capital Expenditure
a) Water Supply 4.04 2.98 3.74 4.57 3.78 3.93 3.93
b) Buildings 3.59 3.79 3.76 4.19 4.62 3.93 3.93
c) Roads 19.36 19.69 24.96 24.93 20.22 18.53 18.53
d) Any other capital expenditure (SWM, UGD & Street Lights) 8.53 8.07 11.05 11.97 8.13 7.82 7.82
4 Welfare Expenditure for citizens
a) Education (excluding teachers salary's) - - - - - - -
b) Pension etc. for citizens - - - - - - -
c)
Any other welfare expenditure for citizens (22.75%, 7.5% OBC, 3% PH) 2.06 2.77 4.69 3.65 3.71 3.42 3.42
5 Any other (SJSRY) 4.04 3.47 3.62 4.05 4.64 3.77 3.77
Source: Economic Survey of Karnataka, 2013-14
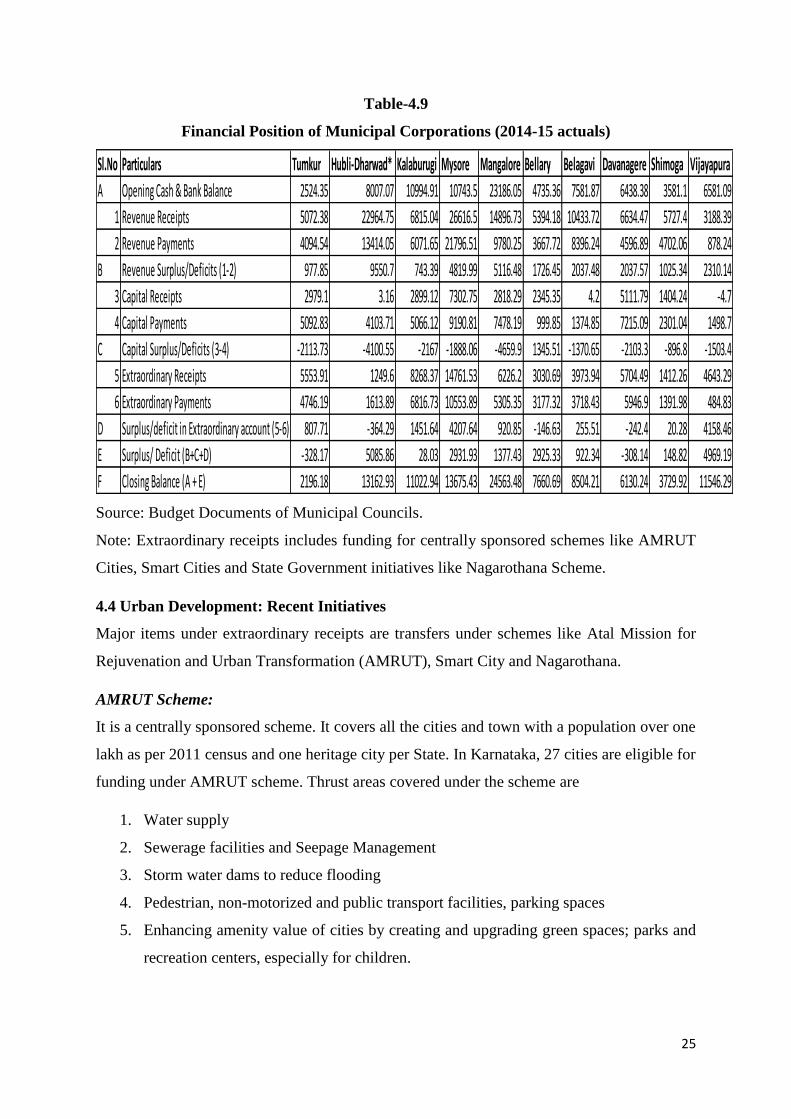
4.3 Finances of Select Municipal Corporations:
Table- 4.9 gives the details of financial position of Municipal Corporations. All the Municipal
Corporations have surplus in revenue account and deficit in capital account. Except Tumakuru
and Davanagere Municipal Corporations, all others have registered surplus in the overall

24
balance. It is notable that all the Municipal Corporations have substantial closing balance in
the account. Municipal Corporations could achieve better financial position mainly owing to
the extraordinary receipts. It consists mainly of transfers from Central Government in the form
of centrally sponsored schemes and also State Government specific transfers. On an average
extraordinary receipts constitutes 29% of total receipts of Municipal Corporations for the year
2014-15 (refer Figure-4.3). It is noteworthy that all Municipal Corporations have revenue
surplus in their revenue account implying that considerable portion of revenue receipts is being
used for capital payments. Table-4.9 also reveals that capital payments exceeds the capital
receipts for all the Municipal Corporations except for Bellary Municipal Corporation resulting
in deficit in the capital account. The deficit in the capital account can be fully offset by the
surplus in the revenue account. It provides a positive implication that Municipal Corporations
were able to meet their capital expenditure from the revenue receipts.
Figure-4.3
Major Components of Receipts and Payments of Municipal Corporations (in %)
Source: Budget Documents of Municipal Corporations
Revenue Receipts
58%Capital
Receipts13%
Extraordinary
Receipts29%
RECEIPTS
Revenue Payment
s47%
Capital Payment
s27%
Extraordinary
Payments
26%
PAYMENTS
25
Table-4.9
Financial Position of Municipal Corporations (2014-15 actuals)
Source: Budget Documents of Municipal Councils.
Note: Extraordinary receipts includes funding for centrally sponsored schemes like AMRUT
Cities, Smart Cities and State Government initiatives like Nagarothana Scheme.
4.4 Urban Development: Recent Initiatives
Major items under extraordinary receipts are transfers under schemes like Atal Mission for
Rejuvenation and Urban Transformation (AMRUT), Smart City and Nagarothana.
AMRUT Scheme:
It is a centrally sponsored scheme. It covers all the cities and town with a population over one
lakh as per 2011 census and one heritage city per State. In Karnataka, 27 cities are eligible for
funding under AMRUT scheme. Thrust areas covered under the scheme are
1. Water supply
2. Sewerage facilities and Seepage Management
3. Storm water dams to reduce flooding
4. Pedestrian, non-motorized and public transport facilities, parking spaces
5. Enhancing amenity value of cities by creating and upgrading green spaces; parks and
recreation centers, especially for children.
Sl.No Particulars Tumkur Hubli-Dharwad* Kalaburugi Mysore Mangalore Bellary Belagavi Davanagere Shimoga Vijayapura
A Opening Cash & Bank Balance 2524.35 8007.07 10994.91 10743.5 23186.05 4735.36 7581.87 6438.38 3581.1 6581.09
1 Revenue Receipts 5072.38 22964.75 6815.04 26616.5 14896.73 5394.18 10433.72 6634.47 5727.4 3188.39
2 Revenue Payments 4094.54 13414.05 6071.65 21796.51 9780.25 3667.72 8396.24 4596.89 4702.06 878.24
B Revenue Surplus/Deficits (1-2) 977.85 9550.7 743.39 4819.99 5116.48 1726.45 2037.48 2037.57 1025.34 2310.14
3 Capital Receipts 2979.1 3.16 2899.12 7302.75 2818.29 2345.35 4.2 5111.79 1404.24 -4.7
4 Capital Payments 5092.83 4103.71 5066.12 9190.81 7478.19 999.85 1374.85 7215.09 2301.04 1498.7
C Capital Surplus/Deficits (3-4) -2113.73 -4100.55 -2167 -1888.06 -4659.9 1345.51 -1370.65 -2103.3 -896.8 -1503.4
5 Extraordinary Receipts 5553.91 1249.6 8268.37 14761.53 6226.2 3030.69 3973.94 5704.49 1412.26 4643.29
6 Extraordinary Payments 4746.19 1613.89 6816.73 10553.89 5305.35 3177.32 3718.43 5946.9 1391.98 484.83
D Surplus/deficit in Extraordinary account (5-6) 807.71 -364.29 1451.64 4207.64 920.85 -146.63 255.51 -242.4 20.28 4158.46
E Surplus/ Deficit (B+C+D) -328.17 5085.86 28.03 2931.93 1377.43 2925.33 922.34 -308.14 148.82 4969.19
F Closing Balance (A + E) 2196.18 13162.93 11022.94 13675.43 24563.48 7660.69 8504.21 6130.24 3729.92 11546.29

26
Central Government has earmarked an amount of Rs. 50000 crore for five years between 2015-
16 and 2019-20. In the annual budgetary allocation for the mission funds, project fund
constitute 80%, incentive for reforms10 %, State funds for administrative and office expenses
8% and Ministry of Urban Development funds for administrative and office expenses 2%.
Project fund will be divided among the States and union territories at the beginning of each
year. An equitable formula is being used for distribution of funds in which 50% weightage is
given to urban population of each State and union territories and the number of Statutory Towns
in the State. The State Annual Action Plan (SAAP) has to decide on inter ULB allocation of
the funds. As reported in State Annual Action Plan 2015-16, Central Government contribute
47%, State Government 20% and ULBs 33% out of total allocated fund of INR 4323.20 for
Karnataka State under AMRUT Mission (refer Table-4.10). Sectoral allocation of this fund
reveals that water supply and sewerage gets major share in total allocation (refer Table-4.11).
Table- 4.10
Fund Sharing Pattern for AMRUT Mission in Karnataka
(in INR crore)
Centre 2025.14 (47%)
State 864.64 (20%)
ULB 1433.42 (33%)
Total 4323.20
Source: State Annual Action Plan 2015-16, Government of Karnataka (2016)
Table- 4.11
Sector Wise Fund Allocation for the AMRUT Mission in Karnataka
(Amount in INR Crore)
Sector 2015-16 2016-17 2017-18 2018-19 2019-20 Total
Water Supply 551.54 451.72 350.04 174.26 90.09 1617.65
Sewerage 612.65 484.25 502.50 396.60 270.97 2266.97
Storm Water Drains 48.80 83.00 84.43 49.50 22.00 287.73
Green Space & Parks 27.65 22.85 21.32 17.52 11.10 100.44
Urban Transport 17.90 11.00 11.00 6.00 4.50 50.40
Total 1258.54 1052.82 969.29 643.88 398.66 4323.19
Source: Source: State Annual Action Plan 2015-16, Government of Karnataka (2016)

27
Smart Cities Mission:
Ministry of Urban Development, Government of India has initiated Smart Cities Mission in
June 2016 with the objective to promote cities that provide core infrastructure and give a decent
quality of life to its citizens, a clean and sustainable environment and application of ‘Smart’
solutions. The focus is on sustainable and inclusive development of cities. The core
infrastructure elements in a Smarty City includes the following:
1. Adequate water supply
2. Assured electricity supply
3. Sanitation, including solid waste management
4. Efficient urban mobility and public transport
5. Affordable housing for poor
6. Robust IT connectivity and digitization
7. Good governance (e-governance)
8. Sustainable environment
9. Safety and security of citizens
10. Health and education
Mission covers 100 cities across India for five years from 2015-16 to 2019-20. Six cities in
Karnataka comes under Smart Cities Mission. In first year of initiation, Government has
proposed to provide Rs. 200 crore for each smart cities to create higher initial corpus followed
by Rs. 100 crore for next three years and matching contribution by the States/ULBs to fund the
program. ULBs can take steps for additional contribution through bond financing, PPPs,
multilateral borrowings etc.
Nagarothana Scheme:
It is a Karnataka State Government’s initiative for development of cities. This scheme is also
called as Chief Minister’s Small & Medium Town Development program. This scheme will
fund plans to develop tier two, three cities and smaller towns. District head quarter town,
Grade-A towns, City Municipal Councils, Town Municipal Councils, Town Panchayats,
Village Panchayats upgraded to Town Panchayats and newly created ULBs will get funds.
State is already in third phase of implementation and it has approved an amount of Rs. 2855
crore for this purpose. Government has announced 35 crore each for district headquarters, 25
crore each for 34 city Municipal Councils and 7.5 crore each for Town Municipal Councils
(“Rs 2855 crore for 271 cities”, 2016).

28
4.5 Urban Infrastructure: Current Status and Required Investments
It was found that many of the municipal corporations have surplus in the balance sheet. It was
also interesting to note that portion of revenue received is being spent as capital expenditure.
Overall the balance sheet appears to be better placed. However, an important question that need
to be answered is whether the current spending on capital formation is sufficient to meet the
need of growing urban population? In essence, whether present spending can meet the required
urban infrastructural needs? An answer to this question really puts up the critical financial
position of ULBs in Karnataka.
There are few important projections on urban infrastructural requirement at aggregate level.
High- Powered Expert Committee (HPEC) for estimating Investment requirement for Urban
Infrastructure Services has estimated urban investment requirement to be approximately
around 39.2 lakh crores for the time period 2012-2031 for India as a whole. These estimates
were arrived by consolidating services in 8 core sectors namely water supply, sewerage, solid
waste management, urban roads, storm water drains, urban transport, street lighting and traffic
support infrastructure. Working group on financing infrastructure by adopting the same method
as of HPEC estimated the spending requirements of the ULBs (GoI, 2011). The working group
has estimated the required capital expenditure to the tune of 1.86% of GDP for 10 years starting
from 2012-13.
Table-4.12
Financing Gap in Urban Infrastructure
(In Rs. Crore)
Year Required Capital & Maintenance Exp
Actual Capital & Maintenance Exp (3)
Financing Gap
GSDP criteria (1) Urban Popu criteria (2) (1-3) (2-3)
2012-13 5191.68 4664.61 1605.44 3586.24 3059.17
2013-14 6463.52 5563.59 1765.99 4697.53 3797.60
Data Source: Report of Working Group on Financing Infrastructure (GoI, 2011) & Economic
Survey of Karnataka, 2013-14.
In order to arrive at State level estimates on urban infrastructural spending, present study has
adopted two criteria to narrow down the estimates to Karnataka State. First criteria is GSDP
criteria and second is the Urban Population Criteria. As per GSDP criteria, percentage of

29
Karnataka’s GSDP in India’s GDP has been considered and as for as the population criteria,
Karnataka’s urban population in India’s urban population has been considered. Table-5.10
clearly reveals that there is financing gap of Rs. 4697.53 crore and Rs.3797.60 crore as per
GSDP criteria and urban population criteria respectively in the year 2013-14. Actual capital
and maintenance expenditure even does not cover one-third of the required investments. This
appears to be an alarming situation and Indian Governments should take necessary steps to fill
this gap. As the budget constraint restricts the spending of Central and State Governments, it
is utmost important for ULBs to raise the own revenue resources to fill the gap. It also appears
from the balance sheets of municipal corporations that many of them have not resorted to debt
financing as they have receiving remarkable amount as extraordinary receipts. As indicated in
Table-4.12 the required expenditure is too high and there is a need to fill this gap in order to
meet the basic requirements of the growing urban population. Property tax is the main source
of own revenue for ULBs in India. However, it was reported that property tax yields have
grown but in no way it reflects the real estate boom happened in many of Indian cities (NIPFP,
2011). It was also observed that inefficiencies reduced property tax by about 71%. A survey
conducted by NIPFP (National Institute of Public Finance and Policy, New Delhi) of 31
municipalities, nearly 54% of the tax demanded was not collected. The NIPFP report also found
that actual municipal revenue are less than a third of what is required (NIPFP, 2011).
There are two important means to fill the existing gap in required expenditure. They are
1. Public-Private Partnership
2. Market Based Financing (Bond Financing)
ULBs can have a partnership with private entities in meeting the required spending. PPPs are
important for bringing capital and efficiency into the infrastructural sector. In recent years,
newly formed Government of Telangana has endorsed PPPs in providing Foot Over Bridges in
ULBs, Pay & Use toilets in ULBs and Operation and Maintenance of street lighting in 9 ULBs
(GoT, 2016). It is being discerned that PPP success stories are rare in urban infrastructure
mainly because of inadequate cost recovery and associated political sensitivity (GoI, 2016a).
Government of India has taken many steps to promote PPPs in Infrastructure investments and
one among these initiative is ‘Viability Gap Funding’ scheme. As per the scheme Central
Government would provide total Viability Gap funding up to 20% of the total project cost. The
PPP projects may be posed by Central Ministries, State Governments and Statutory Authorities

30
like ULBs. There are great opportunities for ULBs to utilize the available provisions in order
to strengthen the private participation in funding infrastructure through PPPs.
In the western countries ‘bond financing’ is the main source of capital spending by the local
bodies. In United States of America (USA) counties and State authorities financed $3.2 trillion
in infrastructural investment using municipal bonds from 2003 to 2012 and nearly 75% of all
infrastructure projects are completed using bond financing (NAC, 2016). Whereas major
source of ULB financing for infrastructure development in Europe is through bank lending.
In India, since 1994, the Indo-US Financial Institution Reform and Expansion (FIRE-D) project
is working with National, State and Local Governments to develop a market based bond market
(Vaidya & Vaidya, 2008). It is noteworthy that several ULBs in India have already issued
bonds and mobilized around Rs12249 millions. Bond ratings are crucial for issuing bonds. The
ratings depends on financial condition of ULBs, credit worthiness, capacity of issuer to make
timely payments, economic base of service area etc. Ahmedabad Municipal Corporation was
rated ‘AA’ by CARE ratings in 2015. As of now, for many of the municipalities ratings are not
in use or ratings have been withdrawn. Greater Vishakapattanam Municipal Corporation was
the last to issue bond in the year 2010 (Singh, 2015).
Many of the medium and smaller Municipalities could not approach the bond market due to
several pre-required conditions. To overcome such problems concept of ‘Pooled Financing’
was brought out. Under this, a special purpose vehicle will be created by pooling several
municipalities. For instance, Tamil Nadu Urban Development Fund issued a bond by pooling
14 municipalities for commercially viable water & sewerage infrastructure project in 2003
(Vaidya & Vaidya, 2008). Subsequently, Government of Karnataka under the pooled financing
raised debt from investors for the Greater Bangalore Water Supply and Sewerage Project. It
covered eight municipal towns around Bangalore and had total project cost of Rs. 6000 million.
A debt fund called the Karnataka Water and Sanitation Pooled Fund was established under the
India Trust Act to access the capital market by issuing bond on behalf of participating ULBs
(Vaidya & Vaidya, 2008).
Approach to municipal bond market by ULBs in Karnataka is in depressing state. There is huge
funding requirement and also there exists an opportunity for the ULBs to tap the funding gap
through bond financing. However for reaching the bond market, ULBs have to furnish the
required details pertaining to its own revenue position, audit reports, in consort with timely
compliance to repayments etc. And on the same, ratings of local bodies are being grounded.

31
Karnataka Government should take an initiative to form an ‘organization’ through which ULBs
can approach bond market and the raised funds can be distributed among ULBs based on pre-
established criteria. Such an initiative would really help the ULBs particularly medium and
small ULBs in approaching and also raising required funds for capital formation.
Chapter-5
Conclusion
This study has analyzed the finances of ULBs in Karnataka. Analysis of fiscal indicators of
Karnataka revealed that all the indicators are in better position compared to other States in
India. However, it’s performance in human development needs attention. Rule based Fiscal
correction mechanism i.e., Karnataka Fiscal Responsibility Act, 2002 has significantly
contributed to fiscal deficit and liabilities reduction. It is good to note that Karnataka has
surplus in revenue account and hence the surplus is being spent for capital formation along
with borrowed amount.
Local bodies Finances consists of own revenue, devolution from State Governments, Central
Finance Commission grants and also Central Government grants. 74th Amendment of the
Indian Constitution in 1992 strengthened the decentralized structure in India. There has been
considerable progress in the empowerment of Panchayat Raj institutions and Municipalities in
India after the constitution amendments. Central Finance Commissions transfers grants broadly
under two heads: General Grants and Performance Grants with the intention to raise the
Consolidated Fund of the State Governments to support local bodies. The transferred amount
will be allocated among the local bodies based on criteria suggested by the State Finance
Commissions. Delay in formation of SFCs, Untimely submission of SFC reports, lack of
compliance of audited data are hindering the proper estimation and transfers to local bodies.
Even the Karnataka’s SFCs have also observed the serious data problems pertaining to local
bodies. This report too emphasis that concerned department should publically accomplish
detailed data on all tiers of ULBs to enable proper research on the subject.
Own revenue source of ULBs in Karnataka is less than one-third of total receipts and remaining
being the transfers from State and Central Governments. Property tax is the major source of
own revenue. It is depressing to note that only 48% of general grants released by 13th Finance

32
Commission has been utilized by ULBs. Among the expenditure, outlay on Salaries and wages
tops the list followed by maintenance expenditure and capital spending.
Karnataka is 5th most urbanized State in India and the urban population growth is significant
and much higher than the national urban population growth. It is projected that Karnataka
maintains same position until 2021. It was observed that nearly 12 Town Panchayats would be
upgraded as Town Municipal Councils and 9 TMCs to become City Municipal Councils by
2021 and hence necessities higher devolution in the near future. The rapid pace of urbanization
requires huge investments on infrastructure. ULBs has to play a significant role in meeting the
needs of the urban population. ULBs in Karnataka, particularly municipal corporations have
shown either balance or surplus in the balance sheets. This surplus was mainly owing to
‘extraordinary receipts’ from the Centre and State Government under the schemes like
AMRUT cities, Nagarothana scheme etc. However, the required infrastructural spending is
huge and present spending does not contribute even one-third of required funding. Given the
budget constraints of the Central and State Governments, ULBs have to take step to raise the
own revenue sources and also find out new avenues to meet the required spending. Two
important means in this regard are PPP and bond financing.
Municipal Bond Market has not been developed in India when compared to western economies.
It constitutes a meagre portion in overall receipts of ULBs and since 2010 there are no attempts
to raise money from bond market by ULBs. There is greater scope for ULBs to tap the required
amount from the Bond market. Karnataka Government should take an initiative to form an
‘organization’ through which ULBs can approach bond market. Funds which has been raised
has to be distributed among participating ULBs. Such an initiative would really help the ULBs
particularly lower tier of ULBs in approaching and also raising required funds for capital
formation.

33
Bibliography
GoI. (1994). Finance Commission report for 1995-2000. New Delhi: Finance Commission India.
GoI. (2000). Report of the Eleventh Finance Commission for (2000-2005). New Delhi: Finance
Commission India.
GoI. (2004). Report of the Twelfth Finance Commission (2005-10). New Delhi: Finance Commission
India.
GoI. (2009). Thirteenth Finance Commission 2010-2015. New Delhi: Finance Commission India.
GoI. (2011). Report of the Working Group on Financing Urban Infrastructure. New Delhi: Planning
Commission, Government of India.
GoI. (2015). Report of the Fourteenth Finance Commission. New Delhi: Finance Commission India.
GoI. (2015a). The Constitution of India. New Delhi: Ministry of Law & Justice, Government of India.
Retrieved from http://lawmin.nic.in/olwing/coi/coi-english/coi-4March2016.pdf
GoI. (2016). Census of India. New Delhi: Registrar General of India, Government of India.
GoI. (2016, November 10). Ministry of Urban Development. Retrieved from moud.gov.in:
moud.gov.in/legislation/constitution
GoI. (2016a, December 6). Smart Cities Mission. Retrieved from Ministry of Urban Development:
http://smartcities.gov.in/writereaddata/Financing%20of%20Smart%20Cities.pdf
GoK. (1996). Report of the First State Finance Commission. Bangalore: Government of Karnataka.
GoK. (2002). Second State Finance Commission Report. Bangalore: Government of Karnataka.
GoK. (2008). Report of Third State Finance Commission. Bangalore: Government of Karnataka.
GoK. (2013). Projected Population of Karnataka 2012-2021. DES No-22.
GoK. (2016). Accounts at Glance fro 1960-2015. Bangalore: Finance Department, Government of
Karnataka.
GoK. (2016). State Annual Action Plan (SAAP) 2015-16 Karnataka. Bangalore: Government of
Karnataka. Retrieved from http://amrut.gov.in/writereaddata/SAAP-AMRUT_Karnataka.pdf
GoK. (2016a). Report of Comptroller and Auditor General of India on Local Bodies. Bangalore:
Principal Accounts General, Government of Karnataka. Retrieved from
http://www.agkar.cag.gov.in/docs/Lakes%20report/Audit%20Report%20on%20Local%20Bo
dies-2015_English%20(Report%20No.4%20of%20the%20year%202016).pdf
GoT. (2016, December 6). PPP. Retrieved from Telangana Urban Finance and Infrastructure
Development Corporation: http://tufidc.cgg.gov.in/getInfo.do?dt=1&oId=12
McMilan, M. (2006). Local Government Orgaisation and Finance: Canada. In A. Shah, Local
Governance in Industrial countries (pp. 41-82). Washington D C: The World Bank
Publications.
NAC. (2016). Oppose Efforts to Eliminate or Limit the Tax-exempt Status of Municipal Bonds.
Washington D C: National Association of Counties.

34
NIPFP. (2011). Municipal Finance Matters. New Delhi: National Institute of Public Finance & Policy.
Prabhu, N. (2013, February 7). Economic Survey puts Karnataka's Growth at 5.9%. Business Line.
Retrieved November 14, 2016, from
http://www.thehindubusinessline.com/news/national/economic-survey-puts-karnatakas-
growth-at-59/article4389803.ece
Rs. 2,855 crore for 271 cities, towns under Nagarothana phase III. (2016, October 1). Retrieved from
The Hindu: http://www.thehindu.com/news/national/karnataka/Rs.-2855-crore-for-271-
cities-towns-under-Nagarothana-phase-III/article15420288.ece
Singh, C., & Singh, C. (2015). Financing of Urban Local Bodies in India. IIMB Working paper No-493, 1-
30.
Viadya, C., & Vaidya, H. (2008). Creative Fianncing of Urban Infrastructure in India through Market
based Financing and PPP Options. 9th Metropolis Congress, Sydney, Oct 22-26. Sydney.
Retrieved from
http://www.academia.edu/9586143/Creative_Financing_of_Urban_Infrastructure_in_India_
through_Market-based_Financing_and_Public-Private_Partnership_Options

35
Appendix-1
Projections on Upgradation of Lower Tiers of ULBs
Projection Method: Simple mathematical method has been used for projecting the population
level. The forecast is based on past trends (growth rate particularly) of the data. The growth
rate has been calculated between the two census years namely 2001 and 2011 and the same
was used to forecast population level till 2021. The formula used for calculation is as follows:
P = P0 (1 + r)^ t
P/P0 = (1 + r)^ t
Log10 (P / P0)
𝑡 = Log10 (1 + r)
10^x = 1+ r
r = (10^x )-1
Wherein,
P = Population as per 2011 census
P0 = Population as per 2001 census
t = 10 years
r = Growth rate
x = Log10 (P / P0)
𝑡
Based on above mentioned method, it was found that 12 Town Panchayats would be upgraded
to TMCs and 9 TMCs may become CMCs by the year 2021. The following ULBs are expected
to upgrade into higher tier:

36
Town Panchayats to Town Municipal
Councils
Town Municipal Councils to City Municipal
Council
1. Aurad
2. Gubbi
3. Hirekeruru
4. Honnavara
5. Honnali
6. Jagalur
7. Kerur
8. Khanapura
9. Konnur
10. Kundgol
11. Raybag
12. Sulya
1. Aland
2. Anekal
3. Athani
4. Bailahongala
5. Bangarpete
6. Harapanahalli
7. Humnabad
8. Malur
9. Manvi