government of odisha - desorissa.nic.in · the information on food and civil supplies, disaster...
TRANSCRIPT


GOVERNMENT OF ODISHA
Odisha Profile
2018
DIRECTORATE OF ECONOMICS & STATISTICS,ODISHA
ARTHANITI ‘ O’ PARISANKHYAN BHAWAN,
HEADS OF DEPARTMENT CAMPUS,
BHUBANESWAR – 751001

SURESH CHANDRA MAHAPATRA,IAS Tel : 0674-2536882 (O)
Development Commissioner-Cum- : 0674-2322617 Additional Chief Secretary & Secy. to Govt. Fax : 0674-2536792 P & C Department Email : [email protected]
MESSAGE
I am happy to know that Directorate of Economics and Statistics, Odisha has
come out with the publication "Odisha Profile, 2018" which gives synoptic view of
various socio-economic aspects of the State.
Development of the State envisages attainment of carefully planned goals
and formulation of policy to achieve these goals. There is a need to map out strategic
plans, set up machinery for execution of the plans and monitor the implementation
process for which the role of statistics is vital and relevant. Thus generation of
adequate, credible and timely data are essential for the purpose of policy
formulation and monitoring the progress achieved in various sectors of the
economy.
I appreciate the sincere efforts put in by the officers and staff of the
Directorate of Economics and Statistics for preparation and publication of this
report.
(Suresh Chandra Mahapatra)

Sri Gopabandhu Satpathy, IAS Phone : 0674-2392098
Special Secretary to Government Fax : 0674-2536792
Planning and Convergence Department
Government of Odisha
Foreword
Use of statistics on all aspects of our lives, our society and our economy
continues to grow. Administrative Statistics are very much needed for effective
planning and helps the Departments in discharge of their administrative functions and
implementation of policies/schemes. Moreover, administrative statistics do not incur
additional cost for data collection nor do they impose further burden on respondents.
Directorate of Economics & Statistics, Odisha is bringing out a publication on
'Odisha Profile, 2018' and it presents a consolidated and updated statistics on socio-
economic status of the State. This publication provides secondary information on
various socio-economic parameters of the State and will serve as a useful reference
tool to measure progress on various fronts.
I am sure that this document will be of immense use to the administrators,
planners, managers, professionals and academicians.
(G. Satpathy)

ସଙ୍କର୍ଷଣ ସାହୁ, ଭା.ପ.ସେ ଅର୍ଥନୀତି ଓ ପରିସଂଖ୍ୟାନ ଭବନ ନସିଦେଶକ Arthaniti ‘O’ Parisankhyan Bhawan
ଅର୍େନୀତ ିଓ ପରେିଂଖ୍ୟାନ HOD Campus, Unit-V
Sankarsana Sahoo, ISS Bhubaneswar -751005, Odisha
Director Phone : 0674 -2391295 Economics & Statistics e-mail : [email protected]
Preface
This publication “Odisha Profile, 2018” comprises of eight chapters. Chapter one
to chapter two focus on the information on Scope, Geographical Location, Demography,
Health, Education, Drinking Water, Sanitation facility available in the State.
Information on Agriculture, Animal Husbandry, Fisheries, Forest and Environment
with Water Resources, States finance and Macro Economy are available in chapter three
and four.
Chapter five and six gives light on information about Industry, Mining, Labour and
Employment, with Transport, Tourism and Banking Sector of the State.
The information on Food and Civil Supplies, Disaster Management, Urban
Development, Slum Scenario, Election and Excise are described in chapter seven whereas
the comparable picture of Odisha and India on various administrative aspects are described
in chapter eight.
We are grateful and also keep on record to the continuous co-operation of various
Government organisation in providing requisite data in time. I, express my
acknowledgement and convey my thanks to all Government Organization, Officers and Staff
of Publication Division and Computer Section who have made available data presented &
designing of the report.
Any suggestion/comments for improvement in the scope, layout and quality of the
publication are welcome.
Bhubaneswar
August, 2019 (S. Sahoo)

The Team
Sri Sankarsana Sahoo, ISS Director
Sri Ramesh Chandra Sarangi Joint Director
Sri Prafulla Kumar Behera Deputy Director
Sri Ranka Nidhi Sahoo Assistant Director
Sri Gatikrushna Behera Statistical Officer
Sri Sarat Chandra Sahoo Assistant Statistical Officer
Sri Sunil Prasad Pattanaik Assistant Statistical Officer
Sri Manoranjan Mohanty Assistant Statistical Officer
Smt. Bidyutlata Patsani Artist

Contents
Sl. No. Sector Page Number
1 CHAPTER ONE 1-11
Administrative Profile 7
Geography 9
Culture 11
2 CHAPTER TWO 12 - 46
Demography 12
Health & Family Welfare 23
Drinking Water & Sanitation 38
Education 39
3 CHAPTER THREE 47 - 75
Agriculture 47
Animal Husbandry 53
Fisheries 60
Forest & Environment 64
Water Resources 75
4 CHAPTER FOUR 82 - 92
State Finance 82
Macro Economy 86
5 CHAPTER FIVE 93 - 113
Industry & Mining 93
Energy 100
Labour & Employment 106
6 CHAPTER SIX 114 - 134
Transport 114
Tourism 122
Banks 127
7 CHAPTER SEVEN 135 - 141
Food & Civil Supplies 135
Disaster Management 137
Urban Development 138
Slum Scenario 139
Excise 140
Election 141
8 CHAPTER EIGHT 143-162
Odisha & India

Chapter One
Administrative Profile
Geography
Culture

Odisha Profile 2018
1
State Overview
Location
The modern State of Odisha is located between the parallels of 17.49'N and 22.34'N
latitudes and meridians of 81.27'E and 87.29'E longitudes. Bounded by West Bengal in the
northeast, Jharkhand in the North, Andhra Pradesh and Telengana in the South, Chattisgarh
in the West, the State is open to the Bay of Bengal on the East.
History
Odisha, with a rich heritage that is more than two thousand years old, has a glorious
history of its own. It was known under different names in different periods: Kalinga, Utkal
or Odradesha. Kalinga had made its mark in the Indian history when the Nanda dynasty
ruled the kingdom of Magadha. Ashok the Mauryan King of Magadh, conquerd Odisha, then
known as Kalinga in 261 BC and this event has gone down in history as the Great Kalinga
war. The Kalingan Empire reached the pinnacle of glory during the reign of Emperor
Kharavela in the second half of the Ist century B.C. Other great rulers belonged to the
Keshari dynasty and the Eastern Ganga dynasty who were also great builders. Subsequently,
Odisha came under the Moghuls and the Marathas and finally in 1803 A.D., under the
British. The modern state of Odisha (Formerly Orissa) was established on 1st April 1936,
as a separate province in British India.
Geography
Covering an area of 1,55,707 sq.km. (Extends for 800 kilometres from north to south
and 500 kilometres from east to west) Odisha has a stretch of coast line of about 480 kms
on the Bay of Bengal. It is the 9th largest State in India by area and 11th largest State by
population accounting for 4.7 % of the geographical area and 3.7 % of the population of the
country. Puri, Ganjam, Cuttack, Bhubaneswar, Mayurbhanj, Balasore, Khordha and
Sundargarh are some of the major districts/cities of the State in terms of population.
Bhubaneswar is the capital city of Odisha.
Geology
Situated on the eastern fringe of the peninsular India, Odisha has about 73% of the
area occupied by Precambrian metamorphic rocks (of Archaean and Proterozoic age) which
host the majority of the minerals. The Gondwanas hosting the coal resources occur over
about 8% of the land mass. The Tertiary and Quaternary formations, occupying rest of the
area, provide avenues for aluminous/nickeliferous laterite and heavy minerals (in beach

Odisha Profile 2018
2
sand).
The mountainous region of Odisha covers about three-quarters of the area of the state.
Geologically it is a part of the Indian Peninsula which as a part of the ancient landmass of
the Gondwanaland.
Physiography
Odisha's topography comprises fertile plains along the coast and forested highlands
towards the interior. On the basis of homogeneity, continuity and physiographical
characteristics, Odisha has been divided into five major morphological regions: the Odisha
Coastal Plain in the east, the Middle Mountainous and Highlands Region, the Central
plateaus, the Western rolling uplands and the major flood plains.
The State is broadly divided into 4 Physiographic Zones namely Coastal Plains,
Central Table Land, Northern Plateau and Eastern Ghats. These are further sub-divided into
10 Agroclimatic Zones namely North Western Plateau, North Central Plateau, North Eastern
Coastal Plain, East and South Eastern Coastal Plain, North Eastern Ghat, Eastern Ghat High
Land, South Eastern Ghat, Western Undulating Zone, Western Central Table Land and
Mid Central Table Land.
Soil
The State has different soil types ranging from fertile alluvial deltaic soils in the
coastal plains, mixed red and black soils in the Central Table Land, red and yellow soils with
low fertility in the Northern Plateau and red, black & brown forest soil in Eastern Ghat
region. The soils of Odisha have been divided into eight broad groups.
Forests
The State has varied and wide spread forests
harbouring dry deciduous, moist deciduous forests as
well as mangroves with several unique, endemic, rare
and endangered floral and faunal species. Almost one-
third of Odisha is covered by forests which make up
about 34.90% of the total land area of the State. These
forests cover most of southern and western Odisha.

Odisha Profile 2018
3
Rivers
Rivers in Odisha though not perennial, serve the
basic requirement of the State. These rivers are
divided into four groups which flow through Odisha
into the Bay of Bengal, They are
(i) Rivers that have a source outside the State
(the Subarnarekha, the Brahmani and the Mahanadi).
(ii) Rivers having a source inside the State (the Budhabalanga, the Baitarini, the Salandi,
and the Rushikulya).
(iii) Rivers having a source inside the Odisha, but flow through other states (the Bahuda,
the Vansadhara, and the Nagavali).
(iv) Rivers having a source inside Odisha, but tributary to rivers which flow through other
states (the Machhkund, the Sileru, the Kolab, and the Indravati).
The State has 7 major river deltas of varies sizes and shapes formed by the rivers
Subarnarekha, Budhabalanga, Baitarani, Brahmani, Mahanadi, Rushikulya and Bahuda.
The longest river flowing through the heart of Odisha is Mahanadi. It is 851 kms long
(494kms in Odisha) and its catchment area spreads over 141,134 sq kms (65,628 sq kms in
Odisha).
River
Total Catchment
Area
(sq. kms)
Area
inside Odisha
(sq. kms)
Percentage to
Geographical
area of State
Length inside
Odisha
(kms)
Mahanadi 1,41,134 65,628 42.15 494
Brahmani 39,116 22,516 14.46 541
Baitarani 14,218 13,482 8.66 360
Budhabalanga 6,691 6,354 4.08 199
Subarnarekha 19,277 2,983 1.92 79
Rushikulya 8,963 8,963 5.76 175
Bahuda 1,118 890 0.57 78
Climate
Standing on the coastal belt, the weather in Odisha is greatly influenced by the sea.
The climate of the region is tropical resulting in very high temperature in the months of April
and May. The weather of Odisha can be classified under three broad heads namely, summer,

Odisha Profile 2018
4
monsoon and winter. The state is also endowed with relatively short stints of the refreshing
spring and the mellow autumn. However, the sea exercises a moderating influence over the
climate of the coastal belt whereas the hill tracts experience an extreme climate.
Rainfall
The average rainfall in Odisha is measured as 1482 mm. The State receives about
78% of rainfall between the months of June & September and the remaining 22% of the
rainfall throughout the year.
Administrative Setup
Odisha comprises of 30 districts. These 30 districts have been placed under three
different revenue divisions to streamline their governance These divisions are North, South
and Central, with their headquarters at Sambalpur, Berhampur and Cuttack respectively.
There are 317 tehasils, 314 community development blocks, 6799 gram panchayats and
51313 villages in the State. The number of habited villages are 47677.
Literature
Odia, one of the oldest languages in the country having Sanskritic origin, is the
predominant language spoken in the State and its outlying tracts. A direct descendant of
eastern Magadhi, Odia is the principal and regional language of Odisha. Odia has also many
linguistic variations within the State boundaries.
Mother Toungue in Odisha as per Census 2011
Mother Toungue % of Person Mother Toungue % of Person
Total Odia 100 Proja 0.45
Odia 90.77 Bhatri 0.31
Sambalpuri 7.58 Others 0.06
It may be mentioned here that according to linguistic survey of India for Odisha, in
1991 census, in comparison to national bilingualism (which was 19.44%) Odisha had
slightly lower percentage (that was 18.79%) & with regard to national average rate of
trilingualism (which was 7.26%) Odisha had slightly higher percentage (that was 9.22%).
Odisha has one of the most diverse tribal populations in India, with 62 tribes,
including 13 primitive tribes, residing in the State. Linguistically defined, a number of
independent tribal languages are spoken within the boundaries of modern Odisha. There are

Odisha Profile 2018
5
four written tribal languages found in modern Odisha. These are Santhali, Saura, Kui and
Ho. The districts in which the major 8 tribal languages are mostly spoken are
Language Tribal Districts Language Tribal Districts
Santali Mayurbhanj Kuvi Rayagada
Sadri Sundargarh, Jharsuguda Koya Malkangiri
Munda Mayurbhanj,
Keonjhar,Sundargarh Saora Ganjam, Gajapati
Kui Kandhamal, Kalahandi Desia Koraput, Nawarangpur,
Malkangiri
Religion
Even though the Hindus form the majority of the religious populace, Odisha is a
land of religious harmony. According to 2011 census; the Hindus formed 93.63 per cent of
the total population of Odisha while the Christians 2.77 percent, Muslims 2.17 percent,
Sikhs 0.05 percent and Buddhists 03 percent.
Heritage & Culture
The Odisha culture has a three tiered structure with interfaces and interpolation, the
tribal/ethnic, the folk/peasant and the urban/classical which existed side by side enriching
and enlarging the cultural dimensions. The State is known for its fascinating cultural
heritage, amazing temples and monuments and spectacular architecture. The cultural
heritage of Odisha is one of the oldest, embracing a period of about three thousand years
with its historical monuments, archaeological sites, traditional arts, sculpture, dance, music
and literature. The excavations at Sisupalgarh and Jaugada testify to the presence of a highly
developed pre-historic civilization . The indigenous culture of the Adivasis (tribes) is an
integral part of the modern cultural expressions of Odisha.
Music & Dance
The artists of Odisha not only excelled in
architecture, but also in performing arts. The artistic
sensibility of Odias has been well reflected in art and
architectures of world famous temple at Konark,
Rajarani at Bhubaneswar, Shree Jagannath of Puri,
Lingaraj at Bhubaneswar and of many monuments &
rock, caves. The figures of dancers, musicians carved

Odisha Profile 2018
6
on ancient temple walls speak of Odisha’s rich
musical heritage. The musical tradition of Odisha
had a glorious past, dating back from 1st Century
B.C. when king Kharvela, the ruler of Odisha
(Kalinga) patronized this music and dance. There
are historical evidences in the form of
sculptural evidences i.e. musical instruments,
singing and dancing postures of damsels in the
Ranigumpha Cave in Khandagiri & Udayagiri
hills at Bhubaneswar.
The most significant contribution of Odisha to
Indian culture is the Odissi dance, one of the
many forms of Indian classical dance. The
Odissi tradition existed in three schools; Mahari,
Nartaki, and Gotipua. The magnificent Sun
Temple at Konark, built in the 13th century, with
its Natyamandap or Hall of dance, marks the
culmination of the temple activity in Odisha. These dance movements, frozen in stone,
continue to inspire Odissi dancers even today .
Folk dances like 'Chau' and 'Sambalpuri' along
with tribal dances like 'Ghumura' & 'Paraja' leave
every spirit truly elated .Chau Dance is a war
dance with firm roots in martial arts tradition of
Odisha.
Tourism
From the time immemorial Odisha attracts a large number of scholars, artists and
tourists. Odisha boasts of playing host to some of the vibrant events of India such as the
Konark Dance Festival, Car Festival, Puri Beach Festival, etc. The list is exhaustive with
splendidvariety. The State promoted as Scenic, Serene, and sublime is extremely rich
in cultural diversity that ranges from community events to promotional events. Odisha is
one of the major tourism sectors of India, with various tourists' attractions, ranging from
wildlife reserves, beaches, temples, monuments, the arts and festivals. It is blessed with
a plethora of natural wonders, from breathtaking beaches and lakes to a wide variety of

Odisha Profile 2018
7
wildlife nestled in some of the most beautiful
forests in the country. Golden Triangle is the most
popular tourist attraction and covers three most
beautiful Tourist Places of Odisha, those are Puri,
Konark and Bhubaneswar.
Art & Crafts
The State‟s arts and crafts offer visitors
indelible experience of its cultural artifact,
marvelously manifested in its Patta paintings, Silver
filigree, Ikat silks, and stone carvings. Raghurajpur is
an idyllic rural tourism destination and along with
another village in Pipili bring alive the old traditions
into a mesmerizing canvas. Sand sculpture, a unique
type of art form which is developed at Odisha spreads
all over the world .
Administrative Profile
Items INDICATORS STATISTICS
Date of Formation 1st April 1936
State Capital Bhubaneswar
Location
Eastern coast of Indian Peninsula
Latitude 17 º 49' N - 22 º 34' N
Longitude 81 º 27' E - 87 º 29' E
Boundary Bay of Bengal
East Chhattisgarh
West Jharkhand
South Andhra Pradesh
North West Bengal
South West Telengana
Area as on 2016
Geographical Area (Sq. Kms.) 1,55,707
Rural (Sq. Kms.) 1,52,355.34
Urban (Sq. Kms.) 3,351.66
Total Scheduled Areas (Sq. Kms.) 69,613.8
% of Scheduled area to State's
Geographical Area 44.7
Tribal Sub-Plan Area (Sq. Kms.) 51,920.25
Land Mass (%) 4.7% of India’s Land mass

Odisha Profile 2018
8
Items INDICATORS Value
Population and
administrative setup, As on 2016
(in Numbers )
Scheduled Tribe Communities 62
Scheduled Caste Communities 93
Particularly Vulnerable Tribal Group 13
Total Districts 30
Tribal Districts 13
Subdivisions 58
Tahsils 317
Blocks 314
Tribal Sub Plan Blocks 119
Gram Panchayats 6,799
Total Villages 51,313
Inhabited villages 47,677
Urban Local Bodies
(In nos.) as on 2018
Total Urban Local Bodies 114
Municipal Corporation 5
Municipalities 47
Notified Area Council 62
Towns
Statutory Towns 107
Census Towns 116
Proportion of Urban Population (%) 16.68
Urbanization Ratio (%) 20
Major Airport Biju Patanaik International
Airport, Bhubaneswar
Total number of Police station , 2018 617
Number of Mahila Police Station
2016 6
Number of Fire Station, 2017 318
Major Religion Hindu, Muslim, Christian
Official Language Odia
As per 2011 Census
(In %)
Scheduled Language 92.94
Other language 8.15
Odia 82.70
Others 7.91
Hindi 1.20
Telugu 1.59
Santali 2.06
Urdu 1.60
Bengali 1.20
Persons who returned the language as
their mother tongue 89.39

Odisha Profile 2018
9
Items INDICATORS STATISTICS
Physiography
Physiographic Zones
4 Zones
Physiographic Zones
(in nos.)
Northern Plateau
Eastern Ghat
Central Table Land
Coastal Plain
Agro-climatic zones
(In nos.)
Agro-climatic zones
10 Zones
North Western Plateau
North Central Plateau
North Eastern Coastal Plain
East and South Eastern
Coastal Plain
North Eastern Ghat
Eastern Ghat High Land
South Eastern Ghat
Western Undulating Zone
Western Central Table Land
Mid Central Table Land
Morphology
Major Morphological
zones
(In Nos)
Morphological zones
5 Zones
Coastal Plains
Middle Mountains &
Highland Regions
Central Plateau
Western rolling uplands
Major flood plains
Soil
(In M Hectares)
Number of Taxonomically Broad Soil
Groups 8
Red loamy and red sandy soil 7.14 (45.54 %)*
Mixed red and Yellow Soil 5.50 (35.14 %)
Black Soil 0.96 (6.20%)
Laterite and lateritic soil 0.70 (4.52%)
Deltaic alluvial Soil 0.67 (4.33 %)
Coastal Saline and Alluvial Soil 0.25 (2.52 %)
Brown Forest Soil 0.17 ((1.10 %)
Mixed red and black Soil 0.16 ((0.65 %)

Odisha Profile 2018
10
Items INDICATORS STATISTICS
River Basins
Major Rivers Basins
(Nos.)
Major River Basins 11
Subarnarekha
Budhabalanga & Gambhira
Baitarani
Brahmani
Mahanadi
Rushikulya
Bahuda
Vansadhara
Nagavali
Indravati
Kolab
Climates
Type Tropical
Annual Normal Rain fall (in mm) 1451.2
Actual Average Rain fall (mm)(2018) 1643.3
Mean annual temperature
(in centigrade) 26.89
% of deviation 13.24
Maximum temperature (Centigrade) 32.56
Minimum temperature (Centigrade) 21.3
State Symbols
State Animal Sambar Deer
State Bird Indian roller (Blue Jay )
State Tree Peepal
State Flower Ashoka
State anthem of Odisha Bande Utkal Janani
State food of Odisha Pakhala

Odisha Profile 2018
11
Culture ITEMS INDICATORS 2015-16 ( In nos.)
Collection in
State Museum Total Number of Artifacts 56,375
Gallery
Archaeology 237
Armoury 209
Manuscripts 37,273
Bronze 100
Painting 239
Art & Craft 1,260
Epigraphy 139
Numismatics 12,882
Natural History 500
Anthropology 2,566
Antiquities at Central Store 890
Harekrushna
Mahtab State
Library
Number of Books 2,17,640
Total number of Users per day 600
Total number of seats 350
Monuments Protected Monuments 218
Source: - State Museum Odisha

Chapter Two
Demography
Health & Family Welfare
Drinking Water & Sanitation
Education

Odisha Profile 2018
12
Demography
Population of Odisha is 419,74,218 comprising of 212,12,136 males and 207,62,082
females, contributing 3.7 percent to India’s total population as per census 2011. In terms of
population size, the State is at 11th rank in this census .States that are larger in population
size compared to Odisha are Uttar Pradesh, Maharashtra, Bihar, West Bengal, Andhra
Pradesh (undivided), Tamilnadu, Madhya Pradesh, Rajasthan, Karnataka and Gujarat in
descending order of population .The population density of the State is 270 as against the
national average of 382 per sq.km in 2011 showing an increase of 34 points from 2001.
In Census 2011, India has registered a decadal growth of 17.70 percent and Odisha
that of 14.05 percent, over the Census 2001 figures. Thus, the growth rate in the state is
lower by 3.65 percentage points compared to national average. The growth rate of
population did not display systematic increase. It varied from decade to decade. After
independence the growth rate of population during the decade 1941-51 was only 6.38 % as
against the all India growth rate of 13.31 % which increased to 19.82 % during 1951-61 and
the rate of growth was the highest during 1961- 71 with 25.05 % which came down to
20.17 % during the decade 1971-81 and it further reduced slightly to 20.06 % during 1981-
91.During the last decade 1991- 2001 the growth rate has decreased to 16.25 % as against
the all India growth rate of 21.54 %.
Empowered Action Group (EAG) was set up to facilitate preparation of area specific
programmes in eight states, namely, Bihar, Jharkhand, Madhya Pradesh, Chhattisgarh,
Odisha, Rajasthan, Uttar Pradesh and Uttarakhand which have lagged behind in containing
population growth to manageable levels. EAG states constitute 45.9 percent share in total
population of the country. Odisha is fifth most populous among the EAG states. Bihar has
registered highest growth rate of 25.1 percent whereas Odisha has registered the lowest
growth rate of 14.0 percent among EAG states.
During 2001- 2011, the share of children to total population has been declined and
the decline was more for female children than male children in the age group 0-6
years.While the size of child population in the age group (0-6 years) is declining with decline
in the share of children in the total population, the share of girls in 0-6 years is declining
faster than that of boys of 0-6 years. This process has led to missing of nearly 2.2% girl
children compared to 1.0% missing boy children in 2011, compared to 2001.

Odisha Profile 2018
13
Source :Census of India
The sex ratio (Females per one thousand males) of the State encouragingly stands at
979 against the national ratio of 943. However, urban sex ratio of Odisha remains lower at
932 as against the rural sex ratio of 989.
Source :Census of India
The child sex ratios is a vital indicator to assess status of male female ratios and
deviations from normal patterns. Though, the overall sex ratio of the State is showing a
trend of improvement, the child sex ratio is showing a declining trend, which is a matter of
concern. The 1991 census reported a child sex ratio (CSR) of 967 girls per 1000 boys. This
declined to 953 in the 2001 census and now stands at 941 as per the 2011 census as against
the national ratio of 918. The overall decline in the child sex ratio has been reported by 12
points.
103.03 113.79 111.59 124.91 137.08 146.46175.49
219.45
263.7
316.6
368.05
419.74
0
50
100
150
200
250
300
350
400
450
1901 1911 1921 1931 1941 1951 1961 1971 1981 1991 2001 2011
(in
lakh
)Odisha Population Trend
1037
1056
1086
10671053
1022
1001988
981971 972
979
900
920
940
960
980
1000
1020
1040
1060
1080
1100
1901 1911 1921 1931 1941 1951 1961 1971 1981 1991 2001 2011
Sex Ratio Trend in Odisha (Females per '000 Population)

Odisha Profile 2018
14
.While there were only 5 districts in 1991 with the CSR below 950, as per 2001 Census data
there were 13 districts where the CSR was below 950. As per Census 2011 data, 16 districts
are below 950. The child sex ratio of the district of Nabarangapur at 998 is the highest. The
lowest Child Sex Ratio is in the district of Nayagarh with 855 . The highest Sex ratio has
been recorded both in rural(999) and urban (971) areas in Nabarangpur district where as
lowest sex ratio has been recorded in Nayagada district both in rural (857) and urban (835)
areas.
Source :Census of India
Odisha is no exception to the demographic transition of population ageing both in
numbers and proportion of the population. The percentage of senior citizens in the total
population of Odisha is higher than the national average .The present proportion of senior
citizens is 9.5 per cent .
The State has 45% of its geographical area as scheduled area. The tribals who
comprise of about more than one-fifth population of the state are located in specific regions.
The districts of Gajapati, Kandhamal, Keonjhar, Koraput, Malkangiri, Mayurbhanj,
Nabarangpur,Rayagada and Sundergarh have more than 40% tribal population. Odisha has
the highest percentage of ST population after the North Eastern states. The uniqueness of the
Odisha is that there are about 62 tribes residing with their specific culture and living
standards, which is the highest among all the states of the country
There are 12 major tribes such as Kondha, Gondh, Santhal, Saura, Kolha, Munda,
10351020
995
967 963
941
976964 962
945
927 924
860
880
900
920
940
960
980
1000
1020
1040
1060
1961 1971 1981 1991 2001 2011
Child Sex Ratio in Odisha and India
Odisha India

Odisha Profile 2018
15
Paraja, Bhuyians, Kisan, Oraon, Koya and Gadaba. According to their origin and habitat
they are variously designated as Adimajati (primitive castes), Janajati (folk communities),
Girijana (hill folk), Vanajati (forest dwellers),
There are 93 Scheduled Castes who are found all over the state comprising of 16.20
% of the total population of the state, which is more or less comparable to the all India
percentage. Some of the main SCs are Bauri, Dhoba, Dong, Gandha, Hadi, Kandara, Pana,
Ghasi, Gokha, Chamara.
Overall literacy of Odisha has been increased from 63.1 at 2001 census to 72.9 at
2011 census. Male literacy rate has increased from 75.3 percent to 81.6 percent. It is
heartening to note that female literacy rate has increased from 50.5 percent to 64.0 percent
during the decade. The difference between male and female literacy rate has reduced from
24.8 percentage points in 2001 Census to 17.6 percentage points during 2011 Census.
Similarly, the gap between literacy rate in urban and rural areas has steadily declined, the
gap stands at 15.53 points in 2011 Census. The male literacy rate of Odisha at 81.6 percent
is less than the male literacy rate of India at 82.14 percent in 2011 Census. The census
provided positive indication that growth in female literacy rates (27.90%) was substantially
faster than in male literacy rates (8.29%) in the 2001–2011 decadal period, which means the
gender gap appears to be narrowing.
Literacy rate in Odisha
Year Total literacy Male Female Gender Gap
1951 15.8 27.32 4.52 22.8
1961 21.66 34.68 8.65 26.03
1971 26.18 38.29 13.92 24.37
1981 33.62 46.39 20.6 25.79
1991 49.09 63.09 34.68 28.41
2001 63.08 75.35 50.51 24.84
2011 72.87 81.59 64.01 17.58
Source : Census of India

Odisha Profile 2018
16
Items Indicators As per 2011 Census
Households
(2011 Census)
(In numbers)
Total 96,05,629
Rural 80,69,620
Urban 15,36,009
Average Households Size 4.3
Female Headed Household 10,18,943
Houseless Households 10,334
Population
(2011 Census)
(In numbers)
Total 4,19,74,218
of India’s Population 3.47 (11th in Position)
Male 2,12,12,136
Female 2,07,62,082
Rural 3,49,70,562
Urban 70,03,656
Other Population 20,332
Child Population Total 52,73,194
Male 27,16,497
Female 25,56,697
Rural 45,25,870
Urban 7,47,324
Population Density 270
Rural 230
Urban 2,090
Scheduled Caste Population Total 71,88,463
Male 36,17,808
Female 35,70,655
Rural 62,18,642
Urban 9,69,821
Scheduled Tribe Population Total 95,90,756
Male 47,27,732
Female 48,63,024
Rural 89,94,967
Urban 595,789
Projected Population, 2018
Total Population 4,60,19,138
Male 2,32,02,951
Female 2,28,16,187
Rural 3,77,53,622
Urban 82,65,516
Child Population
(In numbers)
Total Population 52,14,078
Male 26,96,972
Female 25,17,106
Rural 44,02,397
Urban 8,11,681
Schedule Caste
Population (In numbers)
Total Population 80,80,638
Male 40,55,383
Female 40,25,255
Rural 68,68,750
Urban 12,11,881

Odisha Profile 2018
17
Items Indicators As per 2011 Census
Schedule Tribe
Population (In numbers)
Total Population 1,07,52,837
Male 52,52,820
Female 55,00,017
Rural 1,00,24,437
Urban 7,28,400
Religion
(In numbers)
Hindu 4,28,56,261
Muslim 10,33,621
Christian 13,91,293
Sikh 25,812
Budhist 17,570
Jain 9,611
Others 7,49,086
Sex Ratio
(2011 Census)
(Number of females per ‘000
males)
Sex Ratio Total 979
Rural 989
Urban 932
Scheduled Caste 987
Rural 988
Urban 979
Scheduled Tribe 1,029
Rural 1,031
Urban 991
Child sex Ratio Total 941
Rural 946
Urban 913
Scheduled Caste 987
Scheduled Tribe 1,029
RELIGION
(2011 Census)
(In Percentage)
Hindu 93.63
Muslim 2.17
Christian 2.77
Sikh 0.05
Buddhist 0.03
Jain 0.02
Other Religions and persuasions 1.14
MIGRATION
(In Numbers)
(figures in parenthesis indicate %)
Total Migrants 1,46,67,346
Male Migrants 35,21,268 (24.01%)
Female Migrants 1,11,46,078 (75.99%)

Odisha Profile 2018
18
Items Indicators As per 2011 Census
Reason for Migration
(In Numbers)
Work/Employment 9,46,565
(6.45%)
Business 2,45,690
(1.68% )
Education 4,17,383
(2.85%)
Marriage 87,69,815
(59.79%)
Moved after birth 5,96,256
(4.07%)
Moved with household 19,61,884
(13.38%)
Others 17, 29,753
(11.79%)
Percentage of population
living in villages of various
population size with reference
to the total rural population
(In Percentage)
All sizes 100
Less than 200 3.27
200-499 12.85
500-999 24.41
1000-1999 31.14
2000-4999 24.52
5000-9999 3.44
10000 & above 0.36
Literacy
(In Numbers)
Total Literates 2,67,42,595
Male 1,50,89,681
Female 1,16,52,914
Rural 2,13,77,915
Urban 53,64,680
Scheduled Caste Literates 43,03,743
Male 24,78,584
Female 18,25,159
Rural 36,64,674
Urban 6,39,069
Scheduled Tribe Literates 42,15,630
Male 25,22,307
Female 16,93,323
Rural 38,58,094
Urban 3,57,536

Odisha Profile 2018
19
Items Indicators As per 2011 Census
Literacy Rate
(In Percentage)
Total Literacy Rate 72.87
Male 81.59
Female 64.01
Rural Literacy Rate 70.2
Male 79.6
Female 60.7
Urban Literacy Rate 85.7
Male 90.7
Female 80.4
Gender Gap in Total Literacy Rate 17.6
Decline in Gender Gap(2001-2011) 29.2
Scheduled Caste Literacy Rate 69.02
Male 79.21
Female 58.76
Rural 68.05
Urban 75.18
Scheduled Tribe Literacy Rate 52.24
Male 63.70
Female 41.20
Rural 51.08
Urban 69.08
Slum Population (In Numbers)
Total Slum Households 3,50,032
Total Population 15,60,303
Male 8,00,963
Female 7,59,340
% of Slum Population to total
Population 3.72
Total Child Population (0-6) 1,88,962
Boys 97,551
Girls 91,411
Total Sex Ratio 948
Total Child Sex Ratio 937
% Slum SC to total Slum Population 20.6
% Slum ST to total Slum Population 12.8
Slum Population -Literacy Rate 69.0
Slum Population Work Participation
rate 36 .0
% of slum population main worker to
slum worker 85.0
% Slum Population Marginal
Workers Rate against slum Workers 17.0

Odisha Profile 2018
20
Items Indicators As per 2011 Census
Disabled Population (In Numbers)
Total Population 12,44,402
Male 6,74,775
Female 5,69,627
Rural 10,67,739
Urban 1,76,663
Total Child Population (0-6) 81,105
Boys 44,192
Girls 36,913
Rural 69,747
Urban 11,358
Total Literates 6,61,598
Male Literates 4,30,761
Female Literates 2,30,837
Rural Literates 5,42,544
Urban Literates 1,19,054
Total Workers 4,27,020
Main Workers 2,49,524
Marginal Workers 1,77,496
Elderly Population
(Per ‘000 Persons)
Persons aged 60 & above 3,984
Females 1,990
Male 1,994
Rural 3,440
Urban 545
% 9.5
Elderly Literacy
(In Percentage)
Literacy rate for persons aged 60 & above 43.7
Females 24.3
Male 63.1
Rural 40.3
Urban 65.4
10-14 Years 43,48,625
15-19 Years 39,25,398
20-24 Years 37,83,527
Adolescent (10-19) 82,74,023
Youth (15-24) 77,08,925

Odisha Profile 2018
21
Items Indicators As per 2011 Census
Elderly Literacy
(In Percentage)
Male Population
10-14 Years 22,03,535
15-19 Years 19,72,684
20-24 Years 18,70,939
Adolescent (10-19) 41,76,219
Youth (15-24) 38,43,623
Female Population
10-14 Years 21,45,090
15-19 Years 19,52,714
20-24 Years 19,12,588
Adolescent (10-19) 40,97,804
Youth (15-24) 38,65,302
Rural Population
10-14 Years 37,05,396
15-19 Years 32,40,171
20-24 Years 30,78,847
Adolescent (10-19) 69,45,567
Youth (15-24) 63,19,018
Adolescent and
Youth Population (In Number)
Urban Population
10-14 Years 6,43,229
15-19 Years 6,85,227
20-24 Years 7,04,680
Adolescent (10-19) 13,28,456
Youth (15-24) 13,89,907
Literates Population
10-14 Years 39,92,091
15-19 Years 34,63,189
20-24 Years 31,68,738
Adolescent (10-19) 74,55,280
Youth (15-24) 66,31,927
Male Literates
10-14 Years 20,49,503
15-19 Years 18,11,881
20-24 Years 16,83,088
Adolescent (10-19) 38,61,384
Youth (15-24) 34,94,969

Odisha Profile 2018
22
Items Indicators As per 2011 Census
Adolescent And Youth
Population (In Number)
Female Literates
10-14 Years 19,42,588
15-19 Years 16,51,308
20-24 Years 14,85,650
Adolescent (10-19) 35,93,896
Youth (15-24) 31,36,958
Working Population
10-14 Years 2,72,016
15-19 Years 12,25,974
20-24 Years 19,59,582
Adolescent (10-19) 14,97,990
Youth (15-24) 31,85,556
Male Working Population
10-14 Years 1,40,004
15-19 Years 7,30,945
20-24 Years 12,81,209
Adolescent (10-19) 8,70,949
Youth (15-24) 20,12,154
Female Working Population
10-14 Years 1,32,012
15-19 Years 4,95,029
20-24 Years 6,78,373
Adolescent (10-19) 6,27,041
Youth (15-24) 11,73,402
Rural Working Population
10-14 Years 2,49,766
15-19 Years 11,14,846
20-24 Years 17,22,369
Adolescent (10-19) 13,64,612
Youth (15-24) 28,37,215
Urban working Population
10-14 Years 22,250
15-19 Years 1,11,128
20-24 Years 2,37,213
Adolescent (10-19) 1,33,378
Youth (15-24) 3,48,341
Source: Census of India, 2011

Odisha Profile 2018
23
Health & Family Welfare
Health and socio-economic developments are so closely intertwined that it is
impossible to achieve one without the other. Health is a priority goal in its own right, as well
as central input into economic development and poverty reduction. Since the year 1947, there
has been a gradual improvement in the health status of the population due to several factors
including developmental and educational interventions, economic improvement and better
health care services. The health system in Odisha is largely publicly provided. By the end
of 2017-18, the State has 1974 Government Medical Institutions, comprising 141 Hospitals,
376 Community health Centres, 1275 Primary Health Centres and 199 Mobile Health Units
(MHU) for providing health services with 18387 beds. In addition 1771 number of Private
Sector Medical Institutions with 15,977 beds are also functioning, whereas it was provided
through a network of 365 Government Medical institutions with 3112 hospital beds & 1083
doctors during 1951.
The State has witnessed a decadal growth rate of 13.97per cent in the last decade,
lower than the national decadal growth rate of 17.64 (Census, 2011). The State has achieved
the goal of reaching TFR of 2.1 which is a great achievement towards population
stabilization measure. As an overall measure of health, total life expectancy in Odisha is
65.8 years (67.1 for females, 64.7. for males), which is lower than the national average of
67.9 years (69.6 for females, 66.4 for males) for the year 2010-14.
Reduction of maternal and child deaths is one of the major challenges of the health
system in Odisha. The Maternal Mortality Ratio has come down from 358 deaths per
1,00,000 live births in 2001-03 to 180 per 1,00,000 in 2014-16
Maternal Mortality Ratio in Odisha
1991-01 2001-03 2004-06 2007-09 2010-12 2011-13 2014-16
Maternal
Mortality Ratio
(MMR)
Odisha 424 358 303 258 235 222 180
India 327 301 254 212 178 167 130
Maternal
Mortality Rate
Odisha 36.7 29.5 24.9 19.5 16 15.1 12.3
India 31.2 27.4 20.7 16.3 12.4 11.7 8.8
Source : Registrar General India
Infant and Under five mortality rates are excellent indicators of health status of the
children.

Odisha Profile 2018
24
Infant Mortality Rate (IMR) Odisha as per NFHS
Year Total Rural Urban
NFHS -1 (1992-93) 112.1 117 85
NFHS-2 (1998.99) 81 80.9 81.1
NFHS-3 (2005-06) 65 69 40
NFHS-4 (2015-16) 40 43 21
Source : NFHS India
According to the 4th round of the National Family Health Survey (NFHS)-2015-16
the IMR in Odisha has been reduced to 40 which was 65 per 1000 births in NFHS-3 as
against the national average of 41 (which was 57 in NFHS-3). Similarly the Under 5
Mortality of State has also declined from 91.6 in 2005-06 to 49 in 2015-16 (NFHS-4) which
is better than all India point decline from 74 to 50 during the said period.
According to SRS report of Registrar General of India there is also a remarkable
reduction in Infant Mortality Rate (IMR) in Odisha by 29 points from 75 in 2005 to 44 in
2016 as per SRS 2016.
These encouraging achievements may be attributed to enabling policies, programmes
and sustained efforts made by State government over last one decade like establishment of
Newborn Care Corners, Newborn Stabilization Units and Sick Newborn Care Units (SNCU),
Nutrition Rehabilitation Centers, promotion of institutional deliveries through JSY and
JSSK etc.
Neonatal Mortality Rate (NMR) has been reduced from 45.4 (NFHS-3) to 28.4
(NFHS-4) which has kept pace with decline in IMR. The institutional delivery is also a
preventive measure to reduce the IMR & also MMR.
According to NFHS, percentage of institutional delivery has increased from 35.6 %
in 2005-06 to 85.4% in 2015-16. NFHS-4 (2015-16) reveals that 94.5% of mothers have
been protected against neonatal tetanus. Almost all mothers have received antenatal care for
their most recent pregnancy and increasing number of women are receiving the
recommended four or more visits by the service providers. As per the report, 62% of
pregnant women in Odisha had four antenatal visits and 97.2% of pregnant women had
registered under Mother and Child Tracking System

Odisha Profile 2018
25
Infant Mortality Rate (IMR) Odisha (As per SRS)
Year Total Rural Urban
2005 75 78 55
2006 73 76 53
2007 71 73 52
2008 69 71 49
2009 65 68 46
2010 61 63 43
2011 57 58 40
2012 53 55 39
2013 51 53 38
2014 49 51 36
2015 46 48 35
2016 44 46 34
Due to effective service delivery mechanism, substantial improvement has been
noticed in utilization of public health facilities by the people. More and more women are
now given birth at health care facilities as the institutional delivery rates have substantially
improved from 35.6 to 85.4% in the State of Odisha in the last decade. Moreover, 75.9%
institutional deliveries have been conducted in public health facilities .Odisha also recorded
47.1 point increase in institutional Births in Public Facility from 28.8% in 2005-06 to 75.9%
in 2015-16 and is higher than all India average of 52.1 % and 3rd highest in the country as
per NFHS- 2015-16 .
The State is focusing on improvement of the IMR and Under-five mortality rate
by ensuring universal immunisation coverage; early detection and treatment of diarrhoea,
pneumonia and malnutrition; improved access to quality nutrition supplementation at the
Anganwadi centres In addition to continuance of BCG, DPT, Polio, TT, Measles &
Hepatitis-B, four new vaccines have been included in Immunization program, namely,
Pentavalent (prevents Hepatitis-B, Diptheria, Pertusis, Tetnus & HiB), Inactivated Polio
Vaccine (prevents Polio), Rota virus vaccine (prevents Rota virus Diarrhoea) & Japanese
encephalitis vaccine (prevents Japanese encephalitis fever). As per NFHS survey report the
full immunization coverage has improved from 43.7 % in 1998-99 to 78.6% in 2015-16 .This
translates into a staggering 2,84,000 more children being immunized annually compared to
the year 1999.
Odisha Profile 2018
26
The National Health Mission envisages achievement of universal access to equitable,
affordable and quality health care services that are accountable and responsive to peoples
need. National Vector Borne Diseases Control Programme (NVBDCP) is a major National
Disease Control Programme, functioning as an integral part of the National Health Mission
(NHM). In Odisha malaria poses major public health problem, with high morbidity and
mortality followed by Filariasis and Dengue. There is geographical variation in the
distribution of malaria cases within the districts, blocks and sub-centres. During 2018, the
malaria incidence was around 66,282 cases, 54,003 Pf cases and 3 deaths with 1.48 % of
Annual Parasite Incidence (API). More than 46,697 ASHAs and community volunteers have
been trained as Fever Treatment Deport holders ( FTD) at the village level to ensure early
diagnosis and complete treatment at the grass root level. Indoor Residual Spray (IRS)
operation is being conducted twice a year to protect around 65 lakh population residing in
high endemic areas. Filariasis has been a major public health problem in the State next only
to malaria. Government of India launched nationwide Mass Drug Administration (MDA) in
2004 in endemic areas as well as home based morbidity management, scaling up
hydrocelectomies in hospitals and CHCs. During 2,016 89.41% population are covered
under MDA. Eight Districts passed in Transmission Assessment Survey (TAS) & MDA
has not been conducted in these Districts. National programme for Health care of Elderly
started in 8 districts and is being extended to 30 districts of the State. National Program for
prevention and control of cancer, diabetes, cardiovascular disease and stroke are included in
Non Communicable Disease and all 30 districts are covered under the programme. Civil
registration is a system where Birth, Death, Still birth and infant death are registered at their
place of occurrence. Our State is having 314 Rural Registration Units and 102 Urban
Registration units. Out of which online registration system is going on in 314 Rural CHC &
44 Urban Local Bodies in the State. During the year 2017, the number of Birth & Death
Registration is 6,92,658 & 3,22,660 respectively.

Odisha Profile 2018
27
ITEMS INDICATORS 2010-14 (In %)
Vital Statistics
(In Percentage)
Expectation of life at birth
Total 65.8
Male 64.7
Female 67.1
Total Rural 65.2
Rural Male 64.1
Rural Female 66.5
Total Urban 69.8
Urban Male 68.7
Urban Female 71.0
FM Ratio (Female Male Ratio) 1.04
Per annum increase in Expectation of life
Male 0.46
Female 0.53
Expectation of life at age Total
NFHS-4 1 68.4
5 65.5
10 60.9
20 51.6
30 42.6
40 33.7
50 25.2
60 17.5
70 11.4
Expectation of life at age Male
1 67.1
5 64.2
10 59.6
20 50.3
30 41.4
40 32.5
50 24.3
60 16.9
70 10.9
Expectation of life at age Female
1 69.8
5 66.9
10 62.2
20 53.0
30 43.9
40 34.9
50 26.2
60 18.1
70 11.8
Source : Registrar General India

Odisha Profile 2018
28
Items Indicators Value
Maternal Health (2012-13)
per 1,00,000 live births
Maternal Mortality Ratio 230
Maternal Mortality Rate (%) 15.1
Fertility Indicators
Per 1,000 persons
Crude Birth Rate 2016 18.6
Rural 19.6
Urban 13.7
Projected Crude Birth Rate 2021-25 14.4
General Fertility Rate,2016 66.3
Rural 70.5
Urban 46.7
Total Fertility Rate, 2016 2.0
Rural 2.1
Urban 1.4
Mean Age of Fertility Total, 2016 28.2
Rural 28.2
Urban 28.1
Gross Reproduction Rate , 2016 0.9
Rural 1.0
Urban 0.7
Live births where the mothers
received medical attention at delivery (%) 79.7
Govt. Hospital (%) 79.7
Private Hospital (%) 17.3
Qualified professional (%) 9.8
Untrained functionary and others (%) 10.4
Mortality Indicator
(NFHS-4) , 2015-16
per ‘000 children
Child mortality rate (0-4) 8.9
Rural 9.7
Urban 4.5
Under-Five Mortality Rate 48
Rural 52
Urban 24
Infant Mortality Rate 40
Rural 43
Urban 20
Neo-natal mortality rate 28.4
Rural 30.3
Urban 17.3
Post neo-natal mortality rate 11.6
Rural 13.0
Urban 3.5
Source : Registrar General, India

Odisha Profile 2018
29
Items Indicators Value
Mortality
Indicators (SRS)
(per 1000 persons)
Crude Death Rate 2016 7.8
Rural 8.1
Urban 6.1
Male (2016) 8.5
Female (2016) 7.1
Projected Crude Death Rate 2021-25 8.1
Natural Growth rate , 2016 10.8
Rural 11.4
Urban 7.6
Child mortality rate (0-4) , 2016 12
Rural 13
Urban 8
Under-Five Mortality Rate , 2016 50
Rural 52
Urban 38
Male ,2016 49
Female ,2016 51
Infant Mortality Rate, 2016 44
Rural 46
Urban 34
Male (2015) 45
Female (2015) 47
Neo-natal mortality rate , 2016 32
Rural 33
Urban 24
Percentage of Neo-natal death to Infant deaths 73.2
Post neo-natal mortality rate, 2016 12
Rural 12
Urban 10
Early neo-natal mortality rate , 2016 24
Rural 25
Urban 17
Peri-natal mortality rate , 2015 37
Rural 38
Urban 25
Still birth rate , 2015 13
Rural 14
Urban 9
Source: SRS Bulletin 2015 &2016, Registrar General of India

Odisha Profile 2018
30
Items Indicators Value
Government Health
Infrastructure (2017-18)
(In Numbers)
Sub Centres 6,688
Sub Centres in Tribal Areas (Rural) 2,998
Primary Health Centres 1,275
Primary Health Centres in Tribal Areas (Rural) 449
Community Health Centres 376
Community Health Centres in Tribal Areas (Rural) 112
Sub Divisional Hospital (SDH) 33
District Hospital (DH) 32
Medical colleges & Hospitals 5
Other Hospitals 54
Infectious Disease Hospital 5
Mobile Health Unit 199
Auxiliary Nursing Midwives (ANM )Training school 19
General Nursing Midwives (GNM )Training School 8
Multipurpose Health Worker (MPHW) Training School 3
B.Sc. (N) colleges 1
Post Basic B.Sc. (N) college 1
M.Sc. (N) college 1
Cancer Institute 1
Training Centres 5
Ayurvedic Hospitals (Not attached to College) 2
Ayurvedic College & Hospitals 3
Ayurvedic Dispensaries 619
Homoeopathic College & Hospitals 4
Homoeopathic Dispensaries 561
Unani Dispensaries 9
Blood Banks 79
Private Health
Infrastructure (2017-18)
(In numbers)
Medical colleges & Hospitals 5
Ayurvedic Colleges 3
Homoeopathic Hospitals 2
Auxiliary Nursing Midwives (ANM )Training school 47
General Nursing Midwives (GNM )Training School 24
B.Sc. (N) colleges 6
Source: Annual Report 2017-18 & Outcome Budget 2016-17 Health & Family Welfare
Department, Government of Odisha,

Odisha Profile 2018
31
Items Indicators Value
Average Rural Population (Census 2011) Covered by a
Sub Centre 5,229
PHC 27,321
CHC 94,515
Average Rural Area
Covered by (in Sq. Kms)
Sub Centre 23
PHC 119
CHC 412
Average Radial Distance (Kms)
Covered by
Sub Centre 2.69
PHC 6.15
CHC 11.45
Average number of village
Covered by (In Number)
As on 31.03.2017
Sub Centre 7
PHC 37
CHC 127
Number of Sub Centres per PHCs 5
Number of PHCs per CHC 3
Average Rural Population(Census 2011)
Covered by a Health Worker( M) 9,989
Average Rural Population(Census 2011)
Covered by a Health Worker( F)/ANM 4,295
Intake Capacity Of
Medical Colleges (In Number) As on 31.03.2017
MBBS 1,050
BDS 250
Sub Centres (2016-17)
(In Number)
As on 31.03.2017
In Govt. Building 4,317
In Rented Building 2,009
Rent Free Panchayat / Vol. Society
Buildings 362
Buildings Under Construction 1,044
PHC And Other Hospitals
(2016-17) (In Number)
As on 31.03.2017
In Govt. Building 1,253
In Rented Building 0
Rent Free Panchayat / Vol. Society
Buildings 27
Buildings Under Construction 27
Community Health Centres (In Number)
As on 31.03.2017
In Govt. Building 377
Sub Centres (In Number)
As on 31.03.2017
In Govt. Building 1,867
In Rented Building 659
Rent Free Panchayat / Vol. Society
Buildings 163
Buildings Under Construction 499
PHC AND OTHER
HOSPITALS (In Number)
As on 31.03.2017
In Govt Building 407
In Rented Building 18
Rent Free Panchayat / Vol. Society
Buildings 1
Buildings Under Construction 18
COMMUNITY HEALTH
CENTRES (In Number)
As on 31.03.2017
In Govt. Building 135

Odisha Profile 2018
32
Items Indicators Value
SUB CENTRES as on 31.03.2016
(in numbers)
Without Regular Water Supply 3,804 (42.5%)
Without Electric Supply 3,041(45.5%)
Without All-Weather Motorable
Approach Road 182(2.7%)
PHC AND OTHER
HOSPITALS
as on 31.03.2016
(in numbers)
Without Regular Water Supply 221(16.9%)
Without Electric Supply 172(13.2%)
Without All-Weather Motorable
Approach Road 6 (0.5%)
With Telephone 237(18.2%)
With Labour Room 584(44.8%)
With at least 4 beds 28(2.1%)
With Operation Theatre 59 (4.5%)
Referral Transport 44
Registered R.KS 1305
COMMUNITY HEALTH
CENTRES
as on 31.03.2016
(in numbers)
With all four specialist 11
With functional Laboratory 377
With functional O.T 312
With functional Labour Room 377
With functioning Stabilization Units for
New Born 26
With New Born Care Corner 352
With at least 30 beds 60
With functional X Ray machine 77
With referral transport available 377
Registered R.KS 377
SUPPORT MANPOWER
POSITION (2016-17)
(In numbers)
Doctors ,2017-18 3,340
Pharmacists 1,691
Staff Nurse 1,817
Lab Technician (Path) 465
Multi-Purpose Health Worker (Male) 3,319
Multi-Purpose Health Worker (Female) 7,169
Radiographer 68
Multi-Purpose Health Supervisor
(Female) 802
Doctors per Lakh population 10
Homoeopathic Doctors 440
Ayurvedic Doctors 469
Unani Doctors 3
Source: Health & Family Welfare Deptt , Odisha Rural Health Statistics ,India

Odisha Profile 2018
33
ITEMS INDICATORS (In numbers)
RURAL HEALTH
MANPOWER
As on 31.03.2016
Health Worker (Female)/ANM at Sub Centre & PHCs 8,142
Health Worker (Male) at Sub Centres 3,501
Health Assistant (Female) LHV at PHCs and Other
Hospitals 802
Doctors at PHCs and Other Hospitals 959
PHCs and Other Hospitals with Lady Doc-tor 525
PHCs and Other Hospitals with AYUSH facilities 1,162
Surgeons at CHCs 75
Obstetricians & Gynecologists at CHCs 154
Physicians at CHCs 60
Pediatricians at CHCs 65
Total Specialists at CHCs 354
General Duty Medical Officers Allopathic at CHCs 722
Radiographers at CHCs 56
Pharmacists at CHCs & PHCs 1,650
Laboratory Technician at CHCs & PHCs 465
Nursing Staff at CHCs & PHCs 1,411
RURAL HEALTH
MANPOWER IN
TRIBAL AREAS
Health Worker (Female)/ANM at Sub Centre 2,932
Health Worker (Female)/ANM at Sub Centre & PHCs 3,193
Health Worker (Male) at Sub Centres 1,204
Health Assistant (Female) LHV at PHCs 181
Doctors at PHCs 297
Surgeons at CHCs 9
Obstetricians & Gynecologists at CHCs 25
Physicians at CHCs 8
Pediatricians at CHCs 14
Total Specialists at CHCs 55
Radiographers at CHCs 26
Pharmacists at CHCs & PHCs 574
Laboratory Technician at CHCs & PHCs 170
Nursing Staff at CHCs & PHCs 462
Source: Health & Family Welfare Deptt , Odisha Rural Health Statistics ,India

Odisha Profile 2018
34
Items Indicators Value
NO OF CASES TREATED
(2017-18)
(In Numbers)
Acute Respiratory Infection
(including Influenza and excluding Pneumonia) 23,32,208
OPD 2,30,27,48
2
IPD 29,460
Acute Diarrhoea disease
(Including Gastro Enteritis Etc.) 7,2,64,578
OPD 6,62,770
IPD 63,687
Enteric Fever 58,717
OPD 52,975
IPD 5,742
Pneumonia 24,729
OPD 19,663
IPD 5,066
Others 9,828
OPD 8,652
IPD 1,176
Patients treated (Ayurvedic) ,2017 57,66,606
Patients treated (Homoeopathic) ,2017 54,45,615
Patients treated (Unani),2017 8,951
Annual Blood Examination Rate( ABER) (%) 13.74
Annual Parasite Incidence. (API ) 1.48
Positive cases (Number) 66,282
Mortality for Malaria (Number) 3
Case Fatality Rate (CFR) 0.005
Plasmodium falciparum (Pf) cases (Number) 54,003
Plasmodium falciparum (Pf) 81.47
Test Positive Rate for Malaria (TPR) 1.08
DENGUE
(2017)
Number of Positive cases of Dengue 4,138
Number of Death casein Dengue 6
Case Mortality rate Dengue (%) 0.14
REVISED
NATIONALTUBERCULOSIS
CONTROL PROGRAMME
(RNTCP) 2017
Number of case detected 7,30,323
Number of case cured 5,81,210
Treatment Success Rate (%) 80
NATIONAL
LEPROSYERADICATION
PROGRAMME (NLEP)
Prevalence rate of Leprosy
(Per’0000 population) 10.44
Number of cases on Record 9,576
No of cases cured 9,576

Odisha Profile 2018
35
Items Indicators Value
NATIONAL PROGRAMME
FOR CONTROL OF
BLINDNESS
( NPCB)
(2017-18)
(In Numbers)
Number of School Children Screened 12,77,037
Refractive cases Detected 2,76,853
Number of Cataract Operations 1,32,887
Free Spectacles to School children 90,242
Number of Collection of donated eyes 1,344
No of Eyes Utilised 1,049
AIDS
(As on March 2017)
(In Numbers)
Total HIV +ve Cases detected (Total ) 41,298
General 39,132
ANC 2,166
Death due to AIDS 1,504
Age Group Less than 14 2,695
15-24 3,683
25-49 30,413
50+ 2,297
Not Specified 64
Prevalence Rate among pregnant Women
(%) 5
FAMILY PLANNING
(As per 2017-18)
(In Numbers)
Total Sterilization 87,784
Vasectomy 2,377
Tubectomy 1,14,604
IUCD Insertation 1,67,168
Oral Pill Users 1,50,653
CC Users 1,27,035
Institutional Delivery Coverage 5,84,077
Full Immunisation Coverage 4,71,030
Medical Termination of Pregnancies 24,222

Odisha Profile 2018
36
Items Indicators Value
MATERNAL HEALTH &
NEWBORN CARE
(As per 2015-16 )
(In Numbers)
Total ANC Registered 8,05,684
Women registered under JSY 77,92,359
(96.7%)
Pregnant women received 3 ANC check ups 7,15,798
(88.8%)
TT2 or Booster given to Pregnant women 7,29,793
(90.6%)
Pregnant women given 100 IFA tablets 6,01,715
(74.7%)
Hb (Hemoglobin) level < 11 (tested cases) 5,49,828
Total Deliveries reported 6,82,543
Institutional delivery 6,15,371
(90.16%)
Deliveries Conducted at Public Institutions 5,45,118
C– Sections conducted 92,009
(15%)
Home delivery 67,172
(9.84%)
Home deliveries attended by SBA trained
(Doctor/Nurse/ANM)
13,023
(19.4%)
Home deliveries attended by Non SBA trained
(trained TB/Dai) 54,153
% Safe deliveries to Total Reported Deliveries 92.1
PNC care through home visit
Women receiving post partum check-up within 48
hours after delivery 4,56,721
Women received a post partum check up
between 48 hours and 14 days 6,09,133
Live Birth 6,71,544
Still Births 16,224
New borns weighed at birth 6,61,252
(98.5%)
Newborns having weight less than 2.5 kg 1,26,698
CHILD HEALTH
(As per 2016-17)
(In Lakh Numbers)
Immunization
D.P.T. 6.74
Polio 6.72
B.C.G. 6.62
Measles 6.80
DT 7.19
TT(PW) 6.70
Children fully immunized 2015-16 6.81
TT(10 years) 6.12
TT(16 years) 5.82
Vitamin A Dose (Less than 1 year) 2015-16 6.94
Children given Vitamin A Dose 9 to Children given
Vitamin A dose1 (%) 2015-16 0.01

Odisha Profile 2018
37
Items Indicators Value
NUTRITIONAL STATUS
0-3 Years
Total number of Children 22,20,711
Number of Children Weighed 20,77,522
Normal (%) 18,18,834
Moderately Under Nourished (%) 2,44,109
Severely Under Nourished (%) 14,580
Under Weighted (%) 2,58,689
3-6 Years
Total number of Children 14,40,535
Number of Children Weighed 14,23,702
Normal (%) 11,94,735
Moderately Under Nourished (%) 2,18,658
Severely Under Nourished (%) 10,310
Under Weighted (%) 2,28,967
Source: Department of Health &Family Welfare, Odisha. Rural Health Statistics India 2015
,Health &Family Welfare Statistics India Odisha State Aids Control
Society(OSACS),Directorate of Health Service,Bhubaneswar and W & C.D Deptt.
Odisha,Bhubaneswar

Odisha Profile 2018
38
Drinking Water & Sanitation
Items Indicators Value
Main Source of drinking
water
(2011 Census)
Total number of Household 96,61,085
Household using Tap water 13.8
Household using well water 19.5
Household using hand pump/tube well water 61.4
Household using other sources of water 5.2
Availability of drinking
water facility (%)
Within premises 22.4
Near premises 42.2
Away 35.4
Ground Water Source (MLD 369.8
Surface Source (MLD)
Total Numbers Wards 2,025
Number of Wards Fully Covered by PWS 1,192
Number of Wards Partially Covered by PWS 704
Population Benefitted
Total population benefitted (In lakh numbers) 68.04
Through House service connections
(In lakh numbers) 28.10
Through Public Stand Posts (In lakh numbers) 27.96
Connectivity
(In Numbers)
House service connections 4,32,376
Functional Hand Pump Tube Wells 37,801
Public Stand Posts 27,961
Rural Water Supply
(As on 01.04.2018)
(In Numbers)
Total Habitations 1,55,013
Habitation Covered with piped water supply 42,238
(26.90%)
Population Covered with piped water supply (Lakh
number)
165.95
(46.37%)
Habitation fully Covered with > 55 LPCD 68,542
Habitation partially Covered with > 55 LPCD 85,959
Habitation fully covered with> 40 LPCD 146,196
Habitation partially covered with> 40 LPCD 8,305
Quality affected Habitation 2,512
Connectivity
(as on 01.04.2018)
(In Numbers)
Tube Well 4,43,802
Sanitary well 13,095
Total Spot Sources 45,690
PWS commissioned 1,074
SANITATION
Availability of Latrine
Facility
(2011 Census)
Total Households (In numbers) 96,61,085
% Household using Water Closet 16.2
Pit latrine (%) 3.5
Other Latrine (%) 2.4
Source: Census of India, H&UD Department , Odisha, ,Ministry Drinking water &
sanitation, India , PR & Drinking Water Dept, Odisha

Odisha Profile 2018
39
Education
Education in Odisha is witnessing a rapid transformation. Odisha has faired
reasonably well in terms of literacy rate. The overall literacy rate according to census 2011
is 72.87 % which is marginally behind the national average of 74.04%. The effective literacy
rate in the State works out to 72.99% (Rural 70.2% ; Urban 85.7%) . There has been an
increase 9.8% in the effective literacy rate (10.4% in rural areas & 4.9 % in urban areas)
during the last decade. The rural/urban distribution of literacy rates reveal that increase was
higher in rural areas than in urban areas. As the figures for gender specific literacy show
there exists a gap of only 17.6 percentage points (Census 2011), as against the national
average of 16.3 percentage points .The faster growth of female ,S.C &S.T literacy in Odisha
during the decades were instrumental in the impressive rise of overall literacy rate in the
state.
Analysis of data pertaining to the literacy rate of Odisha from 1951 to 2011 reveals
that although the literacy rate has increased from 15.80 in 1951 to 72.87 per cent in 2011.
The male literacy rates in Odisha has increased from 27.32 per cent in 1951 to 81.59 in 2011,
which was higher than the national average(80.89%) and during 1951 and 2001 it is on par
with the national average. Although the female literacy rate in Odisha in 1951 was only 4.52
per cent and it has increased to 64.01 in 2011, which is little below the national female
literacy rate(64.64%). The decadal increase in literacy was highest during 1981-91(15.47%)
followed by 1991-01(13.99%) and it was always higher than the national average from
1981-91.
Decadal Growth in Literacy
Period Odisha India
1951-61 5.86 9.33
1961-71 4.32 6.15
1971-81 7.44 9.12
1981-91 15.47 8.64
1991-01 13.99 13.2
2001-11 9.79 9.24
Source: Census of India
Significant efforts have been made in the last fifty years to universalize elementary
education. Since 1950, impressive progress has been made in every sphere of elementary
education. When Orissa became a separate province on April 1, 1936 comprising of seven
districts, the literacy rate was 7 per cent, whereas the percentage of literacy for the entire

Odisha Profile 2018
40
country at that time was 12 per cent. Further, at the time of Independence, in 1947- 48, the
entire state had only 6,814 primary schools with an enrolment of 2.55 lakhs, 286 Middle
English (M.E) schools with 32,000 children and 106 Secondary schools with 15,000
children.
There has been a substantial growth in the number of primary schools in the state. In
1950-51, there were 9801 primary and 501 upper primary schools which have increased
substantially to 36070 and 22019 respectively during the year 2017-18 to provide education
at elementary level. Apart from this, the ratio between primary and upper primary schools
in the state was 23.8 in 1947- 48 which has come down to 1.64 in 2017-18.
Availability of School in Odisha
The number of teachers in primary schools in Odisha in 2017-18 is 175725 as against
16520 in 1947-48. Similarly, in upper primary schools, the number of teachers in 2017-18
is 108739 as against 1483 in 1947-48. The State aims at providing primary schools within
1 km and upper primary schools within 3 kms of habitation having population of more than
300 and 500 respectively.
Considerable progress has been made so far as enrolment at primary and upper
primary levels of education is concerned. 60 lakh children of 6 to 14 years age group are
in-school, out of which 11 lakh are Scheduled Caste children and 18 lakh are Scheduled
Tribe children. 3649 children of 6 to 14 years age group are out-of-school. The enrolment
for girls are 28.91 % of the total enrolment in elementary schools..
37012 37056 36399 36550 36760 36318 36070
21117 21289 21945 22497 22795 23096 22019
0
5000
10000
15000
20000
25000
30000
35000
40000
2011-12 2012-13 2013-14 2014-15 2015-16 2016-17 2017-18
(In
Nu
mb
ers)
Number of Primary and Upper Primary Schools in Odisha
Primary School Upper Primary Schools

Odisha Profile 2018
41
Gross Enrolment Ratio & Net Enrolment Ratio are the two most important
indicators of enrolment. In 1947-48 the Gross Enrolment Ratio in primary schools was 14
per cent and by 2017-18, this ratio increased to 96.8 per cent. Similarly, the Gross Enrolment
Ratio in upper primary schools during 1947-48 was only 3.3 per cent which has increased to
103.41 per cent in 2017-18.Similarly Net Enrolment Ratio in primary level has increased
from 78.58 % in 2005-06 to 91.92% in 2017-18. For upper primary level Net Enrolment
Ratio has increased from 71.84 % in 2005-06 to 84.65 % in 2017-18.
Net Enrolment Ratio in Odisha
Year Primary Uper Primary
2005-06 78.58 71.84
2006-07 82.06 73.11
2007-08 84.23 76.62
2008-09 92.72 85.52
2009-10 92.88 85.68
2010-11 91.83 83.84
2011-12 93.27 90.84
2012-13 93.61 91.57
2013-14 93.85 91.38
2014-15 91.01 82.49
2015-16 90.23 81.79
2016-17 91.00 83.36
2017-18 91.92 84.65
Source: OPEPA Odisha
During 2000-01 dropout rate in primary level was 41.80% which has significantly
declined to 5.81 in 2017-18.Accordingly dropout rate for Scheduled Caste & Scheduled
Tribe has decreased from 52.4 & 64.1 during 2000-01 at primary level to 3.75 and 9.35
respectively during 2017-18.The upper primary drop out rate for all category has also
declined from 57% during 2000-01 to 5.45 % during 2017-18. Similarly, the drop-out rates
among the Scheduled Castes and Scheduled Tribes at the upper primary stage has also
decreased significantly during the same period. Scheduled Caste and Scheduled Tribe drop
out rate at Upper primary level was 59.7 & 74% respectively during 2000-01 and it has
decreased to 3.82%, 10.22% respectively during 2017-18 .The data reveals that the drop-
out rates among the girls at the primary stage decreased from 41.4 per cent in 2000-01 to
5.61 % in 2017-18. Further, the drop-out rate among the girls at the upper primary stage
was 61.1 per cent in 2000-01, which has come down to 4.90 % in 2017-18 .

Odisha Profile 2018
42
In Odisha 9872 schools are imparting Secondary education. Of the total schools,
about 54.31 percent schools are being managed by the Government. There are 0.62
Secondary schools per 10 sq. km. of area . The ratio of Upper Primary to Secondary
schools/sections reveals that there is an average one Secondary school/section for every 3.33
sets of Upper Primary schools/sections.
Overall enrolment in the State at secondary level has increased from 15000 in 1947-
48 to 1248344 in 2017-18. The Gross Enrolment Ratio at secondary level is 80.21 which
stands for Scheduled Caste at 91.58 and for Scheduled Tribe it is 68.43 .
The gender parity index in case of Secondary enrolment is 1.01 which is slight higher
than the same in case of Primary and Upper Primary levels of education (0.94). The transition
rate from elementary to secondary level is as high as 91.73 percent, which is even higher
than the transition from primary to upper primary level of education (90.85%).
There are 12 Universities including 4 newly private universities, 94 Government
colleges and 787 aided colleges for imparting higher education in the State .Technical
education is imparted through 6 nos. of Government and 87 nos. private engineering
colleges during 2015-16. Further 30 Government and 117 private engineering schools
/polytechnics are providing education in diploma engineering courses with 7878 and 37440
sanctioned intake strength. Similarly there are 5 Government Medical Colleges & 5 private
Medical Colleges having 1050 and 600 intake capacity respectively.
So far as the education outcome and quality of education in rural areas is concerned
Annual Status of Education Report(ASER) 2016 for Odisha reveals that from the age group
of 6-14 years of children 88.9% are enrolled in Government School whereas 8.9 % are
enrolled in private School. The same at national level stands at 65.4% and 30.5%
respectively . The percentage of children in this age group who are not attending the school
is 2.2% for Odisha which is much lower than that at national level (3.1%).
As per the national policy on Early Childhood Care and Education (ECCE) pre-
school education is an indispensable foundation for lifelong learning and development, and
has critical impact on success at the primary stage of education. Provision of pre-school
education (PSE) for children aged 36-71 months is another important component of the
ICDS programme.

Odisha Profile 2018
43
In the age group of 3years the Children enrolled in different types of pre-school and
school are 84.9 % out of which 81.8 % are in anganwadi centres (higher than that at national
level-53.6%) and 3.1% are in LKG. 83.9% of pre school age student of age 4 years are
enrolled in anganwadi centres (National level status is 52.3% ) and 10.8% children are in
LKG /UKG .15.1% of children in the pre school age group of 3years and 5.2% of children
in the pre school age group of 4 years are not in school
Items Indicators Value
SCHOOL
2017-18
(In numbers)
Total School (Elementary & Secondary) 67,961
Elementary 58,089
Primary only 36,070
Upper primary only 3,307
Primary with Upper primary 18,712
Total Upper primary 22,019
Secondary school having Primary &
Upper primary sections 7,190
Total schools having Primary &
Upper primary sections 65,279
Secondary only 2,682
Total Secondary School 9,872
SCHOOL BY
CATEGORY
(ELEMENTARY)
2017-18
(In nos.)
Department of Education 49,261
Tribal & Social welfare Dept 1,265
Total Govt School. 50,526
Private Aided 1,915
Government & Private Aided 52,441
Private Unaided 2,778
Others 113
Central Government 7
Un Recognized 2,750
Upper Primary School/Section (per 100 sq. kms ) 15
ENROLEMENT
2016-17
(In numbers)
Total Elementary 59,72,870
Girls student 28,89,837
Scheduled Caste student 11,42,489
Scheduled Tribe student 17,85,192
Total Primary 37,71,249
Girls 18,29,730
Boys 19,41,523
Scheduled Caste student 71,10,083
Scheduled Tribe student 11,74,137
Total Upper Primary 22,01,621
Girls student 10,60,114
Scheduled Caste student 4,31,406
Scheduled Tribe student 6,11,055

Odisha Profile 2018
44
Items Indicators Value
OUT OF SCHOOL
CHILDREN
2016 (in numbers)
Total Out of school children (6-11) 1,394
Boys 723
Girls 671
Total Out of school children (6-14) 3,649
Boys 1,917
Girls 1,732
Total Out of school children (11-14) 2,255
Boys 1,194
Girls 1,061
DROPOUT RATE
2017-18
(In %)
Primary 5.81
Scheduled Caste 3.75
Scheduled Tribe 9.35
Girls 5.61
Upper primary 5.45
Scheduled Caste 3.82
Scheduled Tribe 10.22
Girls 4.90
Total Elementary 5.63
Scheduled Caste 3.79
Scheduled Tribe 9.78
Girls 5.25
GROSS ENROLMENT
RATIO (%)
Total 96.80
Primary 93.32
Upper primary 103.41
Elementary 98.37
NET ENROLMENT
RATIO (%)
Total 89.41
Primary 91.92
Upper primary 84.65
Elementary 88.28
COMPLETION RATE
(%)
Primary 89.39
Elementary 73.50
GENDER PARITY
INDEX
Primary 0.93
Up-Primary 0.92
Elementary 0.93
TRANSITION RATE
(P TO UP) (%)
Elementary 90.85
Boys 90.86
Girls 90.84
RETENTION RATE Elementary 73.22
PUPIL TEACHERS
RATIO
2017-18
Elementary (Ratio) 23.49
Primary (Ratio) 21.46
Upper Primary (Ratio) 20.25
Elementary 23.49
Average Teacher Per School (Elementary)(Number) 4.90
SCHOOL
INFRASTRUCTURE
As on 2017-18
(Elementary)
(In Numbers)
School having Building 50,220
School having drinking water facility 50,399
Schools having functional Boy's Toilet 49,008
Schools having functional Girl's Toilet 50,065
Schools having Ramps 38,730
Schools having Electricity Connection 12,867
Schools having Computer 3,265
Schools having Playground Facility 11,879

Odisha Profile 2018
45
Items Indicators Value
SECONDARY SCHOOL
As on 2017-18
(In numbers)
Total Secondary School 9,872
Secondary only 2,682
Total Government 5,402
Department of Education 5,037
Tribal/Social Welfare Department 365
Private Aided 3,320
Government & Private Aided 8,722
Private Unaided 814
Others 27
Central Government 104
Un Recognized 205
DENSITY OF SCHOOL
(per 10 sq. kms) Secondary ,2017-18 0.62
TEACHERS As on 2017-18
(in numbers)
Total 47,144
Male 27,790
Female 19,354
PUPIL TEACHER RATIO Secondary (Ratio) 26
ENROLMENT
(In numbers), 2017-18
Total Enrolment 12,48,344
Scheduled Caste 2,45,087
Scheduled Tribe 2,73,763
Girls 6,14,490
DROPOUT RATE
2017-18
(In Percentage)
Total 5.41
Scheduled Caste 6.32
Scheduled Tribe 8.22
Girls 4.20
Boys 7.05
GROSS ENROLMENT RATIO
2017-18
(In Percentage)
Total 80.21
Scheduled Caste 91.58
Scheduled Tribe 68.43
Girls 80.50
Boys 79.93
NET ENROLMENT RATIO
2017-18
(In Percentage)
Total 55.87
Scheduled Caste 63.78
Scheduled Tribe 48.49
Girls 56.16
Boys 55.59
GENDER PARITY INDEX ,
2017-18 (%) Secondary 1.01
COMPLETION RATE,
2017-18 (%) All Secondary 59.61
TRANSITION RATE
(VIII TO IX)
2017-18
(In Percentage)
All Secondary 91.73
Scheduled Caste 93.36
Scheduled Tribe 85.56
Girls 92.52
Boys 91.00
RETENTION RATE
(In Percentage)
All Secondary 94.59
Scheduled Caste 94.88
Scheduled Tribe 91.98
Girls 96.07
Boys 93.17

Odisha Profile 2018
46
Items Indicators Value
UNIVERSITIES,
2016-17
(In number)
State Universities 12
Deemed Universities 2
Private Universities 4
COLLEGES ,
2016-17
(In numbers)
Government Colleges 51
Non-Government Aided Colleges 255
Aided Sanskrit Colleges 142
Block Grant Colleges 662
Non-Govt. Colleges (Un-aided) 571
Self-Financing Colleges 107
Others 2
Result of Annual Higher
Secondary Education (+2)
CHSE
(In Numbers)
(+2)Total appeared 3,52,286
Arts 2,30,206
Science 95,096
Commerce 26,984
( +2 ) Total Passed 2,51,805
Arts 1,58,378
Scince 73,211
Commerce 20,216
VOCATIONAL EDUCATION ,
2016-17 (In numbers)
Government Vocational Junior Colleges 231
GVJC in Tribal Areas 60
Students Admitted 7,767
TECHNICAL EDUCATION
2015-16 (In numbers)
Total Engineering Colleges 93
Government 6
Private 87
Total Intake Capacity 44,494
Government 3,756
Private 42,540
Engineering Schools/polytechnics 147
Government 30
Private 117
Total Intake Capacity 45,315
Government 7,875
Private 37,440
Total MCA Colleges 41
Government 5
Private 36
Total Intake Capacity 2,775
Government 270
Private 2,505
Total MBA Colleges 62
Government 3
Private 59
Total Intake Capacity 5,325
Government 300
Private 5,025
Industrial Training Institute/Technical
Trainers College 613
Intake Capacity 78,673
Source: Directorate of Higher Education, Odisha , Economy Survey ,Odisha 2017-18

Chapter Three
Agriculture
Animal Husbandry
Fisheries
Forest & Environment
Water Resources

Odisha Profile 2018
47
Agriculture
The agriculture and allied sector continues to be pivotal to the sustainable growth
and development of the Indian economy. Being an agrarian state agriculture is considered
as the lifeline of Odisha’s economy as majority of the population depends on agriculture for
their livelihood. It provides employment and sustenance, directly or indirectly, to more than
60% of the populace, and forms the single largest employment sector of the State.
Climate and soil play a vital role in Odisha's
agriculture economy. State’s climate is tropical,
characterized by high temperature, high humidity,
medium to high rainfall and short and mild winters.
The normal rainfall of the State is 1451.2 mm. Odisha
is one of the most vulnerable states to climate change.
Situated along the east coast of the country and
bounded by 480 kms long sensitive coast line the State
is a periodic recipient of climate risks such as cyclone and coastal erosion. The State is
broadly divided in to 4 Physiographic zones which is further subdivided into 10 agro climatic
zones .They differ widely from highly acidic to slightly alkaline and from light sandy to
stiff clays. Soils are mainly acidic with the degree of acidity varying widely .Further, about
4 lakh ha. is exposed to saline inundation, 3.54 lakh ha. to flooding and 0.75 lakh ha to
water-logging, particularly in the deltaic areas.
Economic theory posits a shift in the workforce from agriculture (primary) sector to
secondary and tertiary sectors as a normal phenomenon of the development process. It is
not surprising, therefore, that the percentage of agricultural workers in the total workers in
the State has come down from 64.8 per cent to 61.8 per cent during 2001 to 2011 (Census).
About 61.82 per cent of total workers are engaged in agriculture including 23.40 per cent
cultivators and 38.42 per cent agricultural labourers (2011 census). The per capita
availability of cultivated land was 0.39 hectares in 1950-51, which has declined to 0.12
hectares in 2015-16. During 2010-11 there were 46.67 lakh operational holdings in the State
out of which marginal and small account for 91.86 %,medium 8.04% and large, less than
1%. The total number of operational holdings registered an increase of 7.14% over 2005-
06. The average size of holding during 1970-71 was 1.89 ha which has been decreased to
1.04 ha during 2010-11. In the present agricultural scenario, the marginal farmers,
constituting more than 50 % of the farmers, either own or rent a piece of land for cultivation.

Odisha Profile 2018
48
Irrigation is an important input for enhancing
agricultural production & productivity. It has been
assessed that 49.90 lakh hectares of cultivable land
can be brought under irrigation coverage in the State
through major, medium and minor (flow & lift)
irrigation projects. By end of 2017-18 about 59.17
lakh ha.(40.47 lakh ha. in khariff and 18.70 lakh ha.
in Rabi season) irrigation potential were created as
against 36.06 lakh ha. by end of 2000-01.
Kharif is the main cropping season and rice is the principal crop being cultivated in
around 2/3rd of the cropped area in the season. Cropping during rabi season is mainly
confined to irrigated areas and areas with residual moisture. Other important crops grown in
the State are pulses (arhar, moong, biri, kulthi), oilseeds (groundnut, sesamum, mustard,
niger), fibers (jute, mesta, cotton), sugarcane, vegetables and spices. Among the seasons,
Rice dominates the cropped area during Kharif and Pulses clearly dominates occupying
almost half the cropped area during rabi season. Besides oilseeds, vegetables, fibres, maize
and ragi cover a predominant part. Other crops constitute sugarcane, spices and minor
millets. The total rice production in the State during 2017-18 is 65.51 lakh tons while the
yield rate of paddy is 26.35 kg,/ha. The state Government has given high priority
The cropping intensity of Odisha has also increased from 135% in 2000-2001 to 167
% during 2012-13,which was again declined to 156 % in 2017-18.
The fertilizer consumption in the state has taken great strides from a meager 0.76 kg/
ha during 1961-62 to 68.67 kg/ ha. During 2017-18.The increased emphasis on IPM
methodologies has led to a slower growth rate in case of chemical pesticide consumption in
135
140
145
150
155
160
165
170
(In
per
cen
tage
)
Cropping Intensity in Odisha

Odisha Profile 2018
49
the state. On the other hand there has been an increasing trend on consumption of bio-
pesticides. Per hectares consumption of pesticide is 145.52(gms of a.i.).Farm mechanization
has picked up in the State and there is a great demand for tractor, power tiller, paddy reaper,
and other power driven/ self-propelled equipments.
The agro-climatic diversity in the state of Odisha allows for growing a variety of
horticultural crops such as perennial fruit crops, spices, a variety of root and tubers and a
whole range of vegetables. The low-temperature in hilly areas at higher altitude offer ideal
conditions for growing off-season vegetables. Of late floriculture is also showing excellent
prospects. There has been a sustained increase in productivity of vegetables, though with
frequent fluctuations. During 2017-18 the area under vegetables is estimated at 651.52
thousand ha. with a production of 9067.65 thousand tonnes in the State .
Items Indicators Value
LAND USE PATTERN
As on 2017-18
(in ‘000 Ha.)
Total Geographical Area 15,571
Recorded Forest Area 5,813
Reporting Area For Land Use Statistics 15,467
Forest area under Revenue Villages ,2016-17 1,897
Total Area Not Available for cultivation 2,332
Area under non-agricultural uses 1,298
Barren & Un Culturable land 840
Permanent pastures & other grazing lands 494
Land under misc. tree crops & groves 342
Culturable waste land 375
Fallow Lands 824
Current fallow 824
Other fallow 229
Net Area Sown 5,356
AGRICULTURE
LABOUR FORCE as
per 2011 Census
(Lakh persons)
Total Population 419.74
Total Agriculture workers (Cultivator+ Agrl. Labour) 108.44
Female Agriculture workers (Cultivator+ Agrl. Labour) 39.87
Agriculture workers to total workers (%) 61.82
Total Cultivators 41.04
Female Cultivators 7.29
Cultivators to total workers (%) 23.4
Agriculture Labourer 67.4
Female Agriculture Labourer 32.58
Percentage of Agriculture Labourer to total workers 38.43
Minimum wage rate of Agriculture workers
(2010-11) in Rs.
Male 117.66
Female 93.48

Odisha Profile 2018
50
Items Indicators Value
LAND HOLDINGS
As on 2015-16 (In Nos.)
No. of Holdings
Marginal (< 1.0 ha.) 36,36,658
Small (1-2 ha.) 8,87,272
Semi-medium(2-4 ha) 2,86,735
Medium (4-10 ha.) 51,210
Large (>10 ha.) 3,975
All Size 48,65,850
Area Of Holdings
Marginal (< 1.0 ha.) 20,56,821
Small (1-2 ha.) 14,04,130
Semi-medium(2-4 ha) 7,87,867
Medium (4-10 ha.) 2,84,228
Large (>10 ha.) 86,243
All Size 46,19,289
CROP PRODUCTION
As on 2017-18
Gross Cropped Area (‘000 Ha) 8,361
Cropping Intensity (%) 156
AREA, 2017-18
(‘000 Ha.)
Rice 3,766.39
Total Cereals 4167.81
Total Pulses 2,047.35
Total Food Grain (Cereals &Pulses) 6,215.16
Total Oilseeds 603.37
Total Fibres 160.17
Total Vegetables 651.52
Sugarcane (Cane) 27.00
Potato 25.09
Total Spices 161.62
Tobacco 0.31
`PRODUCTION,
As on, 2017-18 (In 000 MT)
Rice 6,551.37
Total Cereals 7,406.87
Total Pulses 1,075.97
Total Food Grain (Cereals &Pulses) 8,482.84
Total Oilseeds 535.34
Total Fibres 525.68
Total Vegetables 9,067.65
Potato 298.06
Sugarcane (Cane) 1,996.26
Total Spices 847.97
Tobacco 0.18

Odisha Profile 2018
51
Items Indicators Value
YIELD ,
As on 2017-18
(Qtls, / Ha.)
Rice 17.39
Total Cereals 17.77
Total Pulses 0.53
Total Food Grain (Cereals &Pulses) 13.65
Total Oilseeds 0.89
Total Vegetables 137.80
Sugarcane (Cane) 735.65
Potato 118.80
Total Spices 34.49
Tobacco 0.57
STATUS OF
AGRICULTURE INPUT USE
As on 2017-18 in Qtls
Seeds
Distribution of Certified/ Quality Seeds Total 3,40,581
Paddy 2,87,742
Non Paddy 52,840
FERTILISER
CONSUMPYION
As on 2017-18 in ‘000 MT
Nitrogen 325.05
Phosphate 140.37
Potassium 71.51
Total Consumption 536.93
Per Hectare consumption 68.67
PESTICIDES
CONSUMPYION
As on 2017-18
Total Consumption (‘000 MT) 1.63
Per Hectare consumption (Gms) 145.52
POWER CONSUMPTION
As on 2017-18
Total Power Consumption (In MU) 17,722.31
Power consumption for Agricultural purposes (%) 2.56
Share of power consumption
for Agriculture purposes(in MU) 453.90
MARKETABLE SURPLUS
OF RICE,CEREALS,
PULSES AND OILSEEDS,
2017-18
(Lakh persons)
Projected Population 456.71
Adult equivalent to 88% 401.88
RICE, 2017-18
(Requirement 400 gms per
adult per day) (In lakh
tonnes)
Total consumption requirement 58.67
Total Requirement including seed, feed & wastage) 67.05
Production 65.51
Surplus/ Deficit -1.54
CEREALS,2017-18
(Requirement 500 gms per
adult per day)
(In lakh tonnes)
Total consumption requirement 73.34
Total Requirement (Including seed, feed & wastage) 83.82
Production 74.07
Surplus/ Deficit -9.75
PULSES, 2017-18
(Requirement 50gms(dal)
per adult per day )
(In lakh tonnes)
Total consumption requirement 10.41
Total Requirement (Including seed, feed &
wastage) 11.90
Production 10.76
Surplus/ Deficit -1.14
OILSEEDS, 2017-18
Requirement 45gms of
Oilseeds per day (In lakh
tonnes)
Total consumption requirement 19.93
Total Requirement including seed, feed & wastage) 22.78
Production 5.35
Surplus/ Deficit -17.43
Source: Directorate of Agriculture & Food Production, Odisha
Directorate of Economics and Statistics, Odisha

Odisha Profile 2018
52
Items Indicators As on 2017-18
HORTICULTURE ,-
AREA
(In ‘000 Ha.)
Total Fruits 329.34
Major Fruits ,-
Banana 24.50
Guava 14.27
Mango 199.41
Papaya 3.09
Total Citrus 27.97
Pineapple 0.96
Pomegranate 0.25
Jackfruit 12.41
Litchi 4.47
Sapota 3.36
Watermelon 11.73
Total Flower 6.61
Major Flower
Marigold 2.62
Rose 1.87
Gladioli 1.60
Tuberose 0.51
Total Plantation Crops 212.13
Cashewnut 150.72
Cocoanut 50.91
PRODUCTION
Total Fruits (000 MT) 329.34
Major Fruits (000 MT)
Banana (000 MT) 466.58
Guava (000 MT) 104.07
Mango (000 MT) 813.94
Papaya (000 MT) 71.49
Pineapple (000 MT) 11.64
Pomegranate (000 MT) 0.91
Jackfruit (000 MT) 233.02
Litchi (000 MT) 20.39
Sapota (000 MT) 15.72
Total Flower (loose) (‘000 MT) 24.91
Total Flower (Cut) (in lakh) 5,418.82
Total Plantation Crops (000 MT) 98.82
Cashewnut (000 MT) 90.83
Cocoanut (in lakh number) 3,424.70
Major Flower
Marigold (‘ MT.) 23,594
Rose (lakh stems) 3,607
Gladioli (Spike) 1,576
Tuberose (MT) 1,314
Source: Directorate of Agriculture & Food Production, Odisha & Directorate of Economics & Statistics,
Odisha Agriculture Census,2010-11 Directorate of Horticulture,Odisha,Bhubaneswar
Economic Survey Odisha 2018-19

Odisha Profile 2018
53
Animal Husbandry
Livestock production and agriculture are
intrinsically linked, each being dependent on the
other, and both crucial for overall food security.
Livestock sector is an important subsector of the
agriculture of Indian economy. It plays a
multifaceted role in providing livelihood support
to the rural population. This sector apart from
contributing to national economy in general and to
agricultural economy in particular, also provides
employment generation opportunities, asset creation, coping mechanism against crop failure
and social and financial security. Owing to conducive climate and topography, Animal
Husbandry Sector have played prominent socio-economic role in Odisha. Livestock sector
in Odisha is highly livelihood intensive and over 80 per cent of its rural households own
livestock of one species or the other and earn supplementary incomes from them. Livestock
holding is less iniquitous than land holding and income from livestock is more equitably
distributed. The overall contribution of livestock Sector in the.According to Live stock
Census 2012 Odisha possesses 4.05 % of livestock wealth of the country. Among the total
livestock, cattle contributes highest with 56.05% followed by goat 31.41%, sheep 7.63%,
buffalo 3.50%, 1.35% of livestock is contributed by pigs and marginal contribution is made
by other livestock species. The poultry population is mainly contributed by fowls in the
Odisha with the total poultry population is 19.89 million numbers in 2012 census. There is
a decrease in livestock population over 2007 to 2012 from 23.05 million to 20.73 million
(excluding 1.13 million stray cattle) registering a decline of 10.08% in the total number of
animals in various species. During the same period, there has been an increase of 77 per
cent in the in milk exotic and cross-bred cattle and 3.5 per cent in in-milk indigenous cows.
Live Stock Census in Odisha
215.94
223.21
242.67236.52
240.22
230.57
207.33
180
190
200
210
220
230
240
250
In la
kh n
o

Odisha Profile 2018
54
The production and per-capita availability of animal products in the State has by and
large gone up steadily. Milk production in the State since 1994-95 is on the rising trend.
During the year 1994-95 the estimated milk production of the State was 584.39 TMT and it
reached at all time high production of 2087.54 TMT during the year 2017-18. The share of
contribution to the country is about 1.2% .The per capita availability of milk has increased
from 94 gm per day in 2003-04 to 120 gm per day in 2017-18 .
With the increase of population, demand for meat and egg also increases. The
production of meat during2017-18 is about 183.42 TMT while the same was 38.38 TMT
during 2000-01. While the meat production in the State has increased by more than four
times over 2000-01,the per-capita availability of meat has gone up from 1.07 Kg/annum in
2000-01 to 2.06 Kg/annum in 2017-18. Poultry development is one of the important
activities in livestock sector. Odisha is 8th largest producer of poultry egg in the country.
The egg production in the State was increased to 2062.19 million in 2017-18 from 760.10
million during 2000-01.Theper-capita availability of 20 eggs per annum in 2000-01 has
increased to 46 eggs per annum by the end of 2016-17. However in Odisha egg production
was declined as compared 2013-14(2360.90millon).During 2016-17, the egg production at
all India level is 88139 million with per capita availability of 69 eggs per annum.
Fisheries
Odisha is endowed with water resources which
provide potentials for development of fisheries. It has a
diverse coastline with estuarine, coastal and offshore fish
resources with substantial inland water resources. The State
having coastline of 480 kms. with continental shelf area of
24000 sq.km. along Bay of Bengal has huge potential for
109
11
113 117 118 118 120 120
0
20
40
60
80
100
120
140
2010-11 2011-12 2012-13 2013-14 2014-15 2015-16 2016-17 2017-18
Percapita availabiity of milk in Odisha (In gram)

Odisha Profile 2018
55
marine fisheries development. Odisha comprises about 6% of the coastline and 4.7% of the
continental shelf area of the country. Freshwater resources of the State area estimated to be
6.83 lakh ha comprising 1.32 lakh ha of tanks/ponds, 2 lakh ha of reservoirs, 1.80 lakh ha of
lakes, swamps & bheels and 1.71 lakh hectares of rivers and canals. The State’s brackish
water resources are of the order of 4.18 lakh ha with a breakup of 0.79 lakh ha of Chilika
Lake, 2.98 lakh ha of estuaries, 0.33 lakh ha of brackish water area and 0.081 lakh ha of
backwaters. Tanks and ponds are the major source of freshwater fish followed by reservoirs
and lakes, rivers and canals, swamps and bheels. Chilika Lake with average water spread
area of 906 sq. kms. in summer and 1165 sq. kms. in monsoon and island area of 223 sq.
kms, is the main source of brackish water fish.
About 4.41 % population (18.48 lakh) depends upon fisheries for their livelihood. of
them, 9.03 lakh depend on inland fisheries and 9.45 lakh on marine fisheries. The fisheries
sub-sector contributed about 9.69% GSDP share to the Agriculture Sector whereas this
sector contribute 1.81% to the total GSDP in the State. In the national level this sector
contributed about 0.9% to the National Gross Value Added (GVA) and 5.43% to the
agricultural GVP (2015-16).
Fish Production in Odisha
Transformation of the fisheries
sector from traditional to commercial scale
has led to an increase in fish production
from 325.4 TMT in 2005-06 to 684.96 TMT
during 2017-18, with a contribution of
5340.12 TMT from inland sector and
150.84 TMT from marine sector. The
production scenario reveals a paradigm shift
from marine dominated fisheries to a
scenario where inland fisheries has emerged
as a major contributor to the overall fish
production. Inland fisheries presently has a share of 77.98% in total fish production of the
State during 2017-18.The total value of fish produced in the State has increased (20.06%)
from Rs.8292.30 crore during 2016-17 to Rs.9955.39 crore during 2017-18.Out of total
684.96 TMT disposition of fish production, about 84 percent were marketed in raw form
while 7 percent kept for sun drying and salting. The per capita fish consumption in the State
is also showing an increasing trend. The per capita fish consumption in the State has

Odisha Profile 2018
56
increased from 8.70 Kg. during 2004-05 to 14.42 Kg. during 2017-18 as against 11 kg
recommended by the WHO.
Freshwater aquaculture with a share of 79.26 percent in inland fisheries in 2016-17
has emerged as a major fish producing system in the State as a result of initiatives taken by
the Government. Fish Farmers Development Agencies (FFDA) were set up in various
districts for delivering a package of technologies, practices, training and extension and for
providing financial assistance to the beneficiaries. So far, 71035.73 Ha. of tank areas have
been developed and 60341 fish farmers have been trained through these agencies to boost
up production of fish.
A quantity of 192.82 TMT fish has been exported from Odisha during 2017-18 out
of which 87.47 TMT were exported from Marine Sector, 43.60 TMT were exported from
fresh water sector and 61.75 TMT were exported from brackish water sector.
386.19 381.83 410.14 413.89 469.54 521.28 608.1
9.4210.14
9.13 9.6611.06
12.2413.49
0
2
4
6
8
10
12
14
16
0
100
200
300
400
500
600
700
2010-11 2011-12 2012-13 2013-14 2014-15 2015-16 2016-17 2017-18
Fish Production in Odisha
Total Production Percapita consumption

Odisha Profile 2018
57
Items Indicators Value
LIVESTOCK
POPULATION ,
2012 Census
(In number)
Total Live Stock 2,07,32,498
Rural 2,02,11,774
Urban 5,20,724
Total Poultry 1,98,90,538
Rural 1,93,01,803
Urban 5,88,735
Total Cattle (Crossbreed) 13,05,773
Male 3,19,719
Female 9,86,054
Total Cattle (Indigenous) 1,03,15,499
Male 55,02,885
Female 48,12,614
Total Cattle (Crossbreed &Indigenous) 1,16,21,272
Total Buffalo 7,26,306
Male 3,35,255
Female 3,91,051
Total Bovine 1,23,47,578
Sheep 15,81,129
Goat 65,13,087
Pigs 2,80,316
BREEDABLE
POPULATION
2012 Census
(‘000 Nos.)
Indigenous Cattle 3,362
Crossbred Cattle 667
Buffalo 284
MILCH
POPULATION , 2012
(in number)
Crossbred Cattle 5,28,624
Indigenous Cattle 25,54,719
Buffalo 2,23,539
WET- DRY RATIO
OF DAIRY ANIMALS
,2012
(in percentage)
Crossbred Cattle 68
Indigenous Cattle 55
Buffalo 57
DENSITY, 2012
(No. per Sq. Kms.)
Total Livestock 133
Bovine 79
Small Ruminants 52
LIVESTOCK PRODUCTION PERFORMANCE
DIARY, 2017-18)
Total Milk Production (000’ MT) 2,087.54
Cattle Milk (000’ MT) 1,817.78
Buffalo Milk (000’ MT) 264.84
Goat Milk (000’ MT) 4.91
Average Yield per in Milk Animal (Kg/day)2016-17
Crossbred Exotic Cattle 6.21
Indigenous Buffalo 4.44
Non-Descript Buffalo 3.94
Goat 0.12
Per Capita Availability of Milk (gm/day)2016-17 120

Odisha Profile 2018
58
Items Indicators Value
POULTRY
(2017-18)
Egg Production (lakh number) 20,621.86
Production From Back yard Poultry (lakh number) 2,828.57
Desi Fowls (lakh number) 2,346.35
Improved Fowls (lakh number) 384.34
Desi Ducks (lakh number) 97.88
Production From Commercial Poultry Farms (lakh
number) 17,793.29
Estimated Number of Layers (‘lakh numbers)
From Back yard Poultry
Desi Fowls 2,346.35
Improved Fowls 384.34
Desi Ducks 97.88
From Commercial Poultry Farms 17,793.29
Average Yield Per Year Per Layer of Egg (Number)
2016-17
From Back yard Poultry
Desi Fowls 64.26
Improved Fowls 122.29
Desi Ducks 69.56
Improved Ducks 101.43
Commercial Poultry Farms 324.44
Per Capita Availability of Egg (Number/annum)2016-17 46
MEAT
(2017-18)
Total Meat Production (‘000 MT) 183.42
Meat except poultry (‘000 MT) 98.83
Sheep (‘000 MT) 16.56
Goat (‘000 MT) 73.38
Pig (‘000 MT) 8.90
Meat (Poultry) 84.59
Per Capita Availability of Meat (kg/annum)2016-17 2.06
LIVESTOCK
INFRASTRUCTURE,
2017-18 (in numbers)
Hospitals & Dispensaries 541
Livestock Aid Centre 3,239
Artificial Insemination Centre 5,181
Under AH department 2,985
Others 2,689
State Veterinary Laboratory/Clinical Investigation
Laboratory 4
District Diagnostic Laboratory 26
Odisha Biological Product Institutes 2
Department Training Centres 7
Veterinary Doctors 422
Live Stock Inspectors 2,221
Mobile Veterinary Units 314

Odisha Profile 2018
59
Items Indicators Value
LIVE STOCK
FARMS, 2017-18 (in
Numbers)
Live Stock Breeding Diary Farms 8
State Poultry Farms 8
Duck Breeding Farms 2
Goat Breeding Farm 6
Sheep Breeding Farm 1
Pig Breeding Farm 1
ANIMAL HEALTH
CARE, 2017-18
Treatment of Animals (lakh Nos,) 98.60
Vaccine Production (in lakh doses) 197.10
Vaccination Done (lakh Nos,) 352.37
Deworming of Animals (lakh Nos,) 29.35
Animal Castrated (lakh Nos,) 6.06
FEED RESOURCES
Demand for Green Fodder (in lakh MT), 2016-17 315.48
Demand for Dry Fodder (in lakh MT), 2016-17 94.64
Availability of Green Fodder (in lakh MT), 2016-17 165.86
Availability of Dry Fodder (in lakh MT), 2015-16 73.19
Fodder Farms (in Number) 2016-17 8
Production of fodder (in quintals)2016-17 24.18
Area (in Acre), 2016-17 170.20
Fodder Farms (in Number), 2016-17 13
Production of fodder (in quintals) 2016-17 63,25,076
Production of fodder seeds (in quintals) 2016-17 247
COVERAGE OF
OMFED,
2017-18
Organized Dairying Coop. Societies (Number) 5,852
Farmer Membership (Number) 2,61,295
Milk procurement
Average milk procurement per day (lakh kgs/day) 5.08
Milk Processing
Dairy Plants (Number) 13
Processing capacity per day (lakh litres) 6.80
Bulk coolers (Number) 392
Processing capacity per day (lakh litres) 8.22
Milk chilling Center (Number) 3
Processing capacity per day (lakh liters) 0.80
Milk powder Plant (Number) 1
Processing capacity per day (MT) 5
Cattle Feed Plant (Number) 2
Processing capacity per day (MT) 200
Average Milk Marketing per day (lakh litres) 3.87
Total Turn Over (Rs. In lakh) 75,309.87
COVERAGE OF
OPOLFED
Eggs Sold (lakh nos.) 32.85
Values (Rs. in crore) 2.07
Chicken Sold (kg) 1,20,432
Values (Rs. in lakh) 281.12
Poultry Feed sold (M.T) 21.71
Values (Rs. in lakh) 6.30

Odisha Profile 2018
60
Fisheries
Items Indicators Value
FISHERIES
RESOURCES , 2017-18
(in lakh Ha.)
Total Water Area in Inland Water Sector 11.02
Total Water Area in Fresh Water Sector 6.84
Culture Fisheries (Tanks/ponds) 1.33
Culture based captured Fisheries (Reservoirs) 2.00
Small Reservoirs 0.35
Medium /Large Reservoir 1.65
Captured Fisheries (Lakes/swamps/ bheels) 1.80
Rivers/canals 1.71
Brackish Water Resources Total 4.18
Area suitable for Brackish water Tanks 0.33
Back Water 0.08
Chilka Lake 0.79
Estuaries 2.98
Marine Water Resources
Coastal line Kms) 480
Continental shelf area (Kms) 24,000
Fresh Water Aquaculture Resources
Total number of Tanks 26,7410
Number of GP Tank 63,292
Number of Revenue Tank 13,362
Total number of Private Tank 1,90,756
Total Area (ha.) 1,53,101.66
GP Tank (ha.) 50,309.69
Revenue Tank (ha.) 35,933.42
Total Private Tank (ha.) 66,858.55
AREA DEVELOPMENT
, 2017-18 Under FFDA,
BW,NVPS,MFDB,
MGNREGS (in Ha.)
Total 1,983.92
PRESENT
PRODUCTION LEVEL
, 2017-18 in lakh MT
Total Fresh Water 4.54
Culture Fisheries (Tanks/ponds) 3.93
Culture based captured Fisheries (Reservoirs) 0.34
Captured Fisheries (Lakes/swamps/bheels) 0.05
Rivers/canals 0.22
Fish 4.51
Shrimp/Prawn 0.03
Total Brackish Water 0.80
Shrimp culture 0.58
Estuaries 0.06
Chilka Lake Total 0.16
Fish 0.11
Shrimp/Prawn 0.05
Crab 0.003
Total Inland 5.34
Fish 4.65
Shrimp/Prawn 0.68
Crab 0.005

Odisha Profile 2018
61
Items Indicators Value
PRESENT
PRODUCTION LEVEL
, 2017-18 in lakh MT
Total Marine 1.51
Fish 1.34
Shrimp/Prawn 0.14
Crab 0.03
Grand Total 6.85
Shrimp/Prawn 0.82
Crab 0.04
PRESENT AVERAGE
PRODUCTIVITY , 2017-
18 (Kg/ha)
Culture Fisheries (Tanks/ponds) 2,963
Culture based captured Fisheries Reservoirs) 170
Captured Fisheries (Lakes/swamps/bheels) 27
Rivers/canals 127
Total Fresh Water 664
Area Suitable for Culture 4,220
Chilka Lake 207
Estuaries 18
Total Brackish Water 4,445
VALUE OF
PRODUCTION , 2017-18
(in lakh Rupees)
Total Fresh Water 5,74,205.54
Culture 5,19,541.17
Capture 54,664.37
Total Brackish Water 2,68,111.88
Culture 2,34,102.88
Capture 34,009.00
Total Inland 8,42,317.42
Culture 7,53,644.05
Capture 88,673.37
Marine Fish 1,53,222.29
Total Values 9,95,539.71
Culture 7,53,644.05
Capture 2,41,895.66
SPAWN PRODUCTION,
2017-18 (in lakh nos)
Total 38,227.50
Government 3,650.75
OPDC 8,375.75
Private 26,201.00
FRY PRODUCTION
2017-18, (in lakh nos.)
Total 8,077.01
Government 683.60
OPDC 1,767.00
Private 5,626.41
FISH CONSUMPTION ,
2017-18 (kg/annum) Annual per capita consumption of fish (kg/annum) 14.42

Odisha Profile 2018
62
Items Indicators Value
FISH EXPORT TO
OTHER STATES &
OTHER COUNTRIES ,
2017-18(P) (in ‘000 MT)
Marine fish 87.47
Fresh water fish 43.60
Brackish water fish 61.75
Total Export 192.82
FISH IMPORT ,2017-
18(P) (in ‘000 MT) Import of Fresh water fish 40.74
EXPORT OF MARINE
PRODUCTS TO
FOREIGN
COUNTRIES, 2017-18
Total Quantity (‘000 MT) 53.34
Frozen Shrimp, (‘000 MT) 50.79
Frozen Fish , (‘000 MT) 1.81
Frozen Cuttle Fish (MT) 0.69
Frozen Squid , (MT) 0.05
Chilled Items, (MT) 0.01
Others , (MT) 0.00
Total Values (Rs. In crore) 2,871.61
Frozen Shrimp, (Rs. In crore) 2,832.49
Frozen Fish , (Rs. In crore) 25.45
Frozen Cuttle Fish , (Rs. In crore) 12.49
Frozen Squid, (Rs. In crore) 0.67
Chilled Items, (Rs. In crore) 0.49
Others, (Rs. In crore) 0.00
FISH DISPOSITION,
2017-18 (MT)
Total Disposition 6,84,963
Marketing Fresh 5,77,479
Freezing 63,312
Drying 31,644
Salting 12,528
MANPOWER
RESOURCES,
(CMFRI Survey 2011)
Number of Marine Fisherman Villages 813
Number of Inland Fisherman Villages 3,065
MANPOWER
RESOURCES,
(CMFRI Survey 2011)
Number of Marine Fisherman Families 1,14,238
Number of Traditional Fisherman Families 87,541
MANPOWER
RESOURCES (Projected
2017)
Number of Marine Fisherman Population 10,27,669
Number of Male 3,10,078
Number of Female 2,73,690
Number of Children 4,43,901
Total Inland Fisherman Population 9,17,436
Number of Male 3,13,546
Number of Female 2,72,000
Number of Children 3,31,890

Odisha Profile 2018
63
Items Indicators Value
OTHER FISHERIES
RESOURCES , 2017-18
Number of Marine fish landing Centre Total 72
Number of Harbour 4
Number of Jetty 25
Number of Other Landing Centre 43
Number of Fish Drying Platform 10
Capacity (MT) 3,269
ICE PLANT & COLD
STORAGE , 2017-18
Number of Ice Plant 57
Number of Cold Storage 12
CAPACITY, 2017-18 (In
MT)
Number of Ice Plant 613.5
Number of Cold Storage 67
MARINE CRAFTS,
2017-18
Number of Motorised 10,085
Number of Non-motorized (Country Craft) 9363
Number of Mechanised craft 1741
Total 21,089
MARINE PRODUCT
EXPORT
DEVELOPMENT
AGENCY( MPEDA),
2013-14
Number of Sea Food Exporters from Odisha 34
Number of Processing Plants 20
Capacity (MT) 459.5
Number of Storage Premises 21
Number of Peeling Sheds 20
Capacity (MT) 215.82
Number of Ice Plant 2
Capacity (MT) 58
Source : Directorate of Fisheries, Odisha Fisheries Statistics India and Economic Survey Odisha,2017-18

Odisha Profile 2018
64
Forest & Environment
Forests being a major component of
the natural and environmental capital stock,
play a vital role in maintaining ecological
stability and contribute significantly to
Odisha’s economy, especially to the
livelihoods of forest-dependent
communities which are mostly Scheduled
Tribes. The State is endowed with vast
forests extending over 34.90% of its
geographical area that are rich in floral and
faunal diversity. Diversity of forest ecosystems comprises natural teak, Sal, and bamboo
forests in the hinterland and lush green mangroves on coast. Thus, the State occupies a
prominent place in the national biodiversity map. According to the vegetation pattern the
forests of Odisha can broadly be classified into five major types of forests namely, tropical
semi-evergreen, tropical moist deciduous, tropical dry deciduous, subtropical broad leaved
hill forests, and littoral and swamp forests. Forest cover in Odisha is unevenly distributed.
Forests are generally located in the districts situated in the Eastern Ghats, Central Table Land
and Northern Plateau. The coastal districts with high population density have comparatively
smaller areas of forests.
As per the report of the Forest Survey of India 2017 using remote sensing techniques,
the forest cover in the State is 51345 sq. kms of which 6967 sq. kms is very dense forest.
The moderately dense forest 21370 sq. kms while open forest is over 23008 sq. kms. The
forest cover in the State constitutes 32.98 % of the geographical area. Besides this, there
exists tree cover outside the forest over 2.56% of the geographical area of the State. Thus
the forest and tree cover in the State constitutes 35.54% of the geographical area The
recorded forest area of Odisha which constitutes 39.29% of State’s geographical area out of
which reserve forests make up an area of 26874 square kms., demarcated protected forests
make up 4180 square kms. and un-demarcated protected forests make up 4273 square kms.
Other types of forests make up 16,261.34 square kms while unclassed forests make up 20.55
square kms. of the total forest cover. The percentage of forest cover to total recorded
forest area of the State is 83.89% in 2017. The per capita recorded forest area of the State is
0.14 ha .The state has gained a rise of 7 sq. km. of forest cover over 2013 assessment and
more than 3413 sq. km. area of forest cover since 1997. The reason for increase in the forest
cover as per State of Forest Report, 2015 is mainly attributed to better conservation in

Odisha Profile 2018
65
mangroves and plantation activities. Afforestation activities have been stepped in the State
and during last five year on an average about 1504 square kms. of forest area are being
tackled under different plantation model with the objective of increasing tree cover, crown
density and enriching biodiversity. The major species occupying the Odisha forests are
Sal, Teak and Bamboo. Odisha has 9% of the Country’s total bamboo forest cover and 7%
of total growing stock of Bamboo. The bamboo in forest areas of Odisha grows as mixed
crop associated with Sal & other species. Odisha is the third largest producer of Kendu leaf
in India
Forest Cover (Sq Kms)
Year Odisha India
2001 48,366 67,833
2003 48,353 6,77,816
2005 48,755 6,90,171
2009 48,855 6,92,394
2011 48,903 6,92,027
2013 50,347 6,97,898
2015 50,354 7,01,673
2017 51,345 7,08,273
Odisha’s unique location in Peninsular India has blessed it with an interesting
assemblage of floral and faunal diversity. Well-endowed with vast forest areas, rivers, coast
line, beaches, lakes and lagoon, the state provides unique opportunities for ecotourism in the
State. The rich biodiversity of the state is conserved mainly through a network of protected
areas comprising two National Parks and 19 wild life Sanctuaries. This network is
complemented by wilderness areas, wetlands and other bio diverse sites along the coasts
including mangroves and turtle rookeries. The total protected area in the state is 8352.3
Sq.km which constitutes 5.36% of the total geographical area and 10.37% of the forest area.
There are 18 Biosphere Reserves in India which protect larger areas of natural habitat
.Presently, there is one notified biosphere reserves in Odisha namely Similipal Biosphere
Reserve. The total area under the Biosphere Reserve is 5,569 sq. kms. with Similipal
Sanctuary at the nucleus. It has its importance since antiquity for being the biggest single
forest block in Odisha. Considering the potential viability of floral and faunal biodiversity,
the development of eco-tourism in Similipal was taken up with tourist facilitation services.
Wetlands are among the most productive ecosystems besides being a rich repository of
biodiversity, and are known to play a significant role in carbon sequestration There are 19
different types of wetlands in India. It includes mangroves, high-altitude lakes, marshes and
ponds. The State is endowed with a number of wetlands with ecological significance. The
total wetland area is of 1,81,500 ha. of the State. The Convention on Wetlands’ signed in

Odisha Profile 2018
66
Ramsar, Iran in 1971, is an intergovernmental treaty whichprovides the framework for
national action and international cooperation for the conservation and wise use of wetlands
and their resources.
In India 26 wetlands are identified under the List of wetlands of International
Importance. The State comprises of two Ramsar wet lands namely Bhitarkanika Mangroves
& Chilka Lake. The Bhitarkanika mangroves, which is the major mangrove wetland of
Odisha, occupies an area of about 5254sq.km and declared as a Wildlife Sanctuary. Among
the Indian mangroves the highest diversity of mangrove plants occurs in the Bhitarkanika
and hence, it has been identified as one of the important mangrove genetic resource centres
of the world. The Chilka is a brackish water lagoon located in the southern part of the Odisha
coastal plain. Its area varies from 780 sq km and 1140 sq km from winter to monsoon months
having a length of 71 km and 32 km breadth. Home to thousands of colorful birds throughout
the year, it is particularly with the migratory birds who descend on it from as far off as Siberia
in winter season.
The flora and fauna of Odisha, is extremely diverse and gives the state a reputation
for abundance of natural beauty and wildlife. The IUCN Red List has recorded a total of
479 species of birds and 87 species of mammals, 27 species of amphibians and 131 species
of reptiles including three crocodilian species in the State. Out of these around 54 species
are considered endangered. The significant fauna of the State includes the rare white tigers,
Irrawaddy Dolphins, Olive Ridley sea turtles.
The State has three mass nesting beaches of endangered olive ridley sea turtles which
when combined together makes it the world's largest nesting ground for this species.
Significant populations of these turtles visit the congregation areas en-masse before the
winter months for breeding and nesting. This population represents about 50% of the total
world population of Olive Ridleys, and about 90% of the Indian population of sea turtles.
The Irrawaddy Dolphin is the flagship species of Chilika lake being only known population
of Irrawaddy dolphins in India and one of only two lagoons in the world that are home to
this species. It is classified as Critically. Endangered, in five of the six other places it is
known to live. The state’s flora comprises of more than 3000 species of Plants including 132
species of orchids, 60 species of Mangrove Plants and 350 species of Medicinal Plants.
There are 2 Tiger Reserves in Odisha namely; Simlipal Tiger Reserve and Satkosia Tiger
Reserve .Odisha state holds 40 tigers, comprising of 13 males, 24 females and 3 cubs. In the
State 14 Elephant corridors have been identified with a population of 1954 elephants. The
State has one large zoo (Nandankanan), two small zoos and 8 mini zoos.

Odisha Profile 2018
67
Items Indicators Value
Major Type of
Forest,2015
(In percentage)
Tropical Dry Deciduous Forests 57.87
Tropical Moist Deciduous Forests 39.88
Tropical Semi Evergreen Forests 0.68
Littoral &Swamp Forests 0.48
Plantation TOF 1.09
Forest Cover, 2017
(In Sq.Kms)
Total Forest Cover 51,345
Very Dense Forest 6,967
Moderately Dense forest 21,370
Open Forest 23,008
Percentage of State's Geographical Area 32.98
Total Forest Cover within RFA 34,116
Very Dense Forest 6,082
Moderately Dense forest 15,603
Open Forest 12,431
% of forest cover within RFA 76.49
Total Forest Cover outside RFA 17,229
Very Dense Forest 885
Moderately Dense forest 5,767
Open Forest 10,577
Total Tree Cover 3,993
Percentage of State's Geographical Area 2.56
Total Forest & Tree Cover 55,338
Per capita forest & Tree cover (Ha) 0.13
Percentage of State's Geographical Area 35.54
Percentage of India's Forest & Tree Cover 6.94
Recorded Forest
(2017-18)
Total Recorded Forest Area (Sq. Kms) 61,204
Reserved Forest (Sq. Kms) 26,874
Protected Forest (Sq. Kms) 1,085
Village Forest (Sq. Kms) 288
Demarcated Protected Forest (Sq. Kms) 4,180
Un-Demarcated Protected Forest (Sq. Kms) 4,273
Unclassed Forest (Sq. Kms) 22
Rev Forest including deemed forest(Sq. Kms) 15,117
Percentage of State's Geographical Area 39.31
Tribal Districts,
2017
(in Sq. Kms)
Number of Tribal Districts 12
Geographical Area 86,091
Forest Cover in Tribal Districts 34,206
Percentage of Geographical Area 39.73
Very Dense Forest 5,114
Moderately Dense forest 14,275
Open Forest 14,817
Scrub 2,655

Odisha Profile 2018
68
Items Indicators Value
Ownership of Forest,
2017
(In Sq.Kms.)
Forest Department Total 26,350
Reserved Forest 36,049
Unclassed Forest 22
Revenue Department Total 31,786
Protected Forest 25,133
Un-Demarcated Protected Forest 3,839
Other/ Revenue Forest 16,261
Total Forest 58,136
Growing Stock, 2017
(in million cum)
Total volume of Growing Stock 339.51
Growing Stock in Recorded Forest Area 258.01
Growing Stock in Trees Outside Forest 81.50
Carbon Stock , 2017
(in million tonnes)
Total Carbon Stock 4,230
Above Ground 1,471
Below Ground 487
Dead Wood 18
Litter Wood 75
Soil 2,179
Mangrove Cover (2017)
(In Sq. Kms)
Total Mangrove Cover 231
Very Dense Mangrove 82
Moderately Dense Mangrove 94
Open Mangrove 67
Kenduleaf Trading
Quanty production (in Lakh quintqls) 3.56
Quantity sold (in lakh quantity) 3.17
Sale value (Rs.in crore) 611.28
Average sale valueper quintal(in Rs.) 192.83
Offence Case
(2015-16)
Number of Offence Case detected 66,225
Number of Offender involved 56,978
Forest Area Diverted to
Non Forest Area
( as on 01.10.2016)
(in numbers)
TOTAL PROPOSALS
Development Project
Total Proposals 444
Irrigation 84
Industry 26
Mining 165
Energy 6
Roads & Bridges 40
Railways 15
Defence 4
Human Habitation 3
Others 41
Transmission 60
Under Section 3(2) of Forest Right Act 2006
Total Proposals 486
Anganwadi 7
Water Harvesting 17

Odisha Profile 2018
69
Items Indicators Value
Forest Area Diverted to
Non Forest Area
( as on 01.10.2016)
(in numbers)
Electricity 195
Tank and other Water bodies 8
Road 178
School 42
Community Centre 23
Hospital 6
BSNL Tower 7
Under Forest (Conservation) Act 1980
Total Proposals
Road 4
Stone Quarry 1
Police Establishment 3
Drinking Water Supply 2
Power Sub Station 1
Irrigation 1
Forest Area Diverted to
Non Forest Area
( as on 01.10.2016)
Total Area Diverted 47,569.26
Industry 4,273.95
Mining 22,024.47
Energy 116.45
Roads & Bridges 314.55
Railways 2,240.30
Defence 3,865.25
Human Habitation 321.94
Others 1,131.72
Transmission 3,503.17
Under Section 3(2) of Forest Right Act 2006
Total Area Diverted 257.92
Anganwadi 0.29
Water Harvesting 5.56
Electricity 92.81
Tank and other Water bodies 5.41
Road 113.68
School 21.35
Community Centre 15.03
Hospital 3.70
Under Forest (Conservation) Act 1980
Total Area Diverted 53,866
Road 38,479
Stone Quarry 2,992
Police Establishment 2,972
Drinking Water Supply 1,790
Power Sub Station 2,833
Irrigation 4,800

Odisha Profile 2018
70
Items Indicators Value
Afforestation,
2016-17
Area covered under Afforestation (ha) 4,37,496
Avenue Plantation (RKM) 5,941
Forest Production
(2016-17)
Production
Fire Wood (MT) 30,404
Bamboo (SU) 20,475
Timber & Timber Product (Cum) 34,680
Kendu Leaf (lakh Qtls) 3.27
Quantity Sold
Fire Wood (MT) 2979
Bamboo (SU) 10,084
Timber & Timber Product (cum) 54,447
Kendu Leaf (Lakh Qtls) 3.07
Revenue Collected
Fire Wood (Rs. In crore) 12.55
Bamboo (Rs. In crore) 4.74
Timber & Timber Product (Rs. In crore) 118.40
Kendu Leaf (Rs. In crore) 725.78
BIODIVERSITY -
Protected Area
(2016-17)
Number of Protected Area 21
Number of National Parks 2
Number of Wildlife Sanctuaries 19
Total area in Sq.Kms 8,352.3
% of Protected area to geographical area 5.36
% of protected area to forest area 10.37
BIODIVERSITY
Protected Area
(in Sq.Kms)
National Parks
Bhitarkanika 145
Simlipal 845.70
Wildlife Sanctuaries 7,094.67
Badrama 304.03
Baisipalli 168.35
Balukhand Konark 71.72
Bhitarkanika 672
Chandaka Dampara 193.39
Chilika (Nalaban) 15.53
Debrigarh WLS 346.91
Gahirmatha (Marine) 1435
Hadgarh 191.06
Kapilash 125.5
Karlapat 147.66
Khalasuni 116
Kothagarh 399.05
Kuldiha 272.75
Lakhari Valley 185.87
Nandankanan 14.16
Satkosia Gorge 745.54
Simlipal 1,354.3
Sunabeda 600

Odisha Profile 2018
71
Items Indicators Value
Marine Protected Areas,
2016-17 (in numbers)
NUMBER OF PROTECTED AREAS 5
National Park 1
Sanctuaries 4
TOTAL AREAS 2,339.25
Bhitarkanika wls 145
Bhitarkanika 672
Chilka (Nalaban) 15.53
Gahirmatha 1435
Balukhand Konark 71.72
Biosphere Reserve,
2016-17
NUMBER OF RESERVE (Similipal) 1
Total Area 5,569
Core Area 845
Buffer Area 2,129
Transition Area 2,595
Number of Villages in the Core area 3
Number of Villages in the Buffer area 61
Number of Villages in the Transition area 1,200
Population (Lakh numbers) 3.5
Percentage of Scheduled Tribe population 73.44
Percentage of Scheduled Caste population 5.21
Ramsar Wet Lands (2015-16) Total number of Ramsar Wet lands 2
Bhitarkanika Mangroves
Wetland Area (in Sq. Kms) 5,254
Perimeter in Kms 55
Chilka Lagoon
Wetland Area in Sq. Kms 1,140
Perimeter in Kms 585
Cultural World
Heritage Sites Sun Temple, Konârak 1
FLORA (2015-16)
(in numbers)
Total Plant Species App. 3,000
Orchids 132
Mangrove 60
Medicinal Plants 350
Wild Life Diversity,
2015-16
(in numbers)
Amphibians Species 27
Reptiles Species 131
Birds Species 479
Mammals Species 87
Fish Species 600
Threatned Animal Species 54
Reptiles Species 17
Birds Species 15
Mammals Species 22

Odisha Profile 2018
72
Items Indicators Value
Zoo (2015-16)
Number of Large Zoo (Nandan Kanan) 1
Number of Small Zoos 2
Number of Mini Zoos 8
Area (2015-16)
Nandankanan Wildlife Sanctuary (Sq.kms) 4.37
Nandankanan Zoological Park (includes Kanjia lake
of 66.1 ha.), (Sq.kms) 3.62
State Botanical Garden (within Nandankanan Wildlife
Sanctuary ) (in Ha.) 75
TIGER RESERVES , 2015
(Area in Sq. Kms)
Total number of Tiger Reserves 2
Total Area 3,713.87
Total Area of the core / critical tiger habitat 1,718.36
Total Area of the buffer / peripheral 1,995.51
Similipal Reserves
Area 2,750.00
Area of the core / critical tiger habitat 1,194.75
Area of the buffer / peripheral 1,555.25
Satkosia Reserves
Area 963.87
Area of the core / critical tiger habitat 523.61
Area of the buffer / peripheral 440.26
TIGER POPULATION , 2016
(in numbers)
Total Tiger Population 40
Male 13
Female 24
Cub 3
Total Leopard Population 318
Male 144
Female 154
Cub 20
Elephant Reserve, 2015-16
(Area in Sq.kms)
Total number of Elephant Reserves 3
Total Area 8,508.95
Protected Area 2,700
Mayurbhanj Elephant Reserves
Total Area 7,043.74
Protected Area 1,309
Mahanadi Elephant Reserves
Total Area 1,038.30
Protected Area 964
Sambalpur Elephant Reserves
Total Area 426.91
Protected Area 427

Odisha Profile 2018
73
Items Indicators Value
Elephant Corridors, 2015-16
Total number of Corridors 14
Length of the Corridors (in Kms) 421
Total area of the Corridors (Sq.Kms) 870.6
Elephant Population, 2017
census (in numbers)
Total number Elephant Population 1954
tuskers 344
Cow elephant 1,092
Unknown 38
Young 502
Crocodile Research &
Conservation Centre,
2015-16
Total number of Tikarpara(Satkosia), Nandankanan
Dangmal (Bhitarkanika), Rantirtha(Simlipal) 4
Mass Nesting Beaches Of
Olive Ridley Sea Turtle ,
2015-16
Total number (Gahiramatha,Rushikulya River mouth
Devi River Mouth) 3
Wild Life Census ,2017-18
Total Migratory Birds 11.18
Chilika Lagoon
Total Migratory Birds (In lakh numbers) 8.68
Number of Species 95
Bhitarkanika Mangrove Wetland
Total Migratory Birds (in lakh numbers) 1.13
Number of Species 83
Hirakud Reservoir
Total Migratory Birds (in lakh numbers) 1.37
Number of Species 82
Salt water Crocodile( Baula) 1713
Number of Mugger Crocodile 198
Gharial crocodile 7
Olive Ridley Sea Turtle (in lakh numbers) 11.10
Number of Irrawaddy Dolphin 163
Number of Dolphin(7 Species) 114
Number of Black buck 4,080
Source : India State Forest Report, 2017, SCSTRTI, Govt. of Oidsha

Odisha Profile 2018
74
Water Resources
Water security, water management
and its development is of immense
importance in all walks of human life and
also for all living beings. It plays a pivotal
role in the socio-economic development of
the country and management of eco system.
The groundwater reserve and surface runoff
constitute the water resources of the State.
Odisha is fortunate to have abundant water
resources both surface and ground water, compared to its size and population to national
level. River basin is considered as the basic hydrological unit for planning and development
of water resources. The State has around 11% of the total water resources of the country
with eleven major rivers basin. The total geographical area of Odisha (1,55,707 square km)
is divided into eleven river basins covering a geographical area of 1,50,460 square km and
minor river basins of 5247 square km which drains directly into the Bay of Bengal. Out of
eleven river basins, seven basins like Mahanadi, Brahmani, Subarnarekha, Nagavali,
Vansadhara, Kolab and Budhabalanga are interstate either due to their origin or fall-out in
the sea of the adjoining state. All the rivers flowing in the state are either originating from
Central Plateau of India or Eastern Ghat region and flow along the direction of lower contour
to join the main stream, which ultimately flow in eastward direction to join Bay of Bengal.
The longest and the largest is the Mahanadi and the smallest is the Bahuda. The rivers of
Odisha are mainly rain fed. Rainfall is the main source of water in Odisha. Southwest
monsoon triggers rainfall in the State. About 78% of total annual rainfall occurs during the
period from June to September and the balance 22% in the remaining period from October
to May. In addition to seasonal availability, the rainfall in the state also shows spatial
variation i.e. from about 1200 mm in southern coastal plain to about 1700 mm in northern
plateau. The long-term average annual rainfall in the state is of the order of 1452 mm, which
corresponds to an annual precipitation of about 230.76 billion cubic metres (BCM) of
water. Water resources have two facets – dynamic and static.
As per an assessment made in 2001, the average annual availability of surface water
is estimated as 120.397 BCM. Out of the above, the yield from its own drainage boundary
is 82.841 BCM and inflow from neighbouring states through interstate rivers is 37.556 BCM.
Considering the topography and geological limitations, 75% of the average annual flow i.e.

Odisha Profile 2018
75
95.540 BCM can be utilized. This includes inflow of 65.679 BCM availability from own
sources of the State and 29.861 BCM availability from neighbouring states through interstate
rivers. Due to increasing demands for water for various uses, an attempt has been made to
assess the availability of water by the year 2051. The assessment reveals that the surface
water availability from its own drainage boundary remains more or less fixed but the inflow
of surface water from neighbouring states will be reduced from 37.556 BCM to 25.272
BCM. The per-capita water availability is reducing progressively owing to increase in
population. As per the assessment made in 2001, the average per capita availability of water
(both surface and ground) in the state was around 3359 cum per annum, as compared to
national average of 1816 cum. With the projected future population, the per-capita water
availability in the State will reduce to 2218 cum in 2051 as against the per capita availability
of 1140 cum in the year 2050 in India. Per-capita water availability less than 1700 cum is
termed water stress condition while if it falls below 1000 cum, it is termed as water scarce
condition.
Ground Water Resources
Item India Odisha
Total Annual Replenishable Ground Water Resources (BCM) 447 17.78
Net Annual Ground Water Availability (BCM) 411 16.69
Annual Ground Water Draft(BCM) 253 5.02
Stage of Ground Water Development(%) 62 30.07
The natural recharge of ground water takes place through percolation from land after rain
events. The quantum of dynamic ground water, which can be annually extracted, is generally
reckoned as ground water potential. In Odisha, the hydrological parameters are conducive
for steady replenishment of ground water. Ground water abstraction in the state is mostly
done by dug wells constructed in the weathered zone in hard rock areas and in shallow
phreatic aquifers in alluvial areas. However, at present, bore wells, shallow to medium deep
tube wells, filter point tube wells are also in use for ground water abstraction both for
domestic and irrigational purpose. As per the latest assessment, the State has annual
replenishable ground water resources of 17.78 lakh (BCM). Keeping an allocation for
natural discharge, the net annual ground water availability is 16.69 BCM. Out of which,
exploration to the extent of 5.02 lakh (BCM) has been made for various uses. The average
stage of ground water development for the State as a whole works out to be about 30.07%.
As per the assessment made in 2001,the total annual replenishable ground water resource
of the State was 21.011 BCM, out of which 60% i.e.12.607 BCM was safe and usable. Out
of the total of 314 blocks in the state, 308 have been categorized as ‘Safe’ and the remaining
Odisha Profile 2018
76
6 blocks are ‘Saline’. As compared to 2013 estimates, there is no significant change in
annual replenishable ground water resource and net ground water availability. However,
annual ground water draft has increased from 4.73 BCM to 5.02 BCM due to increase in
irrigation and domestic consumption. Ground water abstraction in the state is mostly done
by dug wells constructed in the weathered zone in hard rock areas and in shallow phreatic
aquifers in alluvial areas.
Agriculture sector remained the predominant consumer of ground water resources.
About 82.47% of total annual ground water draft i.e. 4.14 BCM is for irrigation use. Only
0.88 BCM is for domestic & industrial use which is about 17.53% of the total draft.
Surface storages are essential component of development in view of the high
variability in availability of water in space and time. A storage capacity of 17.00 BCM has
so far been developed through completed major, medium and minor (flow) projects. The
projects under construction will contribute to additional 1.77 BCM.
Odisha has a total ultimate irrigation potential of 8.8 million hectares where as the
total ultimate irrigation potential (UIP) of the country stands at about 140 million hectares.
The share of minor Irrigation is higher as compared to that of major & medium Irrigation.
Groundwater Contributes more than 59% of the total ultimate potential through minor
irrigation. The State government has given top priority for providing irrigation facilities to
at least 35% of the cultivable area of the State. It has been assessed that out of 314 blocks of
the State, 212 blocks have already been provided with 35% irrigation facilities.
A comprehensive understanding of the Groundwater regime ,its recharge &
discharge is very important to evolve strategy for optimal utilization. The Groundwater
monitoring is being carried out regularly at 1100 locations of the State four times a year i.e.
pre-monsoon, mid-monsoon, post-monsoon and post-winter period for quantitative study of
ground water potential .
Check Dam programme construction was started in the State to utilize a part of the
surface run-off flowing down to the sea. The objective was to conserve water at the end of
monsoon to meet the domestic needs of near by villages, to provide incidental irrigation to
crops in the adjacent cultivated land and to recharge the groundwater.
The other sources of inland water resources include canals, reservoirs, tanks &
ponds, beels, oxbow lakes, derelict water and brackish water .
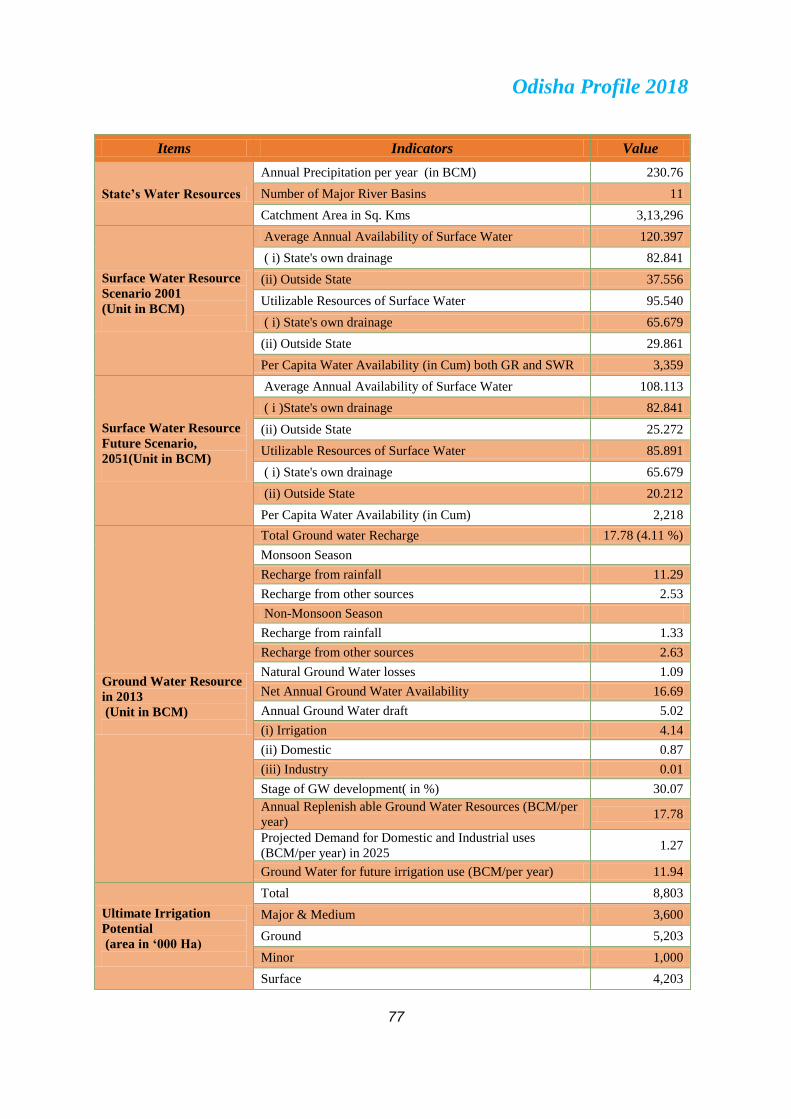
Odisha Profile 2018
77
Items Indicators Value
State’s Water Resources
Annual Precipitation per year (in BCM) 230.76
Number of Major River Basins 11
Catchment Area in Sq. Kms 3,13,296
Surface Water Resource
Scenario 2001
(Unit in BCM)
Average Annual Availability of Surface Water 120.397
( i) State's own drainage 82.841
(ii) Outside State 37.556
Utilizable Resources of Surface Water 95.540
( i) State's own drainage 65.679
(ii) Outside State 29.861
Per Capita Water Availability (in Cum) both GR and SWR 3,359
Surface Water Resource
Future Scenario,
2051(Unit in BCM)
Average Annual Availability of Surface Water 108.113
( i )State's own drainage 82.841
(ii) Outside State 25.272
Utilizable Resources of Surface Water 85.891
( i) State's own drainage 65.679
(ii) Outside State 20.212
Per Capita Water Availability (in Cum) 2,218
Ground Water Resource
in 2013
(Unit in BCM)
Total Ground water Recharge 17.78 (4.11 %)
Monsoon Season
Recharge from rainfall 11.29
Recharge from other sources 2.53
Non-Monsoon Season
Recharge from rainfall 1.33
Recharge from other sources 2.63
Natural Ground Water losses 1.09
Net Annual Ground Water Availability 16.69
Annual Ground Water draft 5.02
(i) Irrigation 4.14
(ii) Domestic 0.87
(iii) Industry 0.01
Stage of GW development( in %) 30.07
Annual Replenish able Ground Water Resources (BCM/per
year) 17.78
Projected Demand for Domestic and Industrial uses
(BCM/per year) in 2025 1.27
Ground Water for future irrigation use (BCM/per year) 11.94
Ultimate Irrigation
Potential
(area in ‘000 Ha)
Total 8,803
Major & Medium 3,600
Ground 5,203
Minor 1,000
Surface 4,203

Odisha Profile 2018
78
Items Indicators Value
Irrigation Potential
Created , 2017-18
(Area in ‘000 Ha)
Total( Khariff+ Rabi) 5,917
Khariff 4,047
Rabi 1,869
Major & Medium( Khariff+ Rabi) 2,078
Khariff 1,426
Rabi 652.45
Mega (lift) ( Khariff+ Rabi) 53.67
Kharif 53.67
Rabi 0.00
Minor (LI point)( Khariff+ Rabi) 1,128.72
Khariff 720.47
Rabi 408.25
Deep bore Well( Khariff+ Rabi) 510.48
Khariff 384.46
Rabi 126.02
Total Minor (Lift)( Khariff+ Rabi) 1,639.21
Khariff 1,104.93
Rabi 534.28
Minor (flow)( Khariff+ Rabi) 793.58
Khariff 704.17
Rabi 89.71
Others( Khariff+ Rabi) 1,351.78
Khariff 758.95
Rabi 592.83
Irrigation Potential
Utilised , 2017-18
(Area in ‘000 Ha)
Khariff+ Rabi 3,442.75
Khariff 2,262.35
Rabi 1,180.40
Check Dam
(As on March 2018)
Total number completed 13,189
Number of Minor Irrigation Sector 12,023
Number of Major & Medium Sector 1,166

Odisha Profile 2018
79
Items Indicators Value
Major River Basins
Subernarekha
Total Catchment Area (Sq. Kms) 19,277
Catchment Area within Odisha (Sq. Kms) 2,983
Average Water Resources Potential (M.Cum) 2,308
Utilisable Surface Water Resources (M.Cum) 2,308
Burhabalanga and Jambhira Total Catchment Area (Sq. Kms) 6,691
Catchment Area within Odisha (Sq. Kms) 6,354
Average Water Resources Potential (M.Cum) 3,111
Utilisable Surface Water Resources (M.Cum) 2,521
Baitarani Total Catchment Area (Sq. Kms) 14,218
Catchment Area within Odisha (Sq. Kms) 13,482
Average Water Resources Potential (M.Cum) 7,568
Utilisable Surface Water Resources (M.Cum) 5,434
Brahmani Total Catchment Area (Sq. Kms) 39,116
Catchment Area within Odisha (Sq. Kms) 22,516
Average Water Resources Potential (M.Cum) 18,577
Utilisable Surface Water Resources (M.Cum) 14,011
Mahanadi Total Catchment Area (Sq. Kms) 1,41,134
Catchment Area within Odisha (Sq. Kms) 65,628
Average Water Resources Potential (M.Cum) 59,155
Utilisable Surface Water Resources (M.Cum) 48,732
Rushikulya Total Catchment Area (Sq. Kms) 8,963
Catchment Area within Odisha (Sq. Kms) 8,963
Average Water Resources Potential (M.Cum) 3,949
Utilisable Surface Water Resources (M.Cum) 2,782
Vansadhara Total Catchment Area (Sq. Kms) 11,377
Catchment Area within Odisha (Sq. Kms) 8,960
Average Water Resources Potential (M.Cum) 5,083
Utilisable Surface Water Resources (M.Cum) 3,881
Nagavali Total Catchment Area (Sq. Kms) 9,275
Catchment Area within Odisha (Sq. Kms) 4,500
Average Water Resources Potential (M.Cum) 2,853
Utilisable Surface Water Resources (M.Cum) 2,322
Indravati Total Catchment Area (Sq. Kms) 41,700
Catchment Area within Odisha (Sq. Kms) 7,400
Average Water Resources Potential (M.Cum) 6,265
Utilisable Surface Water Resources (M.Cum) 4,451
Kolab Total Catchment Area (Sq. Kms) 20,427
Catchment Area within Odisha(Sq. Kms) 10,300
Average Water Resources Potential (M.Cum) 11,089
Utilisable Surface Water Resources (M.Cum) 8,885
Bahuda Total Catchment Area (Sq. Kms) 1,118
Catchment Area within Odisha (Sq. Kms) 890
Average Water Resources Potential (M.Cum) 438
Utilisable Surface Water Resources (M.Cum) 213

Odisha Profile 2018
80
River Basinwise Ground Water Resource
Items Indicators Value
River Basin Wise Ground
Water Resource ,
2013
(Unit in HM)
-
Bahuda
Ground water Resources 11,023
Sectoral Ground water draft Total 3,090
(i) Irrigation 571
(ii) Domestic -
(iii) Industry 3,661
Stages of Ground water development (%) 33.21
Baitarani
Ground water Resources 1,67,215
Sectoral Ground water draft Total 59,275
(i) Irrigation 5,675
(ii) Domestic 2,147
(iii) Industry 67,097
Stages of Ground water development (%) 40.13
Bansadhara
Ground water Resources 72,402
Sectoral Ground water draft Total 13,102
(i) Irrigation 2,225
(ii) Domestic 8
(iii) Industry 15,335
Stages of Ground water development (%) 21.18
Brahmani
Ground water Resources 1,98,033
Sectoral Ground water draft Total 52,686
(i) Irrigation 9,061
(ii) Domestic 2,483
(iii) Industry 64,230
Stages of Ground water development (%) 32.43
Budhabalanga
Ground water Resources 83957
Sectoral Ground water draft Total 27302
(i) Irrigation 3263
(ii) Domestic 1412
(iii) Industry 31977
Stages of Ground water development (%) 38.09
Indravati
Ground water Resources 55,912
Sectoral Ground water draft Total 6,153
(i) Irrigation 3,136
(ii) Domestic 20
(iii) Industry 9,309
Stages of Ground water development (%) 16.65
Jambhira
Ground water Resources 38,634
Sectoral Ground water draft Total 16,705
(i) Irrigation 1,378
(ii) Domestic -
(iii) Industry 18,083
Stages of Ground water development (%) 46.81

Odisha Profile 2018
81
Items Indicators Value
River Basins , 2013
(Unit in HM)
Kolab
Ground water Resources 75,343
Sectoral Ground water draft Total 6,673
(i) Irrigation 2,585
(ii) Domestic -
(iii) Industry 9,258
Stages of Ground water development (%) 12.29
Mahanadi
Ground water Resources 6,85,477
Sectoral Ground water draft Total 1,52,628
(i) Irrigation 37,254
(ii) Domestic 2,262
(iii) Industry 1,92,144
Stages of Ground water development (%) 28.03
Nagavali
Ground water Resources 26,167
Sectoral Ground water draft Total 3,109
(i) Irrigation 1,336
(ii) Domestic 49
(iii) Industry 4,494
Stages of Ground water development (%) 17.17
Rushikulya
Ground water Resources 1,17,910
Sectoral Ground water draft Total 28,068
(i) Irrigation 6,275
(ii) Domestic 484
(iii) Industry 34,827
Stages of Ground water development (%) 29.54
Subernarekha
Ground water Resources 59,855
Sectoral Ground water draft Total 19,303
(i) Irrigation 2123
(ii) Domestic -
(iii) Industry 21,426
Stages of Ground water development (%) 35.80
Area Draining to The Sea,
2013 (Unit in HM)
CHILIKA
Ground water Resources 27,372
Sectoral Ground water draft Total 4,460
(i) Irrigation 1,254
(ii) Domestic 37
(iii) Industry 5,751
Stages of Ground water development (%) 21.01
KANSABANSA
Ground water Resources 49,614
Sectoral Ground water draft Total 22,034
(i) Irrigation 1,565
(ii) Domestic 711
(iii) Industry 24,310
Stages of Ground water development (%) 49.00
Source: Department of Water Resources, Odisha Economic Survey Odisha 2016-17

Chapter Four
State Finance
Macro Economy

Odisha Profile 2018
82
State Finance
The growth of the economy is an important
indicator in the fiscal management analysis,
particularly for revenue generation effort of the
State Government. The State finances exhibited
healthy bottom line in terms of low fiscal deficit
and revenue surplus. The fiscal reforms at the State
level have assumed critical importance in recent
years. A number of reform measures have been taken in the State for achieving fiscal stability.
The overall fiscal scenario of the State continued to be satisfactory over the years. There is a
strong correlation between the Government’s tax revenue receipts and economic growth, i.e.
with the faster economic growth, the tax revenue growth of the Government also goes up and
vice versa. It refers to the responsiveness of tax revenue growth to changes in GSDP.
There has been a remarkable growth in total revenue receipt over the years which has
increased the revenue base substantially. This component showed progressive increase from
Rs.40267.02crore in 2011-12 to Rs.68941.44 crore in 2015-16 registering a growth of 71.21
percent over 2011-12 with the annual growth rate averaging at 15.79 percent.
Components of Revenue Receipts as a % of GSDP (Actual)
2011-12 2012-13 2013-14 2014-15 2015-16
State’s Total 17.87 17.21 17.65 18.4 20.16
State’s Total own Revenue 8.83 9.05 9.11 9.01 9.14
State’s own Tax Revenue 5.97 5.89 6.09 6.4 6.59
State’s own Non Tax Revenue 2.86 3.16 3.02 2.61 2.55
Total -Central Transfer 9.05 8.16 8.54 9.39 11.03
However, there is high fluctuation in year wise growth of revenue during 2005-06 to
2015-16 ranging from 7.40 per cent in 2009-10 to 28.03 per cent in 2006-07. The revenue
receipts as a percentage of GSDP has increased from 17.87per cent in 2011-12 to 20.16 per cent
in 2015-16. Total Revenue Receipts have risen by 20.95% in 2015-16 as compared to 16.45%
reported in 2014-15.The growth rate in Central taxes is the highest (29.57%) during 2015-16 as
compared to other components of the total revenue receipts. The total revenue receipt of the
State was Rs.48946.85 crore in 2013-14 which is expected to be raised to Rs.88931.52 crore
in 2017-18(BE) registering a growth of 81.69% during the period. The growth in revenue
receipt during 2017-18 is expected to be 11.19% over 2016-17.

Odisha Profile 2018
83
The fiscal trends show that the average annual growth of Revenue Receipts was higher
than that of Revenue Expenditures from 2011-12 to 2015-16; The average growth rate of
Revenue Receipts between 2011-12 and 2015-16 was 15.79 percent against the average growth
of Revenue Expenditures of 14.95 percent.In 2015-16, 45.31% of total revenue came from
States own sources and the balance from Government of India in shape of States’ Share in
Central Taxes and Grants-in-Aid.
During the last 10 years, State’s own revenue shares have been significantly lower than
the revenue receipts from Centre, and also less than 50 per cent of the total revenue receipts of
the State, except for the year 2012-13 and 2013-14. The Share of Own Tax Revenue in Total
Revenue Receipt has decreased from 35.52% in 2011-12 to 32.68% in 2015-16. In 2015-16,
45.31% of total revenue came from States own sources and the balance from Government of
India in shape of States’ Share in Central Taxes and Grants-in-Aid. The State’s Own Revenue
(SOR) receipts as a percentage of GSDP has in-creased from 8.83% in 2011-12 to 9.14% of
GSDP in 2015-16.The rising trend is mainly due to State’s Own Tax Revenue (SOTR) which
is increased from 5.97% in 2011-12 to 6.59% in 2015-16 as a percentage of GSDP. The budget
estimate of SOR is pegged at 8.80% of GSDP in 2017-18(BE). Mobilization of resources
through non-tax sources serves the twin purpose of having a rational non-tax structure and
generating resources to finance more expenditure. During 2011-12 to 2016-17(BE), the growth
rate of collection of State‘s Own Non Tax Revenue has been uneven. The central transfers as a
percentage of GSDP (that includes both shared taxes and grants), after dropping noticeably in
2012-13 and 2013-14, have increased from 2014-15 onwards.
Revenue Deficit / Surplus represent the gap between revenue receipts and expenditure.
It is a measure of success in fiscal management that the state continues with revenue surplus
since 2005-06. During the year 2011-12,2012-13, 2013-14, 2014-15 & 2015-16 Revenue
Surplus as a percentage of GSDP was 2.46 ,2.21%, 1.14%, 1.82% & 2.96% respectively. Fiscal
Deficit represents the net borrowing requirement during a year. The State has been able to
contain Fiscal Deficit within the FRBM target of 3% of GSDP since 2004-05. The State was in
Fiscal Surplus for two consecutive years i.e. 2011-12 & 2012-13 even though the extent of
surplus came down from Rs.621.76 crore to Rs.3.62 crore in 2012-13.The zero fiscal deficit
position in 2012-13 has gone up to (-) 2.07% of GSDP in 2015-16. In the year 2013-14, 2014-
15 & 2015-16, however, the State’s finances experienced Fiscal Deficit to the extent of
Rs.4633.64 crore, Rs.5478.62 crore & Rs.7062.83 crore which represented 1.59%, 1.70% &
2.07% of GSDP respectively adhering much below to the FRBM limit. As regard debt
sustainability, the debt stock of the State as percentage of total revenue was 307.59% in 1999-
2000. It has come down to 75.45% in 2015-16. It is, however estimated to be in the order of
77.96% and 86.30% as per RE 2016-17 and BE 2017-18 respectively.The State has been able

Odisha Profile 2018
84
to reduce the debt stock from 50.73% of GSDP in 2002-03 to 15.21% in 2015-16.
With improved fiscal condition, now the
focus of the State Govt. is on efficiency and
quality of public spending. The emphasis is on
outcome and efficiency on expenditure rather
than simply making budget provision. The
overall fiscal situation of the State is stable. It is
capable of tackling fiscal and developmental
challenges without departing from the prudent
fiscal management policy and continue the thrust on socio-economic development for inclusive
growth.
State Finance
Items Indicators Value
Budget at a Glance
Revenue Account
2016-17 RE
(Rs. in Crore)
CONSOLIDATED FUND
Revenue Receipt 79,983.42
(i) Tax Revenue of which 51,521.49
State's share in Union Tax 28,321.49
(ii) Non-Tax Revenue of which 28,461.93
Grant-in-aid from Centre 19,639.00
Revenue Expenditure 72,740.07
(i) Plan Expenditure 46,023.30
(ii) Non-Plan Expenditure 47,492.10
(iii) Out of which Interest Payment 4,650.00
Capital Account
2016-17RE
(Rs. in Crore)
Capital Receipts 12,531.50
(i) Borrowing & Other liabilities 12,346.35
(ii) Recovery of Loans & Advances 185.15
(iii) Other Receipts -
Capital Expenditure 20,775.33
(i) Plan Expenditure 46,023.30
(ii) Non-Plan Expenditure 2,567.47
(iii) Out of which debt repayment 1,208.39
Consolidated Fund (Net) (-)1,000.49
Contingency Fund (Net) 0
Public Account (Net) 1,000.49
Net Transaction of the Year 0
Revenue deficit(-) Surplus (+) 7,243.35
Fiscal deficit (-) Surplus (+) (-)12,138.45
Primary deficit (-) Surplus (+) (-)7,488.45

Odisha Profile 2018
85
Items Indicators Value
Budget at a Glance CONSOLIDATED FUND
Revenue Account
2017-18 BE
(Rs. in crore)
Revenue Receipt 88,931.52
(i) Tax Revenue of which 58,221.67
State's share in Union Tax 31,421.67
(ii) Non-Tax Revenue of which 30,709.85
Grant-in-aid from Centre 21,209.85
Capital Account
2017-18 BE
(Rs. in crore)
Capital Receipts 17,133.46
(i) Recovery of Loans 130.00
(ii) Other Receipts 0.00
(iii) Borrowing & Other liabilities of which 17,003.46
W & M Advances 0.00
Total Receipts 1,06,064.98
Total Receipts without W &M Adv. from RBI 1,06,064.98
Revenue Expenditure of which 82,237.23
(i) Interest Payment 5,000.00
Capital Expenditure 24,673.64
(i) Capital Expenditure without W &M Adv. to RBI of
which 24,673.64
Debt Repayment of which 3,414.64
W &M Adv. to RBI 0.00
Total Expenditure 1,06,910.87
Total Expenditure without W &M Adv. to RBI 1,06,910.87
Revenue deficit(-) Surplus (+) 6,694.29
Fiscal deficit (-) Surplus (+) (-)14,434.71
Primary deficit (-) Surplus (+) (-)9,434.71
Rupees Come from
2017-18 BE
(Rs. in crore)
CONSOLIDATED FUND
State’s Own Tax 26,800.00
(25.08%)
State’s Own Non Tax 9,500.00
(8.89%)
Shared Tax 31,421.67
(29.39%)
Grants –in-Aid from Centre 21,209.85
(19.83%)
Recovery of Loans and Advances 130.00
(0.12%)
Loans from different sources 17,003.46
(15.90%)
Provident Fund and Other Funds & Deposits (Net) 845.89
(0.79%)
TOTAL 1,06,910.87
(100%)

Odisha Profile 2018
86
Items Indicators Value
Rupees Goes Out
2017-18 BE
(Rs. in crore)
CONSOLIDATED FUND
Debt Servicing( Interest Payment) 5,000.00
(4.68%)
Repayment of Loans 3,414.64
(3.19%)
Disbursement of Loans (Administrative) 485.47
(0.45%)
Other Revenue Expenditure 70,591.56
(66.03%)
Expenditure in Capital Sector (Other than Repayment of
loans)
20,773.53
(19.43%)
Disaster Response Funds 1,824.00
(1.71%)
Transfers from State 4,821.67
(4.51%)
TOTAL 1,06,910.87
(100%)
Key Fiscal Indicators
(% of GSDP)
2017-18 BE
(In percentage)
Revenue Surplus Ratio 1.62
Fiscal Deficit Ratio (-) 3.50
Primary Deficit Ratio (-) 2.29
Debt Stock Ratio 18.61
Interest Payment to Revenue Receipt Ratio 5.62
Share of Department
wise expenditure
2017-18 BE
(In percentage)
School and Mass Education 12.96
Panchayati Raj 7.93
Water Resources 8.61
Rural Development 6.89
Health and Family Welfare 5.32
Works 4.64
Home 4.07
Agriculture and Farmers' Empowerment 3.66
Housing and Urban Development 4.19
Scheduled Tribes and Scheduled Caste Development,
Minorities and Backward Classes Welfare 2.76
Other Departments 38.97
Source: Odisha Budget at a Glance-2017-18 (Variation if any in the figures are due to rounding up), People’s Guide 2017-18

Odisha Profile 2018
87
Macro Economy
Economic development is a process whereby
the State’s real income increases over a long
period of time. The Performance of the
economy of a state is generally adjudged in
terms of growth rate of GSDP (Gross State
Domestic Product). Gross State Domestic
Product (GSDP) in common parlance known
as “State Income”, is a measure in monetary
terms of sum total volume of all goods and
services produced during a given period of time within the geographical boundaries of the State,
accounted without duplication. Increase in Gross State Domestic Product must be sustained to
deliver economic development. There is happening a structural change in the State economy
with a gradual shifting from agriculture to industry and service with more noticeable growth
towards the service sector. Odisha’s economy has been following a high growth trajectory in
recent years as shown by acceleration in terms of the gross state domestic product (GSDP).
The gross state domestic product (GSDP) in the State increased from Rs.230.99
thousand core in 2011-12 to Rs.434.67 thousand core in 2017-18 ( at 2011-12 prices) registering
a Compound Annual Growth Rate (CAGR) of 5.51 per cent. Thus the size of the economy
increased by 37.96 percent in real terms (at 2011-12 prices) during the last six years, in terms
of GSDP, exhibiting an annual average growth rate of 6.66 percent against the all India average
of 6.84 percent for the said period. The growth rate of GSDP, which was 13.30 percent in 2012-
13, had picked up momentum from 2013-14 with growth rates of 13.29 percent in 2013-14,
then with a sharp decline of 6.00 percent in 2014-15 & 4.56 percent in 2015-16,17.05 percent
in 2016-17 and then again decline the momentum of 13.01 percent in 2017-18. The State’s real
growth rate of 2016-17 has surpassed the all India growth rate of 7.1% and this can be attributed
to sustained development initiatives and prudent macro management of economy. The real
GSDP of Odisha has grown by an annual average rate of 4.2 percent during the period from
1951 to 2011 against all India average of 4.9 percent at 2004-05 base.
The sectoral performance reveals the magnitude and composition of GSDP of the State
economy overtime. The varying growth trends are reflected in the compositional shift among
sectors in the GSDP. The agriculture and allied sector showed fluctuating trend over the period.
The average contribution of this sector to GSDP of the State was 62 percent in 1950’s, 48
percent in 1980’s and 22 percent during the period 2000-2010 (at 2004-05 base). This average
share further reduced to 19.92 percent during the period 2011-16 (at 2011-12 base) showing
sectoral shifts away from agriculture to industries and services. During 2011-16 the sector
exhibit negative trend in the year 2013-14 & 2015-16 which is improved significantly at 14.40

Odisha Profile 2018
88
percent during 2016-17,the average annual growth rate being 4.03 percent & CAGR being 3.36
percent during the period.
The average contribution of Industries sector for the State GSDP has been increasing
from 26 percent in 1980`s to 34 percent in 2000-10, although it showed fluctuations from 1950`s
to 1970`s. The overall GSDP of the industries sector increased from Rs. 9323747.11 lakh
during 2011-12 to Rs.12747289.97 lakh during 2016-17 registering an annual average share of
39.20 per cent. Overall industries sector witnessed average annual growth rate (CAGR percent)
of 5.47 percent during 2011-16.The sector contributed about 36.56 percent to Odisha’s GSDP
at 2011-12 prices in 2016-17. The sector which was recovered from a negative growth of 2.37
percent in the year 2012-13 is expected to grow at a rate of 4.52 percent in 2016-17, mainly
driven by Manufacturing & Mining sub sectors.
Sectoral Share at Current Prices in 2011-12 Base
- Agriculture Industry Services
2011-12 17.87 43.59 38.54
2012-13 21.44 39.70 38.86
2013-14 20.24 40.64 39.13
2014-15 22.21 36.69 41.10
2015-16 20.24 37.45 42.52
2016-17 21.50 35.71 42.72
2017-18 18.84 39.35 41.76
The services sector also shows an inspiring average rate of growth from 27 percent in
1980’s, 44 percent in2000-2010 2004-05 base) and 40.88 percent during 2011-16 (2011-12
base). The sector with an imposing annual average share of 40.88 percent of GSDP &average
annual growth rate of 8.2 percent during 2011-16 estimates at 2011-12 prices, is the leading
sector of Odisha economy. In 2011-12, the share of the sector was 39.09 percent and it rose to
43.53 percent in 2016-17.The sectoral growth has accelerated from 6.94 percent in 2011-12 to
10.85 percent in 2015-16 and it further decreased to 8.08 percent in 2016-17.
The State aims at acceleration in growth rates in all the sectors of the economy so that
a ratchet growth process can be ensured and the people in the bottom quintile can enjoy the
fruits of economic development. Per capital income is used as a crude measure of economic
welfare. The level of per capita income depends upon two things the size of population and the
size of the economic pie.

Odisha Profile 2018
89
The per capita income or per capita Net State Domestic product (NSDP) of Odisha at
constant (2011-12) market prices continuously increased from Rs.50714 in 2012-13, Rs.54109
in 2013-14,Rs.54210 in 2014-15,Rs.57602 in 2015-16 Rs.66625 in 2016-17and Rs.70799 in
2017-18 respectively..Per capita Income of Odisha grew at 4.01 percent 6.07 percent, 4.52
percent and 4.90 percent during 2012-13, 2013-14, 2014-15 and 2015-16 respectively over the
previous year. The Per capita Income of Odisha during 2016-17(A.E) touch Rs. 61,678, which
accounted for 7.05 percent rise over the previous year. India’s real per capita Income rose by
6.5 percent % Rs. 81,805 in 2016-17 compared to Rs. 77,524 in the previous year.
Macro Economy
Items Indicators Value
Key Aggregates of SDP,
2017-18
(1st Revised Estimate)
(Unit Rs in lakh)
AT CURRENT PRICE
Gross State Value Added at basic Prices 3,93,64,430
Taxes on Products 52,23,069
Less Subsidy on Products 11,20,216
Gross State Domestic Product 4,34,67,283
Consumption of Fixed Capital 58,87,487
Net State Value Added at basic Prices 3,34,76,943
Net State Domestic Product 3,75,79,796
Per Capita Gross State Domestic Product (In Rs.) 96,893
Per Capita Net State Domestic Product (In Rs.) 83,769
Growth Rate Over Previous Year
Key Aggregates of SDP,
2017-18
(1st Revised Estimate)
(Unit in Percentage)
Gross State Value Added at basic Prices 13.13
Taxes on Products 6.52
Less Subsidy on Products -9.37
Gross State Domestic Product 13.01
Consumption of Fixed Capital 15.36
Net State Value Added at basic Prices 12.68
Net State Domestic Product 12.59
Per Capita Gross State Domestic Product 11.87
Per Capita Net State Domestic Product 11.46
Key Aggregates of SDP,
2017-18
(1st Revised Estimate)
(Rs. in lakh)
AT CONSTANT (2011-12) PRICE
Gross State Value Added at basic Prices 3,37,42,279
Taxes on Products 35,61,345
Less Subsidy on Products 7,63,818
Gross State Domestic Product 3,65,39,806
Consumption of Fixed Capital 47,78,452
Net State Value Added at basic Prices 2,89,63,827
Net State Domestic Product 3,17,61,354
Per Capita Gross State Domestic Product (In Rs.) 81,451
Per Capita Net State Domestic Product (In Rs.) 70,799

Odisha Profile 2018
90
Items Indicators Value
Key Aggregates of
SDP, 2017-18 (1st
RE) (In percentage)
Growth Rate Over Previous Year
Gross State Value Added at basic Prices 7.27
Taxes on Products 4.19
Less Subsidy on Products -11.35
Gross State Domestic Product 7.44
Consumption of Fixed Capital 8.05
Net State Value Added at basic Prices 7.15
Net State Domestic Product 7.35
Per Capita Gross State Domestic Product 6.36
Per Capita Net State Domestic Product 6.27
Gross State Value
Added By Economic
Activity
2017-18 (1st RE)
At Current Basic Prices
Total Gross State Value Added at basic Prices (Rs. in lakh) 3,93,64,430
Primary (Rs. in lakh) 1,15,94,495
Secondary (Rs. in lakh) 1,13,30,884
Tertiary (Rs. in lakh) 1,64,39,051
Percentage share of Gross State Value Added (%) 100
Primary (%) 29.45
Secondary (%) 28.78
Tertiary (%) 41.76
Growth Rate Over Previous Year
Total Gross State Value Added (%) 13.13
Primary (%) 5.32
Secondary (%) 16.67
Tertiary (%) 16.80
At Constant (2011-12) Price
Total Gross State Value Added at basic Prices (Rs. in lakh) 33,74,227
Primary (Rs. in lakh) 93,63,317
Secondary 1,07,61,291
Tertiary (Rs. in lakh) 13,61,767
Percentage share of Gross State Value Added (%) 100
Primary (%) 27.75
Secondary (%) 31.89
Tertiary (%) 40.36
Growth Rate Over Previous Year
Total Gross State Value Added (%) 7.27
Primary (%) -3.88
Secondary (%) 11.20
Tertiary (%) 13.15
Broad Industrial
Distribution of
GSVA,
2017-18 (1st R.E.)
At Current Basic Prices
Total Gross State Value Added at basic Prices (Rs. in lakh) 3,93,64,430
Agriculture (Rs. in lakh) 74,16,353
Industry (Rs. in lakh) 1,55,09,027
Services (Rs. in lakh) 1,64,39,051
Percentage share of Gross State Value Added % 100
Agriculture % 18.84
Industry (%) 39.39
Services (%) 41.76
Growth Rate Over Previous Year
Total Gross State Value Added (%) 13.13
Agriculture (%) -0.85
Industry (%) 35.05
Services (%) 16.80

Odisha Profile 2018
91
Items Indicators Value
Broad Industrial
Distribution of
GSVA,
2017-18 (1st R.E.)
At Constant (2011-12) Price
Total Gross State Value Added at constant Prices (Rs. in lakh) 33,74,227
Agriculture (Rs. in lakh) 45,08,079
Industry (Rs. in lakh) 1,56,16,529
Services (Rs. in lakh) 1,36,17,672
Percentage share of Gross State Value Added (%) 100
Agriculture (%) 13.36
Industry (%) 46.28
Services (%) 40.36
Growth Rate Over Previous Year
Total Gross State Value Added (%) 7.27
Agriculture (%) -8.16
Industry (%) 11.66
Services (%) 13.15
Net State Value
Added By Economic
Activity , 2017-18 (1st R.E.)
At Current Basic Prices
Total Net State Value Added at current Prices (Rs.in lakh) 3,34,76,943
Primary (Rs.in lakh) 1,04,67,383
Secondary (Rs.in lakh) 85,23,955
Tertiary (Rs.in lakh) 1,44,85,605
Percentage share of Net State Value Added (%) 100
Primary (%) 31.27
Secondary (%) 25.46
Tertiary (%) 43.27
Growth Rate Over Previous Year
Total Net State Value Added (%) 12.68
Primary (%) 5.04
Secondary (%) 16.14
Tertiary (%) 16.78
At Constant (2011-12) Price
Total Net State Value Added at constant Prices (Rs.in lakh) 3,34,76,943
Primary (Rs.in lakh) 1,04,67,383
Secondary (Rs.in lakh) 85,23,955
Tertiary (Rs.in lakh) 1,44,85,605
Percentage share of Net State Value Added (%) 100
Primary (%) 29.60
Secondary (%) 28.91
Tertiary (%) 41.49
Growth Rate Over Previous Year
Total Net State Value Added (%) 7.15
Primary (%) -3.78
Secondary (%) 10.98
Tertiary (%) 13.62

Odisha Profile 2018
92
Items Indicators Value
Broad Industrial
Distribution of
NSVA, 2017-18
(1st R.E.)
At Current Basic Prices
Total Net State Value Added at current Prices (Rs.in lakh) 3,34,76,943
Agriculture (Rs.in lakh) 69,28,859
Industry (Rs.in lakh) 1,20,62,478
Services (Rs.in lakh) 1,44,85,605
Percentage share of Net State Value Added (%) 100
Agriculture 20.70
Industry (%) 36.03
Services (%) 43.27
Growth Rate Over Previous Year
Total Net State Value Added (%) 12.68
Agriculture (%) -0.68
Industry (%) 34.52
Services (%) 16.78
At Constant (2011-12) Price
Total Net State Value Added at constant Prices (Rs.in lakh) 2,89,63,827
Agriculture (Rs.in lakh) 41,64,460
Industry (Rs.in lakh) 12,78,22,906
Services (Rs.in lakh) 1,20,16,461
Percentage share of Net State Value Added 100
Agriculture (%) 14.38
Industry (%) 44.13
Services (%) 41.49
Growth Rate Over Previous Year
Total Net State Value Added (%) 7.15
Agriculture (%) -7.90
Industry (%) 11.44
Services (%) 13.62
Source : State Income Division , Directorate of Economics & Statistics ,Odisha

Chapter Five
Industries & Mining
Energy
Labour & Employment

Odisha Profile 2018
93
Industries & Mining
The Industry sector, as described in the
Index Number of Industry Production, published
by the Reserve Bank of India (RBI), consists of
(a) manufacturing, (b) mining and quarrying and
(c) electricity, gas and water supply. This sector
which is vital in stimulating growth of the
economy is closely interconnected with primary
and tertiary sectors through its forward and backward linkages. Like other developing
economy, the economy of Odisha has been going through structural changes away from
agriculture in favour of industry and services. Industry sector in Odisha has emerged as a major
driver of State’s economy in recent decade. State's industry oriented policies since 1990s and
afterwards created favourable conditions for investments and entry of national and
multinational companies into the State. Access to global markets, presence of qualified human
resource, robust infrastructure, stable polity and a positive business environment make the
Odisha a favoured destination for investors.
Industrial sector is important in terms of its contribution to Gross State Domestic
Product (GSDP) and employment. The industry sector has been emerging as one of the prime
movers of the State's economy with slowly but steadily increasing share of this sector to State's
GSDP over the years. As per the advance estimate of 2018-19 the share of industry sector to
State GSDP is29.25 percent as against 28.81 percent in2017-18.
During the year 2018-19, the share of the manufacturing subsector is 18.47 percent and
that of the mining and quarrying subsector stands at 10.79 percent in the Industry Sector, which
has grown in real terms at 2011-12 prices at 11.13 percent, the growth of the manufacturing
sub- sub-sector being 63.13 percent and that of the mining and quarrying sub-sector 36.87
percent during 2018-19 over 2017-18. The growth of manufacturing sector being 15.77 percent
and that of mining and quarrying sector is only 4.30 percent during 2018-19 over 2017-18. The
manufacturing sub-sector contributes highest percentage of GVA i.e 46.18 percent to Industry
sector followed by mining and quarrying 26.94 percent.
Large scale industries are prime movers of industrialization in the State. Most of the
large scaleindustries of the State are mineral based. As on March 2018, the State has 254
numbers of large & medium industries of which 213 are large industries & 41 are medium
industries. The large scale industrial sector is dominated by Engineering & Metal Based
industries in Odisha.

Odisha Profile 2018
94
Steel is a product of large and technologically complex industry having strong forward
and backward linkages in terms of material flows and income generation. The State occupies
a prominent place in the minerals map of the country both in term of deposits and production.
Odisha's rich mineral reserves constitute 33% Iron ore, 24.58% coal, 52% Bauxite,92%
Nickel,44%Manganese and 92% Chromite of India's total deposits. Rourkela Steel Plant
(RSP) and NIlachal Inspat Nigam Limited are the two Public Sector Undertakings (PSU) in
Odisha. Major Steel producers like TATA steel, Bhusan Steel Limited (BSL),Bhusan Power
and Steel limited(BSPL), Jindal Stainless Steel(JSL) and Jindal Steel and Power Limited have
their mother plants in the State. The State produces more than 20% of the total steel produced
in the country. Odisha has made significant contribution in national steel growth with respect
to capacity building in terms of installed capacity.
Micro, Small and Medium Enterprises (MSME) sector has emerged as a highly vibrant
and dynamic sector of the Indian economy. The sector not only play crucial role in providing
large employment opportunities at comparatively lower capital cost than large industries but
also help in industrialization of rural & backward areas, thereby, reducing regional imbalances,
assuring more equitable distribution of national income and wealth. MSMEs are
complementary to large industries as ancillary units and this sector contributes enormously to
the socio-economic development of the country. In Odisha itself MSME units are generating
maximum employment next to agriculture. The State has a vast tradition, grand heritage &
huge potential for MSME sector. The sector has witnessed an increasing trend in respect of
number of MSME units set up, quantum of investment made and employment generation over
a period of time. The number of units of MSME set up in the State as on 2009-10 was 106840
which has reached to 322028 as on 2017-18. The sector generated employment to the tune of
6.24 lakh as on 2009-10 which has gone up to 6.28 lakhin 2017-18. The total investment on
the sector has increased from 3640.93 crore as on 2009-10 to 10975.39 crore as on 2017-18.
However the MSME sector has achieved a record growth with 50158 units gone into production
with an investment of Rs 2324.46 crore and employment generation of 6.28 lakh persons during
2017-18.
The repairing and services subsector share the highest 58.8 percent of units with 58.37
percent share of investment and 43.07 percent of employment under MSME sector in Odisha.
Next to it the food and allied sectors manufacturing units share 11.9 percent of units, 13.35
percent of investment and 14.23 percent of employment generation in MSME sector of the
State during 2017-18.

Odisha Profile 2018
95
MSME Industries in Odisha
Year
Units (Number)
Cumul
ative
Investment
(Rs Crore)
Employ
ment (Number)
2009-10 1,06,840 3,641 6,24,400
2010-11 1,11,856 4,036 6,48,851
2011-12 1,17,361 4,537 6,79,238
2012-13 1,23,292 4,970 7,06,342
2013-14 1,30,301 5,639 7,38,478
2014-15 1,60,167 7,906 8,45,489
2015-16 2,14,087 10,586 1,66,731
2016-17 2,71,820 3,035 1,75,227
2017-18 3,22,028 2,324 1,47,252
Handicrafts & Cottage Industries sector comprises of Handicraft, Coir, Salt and Khadi
& Village Industries activities, which are mainly artisan based or known as house-hold industry.
This sector has ample scope for employment generation with low capital investment, use simple
technology and utilisation of local resources and thus is the major source of income for the
rural areas in the State.
Odisha has earned a unique reputation for its arts and crafts all over the world. Odisha
is considered as the land of handicrafts and it is an integral part of Odisha’s culture. About 50
different crafts are practiced in Odisha and about 1.3 lakh artisans are engaged in various trades.
In the process different clusters involving different trade have been created in the State focusing
on identical crafts. Some of the important crafts in the State are, applique works of Pipili,
pattachitra of Puri, silver filigree and golden green mats of Cuttack and horn work of
Paralakhemundi. These sectors have not only kept the rich heritage of the State but also have
provided employment to lakhs of artisans. During 2017-18, 3320 cottage industries have been
established and gone into production with an investment of Rs.24.05 crore and providing
employment to 5793 persons.
Handlooms are a part of rich cultural heritage of the State and handloom products have
received a reputation in and outside Odisha. It has got great employment potential. Out of
40616 looms in 530 working Primary Weavers Cooperative Societies 37393 were working
looms which produced 90.54 lakh sq. mtrs of handloom products valued at Rs.178.84 crore
during 2017-18.The productivity per loom per annum during 2017-18 stood at 416 sq. mtrs in
the Co-operative fold as against 505 sq. mtrs in 2016-17.
Sericulture is an agro based industry which gives employment to rural poor in Odisha.

Odisha Profile 2018
96
Items Indicators Value
Micro, Small &Medium
Enterprises ,2017-18 (in
Numbers)
SSI units set up 3,22,028
Food & Allied 38,172
Chemical & Allied 4,210
Electrical & Electronics 2,123
Engineering & Metal Based 17,451
Forest & wood based 15,284
Glass & Ceramic 10,810
Livestock & Leather 694
Paper & Paper Products 4,138
Rubber & Plastic 2,155
Textiles 16,910
Misc. Manufacturing 20,864
Repairing & Servicing 1,89,217
Investment ,2017-18
(Rupees in crores)
Total Investment 15,945.25
Food & Allied 2,128.33
Chemical & Allied 333.37
Electrical & Electronics 116.15
Engineering & Metal Based 1,263.79
Forest & wood based 235.19
Glass & Ceramic 766.03
Livestock & Leather 16.08
Paper & Paper Products 185.94
Rubber & Plastic 288.56
Textiles 387.35
Misc. Manufacturing 917.57
Repairing & Servicing 9,306.89
Employment Generated
(number of persons), 2017-18
Total Employment 13,34,693
Food & Allied 1,89,915
Chemical & Allied 28,249
Electrical & Electronics 10,456
Engineering & Metal Based 1,15,427
Forest & wood based 67,385
Glass & Ceramic 1,49,842
Livestock & Leather 3,252
Paper & Paper Products 20,567
Rubber & Plastic 12,828
Textiles 78,193
Misc. Manufacturing 83,755
Repairing & Servicing 5,74,824
Registered MSME Units ,
2017-18
Total Number of units 3,22,028
Investment (Rs.in Crores) 2,324.46
Employment (Persons) 1,47,252
Women Employment (Persons) 23,640

Odisha Profile 2018
97
Items Indicators Value
Industrial Estates & Areas ,
2017-18
Number of Industrial Estates & Areas 110
Gross Area in Acres 10,640.17
Land allotted to Industrial Estates in Acres 5,552.41
Land available for allotment in acres 2,735.72
Handicraft &
CottageIndustries,2017-18
No. of Units set up 3,320
Investment (Rs. in lakhs) 2,405.31
Employment generated (Persons) 5,793
Women employment (Persons)
Handloom Industries
2017-18
Total Number of Units 37,393
Number of Working Units 21,760
Number of Cotton Units 16,059
Number of Silk Units 5,701
Production
2017-18
Total (in lakh Sq.meter) 90.54
Cotton (in lakh Sq.meter) 77.53
Silk (in lakh Sq.meter) 13.01
Values
2017-18
Total (Rs in lakhs) 17,884.21
Cotton (Rs in lakhs) 11,363.39
Silk (Rs in lakhs) 6,520.82
Productivity
2017-18
Productivity per loom per annum in Sq.meter 416
Average earning per annum in Rupees 37,346
Primary Weaver’s
Cooperative
Society(PWCS),2017-18
Total number of PWCS 1,151
Number of Working PWCS 530
Number of Under liquidation PWCs 568
Number of Dormant PWCs 53
Membership in PWCS
(2017-18)
Total 72,601
In working PWCs 63,890
In Dormant PWCs 8,711
No. of Looms in PWCs (2017-
18)
Total No. of Looms 40,616
In Working PWCs 37,393
In Dormant PWCs 3,223
Production and Sale by
PWCs (2017-18)
Total Production (in lakh Sqr. Mtr) 90.54
Total Value of Production (in lakh Rs) 17,884.21
Total Sale by PWCs (In lakh Lakh sqr Mtrs) 89.42
Total Sale by PWCs (in lakh Rupees) 17,101.87
PWC Census 2009-10
Weaver Population (Persons) as per 2009-10
Census 1,92,339
Number of Weaver Household as per 2009-10
Census 40,683
Number of Looms as per 2009-10 Census 43,652

Odisha Profile 2018
98
Items Indicators Value
Khadi & Village
Industries, 2015-16
Number of PMEGP units 777
Employment generated (Persons) 5,618
Sericulture
2017-18
Tassar
Tassar Food Plants (Area in Ha) 765
Production of Dfls (Disease Free Layings) in lakh numbers 25.25
Procurement of Dfls (Disease Free Layings ) in lakh numbers -
Consumption of Dfls (Disease Free Layings ) in lakh numbers -
Production of reeling cocoons in lakh numbers 1,220.03
Production of raw silk in MT 106
Production of silk waste in MT
No. of farmers covered 16,041
Mulberry
Mulberry area in Acres 102
Procurement of Dfls ) in lakh numbers
Consumption of Dfls ) in lakh numbers 1.23
Production of reeling cocoons ) in lakh numbers 22.48
Production of raw silk in M.T. 3.0
Production of silk waste in M.T.
No. of farmers covered 1,717
Eri
Existing Castor Plantation (Area in acres) 1,600
Consumption of Dfls ) in lakh numbers 1.39
Production of cut cocoons in M.T. 8.0
Production of raw silk in M.T. 7.0
No. of farmers covered 3,200
Export Promotion ,
2017-18 (Rs. in
crores)
Total Value of Goods exported to foreign Countries 52,677.09
Metallurgical Products 31,566.46
Engineering Chemical & Allied products 5,892.72
Mineral products 8,117.91
Agriculture and Forest Products 165.22
Marine Products 3,086.97
Handloom Products 0.53
Handicraft products 1.63
Textile Product 15.31
Electronics & Software 3,776.11
Pharmaceuticals 13.67
Others (gem & Jewellary and Service Provider) 40.55

Odisha Profile 2018
99
Items Indicators Value
Mining, 2017-18
ES
Total number of leases 607
Number of Working leases 90
Area covered under working leases in Hectares 45,297.68
Number of Workers Employed in major minerals
activities 55,940
Mineral Production in lakh Tonnes 2,689.89
Value (Rs. in crores) 65,435.73
Mining Revenue collection (Rs. in crores) 5,130.55
Revenue collection from minor minerals (Rs. in lakh) 55.18
Export of mineral s (in lakh MT) 130.58
Value (Rs. in crores) 3,150.26
Production of minor minerals (in lakh MT) 15.63
Production value of minor minerals (Rs. in crore) 11,095.00
Establishments as per
6th Economic Census
2013
(in ‘000 numbers)
Total establishments in 000 numbers 2089
Rural 1606
Urban 483
Outside household without fixed structure 583
Rural 472
Urban 111
Outside household with fixed structure 878
Rural 600
Urban 278
Inside Household 628
Rural 534
Urban 94
Handicraft/Handloom 146
Rural 130
Urban 16
EMPLOYMENT in
‘000 numbers as on
2013
Total Persons employed 4318
Rural 3194
Urban 1124
Source: Directorate of Industries, Odisha ,Directorate of H&CI, Directorate of EPM, Odisha ,
Directorate of Economics and Statistics,

Odisha Profile 2018
100
Energy
Energy is an essential building block of economic development. In an effort to meet the
demands of rapid industrialization, the energy sector of Odisha has undergone significant
growth in past few years. Areas like the resource exploration, capacity additions and sectoral
reforms have been revolutionized. The energy sector can be categorized primarily in to Power,
Oil & Gas respectively. There are different types of energy, out of which the energy that cannot
be exhausted is called as renewable energy. Examples of renewable energy are solar power,
wind power, hydroelectric power, tidal power and geothermal energy. Whereas the energy
which can be exhausted or cannot be replaced easily at a faster rate as compared to the rate at
which they are consumed like the natural resources in the form of oil, coal and natural gas are
the example of nonrenewable energy. India’s energy basket has a mix of all the resources
available including renewables The demand for energy in the present time is increasing because
of continuous industrial development & urbanization .Sectoral demand for energy arises
mainly from lighting and cooking in the household sector; irrigation and other operations in the
agricultural sector; transport of passengers and freight and fuel input requirements in the
industrial sector.
The power sector includes generation, transmission and distribution of electricity. The
power sector has grown considerably over the years and is able to support infrastructure
development in the State. The Indian power sector is one of the most diversified in the world,
compared to many developing countries where crude oil and natural gas and renewables play a
major role. Sources for power generation in India range from conventional sources like coal,
lignite, natural gas, oil, hydro and nuclear power to other viable nonconventional sources like
wind, solar and agriculture and domestic waste. The availability of reliable, quality and
affordable power is vital for rapid growth in agriculture, industry and for overall economic
development of a State Odisha has pioneered the Power Sector Reform in the country. In Odisha
power is generated by hydropower, thermal power and renewable energy sources like solar and
bio-mass plant. The state of Odisha depends primarily on thermal and hydro power generation
to meet its power requirements. Coal-based power generation dominates electricity supply in
the State. Renewables account for just 1% of installed capacity.
As on 2017-18, the State has 10 hydropower, 9 thermal power projects (both central and
state) 1 bio-mass project, 2 small hydroelectric projects, 16 SPV (solar Photo Voltaic) projects
and 31 numbers of Captive Power Plants (CPP) in major industries to supply power to the state.
State receives power from its own sector, central generating stations, renewable energy sources,
Independent Power Producer (IPP), and Captive Power Plants (CPP) to fulfill its power needs
.Hydro generation has the highest contribution in the overall generation. The power sub-sector
along with gas and water supply sub-sectors has contributed 3.7 percent of Odisha GSDP during
2018-19. The primary objectives in this sector are optimum utilization of the power generated,

Odisha Profile 2018
101
substantial reduction of transmission and distribution losses, maximizing generation from the
existing capacity and further addition of units to generate more power for meeting the increasing
demand for power over the coming years. There are four DISCOMs serving electricity
consumers in Odisha i.e.; CESU, NESCO Utility, WESCO Utility and SOUTHCO Utility.
Power Scenario of Odisha
At current, the State power sector has an installed capacity of 5810.82MW during 2017-
18 as against 5509.14MW in 2016-17 with an increase of 5.48 percent which includes share
from central generating stations. The hydro power, thermal power (State & central sector) and
other power sources (renewable, independent & CPP) share 41, 37 & 22 percent respectively
of total installed capacity of the power projects in Odisha. The present generation capacity of
the State is 5737 MW which constitutes about 32.49% or 1864 MW via hydro power, 15.34%
or 880 MW via thermal power, 25.57% or 1386 MW via central sector,2.44% or 140 MW via
renewable source and 24.16% or 1467 from State Independent Power Producers source. During
2017-182998 MW of electricity (55.83% ) from State sector, 40.19% from central sector &
rest 4.30% from CPP and others) was available for consumption from all sources and that stood
51.59% of total installed capacity of all power projects in the State as against power availability
of 2962 MW during 2016-17.The ratio of installed capacity and power availability in Odisha
increased from 39.23 in 2007-08 to 51.59 in 2017-18. The demand for power in Odisha in
2017-18 is estimated at 3062 MW as against 3020 MW in 2016-17.
The state now dominates in the power sector by bringing reforms in the participation
of private sector not only in the generation of power but also in the transmission and distribution
of power. Government of Odisha is also able to provide electricity to all because of proper
implementation and execution of Biju Grama Jyoti Yojna, Biju Saharanchal Vidyutikaran
Yojna and Rajiv Gandhi Grameen Bidyutikaran Yojna.
5593.08 5509.145810.82
29
34
30
20
30
62
29
00
29
62
29
98
0
1000
2000
3000
4000
5000
6000
7000
2015-16 2016-17 2017-18
(In
MW
)
Installed Capacity Demand of Power Power available

Odisha Profile 2018
102
Electricity consumption is one of the most important indicator that decides the
development level of a State. Energy consumption in an economy mainly implies consumption
of energy by the industrial sector, household sector and transportation sector. The total
consumption of power in the State has increased with a CAGR of 6.93% between the period
2005-06 to 2015-16.The total power consumption of Odisha was 17729 MU in 2017-18 as
against 16343 MU in 2016-17. Consumer profile of State’s electricity is: domestic consumer
38.09% followed by 36.25% industry consumers and 12.10% is consumed by commercial
consumer. Rest of the Electricity is consumed by railways and others. However, domestic
consumption exhibits an upswing trend while industrial consumption suffers from stagnancy or
downswing over last few years. As rural electrification is concerned about Out of 47,675
villages in Odisha, 45893 no. of villages ( 96.26 percent ) have been electrified by the end of
31st March, 2018 .The State has 68.53 lakh power consumers in 2017-18 with 75.83 percent
of them are rural users.
Power consumption in Odisha in 2017-18
Odisha accounts highest for 21.12% of total coal reserves of India as on 31st March
2018 following Chhatishgarh with 21.00% share
Renewable energy assumes great significance in the wake of huge demand of electricity
throughout the country out-stripping the supply, which is being largely met from coal based
thermal generation. There is high potential for generation of renewable energy from various
sources- wind, solar, biomass, small hydro and cogeneration bagasse. Odisha thus has a
significant renewable energy potential, largely in the form of solar energy, but also in the form
of wind and biomass. Odisha has estimated wind power potential of 300MW from a gross wind
potential of 1700MW .Similarly the estimated biomass potential of the State stands at 300MW
.Odisha receives an average solar radiation of 5.5 kWh/sqr. mtr. area with an average CUF
6757
2145
6425
100 4221177
254 449
0
2000
4000
6000
8000
(In
MW
)

Odisha Profile 2018
103
(Capacity Utilisation Factor) ranging from 15-17% across the Districts and around 300 clear
sunny days every year. The State is endowed with a potential of solar energy (solar PV power)
of 14,000MW, while the feasible potential for power generation in the Solar Photovoltaic (PV)
and the Solar thermal routes have been roughly estimated as 8000 MW and 2000 MW
respectively.
According to the 2011 Census, 43% of Odisha’s households use electricity for lighting
,36% in the rural areas and 84% in urban areas respectively. Nearly 90% of rural households in
Odisha use firewood, crop residue and dung cake for cooking. According to the 2011 census
data, firewood is a major cooking fuel in Odisha. In rural areas, over 70% of households use
firewood. In urban areas too, over 35% urban households use firewood for cooking. Crop
residue and cow dung cake are the next largest cooking fuels in rural households at 12% and
11% respectively. While, LPG is the main fuel source for 46% of urban households, only 10%
of rural households in Odisha use LPG as cooking fuel.
Items Indicators Value
Installed Capacity in
MW, 2015-16 Total Installed Capacity 5,810.82
Generation of Electricity
in MW,2017-18
Total Generation 5,737
State Hydel 1,864
State Thermal 880
State Independent Power Producers 1,386
Central allocation 1,467
Renewable Energy 140
Availability of Power in
MW, 2015-16
Total Available 2,998
State sector 1,674
Central sector 1,205
Captive Power Plant & others (45+74) 119
Sold to other States 45
Power available as percentage of installed capacity (in %) 51.59
Availability and demand
of power in MW as on
November,2018
Total Demand estimated 3,062
Peak Demand 4,000
Peak Met 3,600
Consumption in MU,
2017-18
Total Consumption 17,729
Domestic 6,757 (38.09)
Commercial 2,145 (12.10)
Industrial 6,425 (36.25))
Public Lighting 100 (0.56)
Irrigation & Agriculture 422 (2.38)
Public Water works 254 (1.44)
Railways 1,177 ( 6.65)
Bulk Supply & Others 449 (2.54)

Odisha Profile 2018
104
Items Indicators Value
Consumers in numbers
as on 2017-18
Total Consumers
Rural 50,61,858
Urban 3,54,472
Domestic Consumer 63,07,401
Rural 48,94,361
Urban 14,13,040
Commercial Consumer 3,54,025
Rural 1,60,117
Urban 1,93,908
Industrial Consumer 26,644
Rural 7,380
Urban 19,264
Renewable Energy, 2018
Village Electrified by all sources in number as on 31.03.2018 45,893
% of Village electrified from all sources as on 31.03.2018 96.26
Wind Power Potential (MW) procured by GRIDCO 910.35
Biomass Power Potential (MW) in 2017-18 (states share in
installed capacity) 20.0
Number of Domestic Biogas Plants: 531
Number of Remote Villages Electrified through solar power
plant 435
Number of villages electrified under TEDCOL 84
Number of villages electrified under DDG 377
Number of villages electrified Renew Energy 461
Number of Solar lanterns distributed 9,417
Number of Solar Water Pumping System 1,483
Number of Solar Street light System 2,144
Number of Home light system 407
On-grid Biomass Power plants installed (MW) 50.4
Captive biomass power plants installed (MW) 3.145
Roof Top Solar Power Plants
Total number of Power plants installed 496
Total Capacity (KWP) 1,050
Number of On-grid Solar Power Plants installed 6
Total Capacity (MW) 1.8
Petroleum & Natural
Gas, 2017-18 in million
tonnes
Total Traffic Handled by Paradeep Port 102.01
POL Traffic Handled by Paradeep Port 33.78
POL as Percentage share to total traffic at the port 33.11
Crude oil Processed at Paradeep Oil Refinery (in TMT) 12,730
Petroleum refining capacity of Paradeep Oil Refinery
(in MMPTA) 15.000

Odisha Profile 2018
105
Items Indicators Value
Number of Superior
Kerosene Oil (Sko)/
Light Diesel Oil (LDO)
Dealerships as on
31.03.2018
Company-wise Superior Kerosene Oil (SKO)/ Light Diesel
Oil (LDO) Dealerships
Indian Oil Corporation Ltd (IOCL). (Number) 105
Hindustan Petroleum Corporation Ltd. (HPCL) (Number) 47
Bharat Petroleum Corporation Ltd (BPCL) (Number) 25
Total Number of Dealers 177
Number of Lpg
Distributors
As on 31.03.2018
Indian Oil Corporation Ltd (IOCL). 328
Hindustan Petroleum Corporation Ltd. (HPCL) 233
Bharat Petroleum Corporation Ltd (BPCL) 192
Total LPG Distributors 753
Number of Retail
Outlets as on 31.03.2018
Indian Oil Corporation Ltd (IOCL). 789
Hindustan Petroleum Corporation Ltd. (HPCL) 333
Bharat Petroleum Corporation Ltd (BPCL) 432
Others 127
Total Outlets 1,681
Number of Active LPG
Domestic Consumers as
on 31.03.2018
Indian Oil Corporation Ltd (IOCL). 23,05,813
Hindustan Petroleum Corporation Ltd. (HPCL) 21,65,108
Bharat Petroleum Corporation Ltd (BPCL) 14,57,444
Total number of Consumers 59,28,385
LPG Consumers under
PMUY on 01.01.2019 (P)
Number of LPG Consumers under Prime Minister Ujjala
Yojana (PMUY) as
3,56,057
PDS SKO Kerosene
2017-18 (P)(in Kl)
Number of PDS SKO allocation 2,48,448
Number of PDS SKO Kerosene Uplifitment 2,44,343
Consumption of Major
Petroleum Products
2017-18 (P) in ‘000
tonnes
Liquefied Petroleum Gas (LPG) in ‘000 Tonnes 1,128
Motor Spirit (MS) 704
Superior Kerosene Oil (SKO) 190
Aviation Turbine Fuel (ATF) 77
High Speed Diesel (HSD) 2,506
Light Diesel Oil (LDO) 26
Furnace Oil (FO) 767
Lubes & Greases 24
Bitumen 116
Others 730
Total 4,972
PRICES, 2017-18 (P) (Rs. in Crore)
Per Capita Sales of Petroleum Products as on in Kg 135.2
Sales Tax / SGST/Payments on POL Products 6,926
Sales Tax / SGST/Payments on POL Products by Central
Public Sector Enterprise (CPSE) 6,737
Source: Economic Survey Odisha,2017-18 OREDA, Bhubaneswar
Ministry of Petroleum & Natural Gas, Govt. of India

Odisha Profile 2018
106
Labour & Employment
Labour is considered as a primary factor of production. Labour force is important for
maintaining a sound level of economic activity in any country as it is a productive factor and it
activates other factors of production for their increasing use in the production system of the
country. Thus the size of labour force existing in a country is playing an important role in
determining the level of its economic activity. The size of the labour force is determined by the
number of persons in the age group 15-59. The structure of the labour market, patterns of
employment growth, and labour-market institutions play an important role in shaping
development patterns and outcomes
Employment structure of an economy is the normal instrument that can cause a change
in inequality either way, i.e. an increase or a decrease in the inequality. Accelerating growth
and expanding employment opportunities are the goals of economic policy. To provide
productive employment for the continuing increase in the labour force is an integral part of
ourobjective of inclusive growth.
Population and Potential Labour Force in Odisha 2001 2011
Population (lakh) 368.04 419.74
Labour force (15 – 59 years) (lakh) 215 257.9
Total Workers (lakh) 142.8 175.4
Workers(15 – 59 years) (lakh) 126.77 156.46
Labour force as % to total population 58.42 61.44
Workers as % to total population 38.8 41.79
% of Total workers to labour force 66.42 68.01
% of Workers (15-59 years) to labour force 58.96 60.67
Total Non-Worker 225.28 244.33
Total Non-workers(15-59 years) 88.19 101.48
% of non-workers to labour force (15-59 years) 41.02 39.35
Labour Force indicates the supply of labour in the country and is an important input for
production of goods & services in the country. The population in labour force (15-59 years) of
the State went up by 2 percent per annum from 215.0 lakh in 2001 to 257.9 lakh in
2011.Consequently, its share in total population improved from 58.42 to 61.44 percent in
Odisha. Between these two Censuses, the total number of workers in the State increased by 2.3
percent annually from 142.8 lakh to 175.4 lakh.Share of the total members of workers in total
labour force, also, had witnessed an increase from 66.4 percent to 68.00 percent and share of
the total members of workers in the age group 15-59 years in total labour force has increased
from 58.96 percent to 60.67 percent. The workers have registered a growth of 22.83 percent
which is higher than the overall population growth rate of 14.05 percent during the decade. As
a result, the proportion of persons in the age group of 15-59 years who are not working in the
State decreased from 41.02 percent to 39.35 percent.

Odisha Profile 2018
107
The working population in Odisha increased from 142.0 lakh in 2001 Census to 175.4
lakh in 2011 Census witnessing an annual compound growth rate of 2.31percent. The Work
Participation Rate (WPR) i.e., the proportion of workers to total population in Odisha edged up
from 38.8 percent in 2001 to 41.8 percent in 2011.The ratio at the All India level during the
corresponding period was at 39.1 percent and 39.8 percent respectively. Going by sex, the work
participation rate in the case of males was significantly higher than that of females both in rural
and urban areas. The pace of increase in WPR of males also was greater than that of females.
The overall WPR of males increased from 52.5 percent in 2001 to 56.1 percent in 2011 in
Odisha. The WPR of females improved from 24.7 percent to 27.2 percent.
The total number of workers as per 2011 Census in the State was 175.4 lakh comprising
107.07 lakh main workers and 68.3 lakh marginal workers. As between rural and urban
segments ,the proportion of main workers to total workers was higher in the latter as compared
to that of former. The Census 2011 further classifies the workers (both main and marginal) into
four industry groups viz., cultivators, agricultural labourers, household industries and other
workers. The four-fold classification revealed that there was a declining share of the cultivators
and household industry workers. The proportion of cultivators to total workers came down from
29.75 percent in 2001 to 23.4 percent in 2011.The share of agricultural labourers increased from
35.02 percent to 38.4 percent. The proportion of household industry workers fell from 4.91
percent to 4.5 percent. Contrary to this, the share of other workers moved up from 30.32 percent
to 33.7 percent.
Labour Bureau, Chandigarh has been organizing survey on employment on annual basis
since 2010-11. The Labour Force Participation Rate (LFPR) indicates the proportion of a
country’s working-age population (15 years and above) engaged actively in the labour market,
either by working or looking/ searching for work. LFPR based on Usual Principal & Subsidiary
Status approach was estimated at 52.4 percent in Odisha during 2015-16. The gender wise
estimates show that 75.5 percent of males and 27.4 percent of females were either working or
looking for work. The female participation was quite low compared to male counterparts in the
State. It may be observed that the LFPR in rural sector was 55.8 percent, whereas it was 43.7
percent in urban areas. The major reason for lower LFPR in urban area is the female
participation rate, which was 16.6 percent only, while it was 38.7 percent in rural area.
The second important parameter of labour force is the Worker Population Ratio (WPR).
The WPR signifies the proportion of workers/ employed persons in the total population for the
specific age group. The Worker Population Ratio (WPR) was estimated to be 50.5percent for
Odisha during 2015-16 based on Usual Principal & Subsidiary Status approach. According to

Odisha Profile 2018
108
the Usual Principal & Subsidiary Status of the Survey, the unemployment rate in rural areas at
34 per 1000 persons was lower than that of urban areas at 44 per 1000 persons at State level.
Unemployment rate is the third important parameter of labour force. Unemployment Rate (UR)
is the ratio of number of unemployed persons/person-days to the number of persons/person-
days in labour force. The unemployment rate was estimated to be 3.7 per cent at the State level
under the UPsS approach. In rural sector, unemployment rate was 3.4 per cent whereas in urban
sector, the unemployment rate was 4.4 per cent. The unemployment rate was significantly
higher among females as compared to males.
Child Labour (5-14 years) in Odisha
2001 2011
Total Worker 3,77,594 3,34,416
Male 1,83,270 1,71,764
Female 1,94,324 1,62,652
Main Worker 1,09,760 92,087
Male 69,401 56,325
Female 40,359 35,762
Marginal Worker 2,67,834 2,42,329
Male 1,13,869 1,15,439
Female 1,53,965 1,26,890
% of Main worker to total worker 29.07 27.54
% of Marginal worker to total worker 70.93 72.46
The economic rationale of child labour is the contribution it makes to household income
and lack of consciousness in the case of poor households. In such a situation, it becomes
important to know the nature of work in which a child labourer is engaged and how hazardous
it is. Most children work in the informal sector, without legal or regulatory protection. There
are 70 per cent working children in agriculture production, commercial hunting and fishing or
forestry, there are 8 per cent in manufacturing and 7 per cent in community, social and personal
service such as domestic work (ILO – IPEC, 2004).Although the participation of girls in child
labour and hazardous work is on a par with that of boys in the youngest age groups (5-11 years),
boys predominate considerably at older ages in both categories.
In Odisha the percentage of child labour has decreased up to 36% in the 1991 census in
comparison to 1981 and 17% decreased in 2001 in comparison to 1991 and decreased 13% in
2011 in comparison to 2001 census. In census 2011 out of the total population, aged 5-14 years,
3.34 lakhs (3.97) are Workers and 80.89 lakhs (96.02%)are Non-Workers. Amongst the total
work force, 0.92 lakhs (27.54 %) are Main Workers and 2.42 lakhs (72.46 %) are Marginal
Workers. The share of workers, aged 5-14 years in the total work force of the State works out
to be 1.09 %.

Odisha Profile 2018
109
Items Indicators Value
LABOUR FORCE ,
2011 Census
(in Persons)
Total Workers (Main &Marginal) 1,75,41,589
Male 1,19,02,655
Female 56,38,934
Cultivators 41,03,989
Male 33,75,350
Female 7,28,639
Agricultural labourers 67,39,993
Male 34,81,836
Female 32,58,157
HHI workers 7,83,080
Male 4,39,215
Female 3,43,865
Other workers 59,14,527
Male 46,06,254
Female 13,08,273
Total Workers (Main) 1,07,07,543
Male 87,94,413
Female 19,13,130
Cultivators (Main) 32,79,769
Agricultural labourers (Main) 24,20,540
HHI workers (Main) 4,41,486
Other workers (Main) 45,65,748
Total Workers (Marginal) 68,34,046
Male 31,08,242
Female 37,25,804
Cultivators (Marginal) 8,24,220
Agricultural labourers (Marginal) 43,19,453
HHI workers (Marginal) 3,41,594
Other workers (Marginal) 13,48,779
Marginal Workers Seeking/available for work 37,25,906
Male 20,25,159
Female 17,00,747
Non-workers 2,44,32,629
Male 93,09,481
Female 1,51,23,148

Odisha Profile 2018
110
Items Indicators Value
Workers by Age ,
2011 Census
Number of Child Workers(5-14) 3,34,416
Number of Adolescent Workers (10-19) 14,97,990
Number of Youth Workers(15-24) 31,85,556
Number of Economically Active Workers (15-59) 1,56,46,025
Work Participation Rate,
2011 Census
Total work participation rate (in %) 41.79
Percentage of total Male population 56.11
Percentage of total Female 27.16
Percentage of Rural population 43.2
Percentage of rural male population 56.5
Percentage of rural female population 29.7
Percentage of Urban population 34.81
Percentage of urban male population 54.08
Percentage of urban female population 14.1
Workers by Education,
2011 Census
Number of Literate 1,17,77,717
Number of Literate but below matric/secondary 78,34,181
Number of Matric/secondary but below graduate 22,73,001
Number of Technical diploma or certificate not equal to
degree 96,572
Number of Graduate and above other than technical degree 9,04,444
Number of Technical degree or diploma equal to degree or
post-graduate degree 1,92,636
Employment
as on 31.12.2016
Number of Employment Exchange in 2013 40
Number of Live Register 9,65,269
Number of Registration 1,65,252
Number of Placement made 770
Number of Women Placement 140
Live Registration Position,
2016 (In ‘000 Numbers)
Total number of Applicants 965
Number of Educated Job seekers) 932
Below Matric 33
Matriculate & under graduate 567
Graduate and Post Graduate (General ) 162
Graduate and Post Graduate (Technical) 19
Other Diploma holders 184
Employment in Organised
Sector , 2015
Number of Total Employment 5,93,099
Number of Public Sector 4,89,117
Number of Private Sector 1,03,982
Number of Women Employment Total 97,939
Number of Public Sector 87,696
Number of Private Sector 10,243
% of Total Employment 17
Source: Census of India,2011

Odisha Profile 2018
111
Items Indicators Value
Child Labour , 2011
Total
Total number of Population (5-14 Years) 84,23,393
Number of Male 42,88,874
Number of Female 41,34,519
Total number of Workers (5-14 Years) 3,34,416
Total number of Male 1,71,764
Total number of Female 1,62,652
% of Child Labour (5-14 Years) 3.97
% of Male 4
% of Female 3.93
Rural
Total number of rural Population (5-14 Years) 72,00,338
Total number of rural Male 36,55,059
Total number of rural Female 35,45,279
Total Workers (5-14 Years) 3,03,042
Total number of Male 1,52,978
Total number of Female 1,50,064
% of Child Labour (5-14 Years) 4.21
% of male child worker 4.19
% of rural Female child worker 4.23
Urban
Total number of Population (5-14 Years) 12,23,055
Number of Male 6,33,815
Number of Female 5,89,240
Total number of Workers (5-14 Years) 31,374
Number of Male 18,786
Number of Female 12,588
% of Child Labour 5-14 Years) 3.19
% of Male 2.96
% of Female 2.14

Odisha Profile 2018
112
Items Indicators Value
Labour Force
Parameters (per 1000)
for persons aged 15
years & above
according to Usual
Principal &
Subsidiary Status
Approach (ps+ss ) in
2015-16 per ‘000
persons
Labour Force Participation Rate
Total Person 532
Male 789
Female 254
Transgender 572
Total Person (Rural) 547
Male 800
Female 274
Transgender 570
Total Person (Urban) 447
Male 729
Female 142
Transgender 604
Worker Population Ratio
Total Person 512
Male 766
Female 237
Transgender 572
Total Person (Rural) 527
Male 777
Female 256
Transgender 570
Total Person (Urban) 427
Male 703
Female 129
Transgender 604
Unemployment Rate
Total Person 38
Male 29
Female 66
Transgender -
Total Person (Rural) 37
Male 28
Female 64
Transgender -
Total Person (Urban) 44
Male 35
Female 94
Transgender -
Proportion Unemployed
Total Person (%) 20
Male (%) 23
Female (%) 17
Transgender (%) -
Total Person (Rural) (%) 20
Male (%) 23
Female (%) 17
Transgender (%) -
Total Person (Urban) (%) 20
Male (%) 26
Female (%) 13
Source: Annual Employment & Unemployment Report, Labour Bureau, Shimla ,2015-16
Directorate of Employment ,Odisha

Odisha Profile 2018
113
Items Indicators Value
Per 1000 distribution
for persons aged
15 years & above by
main activity &
educational
classification according
to Usual Principal
Status Approach (ps)
2015-16
Employed
Not literate 389
Below Primary 433
Primary 519
Middle 527
Secondary 418
Higher secondary 353
Certificate course at undergraduate level 246
Diploma/ certificate 625
Graduate 629
Post graduate & above 713
Overall 469
Unemployed
Not literate 1
Below Primary 8
Primary 16
Middle 21
Secondary 27
Higher secondary 40
Certificate course at undergraduate level 46
Diploma/ certificate 66
Graduate 110
Post graduate & above 83
Overall 25
Not in labour force
Not literate 611
Below Primary 559
Primary 464
Middle 452
Secondary 555
Higher secondary 607
Certificate course at undergraduate level 708
Diploma/ certificate 309
Graduate 261
Post graduate & above 204
Overall 506
Source: Annual Employment & Unemployment Report, Labour Bureau, Shimla , Directorate of Employment ,Odisha

Chapter Six
Transport
Tourism
Banks

Odisha Profile 2018
114
Transport
Transport is a crucial component of
infrastructure. It includes all major mode of
transport like road transport, railways, airways,
and water transport. An efficient and vibrant
transport System in a State is the most essential
ingredient for the long-term socio-economic and
cultural prosperities. It has direct bearing on the
quality of the live of the people. The alternate
modes of transport viz. roadways, railways, waterways, airways etc., each contribute to the
transportation requirements of the economy. Odisha enjoys robust transportation network via
roadways, railways & airways and the State is well connected by rail, road and air with the rest
of the county. Roads & Rail dominate the transportation sys-tem in the State. The Present
transport system has rec-order a substantial growth over the years, both in the aspects of
network and output.
The sub sector accounts for a share of 7.34 per cent in State’s Gross State Domestic
Product (GSDP) during 2016-17 reflecting its significance with an impressive annual average
growth rate of 13.71percent per annum in last five years. Road transport has emerged as the
domi-nant segment in State’s transportation sector with a share of 3.54 per cent in State’s GSDP
and an annual average growth rate of 12.27 percent per annum in last five years in comparison
to railways that had a 1.27 per cent share of GSDP in 2016-17 with an annual average growth
rate of 20.17 percent per annum in last five years. Transport by other means contributed 4.14
percent of GSDP with a growth rate of 12.00 percent for the same period to the State.
Road transport is the dominant mode of transport in In-dia both in terms of share in
goods and passenger traffic and in terms of contribution to the national economy. It is a key
factor to social, regional, and economic cohesion, including the development of rural areas.
Easy accessibility, flexibility of operation, door-to-door service and reliability have earned road
transport an increasingly higher share of both passenger and freight traffic vis-à-vis other modes
of transport. In absence of adequate rail network in Odisha, roads are crucial in providing
connectivity to all habitation. To meet the demand for road transport, the number of vehicles
and the length of road network have increased over the years. By end of 2015-16 the State has
a total road network of 254845.32 kms which consists of National highways, State highways,
Express Highway Major District Roads, Other District Roads & village roads. Road density
which is defined as the total road length of all roads per 100 square kilometres of area is a
measure of extent of road network in a region. In Odisha the road density was 163.67 kms in

Odisha Profile 2018
115
2015-16 while there was 568.53 kms of road per one lakh population as against 2.49 kms road
density and 123 kms of road length per lakh population in 1991 in the State.
National Highways are the arterial roads of
the country for inter-state movements of
passengers and goods. They criss-cross the length
and breadth of the country connect-ing the National
and State capitals, major ports and rail junctions
and link up with border roads. In Odisha Nation-al
highway constitute only about 2 percent of the road
network of the State.41 number of NH traverse
through the State with a total length of 4855.51 kms. The length of State highways is 4148.00
kms.
Sustained economic growth have led to rapidly increasing motorized vehicles in the
State. The total number of registered motor vehicles increased from about 21.48 lakh in March,
2007 to 58.41 lakh up to the period 31st March, 2016 and grew at a Compound Annual Growth
Rate (CAGR) of 12% between 2006 and 2016. Similarly the total number of vehicles on road
increased from about 18.85 lakh in March, 2007 to 54.91 lakh up to the period 31st March,
2016 and grew at a Compound Annual Growth Rate (CAGR) of 13% between 2006 and 2016.
Road safety emerged as an area of concern with increase in road network and number of
vehicles. The increase in personalized means of transport and decline in share of public
transport have significant implications on traffic congestion and safety. During 2015-16 as
many 10532 road accidents are recorded claiming 4463 lives with a .fatality rate of 42.38 deaths
per 100 accidents. The proportion of fatal accidents in total road accidents is 38.32% during
2016.
Odisha State Road Transport Corporation functions to provide safe and dependable
transport facilities to the public in the State. During 2015-16, the Corporation had 371 buses on
road with an average fleet strength of 459 and regular staff strength of 570 with a bus staff ratio
of 1:3.48. As per the efficiency measures of NITI Aayog Vehicle productivity in case of
OSRTC for 2015-16 is Rs.26.71, staff productivity is 159 and Bus-Staff ratio is 1:3.48 whereas
Fuel efficiency is 4.70 km. per litre and fleet utilization is 81 percent
Odisha is served by three Zonal Railways of Indian Rail-ways, namely East Coast
Railway (ECoR)/Bhubaneswar, South Eastern Railway (SER)/ Kolkata and South East Central
Railway (SECR)/Bilaspur. The major area of Odisha lies under East Coast Railway (ECoR)
with headquarters at Bhubaneswar and some under South Eastern Railway and South East

Odisha Profile 2018
116
Central Railway. By end of 2015-16 the State the
total length of railway route & track was 2572.00
and 3357.25 kilometres respectively. Railway
routes pass through twenty three districts of the
State. The railway route length of the State per 1000
sq. kms i.e. the rail density is 17.52 as against the
national rail density of about 20 kms .
Paradeep port is the only major port in Odisha and the first major port in Odisha and the
first major port on the East Coast commissioned in independent India. The port is situated 210
nautical miles south of Kolkata and 260 nautical miles north of Visakhapatnam at latitude
20°15” 58.63’ N and longitude 86°40” 27.34’ on the East coast. It has an artificial type lagoon
of 500 meters length, 160 meters width and one turning circle of 520 meters diameter. The port
is equipped with 15 berths, three single point moorings and one Ro-Ro jetty for handling various
cargoes. The port has 126.94 million tons of cargo handling capacity as on 31st March
2016.During 2016-17, 88.95 million tons of cargo (53.88 million tons of import and 35.07
million tons of export) was handled through this port with an average of 4.75 hours pre-berthing
detention, 2.15 days turn-around time and 21139 MT ship berth-day output. POL and thermal
coal together constituted 78.00 percent of the total cargo handled through this port during 2015-
16.Paradeep Port Trust handled 76.39 million tons of cargo, the 2nd highest position of cargo
traffic among major states for last 3 years. With 480 kms of coast lines, Odisha has 13potential
sites for minor ports development. Inland Water Transport has vast potential but less network
in Odisha.
Air transportation in Odisha is a fast catching trend .The State has only one international
airport at Bhubaneswar known as Biju Patnaik International Airport, though there are a number
of others private airstrips and helipads. There are 19 airstrips across 15 districts of which 12 are
owned by Government of Odisha. There are sixteen helipads in Odisha
During 2015-16, there were 8,169 post offices in Odisha comprising 35 Head Office,
1,166 Sub post Offices and 6968 Gramin Dak Sewak Post Office. Among these, 7,573 (93%)
are in rural areas. On an average, a Post Office serves an area of 19.06 square km, and a
population of 5560 people in the State where as in India on an average, a Post Office serves an
area of 21.22 Sq. Km and a population of 8221 people. As on March 2016, 44 ATMs have been
installed in post offices of Odisha circle for core banking.
The telecommunication network has vastly expanded over the years in the State. There
were 2.93 crore telephone subscribers in the State, which is about 2.77 percent of total telephone

Odisha Profile 2018
117
subscribers in the country. Out of total 2.93 crore subscribers, 98.96 percent were wireless
subscribers and the balance 1.04 percent were wire line subscribers. The overall tele-density
(i.e. number of tele-phone connections per 100 population) of the State is 77.38 with a wide
gap between rural (52.87) and urban (189.98) tele density as on end of 2016.
Items Indicators Value
ROADS, 2017-18
(in Kms.)
Total Road Length 2,54,845.32
National Highway -Total (16-17) 4,855.70
State Highway -Total 4,099.15
Express Highway- Total 38.40
Major District Road - Total 2,815.94
Other District Road -Total 15,061.12
Urban Roads (16-17) 19,915.01
Rural Roads Total ( 17-18 42,446.98
Total Surfaced 38,324.07
Surfaced Water Bound Macadam (WBM) 996.10
Bituminous Road (BT)/Cement Concrete (CC) 37,327.97
Unsurfaced( Motorable) 4,122.90
G.P/P. S. Roads Inter Village Road (16-17) 92,043.62
Intra Village Road 68,980.56
Total 1,62,476.45
Forest Roads 7,474.98
GRIDCO Roads 88
Irrigation Roads 6,277
Length of road per 100sq. km. 163.67
Length of road per Lakh population 568.53
Length of NH per Sq. Kms 32.06
Length of NH per Lakh population 10.69
REGISTERED
MOTOR VEHICLE
as on 31.03.2018
(in numbers)
Total Registered Motor vehicle 74,31,815
Two Wheelers 59,47,183
Three Wheelers 1,35,565
Car, Jeep & Taxi 5,28,711
Buses 31,714
Goods Vehicle 3,80,443
Others 3,88,199
VEHICLES ON
ROADS, 2017-18
(in numbers)
Total Vehicles on Roads 70,81,202
Two Wheelers 57,53,568
Three Wheelers 1,45,151
Car, Jeep & Taxi 4,89,184
Buses 20,906
Goods Vehicle 3,25,751
Others 3,46,642

Odisha Profile 2018
118
Items Indicators Value
ROAD ACCIDENT,
2017-18
Number of Incidence of road accident 11,262
% Share in Total Number of Road Accident in the Country 2.4
Number of Accidents Per Lakh Population 25
Number of Road Accidents per 10,000 Vehicles 20.2
Number of Road Accidents per 10,000 Km of Roads 371.6
Number of Persons killed 5,315
Fatality Rate per 1000 accidents 4,719
Number of Persons injured 11,794
Number of Grievous injuries 622
Number of Simple Injuries 5,372
Share in Total Number of Persons Killed in Road Accidents
in the country (%) 3.56
Number of Persons Killed in Road Accidents Per Lakh Popu-
lation 10.2
Number of Persons Killed in Road Accidents per 10,000 Ve-
hicles in 2015 8.2
Number of Persons Killed in Road Accidents per 10,000 Km
of Roads in 2015 151.7
Motor Vehicle
Offences , 2017-18 Number of Motor vehicle offences detected 2,33,564
Revenue Collection,
2017-18
Total Revenue Collected (Rupees in crore) 1544.59
Revenue from Motor Vehicle offences 200.00
Transportation by
Odisha State Road
Transport
Corporation, 2017-18
Number of Routes 220
Number of on Road Vehicle 371
Number of off Road Vehicle 95
Number of Passengers Transported (In lakh number) 69.64
Average fleet utilization (%) 81
Average Vehicle utilization in Kms. 242
Per Kilometer Income (Rupees in lakh) 18.17
Per Kilometer Expenditure in Rupees 23.17
Railways
Route Kilometers in Kms. as on 31.03.2016 2572
Railways Routes electrified in kilometers as on 31.03.2016 2,027(78.81%)
Running Kilometers as on 31.03.2016 2,727.503
Track Kilometer as on 31.03.2016 3,357.254
Railway route length per 1,000 sq. km. as on 31.03.2016 17.52
Number of Stations as on 31.03.2016 175
Number of Passenger Halt as on 31.03.2016 45
Total Number of Level Crossing as on 31.03.2016 635
Number of Passengers booked from the State 47.93
Passengers Earnings originated from State (Rupees in crore)
during 2016-17 273.17
Goods Traffic originated from State in million tonnes during
2016-17 128.11
Goods earnings originated from State (Rupees in crore)
during 2016-17 10,331.05

Odisha Profile 2018
119
Items Indicators Value
Airports Bhubaneswar (Biju Pattanaik Internatinal Airport) 1
Aircraft Movements ,
2015-16
Number of International aircraft movements in 2015-16 4
Number of Domestic aircraft movements in 2015-16 14,032
Passengers Carried
Number of International passengers during 2015-16 16,173
Number of Domestic passengers during 2015-16 18,78,559
Total number of passengers during 2015-16 18,94,732
Freight Movements Domestic freight in Tonnes during 2015-16 7,002
Dgca Approved
Flying Training
Organisations
Number of flying organization in 2015-16 1
Water Transport,
2015-16
Total Length of the Rivers/ Canals/ Lakes in kilometers 1,378
Navigable Length in kilometers 508
Percentage of Navigable Length to Total Length 36.87
Ports, 2015-16
Number of Major Port (Paradeep) 1
Cargo handling Capacity in million MT 126.94
Railways Traffic in lakh tonnes 485.13
Inward Traffic in lakh tonnes 246.32
Outward Traffic in lakh tonnes 238.81
Port Traffic,
2015-16
(In Million MT)
Traffic Handled at Major Port (Paradeep) in million Tonnes 76.39
Load 28.16
Foreign 0.77
Coastal 27.39
Unload 47.89
Foreign 46.35
Coastal 1.54
Container Cargo 0.12
Load 0.56
Unload 0.65
Transshipment 0.32
Commodity-wise Traffic Handled
POL & its Product 20.57
Iron Ore 2.89
Thermal Coal 31.46
Coking Coal 8.2
Ferti.& FRM (Dry) 4.36
Food grain 0
Container Cargo 0.12
TEUs (twenty foot equivalent unit) 5
Others 8.76
Number of Vessels Handled 199
Cargo Handled at Non-Major Ports 14.71
Total Cargo Handled in All Ports 91.09
Import 47.9
Export 28.49

Odisha Profile 2018
120
Items Indicators Value
Inland Water
Transport, 2015-16
Passengers moved in lakh numbers 1.64
Revenue Collected in lakh rupees 25.28
Operational
Performance
&Efficiency
Parameter, 2015-16
Average Pre berthing detention in hours 4.75
Average Turn Round Time in days 4.5
Average Ship berth - day Output in MT 21,139
POSTAL COMMUNICATION
Postal Network as on
31.03.2018
Total Number of Post Office 8,215
Number of post office (Rural) 7,615
Number of post office (Urban ) 600
Number of Head Post Office 35
Number of Sub-Post Office 1,171
Number of Gramin Dak Sewak Post Office 6,968
Classified Function-
Wise Distribution as
on 31.03.2016
Number of Branch Post Offices 7,009
Number of Post Office with full range of services 1,201
Number of Post Office without delivery 320
Number of Delivery Post Office 7,883
Panchayats Sanchar
Sewa Kendra’s,
Franchise Outlet And
Mukhya Dak Ghar
as on 31.03.2016
Number of Panchayats Sanchar Sewa Kendra 109
Number of Franchise Outlet 100
Number of Mushy Dak Ghar (MDG) 35
Letter Box, Post Box
And Post bag as on
31.03.2016
Letter Box
Total number of letter box 20,920
Number of letter box (Rural ) 2,595
Number of letter box Urban 18,325
Mail Volume , 2015-
16
Registered Mail Traffic (in ‘000 number) 5,346
Unregistered Mail Traffic (in ‘000 number) 74,323
Total Mail Traffic (in ‘000 number) 79,669
Inland Money Orders
issued, 2015-16
Total number of money orders issued in 2015-16 (in lakh
numbers) 7.4
Value (Rs. in crore) 49.96
Commission (Rs. in crore) 1.72
Indian Postal Orders
Sold, 2015-16
Postal order sole in lakh mumbers 5.24
Value (Rs. in crore) 1.47
Commission (Rs. in crore) 0.15
Accounts of Savings
Schemes, 2015-16 Total number of savings schemes in 2016-16 1,44,05,008
Outstanding Balance
of Savings, 2015-16
Total outstanding balance in savings account in 2015-
16(Rs. in cores) 10,602.11
Source: State Transport Authority, Odisha, Paradeep Port Odisha OSRT C Odisha Economic Survey Odisha 2016-17

Odisha Profile 2018
121
Items Indicators Value
Telecommunication ,
2017-18
Telephone Subscriber
Overall Telephone subscriber million number 34.62
Telephone subscriber million number Urban 12.79
Telephone subscriber million number Rural 21.83
Wireless subscriber ,
2017-18
Overall wireless subscriber in million number 34.34
Wireless subscriber in million number (Urban ) 21.77
Wireless subscriber in million number Rural ) 12.58
Wire Line subscribers,
2017-18
( in millions)
Overall Wire line subscriber in million numbers 0.28
Wire line subscriber in million numbers (Urban) 0.22
Wire line subscriber in million numbers (Rural ) 0.06
Tele density , 2017-18
(per ‘000 population)
Total Tele density
Overall 80.22
Urban 163.55
Rural 61.78
Wire line Tele density
Overall 0.64
Urban 2.57
Rural 0.18
Wireless Tele-density
Overall 79.58
Urban 160.80
Rural 61.60
Internet subscriber as
on 31st March 2018 in
million number
Total Internet Subscriber 12.18
Urban 6.51
Rural 5.67
Narrowband 3.06
Urban 1.13
Rural 1.93
Broadband 9.11
Urban 5.38
Rural 3.73
Internet Subscriber per
100 Population as on
31st March 2018
Total number of Internet Subscriber 28.22
Number of internet subscriber (Urban) 83.28
Number of internet subscriber (Rural ) 16.04
Source: Telecom Regulatory Authority of India, GOI

Odisha Profile 2018
122
Tourism
Tourism is a major engine of economic
growth and an important source of foreign exchange
earnings. It has great capacity to create large scale
employment of diverse kind – from the most
specialized to the unskilled and hence can play a
major role in creation of additional employment
opportunities. It can also play an important role in
achieving growth with equity. Over past decades,
tourism has continuously expanded and diversified,
to become one of the dominant and fastest growing economic sectors.
The State Odisha, the soul of Incredible India has tremendous potential in tourism
sector, because of its golden history, strategic geographical location, diverse demography and
profound bounties of nature. Odisha bears several temples and astounding monuments which
attracts tourists from different parts of the world. Owing to its rich and varied topography,
vibrant culture and captivating festivities, the State offers immense tourism delights to the
visitors in the State. Visitors, starting from neighbouring states to the far flung countries throng
the state at different times especially during the festivities. Filled with exquisite temples and
extraordinary monuments, home to many thousands of prolific artists and craftsmen; and
possessing beaches, wildlife sanctuaries, and natural landscape of often-enchanting beauty,
Odisha tourism is a unique and fascinating land that is, nevertheless, still largely undiscovered
by tourists.
The State is a veritable museum of India's sculptural and artistic heritage and has long
been famous to scholars and connoisseurs for the magnificent world famous Sun Temple, a
UNESCO heritage sites at Konark (12th century & the legendary 'Black Pagoda' of European
mariners), for the majestic temple of Lord Jagannath at Puri (one of the oldest pilgrimage
centres, renowned for the spectacular Rath Yatra chariot festival which attracts lakhs of
pilgrims round the year), and for the glorious temples of Bhubaneswar. This is widely popular
as .the golden triangle which draws tourists, both domestic & international in hordes
The State has made great strides in various sectors of its economy in tune with the
progressive globalization and the changing demands of the tourists to make tourism a
sustainable industry in the State. Tourism in Odisha is one of the main contributors to the
economy of Odisha and this sector contributes11% to the GSDP of Odisha. Tourism in Odisha
is one of the main contributors to the economy of Odisha. The State of Odisha secured 3rd rank

Odisha Profile 2018
123
in terms of intensity of overnight domestic tourism, with an average of 541 trips per 100
households, as compared to the all India average 418 trips per 100 households. Therefore, the
tourism intensity in Odisha is 29 percent higher than the national-level tourism intensity
(National Council of Applied Economic Research, 2015).
Tourist arrivals in Odisha
Year Domestic
Total From Odisha Outside Odisha Foreign
2013-14 60,38,746 40,25,326 67,400 1,01,31,472
2014-15 66,30,499 44,20,852 72,215 1,11,23,566
2015-16 72,40,304 48,27,391 67,364 1,21,35,059
2016-17 78,67,321 52,45,407 77,946 1,31,90,224
2017-18 85,56,603 57,04,943 1,02,995 1,43,64,541
The tourist arrival to the State has increased manifold in last decades. Domestic and
foreign tourist arrivals have been increasing continuously during last decade in Odisha. The
weather condition is an important determinant of tourist visit to India & Odisha. Since Odisha
has hot climate during April to June and rain from July to September, this period is called lean
tourism season. Peak tourism season is October to March. 1,43,64,541 tourists have visited
Odisha in 2017-18 as against 1,31,90,224 in2016-17 with a growth of 8.90% over previous
year.
A tourist profile survey was conducted during 2013-14. According to the survey it is
found that the average duration and spending of a foreign tourists is 11 days and Rs.4167/-
per day while that of the domestic tourists is 3.7 days and Rs.2763/- per day. Estimated inflow
of money on this basis to the State through tourists spending during the year 2017-18 was
Rs.15,051.82 crore
Hotels are one of the significant elements of tourism sector as it provides
accommodation to the travellers. Hotel industry has considerable contribution in overall
tourism sector through their qualitative service delivery and modern amenities. So the growth
of tourism depends on the development of hotel industry.
The Trade and Hotel industry sector has been growing consistently since 1950-51 in
Odisha. In order to meet the growing demand of tourists for accommodation, Government of
Odisha accorded industrial status to the hotel sector so as to attract investors to increase the
capacity of hotel rooms and beds at tourist centres. The share of Hotel & Restaurant industry in
the GSDP increased from 4.85% in 1950-51 to 10.35% in 2017-18 in real terms. In 2017 there

Odisha Profile 2018
124
are 1864 number of hotels including low, medium and high segment category, operating at
different places in Odisha with a total 38558 rooms and 77024 beds. Out of this, 315 catered
to high-spending groups (HSG), 418to middle-spending groups (MSG) and 1131 to lower-
spending groups (LSG). It is observed that the number of HSG and MSG hotels in Odisha is
increasing rapidly during the last four years while the number of LSG hotels are in a declining
trend. Many popular brands of hotels evolved remarkably throughout the State. Exclusively in
the capital city of Bhubaneswar, many premium segment hotels like The Trident, Swosti Group,
and Mayfair group developed to serve elite class of customers.
HOTEL POSITION IN ODISHA
Odisha Tourism policy 2017 envisages an aggressive, dynamic and long term approach
to achieve the growth potential in tourism by initiating identified policy measures, framing the
required statutory framework, ensuring large scale investment support through professional
management and private participation, and focused intervention for improvement of value and
quality in tourism sector.
0
200
400
600
800
1000
1200
1400
1600
1800
2000
2011 2012 2013 2014 2015 2016 2017
Number of Hotels in Odisha
HSG MSG LSG Total

Odisha Profile 2018
125
Items Indicators Value
Tourist Centres as
on 31.03.2017 Number of Identified Tourist Centres 357
Number of Tourist
visit in Odisha
(Composition Wise)
2017-18
(in number)
Number of Domestic Tourists 1,42,61,546
From Odisha 85,56,603
From Outside Odisha 57,04,943
Foreign Tourists 1,02,995
Total number of Tourists 1,43,64,541
Season Wise
number of Tourists
in 2017
Peak season
Total Tourists 77,72,930
Domestic Tourists 77,26,692
Foreign Tourists 46,238
Lean season
Total Tourists 51,46,330
Domestic Tourists 51,16,207
Foreign Tourists 30,123
Odisha Share in National tourist arrival (%) 0.99
Mode of Arrival in
2017 (In number)
By Air
Total Tourists 11,03,502
Foreign Tourists 16,748(16.48)
Domestic Tourists 1,086.754(7.76%)
Departure of Tourist from Bhubaneswar Airport
Total Tourists 10,31,693
Foreign Tourists 16,624
Domestic Tourists 10,15,069
Inflow of Money
Through Tourist
Expenditure in
2017 (Rupees In
Crore)
Total Tourists 14,782.25
Domestic Tourists 14,323.82
Foreign Tourists 458.43
Average Duration
Of Stay Of Tourists
In 2014-15 (in days)
Domestic Tourists
Total 3.7
Lean 3.4
Peak 4.0
Foreign Tourists
Total 11.0
Lean 15.0
Peak 7.0
Average Rupees
Spend (per day per
tourist) , 2014-15
Domestic Tourists 2,763-
Foreign Tourists 4,147/-
Foreign Tourists in
2014-15 (%)
Accommodation 60
Food & Beverage 15
Shopping 16
Transport & Sightseeing 9
Domestic Tourists
in 2014-15 (%)
Accommodation 40
Food & Beverage 19
Shopping 24
Transport & Sightseeing 17

Odisha Profile 2018
126
Items Indicators Value
Availability of
Hotel 2017
(in number)
Number of High Spending Group (HSG) Hotels 281
Number of Middle Spending Group(MSG) Hotels 435
Number of Low Spending Group (LSG) Hotels 1,142
Total number of Hotels 1,858
Availability of
Rooms, 2017
(in numbers)
Number of High Spending Group (HSG) Hotels 13,625
Number of Middle Spending Group(MSG) Hotels 9,079
Number of Low Spending Group (LSG) Hotels 14,970
Total number of Hotels 38,765
Availability of
beds , 2017
Number of High Spending Group (HSG) Hotels 28,406
Number of Middle Spending Group(MSG) Hotels 18,321
Number of Low Spending Group (LSG) Hotels 77,354
Total Hotels 77,354
Average tariff
per room per
day, 2017 (In
Rupees)
High Spending Group (HSG) Hotels Rs.1,801/- and
above
Middle Spending Group(MSG) Hotels Rs 901/- to
Rs. 1,800
Low Spending Group (LSG) Hotels Upto Rs 900/
Star Hotels, 2017
Total number of Hotels 13
Total number of Rooms 878
Total number of Beds 1715
OTDC
Accommodation,
2017
Number of Accommodation units 20
Number of Rooms Availability 503
Number of Beds Availability 1,176
Tourism
Department
Accommodation,
2017
Number of Accommodation units 3
Number of Rooms Availability 10
Number of Beds Availability 17

Odisha Profile 2018
127
Banks
The banking system reflects the economic health of the
country. The strength of economy of any country basically
hinges on the strength and efficiency of the financial system,
which, in turn, depends on a sound and solvent banking system.
It is recognized that the existing banking structure in India is
elaborate and has been serving the credit and banking services’
needs of the economy. The phenomenal growth of banking
system and other financial institution in India in post
independent era has set a place for India in global economy.
Commercial banks, development financial institutions, RRBs and Co-operative Banks play a vital role
in extending institutional credit and in sustaining economic development by mobilizing deposits and
credits for development of the State. The growth of Commercial banks moved space in Odisha
particularly after the Bank Nationalization in the year 1969.It is evident from the fact that Odisha had
25 scheduled Commercial banks and 9 Regional Rural Banks with 1261 and 819 number of branches
respectively by end of 1991 as compared to a meagre number of 100 branches in 1969.
Region-wise Bank Branches in Odisha
Population Group 31st March
2013
31st March
2014
31st March
2015
31st March
2016
31st March
2017
Rural ,2055 2,335 2,543 2,685 2,745
Semi Urban 1,021 1,143 1,221 1,268 1,312
Urban 748 803 908 936 974
Total Branches 3,824 4,281 4,672 4,889 5,031
Average population served by
a branch 11,269 10,199 9,469 9,169 9,169
Average Area (sq. kms)
served by a branch 40.72 36.37 33.33 31.85 30.95
The State has an extensive network of banking and financial system with a steady increase in
the number of bank branches. With the objective to bring more and more people within the institutional
finance coverage, the banking network has been increased by opening new branches in the State. The
vast network of banking branches in Odisha helps the economy to deploy its savings more rationally
and efficiently. The number of bank branches functioning in Odisha went up from 3595 in 2011-12 to
4889 in 2015-16 (36%), the variation over March 2015 being 217. There are 43 Commercial Banks with
4546 branches. This includes, 3041 branches of 26 Public Sector Banks, 514 branches of 15 Private
Sector Banks and 2 Regional Rural Banks with their 991branches. In addition to these 343 branches of
Orissa State Cooperative Banks (OSCB) and 5 branches of OSCARD Banks were also functioning in
the State. Thus, altogether 4889 branches of different banks were functioning in the State, out of which
2685 branches in rural, 1268 branches in semi-urban and 936 in urban areas. Of the total bank branches

Odisha Profile 2018
128
in the State, Scheduled Commercial Banks, alone accounted for a larger share of 93 percent, followed
by Regional Rural Banks (7%).
Since 70% of our population lives in rural, development of rural areas is the priority. There has
been a phenomenal growth of banking services throughout the country particularly in rural areas. The
proportion of banks in rural are-as to total in Odisha had witnessed a steady upward move-ment from
54 percent in 2011-12 to 55 percent in 2015-16 which was considered to be a positive development.
Giv-en the cost of operating a bank branch in remote areas, it is more efficient to reach out to
beneficiaries through the Business Correspondent channel, and moreover they can actu-ally serve more
than one single purpose. Business Correspondent model has been proved an effective model in providing
financial and banking services at door steps. To promote financial inclusion through penetration of bank-
ing services in the rural areas, and to provide sustainable banking services in unbanked areas a phase
wise approach has been adopted to provide door step banking facilities in all the unbanked villages in
the country. In Odisha, banks have covered 39928 villages having population more than 2000 without a
bank branch of a Scheduled Commercial Bank as on March, 2016. Out of these villages, 446 are covered
through Brick & Mortar (B & M) Branches and rest by branchless modes mainly through BC mode.
Trend of Commercial Banks in Odisha
Year
Total Commercial
Banks
Average population
served by a branch
in ‘000
Average Area (sq. kms)
served by a branch
2012 3,258 13.05 47.79
2013 3,483 12.37 44.7
2014 3,938 11.09 39.54
2015 4,329 10.22 35.97
2016 4,546 9.86 34.25
2017 4,770 8.87 32.64
Population served per bank branch i.e. the
“Bank-density” is one of the parameters with which the
penetration of banking activities in the State is
measured. The population served per bank in the State
de-clined steadily. It was 9169 per bank branch in 2015-
16 as against 11830 in 2011-12.Similarly the State has a
bank for every 31.8 sq. km. area in 2015-16 as against a
bank for every 43.3 sq. km. area in 2011-12. The rural
urban divide in Odisha is also very stark with each rural
branch serving estimated 13758 people (18049 people in 2011-12) as compared to 8423 people (9758

Odisha Profile 2018
129
people in 2011-12) in urban areas during 2015-16. Given a rural area of about 152355.34 square
kilometres, this trans-lates to a bank branch on an average of every 56.74 square kilometres in the State
during 2015-16 as com-pared to a bank branch on an average of every 77.77 square kilometers in 2011-
12.
During 2017-18 the State has a commercial bank for every 32.64 sq. km. area and served about
8.87 thousand population on an average as compared to 2011-12 where the State had a commercial bank
for every 47.79 sq. km. area and served about 13.05 thousand population on an average. The banks
increased their penetration further with the total number of ATMs reaching 6767 by end of December
2019 showing a growth of 17.23% over 2014-15, (5142).
The aggregate bank deposit is one of the indices that mirror the effectiveness with which the
savings available with the public are mopped up by the financial intermediaries.
Trend in Bank Deposits in Odisha
Year Total Deposit
(Rs.in crores)
Deposit in Commercial Banks
(Rs.in crores)
2011-12 1,29,510.40 1,24,826.40
2012-13 1,46,465.20 1,40,877.40
2013- 14 1,69,642.20 1,62,948.40
2014-15 1,96,231.90 1,89,056.90
2015-16 2,18,748.70 2,10,851.20
2016-17 2,53,115.90 2,43,935.89
2017-18 2,75,511.08 2,66,327.01
The total mobilization of deposits by the banks in the State has improved from Rs. 129510.4
crore in 2011-12 to Rs275511.08 crore in 2017-18 , registering an annual growth growth of 80.62
percent and with a compound annual growth Rate (CAGR) of 13.77 percent. The increase in bank
deposit is the culmination of expansion of bank branches, increase in GSDP increase in real per capita
income, peoples’ high propensity to save, growth in saving deposits and speedy circulation of money.
The deposit per banking the State witnessed a steady growth from Rs. 36.03 crore in 2011-12 to 44.74
crore in 2015-16. The average deposit per individual is estimated atRs.48800.35 during 2015-
16againstRs. 30451.88 in 2011-12. More than 96 percent bank deposits were with commercial banks.
The per capita bank deposits in commercial banks in Odisha is estimated at Rs47038.51 during 2011-
12.

Odisha Profile 2018
130
The total bank credit is one indicator which can be used to measure to what extent the banking
sector had extended credit to the productive and needy sectors of the economy. The total advances from
the banks put together in the Odisha has improved from Rs. 93094.85 crore in 2011-12 to Rs. 163733.85
crore in 2015-16 registering an annual average growth of 14.01 percent with the share of Co-operatives
as 10865.82 crore, which account for 6.64 per cent of the total advances in the State. The credit
disbursement per bank branch in the State has increased from Rs.25.90 crore in 2011-12 to Rs.33.49
crore in 20154-16, witnessing an annual average Growth rate of 29.3 percent. The priority sector
advance registered a growth of 26.80 % with a percentage of 63.94% as against national norm of 40%.
The share of agriculture advances extended by Banks in Odisha stood at 33.51% as against the national
benchmark norms of 18 % registering an increase of 28.39% over March 2015.
Apart from the branch network and its population coverage, another major indicator of banking
development is the Credit-Deposit (CD) Ratio. Credit Deposit Ratio (CDR) displays the level of
efficiency with which the banks mop up resources from the public and then lend it to the needy
borrowers of funds for financing productive economic activities. High ratio indicates banks are
generating more credit from its deposits and vice-versa. Credit-deposit (CD) ratio, which indicates not
just the demand for loans but also banks’ liquidity position. The Credit-Deposit (CD) Ratio in the year
2015-16 is 74.85%, which has an increasing trend over the period and in the year 2014-15, it was 73.19%
.CD ratio of Commercial Banks is 72.50%, whereas CD ratio of Cooperative banks is 137.59%.

Odisha Profile 2018
131
Items Indicators Value
Number of
Branches as on
31.12.2018
Total Branches 5121
Rural Branches 2,722 (54.66% )
Semi Urban Branches 1,369(26.05%)
Urban Branches 1,030(19.29%)
Total Commercial Branches 4,775
Public Sector Banks 3,149
Private Sector Banks 637
Regional Rural Banks 689
State Cooperative Banks 338
Deposits as on
31.12.2018
Total Deposits (Rs. in crore) 2,96,785.01
Total Advances (Rs in crore) 1,56,471.61
Total Business (Deposits +Advances) (Rs. in crores) 4,88,396.26
Credit Deposit ratio (%) 64.56
Rural (%) 69.39
Semi-Urban (%) 50.26
Urban (%) 45.35
Credit Investments to Deposit Ratio (%) 66.61
Advances as on
31.12.2018
Total Priority Sector Advance (Rs. in crore) 1,02,072.38
% Priority Sector Advances to Total Advance (Benchmark - 40%)
(in %) 65.23
Agriculture Advances (Rs. in crores) 53,406.92
% Agriculture Advances to Total Advance (Benchmark - 18% )
(in %) 34.13
Of which to Small & Marginal Farmer ((Benchmark - 8% ) (in %) 15.42
MSME Advance (Rs. in cores) 38,049.24
% MSME Advance to Total Advance 24.32
Out of which, Micro Enterprises (Benchmark– 7.5 % ) (In %) 10.75
Advance to Women (Rs. in crores) 15,825.87
% of Advance to Weaker to Total Advances (Benchmark – 5% on
NBC) 10.11
Advance to minority community (Rs. in crore) 6,756.31
% of Advance to minority community to Total Advances (Norm
15 % of Priority Sector) 6.62
Advance to SC/ST (Rs. in crore) 9,150.04
% of Advance to SC/ST Total Advances 5.76
Advances to Weaker Sections (Rs. in crore) 30,143.30
% of Weaker Section Advances to PS Advances (Benchmark –
25% ) 29.53
% of NPA (Non Performing Assets) in % (Average in the
state) 7.80
Public Sector Banks (%) 9.45
Private Sector Banks (%) 0.92
RRBs (%) 25.18
Cooperative Banks (%) 6.29
Total Small Finance Bank 08c

Odisha Profile 2018
132
Items Indicators Value
ATM Installation as
on 31.12.2019
Total number of ATMs 6,767
Number of Onsite ATMs 3,468
Number of Offsite ATMs 3,299
Number of ATMs in Rural Branch 2,291
Number of ATMs in Semi-Urban Branch 2,144
Number of ATMs in Urban Branch 2,332
Roadmap for
providing banking
services in every
village having
population below
2000 as on 31.12.2018
Number of Villages allotted 45,888
Number of Villages where Banking outlet opened 45,889
(100%)
Direct Benefits
Transfer for LPG
(DBTL) Consumers
Number of Distributors 852
Number of LPG Consumers 72,82,996
Number of Aadhaar Transfer Compliant (ATC) 56,09,546
Number of Bank Transfer Compliant (BTC) 68,84,412
Number of Cash Transfer Compliant (CTC) 1,24,93,958
Overall percentage 171.55
Pradhan Mantri Jan
Dhan Yojana
(PMJDY) as on
31.12.2018
Public Sector Bank 1,09,84,992
Private Sector Bank 47,0,003
RRBS 16,35,139
No of accounts opened (up to 31.12.16) 13,09,134
Rural (lakh number) 92,71,942
Urban ( Lakh number) 38,18,192
Total deposit balance under PMJDY accounts (Rs. in crores) 3,62,687.04
No. of accounts opened with Zero balance (in lakh numbers) 19,77,935
% of Zero balance accounts to total account opened 15.11
No. of RuPay Cards issued (in lakh number) 1,01,86,292
No. RuPay Cards activated (in lakh number) 59,57,521
No. of Aadhaar seeded accounts (in lakh number) 94,52,546
Savings Bank Deposit
Accounts (BSBDA) as
on 31.12.2018
Number of Households having Basic Savings Bank Deposit
Accounts (BSBDA) 1,30,90,134
No. of (BSBD) Account With Adhaar 94,52,546
Source: 154th State Level Banker’s Committee Odisha

Odisha Profile 2018
133
Items Indicators Value
Pradhan Mantri
Mudra Yojana
(PMMY)
Total number. of Accounts 1.4.18 to 1.2.19 27,02,197
Number of Shishu Accounts 25,61,531
Number of Kishore Accounts 1,24,246
Number of Tarun Accounts 16,420
Total Disbursed amount (Rs. in crore) 6,696.84
Amount disbursed to Shishu Accounts (Rs.in crores) 1,784.19
Amount disbursed to Kishore Accounts (Rs.in crores) 1,193.11
Amount disbursed to Tarun Accounts (Rs.in crores) 16,420
Financial Institutions
Number of MFIs & NBFCs 11,14,560
Number of Public Sector Banks 94,083
Number of Private Sector Banks 13,44,982
Number of Regional Rural Banks 22,495
Number of Foreign Banks 5
Disbursed amount 1.2.19
Amount disbursed to MFIs & NBFCs (Rs. in cores) 2,867.58
Amount disbursed to Public Sector Banks (Rs. in cores) 2,083.04
Amount disbursed to Private Sector Banks (Rs. in cores) 3,941.53
Amount disbursed to Regional Rural Banks (Rs. in cores) 226.87
Amount disbursed to Foreign Banks (Rs. in cores) 0.37
Rural Self
Employment
Institutes (RSETI)
as on 31.12.2018
No. of functional RSETIs 30
No. of Youth Trained 1,09,413
Total No. of Youth Settled 71,959
Number of Youths settled with bank finance 29740
Number of Youths settled with Self finance 42,234
Number of Settlement Ratio 66
Number of Credit Linkage 47
Self Help Groups
(SHGS) Bank
Linkage as on
31.12.2018
Total number of Self Help Groups (SHGs) 111,554
Number of Public Sector 43749
Number of Private Sector 272
Number of RRBs 67,474
Number of Cooperative Bank 59
Total Disbursed amount (Rs. in lakhs) 1,04,283.75
Amount disbursed by Public Sector (Rs. in lakhs) 44277.39(65.32)
Amount disbursed by Private Sector (Rs. in lakhs) 265.92(14.47)
Amount disbursed by RRBs (Rs. in lakhs) 59677.24(125.59)
Amount disbursed by Cooperative Bank (Rs. in lakhs) 63.20(0.48)
Average loan size (Res. in lakh) 0.93
Average loan size by Public Sector (Rs. in lakh) 1.01
Average loan size by Private Sector (Rs. in lakh) 0.98
Average loan size by RRBs (Rs. in lakh) 0.88
Average loan size by Cooperative Bank (Rs. in lakh) 1.07

Odisha Profile 2018
134
Items Indicators Value
73.Recovery /
Overdue Position as
on 31.12.2018
Total Advance
Total Demand for Recovery (Rupees in crores) 40,592.73
Amount Collected (Rupees in crores) 2,755.06
% of Recovery 67.88
% of Overdue 32.12
Crop Loan
Total Demand for Recovery(Rupees in crores) 15852.49
Amount Collected (Rupees in crores) 10249.09
% of Recovery 64.65
% of Overdue 35.35
Total Agriculture advance (Rupees in crores)
Total Demand for Recovery(Rupees in crores) 19,017.09
Amount Collected (Rupees in crores) 11,979.13
% of Recovery 62.99
% of Overdue 37.01
MSME Sector Advance
Total Demand for Recovery (Rupees in crores) 7,320.41
Amount Collected (Rupees in crores) 4,757.55
% of Recovery 64.99
% of Overdue 35.01
Education loan Advance
Total Demand for Recovery (Rupees in crores) 422.62
Amount Collected (Rupees in crores) 233.99
% of Recovery 55.37
% of Overdue 44.63
Housing loan Advance
Total Demand for Recovery (Rupees in crores) 1,216.51
Amount Collected (Rupees in crores) 1,081.78
% of Recovery 88.92
% of Overdue 11.08
Other Priority Sector Advance
Total Demand for Recovery (Rupees in crores) 1,607.85
Amount Collected (Rupees in crores) 978.26
% of Recovery 60.84
% of Overdue 39.16
Total Priority Sector Advance
Total Demand for Recovery (Rupees in crores) 29,595.24
Amount Collected (Rupees in crores) 19,100.71
% of Recovery 64.54
% of Overdue 35.46
Non Priority Sector Loans
Total Demand for Recovery (Rupees in crores) 11,111.22
Amount Collected (Rupees in crores) 8,454.35
% of Recovery 76.09
% of Overdue 23.99

Chapter Seven
Food & Civil Supplies
Disaster Management
Urban Development
Slum Scenario
Excise
Election

Odisha Profile 2018
135
Food and Civil Supplies
Items Indicators Value
License Type wise
Information on Fair
Price Shop as on
25.04.2019
GP 4,043
SHG 149
WSHG 1,837
Private 6,024
Co-operative 285
Others 68
Total 12,406
Beneficiaries under
NFSA as on 25.04.2019
Priority Households :
Ration Card 74,21,363
Beneficiries 2,81,05,689
AAY Households :
Ration Card 12,63,026
Beneficiries 41,93,873
Status of Procurement
in ongoing Kharif
Season of KMS
2017-18
( As on 13.03.2018 )
Paddy Procured 35,52,543
Equvalent Rice 24,08,316
Delivery of Rice in RRC 5,08,744
Delivery of Rice in FCI 6,35,741
Total Rice Delivery 11,44,485
% of Rice Delivery 48%
Information on Aadhar
& Mobile Number
Seeding in the Ration
Card Database as on
14.03.2018
NFSA Beneficiary Count 86,70,530
Aadhar Seeding 74,90,087
% of Aadhar Seeding 92%
Mobile No. Seeding 29,49,845
% of Mobile No. Seeding 34%
No.of Ration Cards as
on 2015
Below Poverty Line (BPL) cards 36,84,472
Antyodaya Anna Yojana (AAY) cards 12,53,978
Above Poverty Line (APL) cards 40,89,652
Total 90,28,102
Annapurna (ANP) cards 63,069
Rice for Differently abled Persons (RDP) cards 1,41,657

Odisha Profile 2018
136
Items Indicators Value
State Weighted
Average of Farm
Harvest Prices of 13
Major Crops for the
year 2017-18 (in
Rs./Qtl)
Paddy_total 1,373
Wheat 1,719
Ragi 1,745
Maize 1,322
Mung 6,140
Biri 5,835
Kulthi 3,502
Mustard 4,586
Groundnut 4,090
Til 5,524
Jute 3,122
Sugarcane 283
Potato 951
Weighted Average
Wholesale Price 2017-
18 (Rupees per
Quintal)
Paddy_total 1,437
Wheat 1,740
Maize 1,381
Ragi 1,798
Mung 6,194
Biri 5,977
Kulthi 3,582
Til 5,571
Ground nut 4,142
Mustard 4,620
Jute 3,616
Patato 958
Sugarcane 287
Source: Food & Civil Supplies Department Odisha and Directorate of Economics & statistics , Odisha

Odisha Profile 2018
137
Disaster Management
Items Indicators Value
DISASTER
OCCURED in
2016-17
FLOODS/FLASH FLOODS/HEAVY RAIN
Number of Districts affected 6
Number of Population affected 15,100
Number of Human Casualty 3
Relief Camps (2016-17)
Number of Districts 2
Number of Relief Camps Opened 9
Number of Beneficiry coverd 3,816
RAINFALL ( 1st June to 30th Sept, 2016-17 )
Normal Rainfall ( In MM) 1,144.3
Actual 1,042.8
Deviation -8.90%
Crop Loss due to Drought (Kharif-2016)
Number of Districts affected 4
Number of Blocks affected 10
Number of GPs Affected 100
Number of Villages affected 505
Number of ULB affected 2
Number of Wards affected 3
Area sustained crop-loss of 33% & above (in ha) 22,658.35
Amount of Input Subsidy Released (in Rs.) 1,54,042,728
FIRE ACCIDENT ( 2016-17 )
Number of Accident occurred 4,923
Number of Villages affected 3,935
Number of Families affected 6855
Approximate value of properties lost (in Rs.) 33,58,21,691
Number of Persons died 92
Number of Cattle died 195
HEAT WAVE
Human lives lost in Sunstroke (2017) 52
LIGHTNING 2016-17
Number of Human lives lost 398
Snake-bite 542
Drawning 418
Boat Capsize 7
Source : Annual Report on Natural Calmities for the year 2016-17, SRC, Odisha

Odisha Profile 2018
138
Urban Development Items Indicators Value
Number of Statutory Towns in 2011 107
Number of Census towns in 2011 116
Number of Urban Population in 2011 70,03,656
Males 36,25,933
Females 33,77,723
Number of Scheduled Caste in 2011 9,69,821
Number of Scheduled Tribe in 2011 5,95,789
Number of Child Population in 2011 7,47,324
Males 3,90,665
Females 3,56,659
Urban Sex Ratio in 2011 932
Transportation
Total House Holds 15,17,073
Bicycle (%) 66.3
Scooter / Motorcycle / Moped (%) 39.7
Car / Jeep / Van (%) 6.4
Level of Urbanization
in 2011
Level of Urbanization (%) 16.69
Annual Exponential Growth Rate 2.39
Number of Urban Agglomerations 14
Number of Recognized Slums population 8,12,737
Number of Identified Slums population 7,47,566
Number of Total slum population 15,60,303
% of Slum Population in Total Population of State 3.72
% of Slum Population in Urban Population of State 22.28
State share of Slum Population to Total Slum Population of
India 2.4
Drinking Water
Total House Holds 15,17,073
Tap Water (%) 48.0
Well Water (%) 18.4
Hand Pump / Tubewell Water (%) 31.7
Other Source of Water (%) 1.9
Latrine Facility
Total House Holds 15,17,073
Water closet (%) 56.5
Pit latrine (%) 4.2
Other latrine (%) 4.1
No latrine (%) 35.2
Source Of Lighting
Total House Holds 15,17,073
Electricity (%) 83.1
Kerosene (%) 15.3
Other Source (%) 0.4
No Lighting (%) 1.2

Odisha Profile 2018
139
Slum Scenario
Items Indicators Value
Slum Population,
2011
Total Number of Households 3,50,032
Number of Total Population 15,60,303
Number of Male 8,00,963
Number of Female 7,59,340
Number of Scheduled Caste population 3,21,167
Number of Scheduled Tribe population 1,99,836
Number of Child Population 1,88,962
Number of Male child 97,551
Number of Female child 91,411
% of Child Slum Population in the Total Slum Population 12
Slum Sex Ratio 948
Child slum sex Ratio 937
Literacy Rate
2011
Total number of Literates persons 10,82,646
Number of Male literates 6,02,223
Number of Female literates 4,80,423
Total Literacy Rate 78.9
Male Literacy Rate 85.6
Female Literacy Rate 71.9
Gender differential 13.7
Work Force,
2011
Total number of Worker 5,64,972
Number of Male worker 43,99,34
Number of Female worker 1,25,038
Number of Main Worker 4,79,367
Number of Marginal Worker 85,605
House Hold
Basic Amenities ,
2011
Drainage Connectivity
Number of Closed Drainage 32,821
Number of Open Drainage 1,28,589
No Drainage 1,88,896
Latrine Facility
Within Premises (numbers) 1,68,666
Number of Public Latrine 12,315
Open deification (number) 1,69,325
Source of Drinking Water
Number of Tap 1,42,546
Number of Hand Pump & Tube Well, Bore well 1,37,272
Number of Well 62,176
Source: Census India 2011

Odisha Profile 2018
140
Excise
Items Indicators Value
Excise Activity,
2016-17
No. of Case Detected 21,277
No. of Person arrested 17,784
Major seized article :
ID-Liquor (Ltr.) 2,49,090
IMFL (LPL) 9,860
Beer (BL) 8,537
Wash (in Ltr) 13,43,056
No. of Hemp Plants destroyed for 2016-17 68,09,819
Approximate Value ( in Rs.) 6,80,98,19,000
Excise Revenue 2016-17 (in Crore) 2,786.23
% of Growth 0.0847
Odisha State
Beverages Corp.
Ltd
Excise duty (in Crore) 2,000.33
Sales Tax including entry Tax 1,091.64
Total : 3,091.97
Country Spirit
Shops in 2016-17
Number of District with Prevalence of Country Spirit shops 9
Nos. of Country Spirit shops 242
Out Still (OS)
Liquor in
2016-17
Number of Districts having Out Still system 20
Nos. of Out Still shops 560
Number of Branch shops 1,428
IMFL and Beer ,
2016-17
Foreign liquor 'Off' Shop 1,163
On' Shop 473
On club' 17
Beer Parlour 108
Military Canteen 36
Source: Excise Activity, 2016-17, Excise Department, Government of Odisha

Odisha Profile 2018
141
Election Items Indicators Value
Number of
Parliamentary
Constituencies,
2014
Total 21
General 13
SC 3
ST 5
Number of
Assembly
Constituencies in
2014
Total 147
General 90
SC 24
ST 33
Number of
Electors, 2014
Total Elector 2,91,52,514
Male Elector 1,51,64,146
Women Elector 1,39,87,183
Others 1,185
Gender Ratio in Electoral Roll 922
Service Electors 43,531
Male 30,164
Female 13,367
Grand 2,91,96,045
Male 1,51,94,304
Female 1,40,00,556
Others 1,185
Elector Population Ratio (%) 66.67
Electors with Elector’s Photo Identity Card (EPIC) 2,84,18,024
Electors with Photo on Roll 2,82,21,481
Percentage of EPIC Coverage 97.48
Percentage of Photo Coverage 96.81
Number of
Voters
Total 2,15,42,724
Male 1,10,73,291
Female 1,04,30,276
Others 78
Postal 39,079
Percentage of Voters Turn Out 73.79
Percentage of Male 72.53
Percentage of Female 74.62
Number of
Polling Station,
2014
Polling Station 35,896
Auxiliary Polling Station 63
Average No. of Electors Per Polling Station( In-cluding
Service Electors) 812
Women
Participation,
2014 (in
Percentage)
General Elections, 2014 (16th LOK SABHA )
Total Number of Women Elected 2
Elected Women over total women candidates in the state 11.76
Elected Women over total seats in State 9.52
Elected Women over total seats 9.5
Women Electors over total Electors 47.95
Women Voters over total Voters 48.42
Women voters over Women electors 74.5
State Elections, 2014 Legislative Assembly
Women Elected 11
Elected women over total seats 7.48
Women electors over total electors 47.95
Women votes over total votes polled 48.36
Women voters over women electors 74.42
RAJYA SABHA
Number of Total Members 10
Number of Women Member 1
Percentage women member in Rajya Sabha 10

Chapter Eight
Odisha & India

Odisha Profile 2018
142
Odisha & India
Items Indicators Odisha India
Population as
per census 2011
Total Population 4,19,74,218 1,21,08,54,977
Number of Male 2,12,12,136 62,32,70,258
Number of Female 2,07,62,082 58,75,84,719
Number of Rural 3,49,70,562 83,37,48,852
Number of Urban 70,03,656 37,71,06,125
Scheduled Caste (%) 17.1 16.6
Scheduled Tribe (%) 22.8 8.6
Population Density (per Sq. kms) 270 382
Decadal Growth Rate (%) 14.4 17.72
Rural (%) 7.75 12.29
Urban (%) 25.86 31.8
Average Annual Exponential Growth Rate (%) 1.31 1.64
Percentage of Urban Population (%) 16.68 31.14
Number of Child Population 52,73,194 16,45,15,253
Number of Boys 27,16,497 8,57,52,254
Number of Girls 25,56,697 7,87,62,999
0-4 Years (%) 8.7 9.3
5-9 Years (%) 9.7 10.5
Number of Adolescent (10-19) 82,74,023 25,32,35,661
Number of Male 41,76,219 13,34,01,231
Number of Female 40,97,804 11,98,34,430
Number of Rural 69,45,567 18,07,06,966
Number of Urban 13,28,456 7,25,28,695
Number of Youth (15-24) 77,08,925 23,19,50,671
Number of Male 38,43,623 12,15,67,089
Number of Female 38,65,302 11,03,83,582
Number of Rural 63,19,018 15,77,37,518
Number of Urban 13,89,907 7,42,13,153
Percentage of Elderly People (Aged 60+) (%) 9.5 8.6
Persons (‘000 numbers) 3,984 1,03,849
Male (‘000 numbers) 1,994 51,072
Female (‘000 numbers) 1,990 52,777
Rural (‘000 numbers) 3,440 73,294
Urban (‘000 numbers) 545 30,555
Sex Ratio, 2011 (Females per
1000 male)
Sex Ratio Females per 1000 male 979 943
Child Sex Ratio( 0-6) Years Females per 1000 male 941 919
Sex Ratio at Birth Females per 1000 male 956 909
Number of
Slum
Population,
2011
Number of House holds 3,50,306 1,39,20,191
Number of Persons 15,60,303 6,54,94,604
Number of Male 8,00,963 3,39,68,203
Number of Female 7,59,340 3,15,26,401
Proportion to Urban Population (%) 22.3 17.4
Number of Child Population(0-6) 1,88,962 80,82,743
Number of Boys 97,551 42,04,451
Number of Girls 91,411 38,78,292

Odisha Profile 2018
143
Items Indicators Odisha India
Number of
Households as
per 2011 census
Total Households 96,05,629 24,84,08,494
Rural 80,69,620 16,80,78,743
Urban 15,36,009 8,03,29,751
Average Household size 4.3 4.8
Rural 4.5 4.9
Urban 4.5 4.6
Occupied Residential Houses 94,06,413 23,82,36,358
Rural 79,23,086 16,16,78,619
Urban 14,83,327 7,65,57,739
No. of Households per 100 Occupied
Residential House 102 101
No. of Persons per 100 Households 434 491
Number of
Houseless
Households in
2011 Census
Total Houseless Households 10,334 4,49,787
Rural 5,571 1,92,891
Urban 4,763 2,56,896
Average Houseless Households size 3.3 3.9
Rural 3.6 4.3
Urban 3 3.7
Total Houseless Persons 34,061 17,73,040
Rural 20,008 8,34,692
Urban 14,053 9,38,348
Male 19,681 10,46,871
Female 14,380 7,26,169
Children(0-6) 4,529 2,70,605
Housing by
Condition as per
2011 Census (%)
Good 29.53 53.11
Livable 62.13 41.54
Dilapidated 8.33 5.35
Urban Housing Shortage (million number) 0.41 18.78
Source: Census India 2011

Odisha Profile 2018
144
Items Indicators Odisha India
Main Source of Drinking
Water as per 2011 census (in %)
Tap Water (%) 13.8 43.5
Hand Pump (%) 41.5 33.5
Tube Well (%) 20 8.5
Well (%) 19.5 11
Availability of Drinking Water
as per 2011 census (in %)
Within the premises 22.4 46.6
Near the Premises 42.2 35.8
Away 35.4 17.6
Access to Safe Drinking Water
as per 2011 census (in %)
Total 75.3 85.5
Rural 74.4 82.7
Urban 79.8 91.4
Sources of Lighting as per 2011
census (in %)
Electricity 43.0 67.2
Kerosene 55.3 31.4
No lighting 1.1 0.5
Drainage Connectivity as per
2011 census (in %)
Closed Drainage 4.3 18.1
Open Drainage 15 33
No Drainage 80.7 48.9
Bathing Facility as per 2011
census (in %)
House holds with Bathing facility 19.7 58.4
House holds with Bath Room 14.1 42
Latrine Facilities as per 2011
census (in %)
Households with Latrine facilities within
premises 22.4 46.9
Kitchen Facility as per 2011
census (in %)
Households with Kitchen facility in
prem-ises 81.1 87.3
Fuel Used for Cooking as per
2011 census (in %)
Fire wood 65 49
Kerosene 1.1 2.9
LPG/PNG 9.8 28.5
Electricity 0.4 0.1
Life Expectancy in 2010-14
(in years)
Life Expectancy at Birth( Total) 65.8 67.9
Male 64.7 66.4
Female 67.1 69.6
Life Expectancy at Birth (Rural) 65.2 66.7
Male 64.1 65.1
Female 66.5 68.4
Life Expectancy at Birth (Urban) 69.8 71.5
Male 68.7 70
Female 71 73.2
F-M Ratio 1.04 1.05
Male (%) 0.46 0.39
Female (%) 0.53 0.5
Male (2021-20205) 67.8 69.8
Female (2021-20205) 71.6 72.3
MATERNAL HEALTH
Maternal Mortality Ratio , 2014-16
(per 100,000 live births ) 180 130
Maternal Mortality Rate, 2014-16
(per 100,000 live births ) 12.3 8.8
Crude Birth Rate (2016)
(Per 1000 persons) 18.6 20.4
Rural (2016)
(Per 1000 persons) 19.6 22.1
Urban (2016)
(Per 1000 persons) 13.7 17.0
Projected Crude Birth Rate, 2021-25
(Per 1000 persons) 14.4 16

Odisha Profile 2018
145
Items Indicators Odisha India
FERTILITY INDICATORS
2016 (in Percentage)
General Fertility Rate
(live birth per 1000 women) 66.3 74.4
Rural
(live births per 1000 women) 70.5 81.8
Urban
(live births per 1000 women) 46.7 59.5
Total Fertility Rate
(births per women) 2 2.3
Rural
(births per women) 2.1 2.5
Urban
(births per women) 1.4 1.8
Mean Age of Fertility
Total (In years) 28.2 28.1
Rural (In years) 28.2 28.2
Urban (In years) 28.1 28.3
Gross Reproduction Rate (Female
children per women) 0.9 1.1
Rural (births per women) 1.0 1.2
Urban (births per women) 0.7 0.8
Total Martial Fertility rate
(Average no. of children born per
marriad woman )
4.5 4.8
Rural (births per women)
Average no. of children born per married
woman
4.6 5
Urban (births per women)
Average no. of children born per marriad
woman
3.9 4.1
Age Specific Fertility Rate 8.2 10.7
15-19 (In %)
20-24 (In %) 115.3 135.4
25-29 (In %) 145.9 166.0
30-34 (In %) 79.3 91.7
35-39 (In %) 27.6 32.7
40-44 (In %) 12.0 11.3
45-49 (In %) 3.4 4.1
% of Live births where the mothers
received medical attention at delivery 78.3 79.3
% of Govt. Hospital 61.7 52.6
% of Private Hospital 16.6 26.7
% of Qualified professional 9.9 10.9

Odisha Profile 2018
146
Items Indicators Odisha India
MORTALITY INDICATORS,
2016,
(Per ‘000 live births)
% of Untrained functionary and others 11.8 9.8
Crude Death Rate ,
(per 1000 persons) 7.8 6.4
Rural (per 1000 persons) 8.1 6.9
Urban (per 1000 persons) 6.1 5.4
Male (per 1000 persons) 8.5 6.8
Female (per 1000 persons) 7.1 5.9
Projected Crude Death Rate, 2021-25
(per 1000 persons) 8.1 7.2
Natural Growth rate
(Per 1000 persons) 11.6 14.3
Rural (Per 1000 persons) 12.4 15.4
Urban (Per 1000 persons) 7.8 11.9
Child mortality rate(0-4)
(Per 1000 Childrem) 13 10
Rural (Per 1000 Childrem) 14 12
Urban (Per 1000 Childrem) 7 7
Under-Five Mortality Rate
(per 1000 Live Births) 50 39
Rural (per 1000 Live Births) 52 43
Urban (per 1000 Live Births) 38 25
Male (per 1000 Live Births) 49 37
Female (per 1000 Live Births) 51 41
Infant Mortality Rate
(per 1000 Live Births) 44 34
Rural (per 1000 Live Births) 46 38
Urban (per 1000 Live Births) 34 23
Male (per 1000 Live Births) 44 33
Female (per 1000 Live Births) 44 36
Neo-natal mortality rate
(per 1000 Live Births) 32 24
Rural (per 1000 Live Births) 33 27
Urban (per 1000 Live Births) 24 14
Percentage of Neo-natal death to Infant
deaths 73.2 68.8
Early neo-natal mortality rate (per 1000
Live Births) 24 18
Post neo-natal mortality rate (per 1000
Live Births) 12 11
Peri-natal mortality rate (per 1000 Live
Births) 37 23
Still birth rate
(per 1000 Live Births) 13 4
% of Live births where the mothers received
medical attention at delivery
Govt. Hospital 29.0 28.5
Private Hospital 17.1 17.7
Qualified Professional 15.9 33.8
Untrained functionary and others 37.9 20.1
Source: SRS Bulletin 2016

Odisha Profile 2018
147
Items Indicators Odisha India
NATIONAL
FAMILY HEALTH
SURVEY-4
(2015-16)
(In Percentage)
Population and Household Profile
Population (female) age 6 years and above who ever
attended school 67.8 68.8
Children under age 5 years whose birth was registered 82.1 79.7
Households with electricity 85.5 88.2
Households with an improved drinking-water source 88.8 89.9
Households using improved sanitation facility 29.4 48.4
Households using clean fuel for cooking 19.2 43.8
Households with any usual member covered by a health
scheme or health insurance 47.7 28.7
Characteristics of Adults (age 15-49)
Women who are literate 67.4 68.4
Men who are literate 84.3 85.7
Women with 10 or more years of schooling 26.7 35.7
Marriage and Fertility
Women age 20-24 years married before age 18 years 21.3 26.8
Men age 25-29 years married before age 21 years 11 20.3
Women age 15-19 years who were already mothers or
pregnant at the time of the survey 7.6 7.9
Maternal and Child Health
Mothers who had antenatal check-up in the first trimester 64.1 58.6
Mothers who had at least 4 antenatal care visits 62 51.2
Mothers who had full antenatal care 23.1 21
Registered pregnancies for which the mother received
Mother and Child Protection (MCP) card 97.2 89.3
Mothers who received financial assistance under Janani
Suraksha Yojana (JSY) for births delivered in an
institution
72.6 36.4
Children born at home who were taken to a health
facility for check-up within 24 hours of birth 6.9 2.5
Average out of pocket expenditure per delivery in public
health facility 4,125 3,198
Delivery Care (for births in the 5 years before the
survey)
Institutional births 85.4 78.9
Institutional births in public facility 75.9 52.1
Home delivery conducted by skilled health personnel
(out of total deliveries) 3.3 4.3
Births assisted by a doctor/nurse/LHV/ANM/other health
personnel 86.6 81.4

Odisha Profile 2018
148
Items Indicators Odisha India
NATIONAL
FAMILY HEALTH
SURVEY-4
(2015-16)
(in percentage)
Child Immunizations and Vitamin A
Supplementation
Children age 12-23 months fully immunized
(BCG, measles, and 3 doses each of polio and DPT) 78.6 62
Children age 9-59 months who received a vitamin A
dose in last 6 months 69.1 60.2
Children age 12-23 months who received most of the
vaccinations in public health facility 98.3 90.7
Children age 12-23 months who received most of the
vaccinations in private health facility 1 7.2
Nutritional Status of Adults (age 15-49 years)
Women whose Body Mass Index (BMI) is below normal
(BMI < 18.5 kg/m2) 26.4 22.9
Men whose Body Mass Index (BMI) is below normal
(BMI < 18.5 kg/m2) 19.5 20.2
Women who are overweight or obese (BMI ≥ 25.0
kg/m2) 16.5 20.7
Men who are overweight or obese (BMI ≥ 25.0 kg/m2) 17.2 18.6
Anaemia among Children and Adults
Children age 6-59 months who are anaemic 44.6 58.4
Non-pregnant women age 15-49 years who are anaemic 51.2 53.1
Pregnant women age 15-49 years who are anaemic 47.6 50.3
All women age 15-49 years who are anaemic 51 53
Men age 15-49 years who are anaemic 28.4 22.7
Infant and Child Mortality Rates
(per 1,000 live births)
Infant mortality rate (IMR) 40 41
Under-five mortality rate (U5MR) 49 50
Unmet Need for Family Planning (currently married
women age 15–49 years)
Total unmet need 13.6 12.9
Unmet need for spacing 4.7 5.7
Women’s Empowerment and Gender Based Violence
(age 15-49 years)
Currently married women who usually participate in
household decisions 81.8 84
Women owning a house and/or land (alone or jointly
with others) 63.5 38.4
Women having a bank or savings account that they
themselves use 56.2 53
Ever-married women who have ever experienced spousal
violence 35.2 28.8
Tobacco Use and Alcohol Consumption among
Adults (age 15-49 years)
Women who use any kind of tobacco 17.3 6.8
Men who use any kind of tobacco 55.9 44.5
Women who consume alcoho 2.4 1.2
Men who consume alcohol 39.3 29.2

Odisha Profile 2018
149
Items Indicators Odisha India
AGRICULTURE , 2015-
16
AGRICULTURE CENSUS,,2015-16
ALL CLASS
Number of holding 48,65,850 1,47,21,000
Area Operated (In Hectors) 46,19,289 15,71,42,000
Average size of Holdings (In Hectors) 0.95 1.08
FOOD GRAIN
Area (Million Ha.) 4.85 122.65
Production (Million Tonnes) 6.42 252.22
Yield (Kg per Ha) 1323 2056
PULSES
Area (Million Ha.) 0.78 25.26
Production (Million Tonnes) 0.39 16.47
Yield (Kg per Ha) 497 652
FERTILIZERS
Total consumption (N+P+K) , 2016-17
(‘000 Tonnes) 494.35 25949
Per Ha. consumption ,(2014-15)
(Kg per Ha) 58.91 128.08
CROPPING INTENSITY Cropping Intensity , 2014-15 (%) 167 141.55
HORTICULTURE
CROPS (2015-16)
AREA (in ‘000 Ha)
Total Area 1,358.45 24,471.67
Fruits 340.8 6,300.67
Vegetables 650.97 10,106.29
Flowers 6.56 277.57
Aromatics & Medicinal 1.9 633.94
Spices 182.06 3,473.53
Plantation Crops 233.82 3679.67
PRODUCTION (in ‘000 MT)
Total Production 11,686.25 2,86,187.72
Fruits 2,386.94 90,183.04
Vegetables 9,067.65 1,69,063.93
Flowers (Loose) 24.78 1656.24
Flowers (Cut) 29.42 527.67
Aromatics & Medicinal 0.6 1022.45
Spices 847.97 6,988.47
Plantation Crops 306.5 16,658.29
Honey 1 87.62
Number of COLD STORAGE (2016-17) 170 7543
Storage Capacity, 2016-17 (in MT) 5,38,139 3,46,73,886
Source: Agriculture Statistics India,, Horticulture Statistics India

Odisha Profile 2018
150
Items Indicators Odisha India
FOREST,2017
Percentage of Forest Cover to Geographical Area 32.98 21.54
Percentage of Forest Cover in Tribal Districts 39.73 37.43
Percentage of Tree Cover to Geographical Area 2.56 2.85
Growing Stock (Million Cum) 339.52 5,822.38
Mangrove Cover assessment (Sq.kms) 243 4921
PROTECTED
AREAS , 2016
National Parks 2 103
Area Under National Parks in Sq. Kms 990 40,500.13
Number of Wild Life Sanctuaries 19 537
Number of Protected Areas 21 733
Area under Protected Areas in Sq. Kms 8,352.3 1,60,901.77
Number of Biosphere Reserve 1 18
ANIMAL
HUSBANDRY, 2012
Total Number of Cattle 1,16,21,272 19,09,04,105
Total Number of Buffalo 7,26,306 10,87,02,122
Total Number of Bovines 1,23,47,578 29,99,81,153
Total Number of Sheep 15,81,129 6,50,69,189
Total Number of Goat 65,13,087 13,51,73,093
Total Number of Live Stock 2,07,32,498 51,20,57,301
Total Number of Poultry 1,98,90,538 72,92,09,320
Total Milk Production in ‘000 MT , 2015-16 1,938.25 1,55,490.51
Per Capita availability of Milk (gms/ day) , 2015-16 118 337
Production of Eggs Million Nos. , 2015-16 1,927.3 8,29,294.37
Per Capita availability of Eggs (numbers per annum),
2015-16 43 66
FISHERIES , 2015-16
Fisheries Resources
Length of Coastal Line in Kms 480 8118
Continental Shelf Area in Sq. Kms 24,000 5,30,000
Total Inland Water Bodies in Lakh Ha. 11 73.59
Brackish Water in Lakh Ha. 4.18 12.4
Fish Production
Inland Fish Production in Lakh Tonnes 3.76 65.81
Marine Fish Production in Lakh Tonnes 1.45 34.91
Total Fish Production in Lakh Tonnes 5.21 100.72
Number of Fish Landing Centre 73 1537
Number of Marine Fisherman villages 813 3432
Number of Marine Fisherman Families 1,14,238 8,74,749

Odisha Profile 2018
151
Items Indicators Odisha India
EDUCATION,
2016
ESTIMATED POPULATION BY AGE GROUP
Total Number of Primary students (I-V) 6-10 Years 39,63,217 13,01,54,678
Number of Male 20,24,695 6,83,32,110
Number of Female 19,38,522 6,18,22,568
Total Number students Upper Primary (VI-VIII) 11-13
Years 23,51,996 7,28,26,991
Number of Male 12,07,617 3,91,34,565
Number of Female 11,44,379 3,36,92,426
Total Number Elementary students (I-VIII) 6-13 years 63,15,213 20,29,81,669
Number of Male 32,32,312 10,74,66,675
Number of Female 30,82,901 9,55,14,994
Total Number students Secondary (IX-X) 14-15 years 15,70,855 4,89,28,014
Number of Male 7,92,994 2,59,58,171
Number of Female 7,77,861 2,29,69,843
Total Number students (I-X ) 6-15 Years 78,86,068 25,19,09,683
Number of Male 40,25,306 13,34,24,846
Female 38,60,762 11,84,84,837
Total Number students Higher Secondary (XI-XII) 16-17
Years 13,61,851 4,40,41,051
Number of Male 6,83,450 2,32,40,013
Number of Female 6,78,401 2,08,01,038
I-XII 6-17 Years Total 92,47,919 29,59,50,734
Number of Male 47,08,756 15,66,64,859
Number of Female 45,39,163 13,92,85,875
Total Number students Higher Education 18-23 Years 46,40,028 14,15,37,252
Number of Male 23,15,718 7,31,36,991
Number of Female 23,24,310 6,84,00,261
LITERACY
RATE, 2011
Percentage of Person 72.9 73
Percentage of Male 81.6 80.9
Percentage of Female 64.0 64.6
Percentage of Rural 70.2 67.8
Percentage of Urban 85.7 84.1
Adolescence Literacy Rate
Percentage of Male 92.5 91.7
Percentage of Female 87.7 88.2
Gap in Literacy Rate 4.8 3.5
Percentage of Rural 89.3 88.9
Percentage of Urban 94.2 92.8
Gap in Literacy Rate 4.9 3.9

Odisha Profile 2018
152
Items Indicators Odisha India
LITERACY RATE,
2011
Percentage of Youth(15-24) Literacy Rate 86.03 86.1
Percentage of Male 90.9 90.1
Percentage of Female 81.2 81.9
Gap in Literacy Rate 9.7 8.2
Percentage of Rural 84.6 83.7
Percentage of Urban 92.7 91.4
Gap in Literacy Rate 8.1 7.7
Ratio of female literacy rate to male literacy rate (15-24) 0.89 0.91
Percentage of Adult Literacy Rate Total 69.4 69.3
Percentage of Male 79.8 78.8
Percentage of Female 58.8 59.3
Gap in Literacy Rate 21 19.5
Percentage of Old Literacy Rate(60years and above) Total 43.7 43.5
Percentage of Male 63.1 59.1
Percentage of Female 24.3 28.5
Percentage of Rural 40.3 34.2
Percentage of Urban 65.4 66
Educational Statistics at a Glance India
ELEMENTARY
EDUCATION,
2015-16
Number of Primary Schools/Sections per thousand Child
Population (6 to 11 Years) 14 9
Number of Upper Primary Schools/ Sections per thousand
Child Population (11 to 14 Years) 13 8
Percentage of Schools Approachable by All Weather Road 90.2 89.2
Percentage of Ratio of Primary to Upper Primary
Schools/Sections 1.79 1.99
Percentage of Average Number of Classrooms 3.7 5.1
Percentage of Schools with Building 99.1 99.08
Percentage of Student-Classroom Ratio 25 27
Percentage of Schools having Single-Classroom 9.3 4.2
Percentage of Schools having Boundary Wall 67.45 64.5
Percentage of Schools having Drinking Water Facility 99.39 96.81 Percentage of Schools having Girl's Toilet Facility 97.06 97.52
Percentage of Schools having Electricity Connection 33.03 62.81
Percentage of Schools having Playground 30.91 61.25
Average Number of Teachers per School (%) 4.6 5.5
Pupil-Teacher Ratio 20 24
Percentage of Female Teachers 43.2 48
Girls' Enrolment Percentage of Primary 48.26 48.19
Upper Primary 48.59 48.63
Ratio of Girls' to Boys Enrolment Percentage of Primary 0.94 0.93
Percentage of Upper Primary 0.95 0.95
Retention Rate (%) 71.33 70.7
Gross Enrolment Ratio Percentage of Primary 103.73 99.21
Percentage of Upper Primary 94.26 92.81
Net Enrolment Ratio Percentage of Primary 90.51 87.3
Percentage of Upper Primary 72 74.74
Annual average promotion Rate Percentage of Elementary (2014-15) 96.73 95.44
Percentage of Primary (2014-15) 97.02 95.35
Percentage of Upper Primary (2014-15) 96.59 95.61
Annual average repetition Rate (2014-15) Percentage of Primary (2014-15) 0.11 0.52
Percentage of Upper Primary (2014-15) 0.04 0.36

Odisha Profile 2018
153
Items Indicators Odisha India
SECONDARY
EDUCATION
Density of Schools per 10 Sq. Km. (2014-15) 0.61 0.71
Average Number of Classrooms , 2015 2.4 3.5
Student-Classroom Ratio , 2015-16 54 46
Percentage of Schools having Library, 2015-16 94.84 90.68
Percentage of School having Playground, , 2015-16 66.48 77.88
Percentage of Schools for Children With Special Need , , 2015-16 0.28 1.11
Pupil-Teacher Ratio (%), 2014-15 23.34 27
Percentage of Schools having Boundary Wall, 2015-16 79.54 84.11
Percentage of Schools having Drinking Water Facility, 2015-16 99.06 98.84
Percentage of Schools having Girl's Toilet Facility , 2015-16 95.22 98.44
Percentage of Teachers with professional qualification , 2015-16 80.52 86.38
Percentage of Girls' Enrolment , 2015-16 49.52 47.48
Transition Rate (Elementary to Secondary)
Percentage of Boys, 2014-15 92.19 92.48
Percentage of Girls 93.36 88.66
Total (%) 2014-15 92.76 90.62
Gross Enrolment Ratio , 2014-15
Boys (%) 75.69 78.13
Girls (%) 75.17 78.94
Total (%) 75.43 78.51
Mean Achievement Score of students in English , 2015 245 250
Mean Achievement Score of students in Mathematics ,2015-16 265 250
HIGHER
EDUCATION,
2015-16
Number of Colleges per lakh population (18-23 years) , 23 28
Average number Enrolment per College 661 721
Gross Enrollment Ratio (18-23 years) Total 19.6 24.5
Male 21.5 25.4
Female 17.8 23.5
Gender Parity Index All 0.83 0.92
Scheduled Caste 0.78 0.91
Scheduled Tribe 0.77 0.83
Pupil Teacher Ratio (Regular & Distance Mode)
All Institutions 21 23

Odisha Profile 2018
154
Items Indicators Odisha India
HEALTH
Number of Average population served per Govt. hospital as on
01.01.2015 23,884 61,011
Number of Average population served per Govt. hospital Bed
as on 01.01.2015 2,505 1,833
Number of Average population served per Govt.
Allopathic Doctor as on 01.01.2015 9,729 11,528
Average Rural Population covered by a Number of Sub Centre as on 31.03.2016 5,229 5,377
Number of PHC as on 31.03.2016 26,797 32,944
Number of CHC as on 31.03.2016 92,760 1,51,316
Average Rural Area covered in Sq. Kms as on 31.03.2016 Sub Centre as on 31.3.2016 22.78 20
PHC as on 31.3.2016 116.75 122.33
CHC as on 31.3.2016 404.13 562.89
Average Radial Distance covered by a Sub Centre as on 31.3.2016 2.69 2.52
PHC as on 31.3.2016 6.09 6.24
CHC as on 31.3.2016 11.34 13.38
Average Number of Villages covered as on 31.03.2016 by a Sub Centre 8 4
PHC 39 25
CHC 136 116
Number of Sub Centres per PHC as on 31.03.2016 5 6
Number of PHC per CHC as on 31.03.2016 3 5
Average Rural Population covered by a Number of Health Worker (Male) as on 31.03.2016 9,862 14,980
Number of Health Worker (Female)/ANM as on 31.03.2016 4,241 3,929
NUTRITION
Prevalence of Stunting in under 5 children, 2014 (%) 38.2 38.7
Prevalence of Wasting in under 5 children , 2014 (%) 18.3 15.1
Prevalence of under weight in under 5 children 2014 (%) 34.4 29.4
Children under 3 years who are low Birth weight 2014 (%) 18.9 18.6
Infants (0-5) months who are exclusively Breastfed 2014 (%) 68.5 64.9
Adolescence Girls (15-18) years with Low Body Mass Index
2014 (%) 51.8 44.7
Women whose Body Mass Index (BMI) is below nor-mal (BMI
< 18.5 kg/m) as per NFHS, 2015-16 (%) 26.4 22.9
Men whose Body Mass Index (BMI) is below normal (BMI <
18.5 kg/m) as per NFHS, 2015-16 (%) 19.5 20.2
Women who are overweight or obese (BMI ≥ 25.0 kg/m2) 14
(%) as per NFHS, 2015-16 (%) 16.5 20.7
Men who are overweight or obese (BMI ≥ 25.0 kg/m2) 14 (%)
as per NFHS, 2015-16 (%) 17.2 18.6
Children age 6-59 months who are anaemic <11.0 g/dl, as per
NFHS, 2015-16 (%) 44.6 58.4
Pregnant women age 15-49 years who are anaemic, as per
NFHS, 2015-16 (%) 47.6 50.3
All women age 15-49 years who are anaemic , as per NFHS,
2015-16 (%) 51 53
Men age 15-49 years who are anaemic , as per NFHS, 2015-16
(%) 28.4 22.7
Children aged 12-23 months who are fully
immunized, 2014 (%) 62 65.3
Source: Rural Health Statistics, Ministry of Health & Family Welfare, India India health report nutrition National health
Statistics 2015

Odisha Profile 2018
155
Items Indicators Odisha India
ROAD
COMMUNICATION
Total Road Length as on 31.03.2015 (in Kms) 2,54,548 54,72,144
National Highways Tota, as on 31.03.2015 (in Kms)l 4,636 97,991
State Highways Total , as on 31.03.2015 (in Kms) 4,071 1,67,109
ROAD DENSITY
Average Road density, 2012-13 In Kms. (per 100
square kms area) 178 159
The average road length per lakh population in Kms
as on March 2013 661.5 427.59
The length of NHs per 1000 square kms as on 2014-
15 in Kms 29.8 30.4
The length of NHs per lakh of population kms as on
2014-15 in Kms 11.1 8.3
ROAD ACCIDENTS
Number of Accidents Per Lakh Population , 2017 25.4 36.2
Number of Road Accidents per 10,000 Vehicles 18.1 20.9
Number of Road Accidents per 10,000 Km of Roads 365.6 1,021.9
Number of Persons Killed in Road Accidents
Per Lakh Population 11.2 11.5
Number of Persons Killed in Road Accidents
per 10,000 Vehicles, 2016 7.7 6.6
Number of Persons Killed in Road Accidents per
10,000 Km of Roads, 2016 154.9 320.6
Number of Persons injured in Road Accidents Lakh
Population ,2017 26.2 36.7
Number of Persons injured in Road Accidents per
10,000 Vehicles , 2016 19.4 21.5
Number of Persons injured in Road Accidents per
10,000 Km of Roads, 2014 392.7 1051.7
Number of Persons Killed per 100 Accidents , 2015 44.1 31.8
Source: MORTH, India Infrastructure Statistics MOSPI India Deptt of Telecommunication India
Items Indicators Odisha India
MOTOR
VEHICLE
CAGR of Registered Motor Vehicles from 2005-2015
(in %) 11.9 9.8
Total Number of Registered Vehicles as on 2015 52,18,595 21,00,23,239
Number of Transport vehiclesas on 2015 5,25,889 1,87,28,300
Number of Non Transport vehicles as on 2015 46,92,706 19,11,27,349
Number of Motor Vehicles/1000 population , 2014-16 124 167
Number of Motor Vehicle per 100 Kms. of Road Length
, 2014-15 1,518 3,861
RAIL
TRANSPORT,
2015-16
(In Kms.)
Total Route Kilometers 1,910 66,687
Total Track kilometers 3,357 1,19,630
Running Track Kilometers 2,728 9,208

Odisha Profile 2018
156
Items Indicators Odisha India
AIR TRANSPORT,
2015-16
Number of International aircraft movements 4 3,74,995
Number of Domestic aircraft movements 14,032 14,20,462
Number of International passengers 16,173 5,46,62,204
Number of Domestic passengers 18,78,559 16,92,93,015
Number of All passengers 18,94,732 22,39,55,219
Freight 7,002 27,04,575
WATER
TRANSPORT,
2015-16
( Million Tonnes)
Traffic handled at Ports Total 91.09 1,072.47
Major Ports 76.39 606.37
Non-Major Ports 14.71 466.1
Container Traffic Handled at Major ports
TEUs (twenty foot equivalent unit) 5 8198
Tn (Tonnes) 121 1,23,118
Capacity of Major ports (Million Tonnes) 126.94 965.36
Capacity Utilization at Major ports (%) 60.2 62.8
Average Pre berthing detention (hours) 4.75 1.61
Average Turn Round Time (Days) 4.5 3.63
Average Ship berth - day Output (MT) 21,139 14,725
POSTAL
COMMUNICATIO
N ,2015-16
Number of Average person served per Post Office 5,560 8,364
Number of Average person served per Post Office
(Rural) 4,931 6,275
Number of Average person served per Post Office
(Urban) 13,545 2,6553
Number of Average Area served by a Post Office 19.06 21.22
TELE COMMUNI-
CATION ,2016
Growth of Tele Subscribers (%) 18.73 11.13
Rural Tele Subscribers (%) 56.11 40.69
Tele-density (Per ‘000 persons) 77.38 89.9
Urban Tele-density (Per ‘000 persons) 189.98 170.15
Rural Tele-density (Per ‘000 persons) 52.87 53.27
Number of Village Public Telephone 6,205 2,36,163
Total number of internet Subscriber per 100 population 22.32 30.56
Number of Urban internet Subscriber per 100 population 79.76 68.86
Number of Rural internet Subscriber per 100 population 9.81 13.08
Source: MORTH, India Infrastructure Statistics India Deptt of Telecommunication India

Odisha Profile 2018
157
Items Indicators Odisha India
ANNUAL
SURVEY OF
INDUSTRIES,
2014-15
Principal Characteristics
Number of Factories 2,803 2,30,435
Fixed Capital (Rs. in lakhs) 2,29,47,886 24,74,45,461
Productive Capital (Rs. in lakhs) 2,26,50,016 31,15,29,492
Invested Capital (Rs. in lakhs) 2,64,95,184 35,13,96,431
Number of Workers 2,14,836 1,07,55,288
Total Number of Persons Engaged 2,62,817 1,38,81,386
Wages to Workers (Rs. in lakhs) 3,52,488 1,40,48,488
Total Emoluments 6,59,084 3,07,41,306
Total Input (Rs. in lakhs) 1,05,74,792 57,19,10,956
Total Output (Rs. in lakhs) 1,31,17,979 68,83,81,205
Depreciation (Rs. in lakhs) 8,74,694 1,89,54,077
Net value added (Rs. in lakhs) 16,68,493 1,34,05,511
PRICES ,
2016
(In Percentage)
Consumer Price Index
General Index 139.17 131.7
Food and Beverages 133.78 134.47
Pan , Tobacco and intoxicants 145.96 139.04
Clothing and footwear 138.99 132.43
Fuel and light 128.43 123.63
Miscellaneous 122.49 121.42
Annual Inflation rates based on CPI
General Index 6.52 512
Food and Beverages 7.52 5.34
Pan , Tobacco and intoxicants 11.15 7.42
Clothing and footwear 7.21 5.29
Fuel and light 2.2 3.33
Miscellaneous 5.6 4.28
ECONOMY
, 2016-17 AE
Domestic Product & National/State Income
At Current prices
Gross Domestic Product/ Gross State Domestic Product
(Rs. in crore) 3,78,991 1,51,92,588
Growth Rate (%) 10.85 11.9
Per Capita Net National Income/ Per Capita Net State
Domestic Product (Rs. in crore) 75,223 1,03,007
Growth Rate (%) 10.15 10.4
At Constant (2011-12) prices
Gross Domestic Product/Gross State Domestic Product
(Rs. in crore) 3,14,364 1,21,54,797
Growth Rate (%) 7.94 7.1
Per Capita Net National Income/ Per
Capita Net State Domestic Product (Rs. in crore) 61,678 81,805
Growth Rate (%) 7.05 5.6
Gross Value Added
At Current prices 100 100
Primary (%) 27.27 19.41
Secondary (%) 29.2 26.45
Tertiary (%) 43.53 54.14
At Constant (2011-12)prices(%) 100 100
Primary (%) 27.03 17.78
Secondary (%) 30.09 27.94
Tertiary (%) 42.88 54.28

Odisha Profile 2018
158
Items Indicators Odisha India
LABOUR
&EMPLOYMENT,
2011 (In Percentage)
Work force Participation Rate (Total) 41.79 39.79
Male 56.11 53.26
Female 27.16 25.51
Rural 43.20 41.8
Male 56.50 53
Female 29.70 30
Urban 34.81 35.31
Male 54.08 53.76
Female 14.10 15.4
WATER
RESOURCES, 2011
Annual precipitation (BCM) 230.76 4,000
Annual Replenish able Ground Water Resources
(BCM/Year) 17.78 432.72
Natural Ground Water losses (BCM) 1.09 34.6
Net Annual Ground Water Availability (BCM) 16.69 398.16
Annual Ground Water Draft (BCM) 4.73 245.05
Stage of Ground Water development (%) 28 62
Projected Demand for Domestic & industry Purposes
(BCM) 1.24 33.16
Ground Water Availability for future Irrigation (BCM) 11.64 154.72
Catchment Area of Major River Basins
(sq. kms) 3,13,296 25,28,084
Availability of Surface water, 2001 (BCM) 120.4 1,869.37
Estimated Utilizable Surface Water Re-sources,
2001(BCM) 95.54 690.1
Per Capita Water Availability, 2001(Cubic Metre) 3,359 1,816
Ultimate Irrigation Potential (,000 ha.) 8,803 1,39,894
ENERGY as on
31.03.2016
Estimated Reserves of Coal (Billion Tonne) 75.9 308.8
Proved (Billion Tonne) 34.29 138.09
Indicated (Billion Tonne) 33.28 139.15
Inferred (Billion Tonne) 8.32 31.56
Distribution (%) 24.5 100
Estimated Potential of Renewable Power (MW) 30,820 11,98,856
Installed Capacity of Power Utilities
Thermal (GW) 5.42 210.68
Hydro (GW) 2.06 42.78
Nuclear (GW) - 5.78
RES(MNRE) 0.15 42.85
Total Installed Capacity (GW) 7.63 302.08
Per Capita consumption of Electricity (Kwh), 2014-15 1,147 1,010
Source: Energy Statistics India Department of MOSPI Ministry of Water Resources Govt of India

Odisha Profile 2018
159
Items Indicators Odisha India
TOURISM, 2017
Total Number of Tourist Arrival 14.11 1,323.00
Domestic Tourist (in million number) 14.01 1,613.55
Foreign Tourist (in million number) 0.10 15.54
Visitors to Centrally protected ticketed Monuments
Total (In number) 33,36,522 5,36,08,958
Domestic (In number) 33,25,122 5,09,88,730
Foreign (In number) 11,400 26,20,228
Tour Operators
Adventure Operator (In number) - 41
Domestic Tour Operator (In number) 1 118
Inbound Tour Operator(In number) 7 457
Tourist Transport Operator (In number) 1 104
Travel Agent (In number) 0 188
WOMEN &
CHILDREN, 2011
Child Women Ratio
P(0-4)/F(15-49) (No. of Children per 1000 Women) 327 362
P(5-9)/F(20-54) ,
(No. of Children per 1000 Women) 403 456
Dependency Ratio (per hundred persons aged 15-59) 62.3 65.2
Male (per hundred persons aged 15-59) 62.8 65.4
Female (per hundred persons aged 15-59) 61.7 65.1
Young Age Dependency Ratio
(per hundred persons aged 15-59) 46.8 51
Male (per hundred persons aged 15-59) 47.5 51.8
Female (per hundred persons aged 15-59) 46.2 50.2
Old age Dependency Ratio (per hundred persons aged
15-59) 15.4 14.2
Male (per hundred persons aged 15-59) 15.4 13.6
Female (per hundred persons aged 15-59) 15.5 14.9
% Share of Women in Total population(%) 49.46 48.53
Sex Ratio at Economically Active (15-59) , (Females per
1000 Male) 986 944
Sex Ratio at Adolescent(10-19), (Females per 1000 Male) 981 898
Sex Ratio at Reproductive Age-44 years) , (Females per
1000 Male) 998 945
Mean Age at
Effective marriage
Mean Age at Effective marriage (Female) 22.1 22.2
Rural (%) 22.0 21.7
Urban (%) 23.2 23.1
Percentage
distribution of
births by type of
medical attention at
delivery. 2016
Percentage of Government Hospital 62.4 53.4
Percentage of Private Hospital 17.3 27.4
Percentage of Qualified Professional 9.8 10.3
Percentage of Untrained Functionary and Others 10.4 8.9

Odisha Profile 2018
160
Items Indicators Odisha India
Mean age of fertility,
2016 (in percentage)
Mean age of fertility, 28.2 28.1
Rural (%) 28.2 28.0
Urban (%) 28.1 28.3
Educational level of
women (15-49 years) as
on 2016 (in percentage)
Illiterate (%) 12.2 15.2
Total literate(%) 87.8 84.8
Without any formal education (%) 5.6 5.6
Below primary (%) 10.3 7.4
Primary (%) 16.1 13.4
Middle (%) 23.0 18.6
Class X (%) 17.3 17.8
Class XII (%) 8.6 12.1
Graduate and above (%) 6.7 9.9
Turnout of Women
Voters for General Lok
Sabha Election - 2014 (in percentage)
Total Turnout (%) 74 66
Women Turnout (%) 75 66
General Fertility Rate
( GFR) by level of
education of women in
2016 (in percentage)
Illiterate (%) 52.3 75.2
Total literate(%) 69.3 74.6
Without any formal education (%) 61.0 67.7
Below primary 72.3 85.4
Primary (%) 80.0 84.8
Middle (%) 75.3 74.2
Class X (%) 61.3 68.9
Class XII (%) 61.1 70.2
Graduate and above (%) 56.3 73.2
PRE SCHOOL
EDUCATION, 2015
Number of Anganwadis providing Pre school
Education 70,314 12,53,248
Number of Pre school Education Beneficiaries 15,35,738 3,65,43,996
Number of Boys 7,72,710 1,85,45,840
Number of Girls 7,63,028 1,79,98,156
Average per Anganwadi(%) 21.84 29.16
Boys (%) 10.99 14.8
Girls (%) 10.85 14.36
Crimes In 2015
TOTAL COGNIZABLE CRIMES
Number of Cases Reported under Total Cognizable
Crimes 83,360 1,99,548
Percentage Contribution to All India Total 2.8 6.8
Rate of Total Cognizable Crimes per lakh
population 197.3 778.7

Odisha Profile 2018
161
Items Indicators Odisha India
Violent Crimes, 2016
Total Violent Crimes 19,092 4,29,299
Percentage Share To All India Crimes 4.4 100
Rate of Violent Crimes 44.8 33.7
Crime Against SC, 2016
Total Number of Cases Reported 17,96 40,801
Percentage of cases to All India Total 4.4 100
Rate of Total Cognizable Crimes per lakh
population 25.0 20.3
Crime Against ST, 2016
Total Number of Cases Reported 681 6568
Percentage of cases to All India Total 10.4 100
Rate of Total Cognizable Crimes per lakh
population 7.1 6.3
Crime Against Children,
2015
Total Number of Cases Reported 2,562 94,172
Percentage of cases to All India Total 2.7 100
Rate of Total Cognizable Crimes per lakh
population 18.2 21.1
Human Trafficking
Total Number of Cases Reported 84 8,132
Percentage of cases to All India Total 1.03 100
Rate of Total Cognizable Crimes per lakh
population 0.2 0.6
KIDNAPPING & ABDUCTION
Numberof Incidence 3,046 88,008
Percentage of cases to All India Total 3.5 100
Rate of Total Cognizable Crimes per lakh
population 7.2 6.9
Crime against women,
2016
CRIME AGAINST WOMEN
Total Number of Cases Reported 17,837 3,38,954
Percentage Contribution To All India Total 5.3 100
Rate of Total Cognizable Crimes per lakh
population 84.5 55.2
Number of Rape cases Reported in 2015 2,251 34,651
Number of Rape cases
Reported,2015
Number of Rape cases victims 2,251 34,771
Number of Rape cases Rates 10.8 5.7
Kidnapping &
Abduction of Women
(Total) , 2015
Number of Cases Reported 2,587 59,277
Number of Victims 2,615 60,652
Rate of Crimes per lakh Population 12.4 9.8
Kidnapping & Abduction of Female in 2015

Odisha Profile 2018
162
Items Indicators Odisha India
Kidnapping &
Abduction of Female in
2015
Number of Cases Reported 939 18,101
Number of Victims 952 18,977
Rate of Crimes per lakh Population 4.5 3
Dowry Deaths, 2015
Number of Cases Reported 356 7,634
Number of Victims 356 7646
Rate of Crimes per lakh Population 1.7 1.3
Assault on Women With
Intent To Outrage Her
Modesty 2015
Assault On Women With Intent To Outrage Her
Modesty
Number of Cases Reported 6,499 82,422
Number of Victims 6,515 82,800
Rate of Crimes (per lakh Population ) 31.1 13.6
Sexual Harassment
Sexual Harassment
Number of Cases Reported 886 24,041
Number of Victims 887 24,124
Rate of Crimes (per lakh Population ) 4.2 4
Insult to Modesty of Women (Total)
Insult to Modesty of
Women (Total) , 2015
Number of Cases Reported 472 7,167
Number of Victims 474 7184
Rate of Crimes (per lakh Population ) 2.3 1.2
Immoral Traffic
(Prevention) Act (Total)
, 2015
Number of Cases Reported 35 2,424
Number of Victims 35 3,038
Rate of Crimes per lakh Population 0.2 0.4
Source: National Crime Record Bureau, India

For Improvement and Suggestion Contact
Sri S. Sahoo, ISS
Director,
Economics and Statistics, Odisha
Arthaniti ‘O’ Parisankhyan Bhawan
Heads of Department Building Campus
Bhubaneswar – 751001
Phone : 0674-2391295, FAX-0674-2391897
Mob : 9868214276
Email : [email protected] / [email protected]
Website : www.desorissa.nic.in
Processed at
Computer Centre, Directorate of Economics and Statistics,
Odisha, Bhubaneswar