government quality and the economic returns of transport
TRANSCRIPT

Andrés Rodríguez-Pose with
Riccardo Crescenzi, Marco Di Cataldo London School of Economics
European Investment Bank Institute
Luxembourg, February 18th , 2016
Government quality and the economic
returns of transport infrastructure
investment in European regions

Quality of government and infrastructure investment Rodríguez-Pose
Infrastructure investment is a cornerstone of regional
development strategies in Europe
1. It has been the most important entry in the regional development budget
Transport investments are believed to contribute to
economic convergence
So intense has the investment been that former laggards
have become leaders in transport infrastructure endowment
Returns to infrastructure investment
1

Quality of government and infrastructure investment Rodríguez-Pose
Motorways –
Km (2009) Km Motorways/
1000 Km2 Km Motorways/
10.000 hab. Km Motorways/ 1000 M€ de GDP
EU 15 61,504 18.98 1.53 5.6
Portugal 2,623 (7) 28.49 (5) 2.49 (3) 15.6 (1)
Spain 13,515 (1) 26.77 (6) 2.93 (1) 12.8 (2)
Sweden 1,855 (8) 4.12(14) 1.96 (6) 6.3 (3)
Austria 1,696(10) 20.22 (9) 2.01 (5) 6.2 (4)
France 11,042 (3) 20.08(10) 1.69 (7) 5.8 (5)
Germany 12,645 (2) 35.43 (4) 1.55(10) 5.3 (6)
Belgium 1,763 (9) 57.75 (2) 1.59 (8) 5.2 (7)
Denmark 1,128(11) 26.18 (7) 2.02 (4) 5.1 (8)
Greece 1,103(12) 8.36(12) 0.98(13) 4.7 (9)
Netherlands 2,637 (6) 63.50 (1) 1.58 (9) 4.6 (10)
Italy 6,629 (4) 22.00 (8) 1.09(12) 4.4 (11)
Finland 739(13) 2.19(15) 1.37 (11) 4.3 (12)
Luxembourg 147(15) 56.84 (3) 2.80 (2) 3.9 (13)
Ireland 423(14) 6.04(12) 0.92(14) 2.6 (14)
United Kingdom 3,559 (5) 14.54(11) 0.57(15) 2.3 (15)
Motorway endowment EU15
2

Quality of government and infrastructure investment Rodríguez-Pose 3
Why the emphasis on infrastructure?
1. Economic reasons
- Necessary – albeit not sufficient – factor for economic development
- High economic returns from investment in infrastructure (e.g. Aschauer 1989)
- Especially in times of crisis (counter-cyclical investment)
2. Political reasons
- Transport infrastructure is highly visible
- Generally popular
- And provides many opportunities for ribbon cutting…
3. Management reasons
- Infrastructure projects are generally easy to manage
- Easy to spend large sums relatively quickly
- Non recurrent expenditure

Quality of government and infrastructure investment Rodríguez-Pose
However, transport infrastructure investment has not
always delivered on its economic promises
Two potential explanations:
New economic geography-type explanation
1. Asymmetric impact of changes in accessibility on territories at different
levels of economic development (Vickerman, Martin & Rogers, Puga,
Ottaviano)
o Enhancing overall accessibility may benefit core at the expense of periphery
o Intra-regional transport connections contributes to economic development
of lagging regions
Quality of local institutions
1. Government institutions incapable or with no incentives to implement
interventions that maximise economic efficiency (Farole et al)
Has this investment delivered?
4
Quality of government and infrastructure investment Rodríguez-Pose
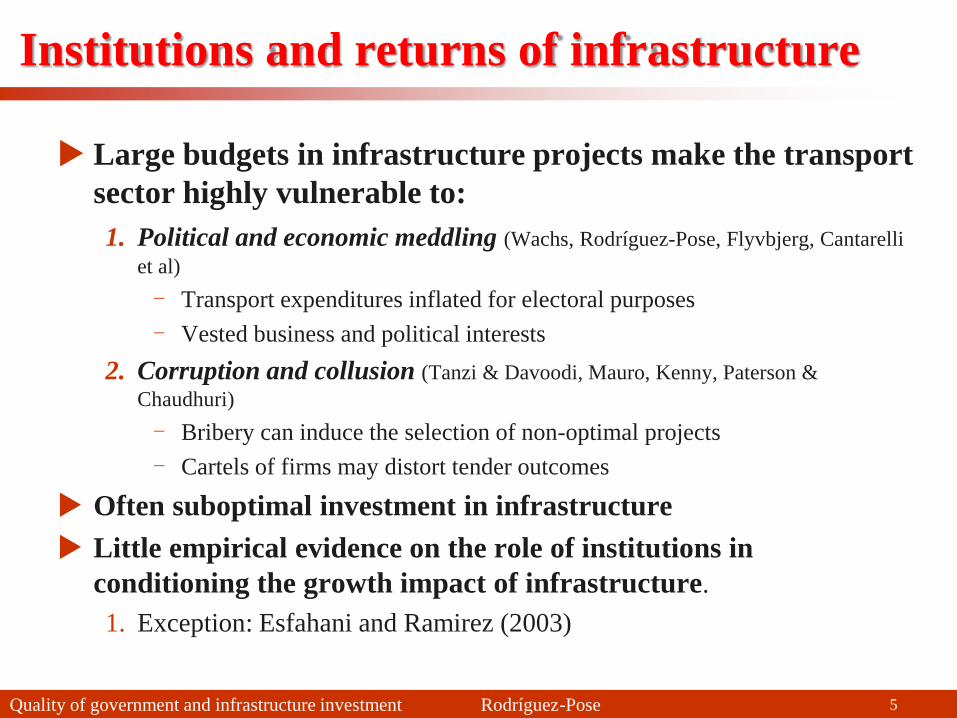
Large budgets in infrastructure projects make the transport
sector highly vulnerable to:
1. Political and economic meddling (Wachs, Rodríguez-Pose, Flyvbjerg, Cantarelli
et al)
- Transport expenditures inflated for electoral purposes
- Vested business and political interests
2. Corruption and collusion (Tanzi & Davoodi, Mauro, Kenny, Paterson &
Chaudhuri)
- Bribery can induce the selection of non-optimal projects
- Cartels of firms may distort tender outcomes
Often suboptimal investment in infrastructure
Little empirical evidence on the role of institutions in
conditioning the growth impact of infrastructure.
1. Exception: Esfahani and Ramirez (2003)
Institutions and returns of infrastructure
5
Quality of government and infrastructure investment Rodríguez-Pose
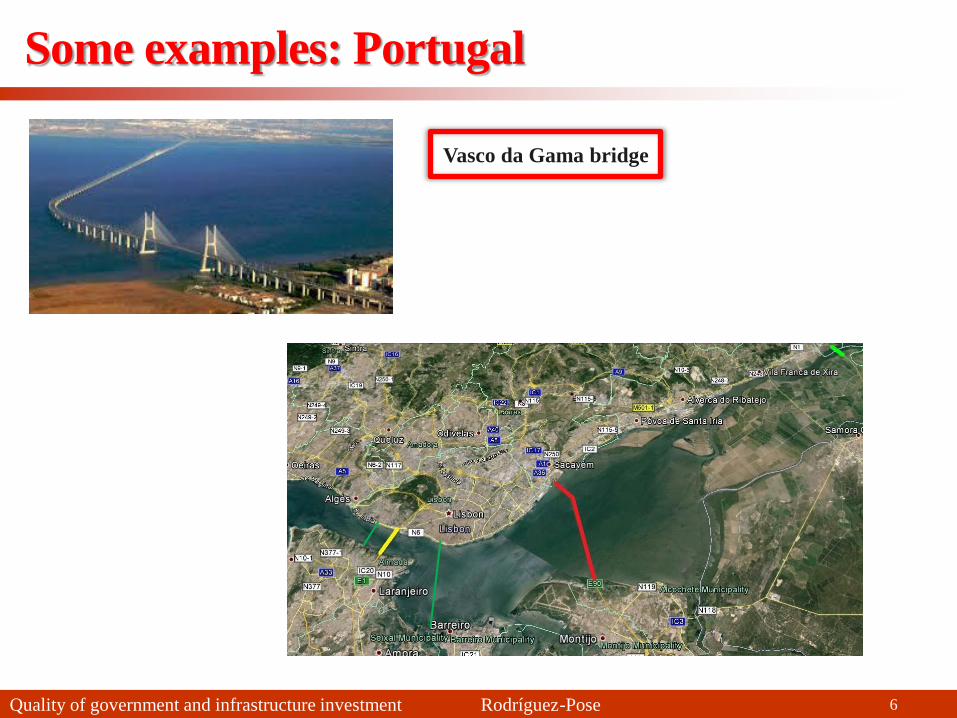
Some examples: Portugal
Vasco da Gama bridge
6
Quality of government and infrastructure investment Rodríguez-Pose
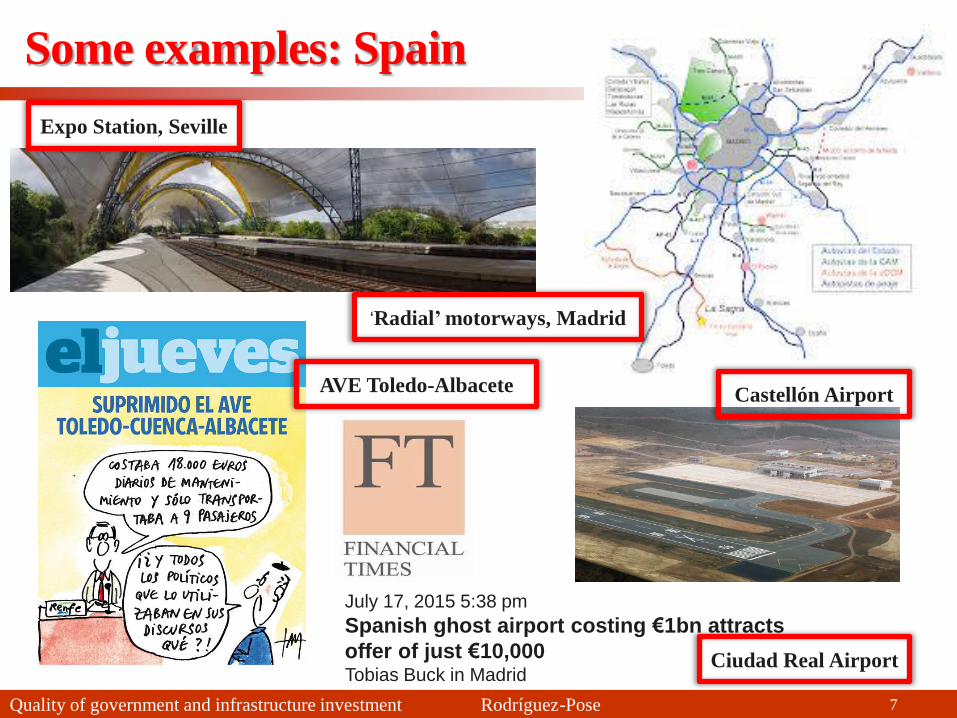
Some examples: Spain
Expo Station, Seville
‘Radial’ motorways, Madrid
Castellón Airport AVE Toledo-Albacete
7
July 17, 2015 5:38 pm
Spanish ghost airport costing €1bn attracts
offer of just €10,000 Tobias Buck in Madrid
Ciudad Real Airport

Quality of government and infrastructure investment Rodríguez-Pose
Analyse whether quality of government has affected the
returns of infrastructure investment
In 166 regions in the EU
Looking at change in road infrastructure
Concentrating in two types of roads:
1. Motorways
2. Secondary roads
The aims
8

Quality of government and infrastructure investment Rodríguez-Pose
Quality of Government Index
The Quality of Government
Institute (University of
Gothenburg) has developed a
survey-based Quality of
Government (QoG) composite
index for Nuts EU-27 regions
Four QoG categories:
1. Control of Corruption
2. Rule of Law
3. Government Effectiveness
4. Voice and Accountability
This can be combined with the
WB Governance Indicators in
order to obtain a longer time-span
9
Quality of government and infrastructure investment Rodríguez-Pose
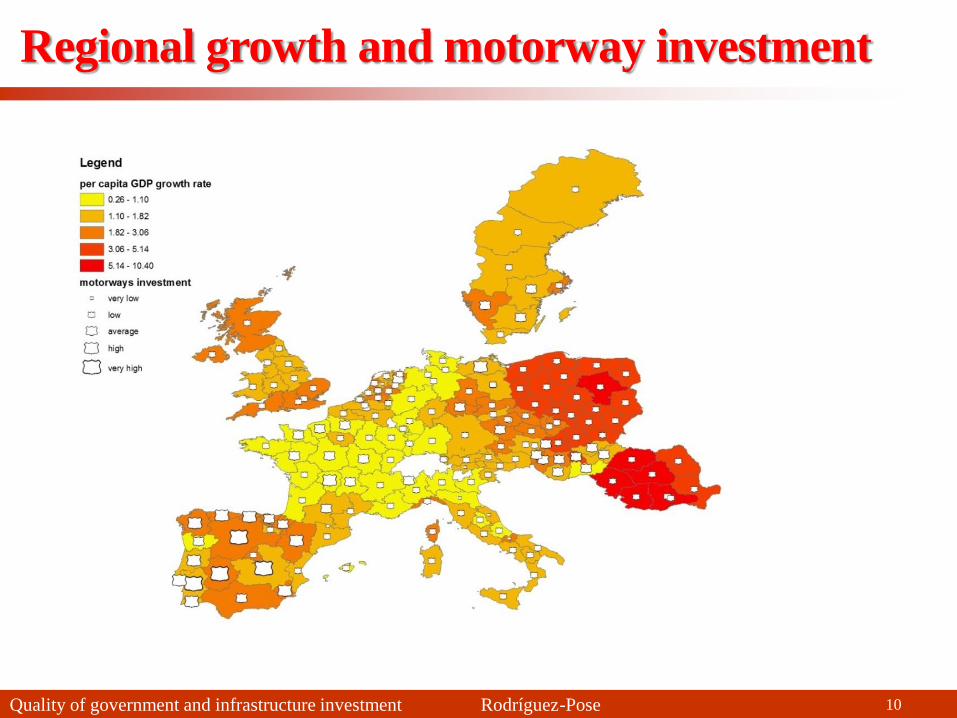
Regional growth and motorway investment
10

Quality of government and infrastructure investment Rodríguez-Pose
Regional growth and secondary roads
11

Quality of government and infrastructure investment Rodríguez-Pose
∆ ln 𝐺𝐷𝑃𝑖,𝑡= 𝛽0 ln 𝐺𝐷𝑃𝑖,𝑡−1 + 𝛽1 𝑰𝒏𝒇𝒓𝒂𝒔𝒕𝒓𝒖𝒄𝒕𝒖𝒓𝒆 𝑰𝒏𝒗𝒆𝒔𝒕𝒎𝒆𝒏𝒕𝒊,𝒕 +
𝛽2 𝑸𝒖𝒂𝒍𝒊𝒕𝒚 𝒐𝒇 𝑮𝒐𝒗𝒆𝒓𝒏𝒎𝒆𝒏𝒕 𝑸𝒐𝑮 𝒊,𝒕 +𝛽3(𝑰𝒏𝒇𝒓𝒂𝒔𝒕𝒓𝒖𝒄𝒕𝒖𝒓𝒆 𝒊𝒏𝒗 ∗ 𝑸𝒐𝑮)𝒊,𝒕+ 𝛽4 𝑊 𝑖𝑛𝑓𝑟 𝑖𝑛𝑣𝑖,𝑡 + 𝛽5 𝐴𝑔𝑟𝑖𝑐 𝐿𝑖,𝑡 +
𝛽6 ln 𝑖𝑛𝑛𝑜𝑣𝑖,𝑡 + 𝛽7 ln 𝐻𝐾𝑖,𝑡 + 𝛽8𝑝𝑜𝑝𝑖,𝑡 + 𝜑𝑖 + 𝜖𝑖,𝑡
Fixed Effects (FE) estimator for panel data with time dummies
Impact on regional GDP growth of:
1. Change in infrastructure endowment
2. Quality of Government
3. The mutual variation of these two variables
Controlling for: initial level of regional GDP, spillover effect from
infrastructure investment, share of labour in agriculture, innovative capacity
(patents application), human capital endowment (employed people with
tertiary education), regional population
Model
12
Quality of government and infrastructure investment Rodríguez-Pose
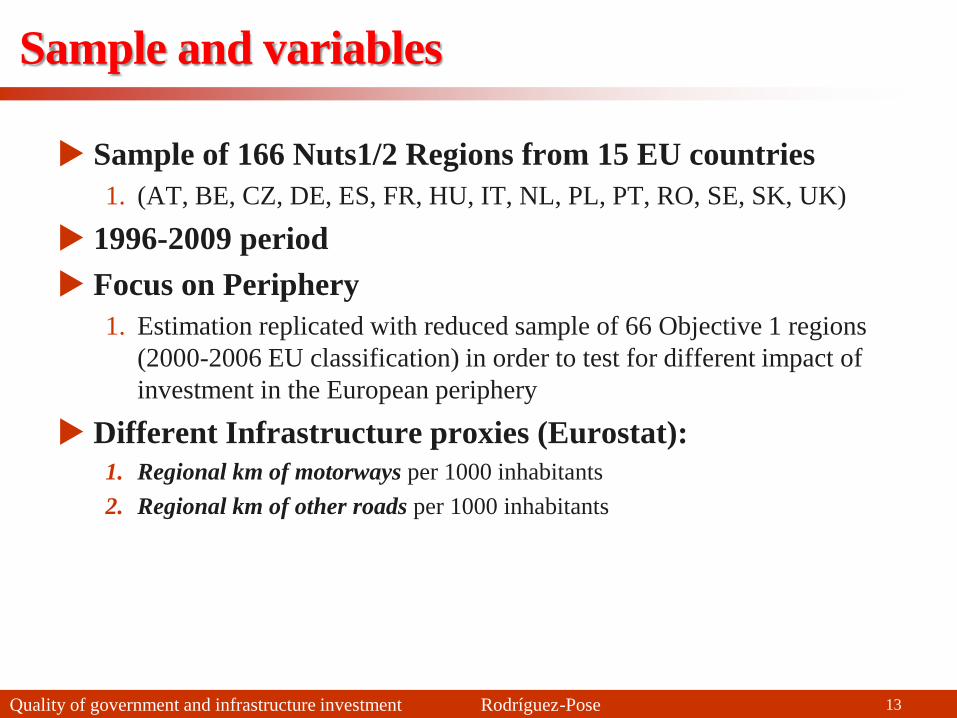
Sample of 166 Nuts1/2 Regions from 15 EU countries
1. (AT, BE, CZ, DE, ES, FR, HU, IT, NL, PL, PT, RO, SE, SK, UK)
1996-2009 period
Focus on Periphery
1. Estimation replicated with reduced sample of 66 Objective 1 regions
(2000-2006 EU classification) in order to test for different impact of
investment in the European periphery
Different Infrastructure proxies (Eurostat):
1. Regional km of motorways per 1000 inhabitants
2. Regional km of other roads per 1000 inhabitants
Sample and variables
13

Quality of government and infrastructure investment Rodríguez-Pose
Dep. variable:
Δ ln GDP
Quality of Government (QoG) Component:
QoG Combined Index Control of
Corruption Rule of Law
Government
Effectiveness
Government
Accountability
Ln of initial GDP -0.0302*** -0.0940*** -0.0901*** -0.0952*** -0.0886*** -0.0787***
(0.0103) (0.0130) (0.0130) (0.0132) (0.0124) (0.0128)
Change in motorways
per 1000 inhabitants
0.126** 0.0847 0.0640 0.0752 0.0695 0.0707
(0.0613) (0.0525) (0.0496) (0.0528) (0.0527) (0.0511)
Quality of Government
(QoG) Component 0.0318*** 0.0346*** 0.0254*** 0.0275*** 0.0215*** 0.00611**
(0.00500) (0.00466) (0.00409) (0.00394) (0.00280) (0.00273)
Interaction term
(motorways
investment)*(QoG)
-0.118 -0.0663 -0.0703 -0.0797 -0.0298 -0.0650
(0.0856) (0.0739) (0.0736) (0.0786) (0.0594) (0.0588)
Spatial Weight of
motorways investment 0.784*** 0.714*** 0.771*** 0.731*** 0.745***
(0.162) (0.149) (0.158) (0.163) (0.154)
Agricultural Employment -0.00285*** -0.00244*** -0.00308*** -0.00293*** -0.00265***
(0.000648) (0.000669) (0.000655) (0.000648) (0.000679)
Ln patents application 0.00657*** 0.00592*** 0.00609*** 0.00624*** 0.00480***
(0.00171) (0.00179) (0.00177) (0.00167) (0.00174)
Ln of employed people
with tertiary education 0.0158*** 0.0107** 0.0202*** 0.0124*** 0.0132***
(0.00469) (0.00472) (0.00459) (0.00471) (0.00495)
Regional population -4.46e-05*** -1.53e-05** -2.33e-05*** -1.66e-05** -1.25e-05 -2.54e-05***
(1.21e-05) (7.52e-06) (6.54e-06) (7.09e-06) (7.69e-06) (7.20e-06)
time effects Yes Yes Yes Yes Yes Yes
Observations 2,293 2,269 2,269 2,269 2,269 2,269
R2 within 0.377 0.458 0.470 0.484 0.481 0.466
Nuts regions 166 166 166 166 166 166
Motorways – Full Sample Positive impact of
motorways
investment when
other growth
determinants are not
accounted for
The coefficient of all
institutional
components is
positive and highly
significant
But their interaction
is insignificant
Controls: positive
network effect from
motorway investment,
positive impact of
innovation and HK
endowment, negative
effect of agricultural
employment
14

Quality of government and infrastructure investment Rodríguez-Pose
Motorways – Peripheral regions
Dep. variable:
Δ ln GDP
Quality of Government (QoG) Component:
QoG Combined
Index
Control of
Corruption Rule of Law
Government
Effectiveness
Government
Accountability
Ln of initial GDP -0.123*** -0.117*** -0.110*** -0.104*** -0.0890***
(0.0201) (0.0215) (0.0204) (0.0187) (0.0208)
Change in motorways per
1000 inhabitants
-0.0478 -0.0837 -0.0500 -0.0353 -0.0737
(0.0773) (0.0729) (0.0825) (0.0647) (0.0715)
Quality of Government (QoG)
Component 0.0603*** 0.0449*** 0.0347*** 0.0384*** 0.0121***
(0.00788) (0.00832) (0.00804) (0.00460) (0.00387)
Interaction term
(motorways
investment)*(QoG)
-0.110 -0.0896 -0.134 -0.114 -0.0334
(0.103) (0.103) (0.110) (0.0857) (0.0632)
Spatial Weight of motorways
investment 0.409** 0.439** 0.291 0.524*** 0.552***
(0.187) (0.184) (0.199) (0.188) (0.195)
Agricultural Employment -0.00292*** -0.00248*** -0.00309*** -0.00319*** -0.00308***
(0.000829) (0.000843) (0.000777) (0.000826) (0.000808)
Ln patents application 0.00748*** 0.00673** 0.00584** 0.00677** 0.00558*
(0.00279) (0.00290) (0.00267) (0.00294) (0.00284)
Ln of employed people with
tertiary education 0.0417*** 0.0296*** 0.0348*** 0.0387*** 0.0266**
(0.0102) (0.00997) (0.00933) (0.01000) (0.0101)
Regional population 1.14e-06 -2.41e-05** -1.35E-05 9.04e-06 -2.43e-05**
(1.12e-05) (9.57e-06) (1.06e-05) (1.19e-05) (1.09e-05)
time effects Yes Yes Yes Yes Yes
Observations 936 936 936 936 936
R2 within 0.449 0.430 0.451 0.423 0.409
Nuts regions 70 70 70 70 70
Insignificant impact
of motorways
investment in the
periphery
Institutions have a
stronger effect
(higher coefficient)
And the interaction
remains insignificant
Controls: spillover
effect sensibly reduced;
magnitude of all other
coefficients has
increased, especially
human capital
15

Quality of government and infrastructure investment Rodríguez-Pose
Other roads – Full Sample
Government quality
confirmed as key
growth determinant
(except for Govt
Accountability)
If associated with
higher levels of
institutional quality,
other roads
investment becomes
a significant driver
of economic
performance
Controls as before.
Positive network effect
from other roads
investment
Investments in other
roads only weakly
correlated with
regional growth Dep. variable:
Δ ln GDP
Quality of Government (QoG) Component:
QoG Combined Index Control of
Corruption Rule of Law
Government
Effectiveness
Government
Accountability
Ln of initial GDP -0.0252** -0.0901*** -0.0910*** -0.0872*** -0.0877*** -0.0816***
(0.0101) (0.0140) (0.0142) (0.0139) (0.0135) (0.0139)
Change in other roads
per 1000 inhabitants
0.00102** 0.000607 0.000831 0.000228 0.000893* 0.000508
(0.000487) (0.000476) (0.000509) (0.000525) (0.000480) (0.000447)
Quality of Government
(QoG) Component 0.0235*** 0.0246*** 0.0212*** 0.0132*** 0.0181*** -0.000716
(0.00484) (0.00436) (0.00431) (0.00347) (0.00257) (0.00266)
Interaction term
(other roads
investment)*(QoG)
0.00157* 0.00234*** 0.00195** 0.00267*** 0.00212** 0.00285***
(0.000829) (0.000873) (0.000965) (0.00101) (0.000816) (0.00103)
Spatial Weight of other
roads investment 0.00366** 0.00351** 0.00342** 0.00346** 0.00317**
(0.00155) (0.00159) (0.00154) (0.00149) (0.00147)
Agricultural Employment -0.00352*** -0.00324*** -0.00359*** -0.00364*** -0.00346***
(0.000626) (0.000643) (0.000641) (0.000610) (0.000648)
Ln patents application 0.00534*** 0.00491*** 0.00451** 0.00529*** 0.00355*
(0.00180) (0.00187) (0.00187) (0.00178) (0.00184)
Ln of employed people
with tertiary education 0.0136*** 0.0102** 0.0143*** 0.0111** 0.00948*
(0.00512) (0.00502) (0.00500) (0.00496) (0.00516)
Regional population -4.46e-05*** -1.53e-05** -2.33e-05*** -1.66e-05** -1.25e-05 -4.46e-05***
(1.21e-05) (7.52e-06) (6.54e-06) (7.09e-06) (7.69e-06) (1.21e-05)
time effects Yes Yes Yes Yes Yes Yes
Observations 2,158 2,134 2,134 2,134 2,134 2,134
R2 within 0.387 0.472 0.470 0.484 0.481 0.466
Nuts regions 161 161 161 161 161 161 16

Quality of government and infrastructure investment Rodríguez-Pose
Dep. variable:
Δ ln GDP
Quality of Government (QoG) Component:
QoG Combined
Index
Control of
Corruption Rule of Law
Government
Effectiveness
Government
Accountability
Ln of initial GDP -0.129*** -0.131*** -0.109*** -0.109*** -0.0934***
(0.0218) (0.0232) (0.0220) (0.0197) (0.0213)
Change in other roads per
1000 inhabitants
0.000401 0.000914* -0.000188 0.000859* 0.000377
(0.000497) (0.000516) (0.000559) (0.000507) (0.000466)
Quality of Government (QoG)
Component 0.0595*** 0.0503*** 0.0272*** 0.0375*** 0.00835*
(0.00801) (0.00953) (0.00698) (0.00445) (0.00498)
Interaction term
(other roads
investment)*(QoG)
0.00352*** 0.00374*** 0.00445*** 0.00273*** 0.00352***
(0.00118) (0.00116) (0.00151) (0.000918) (0.00116)
Spatial Weight of other roads
investment 0.00299 0.00402* 0.00320 0.00200 0.00317*
(0.00204) (0.00214) (0.00194) (0.00194) (0.00186)
Agricultural Employment -0.00339*** -0.00295*** -0.00367*** -0.00362*** -0.00363***
(0.000834) (0.000889) (0.000825) (0.000759) (0.000805)
Ln patents application 0.00753*** 0.00675** 0.00630** 0.00567** 0.00495*
(0.00276) (0.00287) (0.00300) (0.00274) (0.00291)
Ln of employed people with
tertiary education 0.0420*** 0.0305** 0.0338*** 0.0338*** 0.0227*
(0.0134) (0.0127) (0.0127) (0.0113) (0.0119)
Regional population 5.04e-06 -2.01e-05** -1.21e-05 1.29e-05 -2.19e-05**
(8.77e-06) (7.85e-06) (8.12e-06) (9.26e-06) (8.89e-06)
time effects Yes Yes Yes Yes Yes
Observations 876 876 876 876 876
R2 within 0.472 0.460 0.438 0.459 0.431
Nuts regions 66 66 66 66 66
Other roads – Peripheral regions
Weak positive
correlation between
investments in other
roads and growth
QoG always
significant
The better the
institutional quality
and the higher the
investment in local
roads, the higher the
change in regional
GDP
Weak evidence of
spillover effect.
Innovative potential
and human capital
strongly affect growth 17

Quality of government and infrastructure investment Rodríguez-Pose
When fully controlling for all key growth determinants,
large-scale transport projects such as motorways have little
impact on regional economic performance
Investments in small-scale projects enhancing intra-
regional connectivity are paying off especially in less
advanced regions,
1. But only in areas with effective and accountable governments
Less ‘visible’ investments in innovation and education have
a significant growth-enhancing effect. Their impact is
higher in lagging areas
Good institutional conditions appear to be a pre-condition
for well-targeted and economically profitable investments
in infrastructure
Conclusions
18

Andrés Rodríguez-Pose with
Riccardo Crescenzi and Marco di Cataldo
London School of Economics
More information in
http://personal.lse.ac.uk/rodrigu1/
Government quality and the economic
returns of transport infrastructure
investment in European regions
19

Quality of government and infrastructure investment Rodríguez-Pose
Eurostat definition of infrastructure variables (2009). Data from ‘Road, rail and
navigable inland waterways networks at regional level ’ (tran_r_net)
1. Motorways:
Road, specially designed and built for motor traffic, which does not serve properties
bordering on it, and which:
a) Is provided, except at special points or temporarily, with separate carriageways for
traffic in two directions, separated from each other, either by a dividing strip not
intended for traffic, or exceptionally by other means
b) Has no crossings at the same level with any road, railway or tramway track, or
footpath
c) Is especially sign-posted as a motorway and is reserved for specifi c categories of
road motor vehicles.
Entry and exit lanes of motorways are included irrespective of the location of the
sign-posts. Urban motorways are also included
1. Other roads:
The category of Other Roads comprises all motor-roads not classified as motorways:
state roads, provincial roads and communal roads (communal roads sometimes
includes roads without a hard surface)
Variables definition
20

Quality of government and infrastructure investment Rodríguez-Pose
Construction of the QoG Index
Charron et al., 2013:
• 264 simulations on WBGI in order to check robustness to changes in
weighting method and aggregation method
• Four pillars (Control of corruption, Rule of law, Government effectiveness,
Voice and accountability) combined into one single National indicator for
EU-27. Mean 0, Std dev 1.
• Combination of the WBGI index with the EQI 2010 (mean 0; std dev 1):
calculation of national, population-weighted EQI; subtraction of this national
score from regional value of EQI (distance from national level); add of
WBGI country score so that each region has a value centred on WBGI index.
• 95% confidence interval for potential incongruent answers (Spain, Czech
Rep., Romania have higher widest margins of confidence interval)
21