government securities management - landing page · directorate general of budget financing and risk...
TRANSCRIPT

DIRECTORATE OF GOVERNMENT DEBT SECURITIES
DIRECTORATE GENERAL OF BUDGET FINANCING AND RISK MANAGEMENT
MINISTRY OF FINANCE OF THE REPUBLIC OF INDONESIA
GOVERNMENT SECURITIES
MANAGEMENT
JANUARY 11, 2017

OUTLINE
2
1. Government Securities Financing Strategy 2017
2. Government Securities Performance
3. Crisis Management Protocol & Bond Stabilization
Framework
4. Debt Outstanding & Risk Profile
DISCLAIMER: This presentation does not constitute or form part of and should not be construed as an offer to sell or issue or the solicitation of an offer to buy or acquire securities of the Republic in any jurisdiction or as an inducement to enter into investment activity. No part of this presentation, nor the fact of its distribution, should form the basis of, or be relied on in connection with, any contract or commitment or investment decision whatsoever. This presentation is not and should not be construed as financial, legal, tax, investment or other product advice.
Directorate of Government Debt Securities| Directorate General of Budget Financing and Risk Management| Ministry of Finance of The Republic of Indonesia

GOVERNMENT SECURITIES
FINANCING STRATEGY 2017

Directorate of Government Debt Securities| Directorate General of Budget Financing and Risk Management| Ministry of Finance of The Republic of Indonesia
2006 2007 2008 2009 2010 2011 2012 2013 2014 2015 2016* 2017**
Gov't Securities (Net) 35.99 57.17 85.92 99.47 91.10 119.86 159.70 224.67 264.63 362.30 364.90 399.90
Domestic Loan (Net) - - - - 0.39 0.62 0.80 0.47 0.95 0.80 3.39 1.49
Foreign Loan (Net) (26.57) (26.58) (18.41) (12.42) (4.57) (17.80) (23.46) (5.81) (12.35) 15.30 2.53 (16.79)
Others/Non Debt (Net) 20.00 9.14 16.56 25.53 4.62 28.26 38.12 18.05 (4.33) (55.20) (69.01) (54.50)
Budget Deficit, % of GDP 0.87 1.26 0.08 1.58 0.73 1.14 1.80 2.33 2.25 2.50 2.35 2.41
0.87
1.26
0.08
1.58
0.73
1.14
1.80
2.33
2.25
2.50
2.35 2.41
(0.50)
-
0.50
1.00
1.50
2.00
2.50
3.00
-80
-30
20
70
120
170
220
270
320
370
FINANCING TREND, 2006 – 2017
(trillion IDR)
Notes: *Revised Budget 2016 ** Budget 2017
4
Directorate of Government Debt Securities| Directorate General of Budget Financing and Risk Management| Ministry of Finance of The Republic of Indonesia
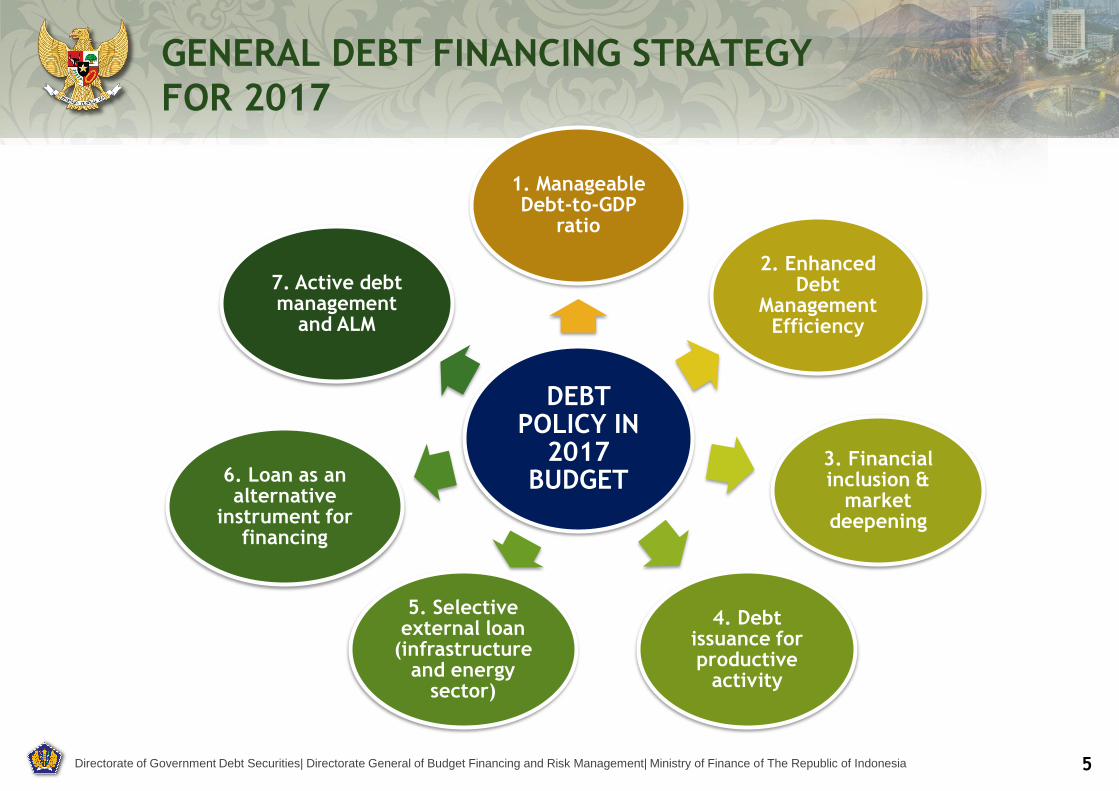
GENERAL DEBT FINANCING STRATEGY
FOR 2017
5
DEBT POLICY IN
2017 BUDGET
1. Manageable Debt-to-GDP
ratio
2. Enhanced Debt
Management Efficiency
3. Financial inclusion &
market deepening
4. Debt issuance for productive
activity
5. Selective external loan
(infrastructure and energy
sector)
6. Loan as an alternative
instrument for financing
7. Active debt management
and ALM

Macro Assumptions for 2017 Government Budget
• Economic Growth: 5.1% • Inflation: 4.0% • Exchange Rate: Rp13,300/USD • 3-Month Govt. Treasury Bills:
5.3% • ICP: USD45/barrel • Oil Lifting: 815 thousand
barrels/day • Gas Lifting: 1,150 thousand
barrels of oil equivalent per day
Description 2016 R-Budget 2017
A. Total Revenue 1,786.2 1,750.3
I. Domestic Revenue 1,784.2 1,748.9
1. Taxation 1,539.2 1,498.9
2. Non-Taxation 245.1 250.0
II. Grant 2.0 1.4
B. Government Spending 2,082.9 2,080.5
I. Central Government Spending 1,306.7 1,314.0
1. Ministerial Spending 767.8 757.6
2. Non-Ministerial Spending 538.9 556.4
II. Transfer to Region and Village Fund 776.3 766.4
1. Transfer to Region 729.3 706.4
2. Village Fund 47.0 60.0
C. Primary Balance (105.5) (109.0)
D. Budget Deficit over GDP (296.7) (330.2)
Deficit to GDP (%) (2.35%) (2.41%)
E. Financing (I + II + III + IV + V) 296.7 330.2
I. Debt Financing 371.6 384.7
• Government Securities (net) 364.9 400.0
II. Investment Financing (94.0) (47.5)
III. Lending 0.5 (6.4)
IV. Guarantee Liability (0.7) (0.9)
V. Other Financing 19.3 0.3
GOVERNMENT BUDGET FOR 2017
6

Directorate of Government Debt Securities| Directorate General of Budget Financing and Risk Management| Ministry of Finance of The Republic of Indonesia
Debt (Gross)
IDR735.6tn
Redemption
IDR350.9tn
Budget Financing
IDR330.2tn
Non-Debt Financing
IDR54.5tn
Breakdown of Budget Financing IDRtn US$bn
Government debt (net) 384.69 28.36
Government securities (net) 399.99 29.49
Issuance 684.84 50.49
Redemption & cash management (281.84) (20.78)
Debt portfolio management (3.00) (0.22)
Domestic loans (net) 1.49 0.11
Withdrawal 2.50 0.19
Redemption (1.01) (0.07)
Foreign loans (net) (16.79) (1.24)
Withdrawal 48.29 3.56
Redemption (65.08) (4.80)
BUDGET FINANCING BREAKDOWN IN 2017
US$/IDR: 13,563 as of 30 Nov. 2016
7

Directorate of Government Debt Securities| Directorate General of Budget Financing and Risk Management| Ministry of Finance of The Republic of Indonesia
GOVERNMENT SECURITIES – INDICATIVE FINANCING
PLAN FOR 2017
International Bonds Issuance (USD, EUR, JPY-denominated)
Issuance of International Bonds as complement to avoid crowding out in domestic market consists of USD, YEN or EURO global bonds;
International bond issuance can be maximized up to 25% from gross target, depends on financing need.
Government Debt Securities (SUN): 71 %; Sukuk : 29% ATM for Government Securities (SBN): 7-9 years.
Domestic Issuance
Issuance targets for GDS, Sukuk and ATM target
Weekly Auction: Conventional Securities: 24x Islamic Securities: 24x
Non-Auction: Retail bonds Private Placements: Based on request
Instruments Indicative Target (IDR tn)
2017 Budget
Government Securities (Net) 399,993
Redemption 162,842
Cash Management 119,000
Buyback 3,000
Government Securities (Gross) 684,835
Composition
Domestic 83%
Auction 93%
Non-Auction 7%
International Bond 17%
8
Pre-funding to optimize cost ahead of potential Fed rate hike Anticipate developments in global environment Government Securities target for 1st semester 2017 is 59.3%
from gross issuance target; Government Securities target in Rupiah for 1st semester 2017 is
45.7% from gross issuance target.
Front loading issuance for budget financing

Directorate of Government Debt Securities| Directorate General of Budget Financing and Risk Management| Ministry of Finance of The Republic of Indonesia
(In Million IDR)
2017 SECURITIES FINANCING REALIZATION
Budget 2017Budget Realization
(a.o. January 11, 2017)
% Realization to
Budget 2017
Government Securities Net 399,992,586 61,603,857 15.40%
Government Securities Maturing in 2017 and Buyback 284,842,264 7,000,000 2.46%
Issuance Need for 2017 684,834,850 68,603,857 10.02%
Government Debt Securities (GDS) 62,026,000
Domestic GDS 15,000,000
-Coupon GDS 3,600,000
-Conventional T-Bills 11,400,000
-Private Placement* -
-Retail Bonds -
International Bonds 47,026,000
-USD GMTN 47,026,000
-Euro GMTN -
-Samurai Bonds -
-Domestic USD Bonds -
Government Islamic Debt Securities 6,577,857
Domestic Government Islamic Debt Securities 6,577,857
- IFR/PBS/T-Bills Sukuk (Islamic Fixed Rated Bond/Project Based Sukuk) 6,577,857
- Retail Sukuk -
- Private Placement -
Global Sukuk -

GOVERNMENT SECURITIES
PERFORMANCE

Directorate of Government Debt Securities| Directorate General of Budget Financing and Risk Management| Ministry of Finance of The Republic of Indonesia
0%
50%
100%
150%
200%
250%
300%
350%
400%
450%
500%
-
20,000
40,000
60,000
80,000
100,000
120,000
Jan-16 Feb-16 Mar-16 Apr-16 May-16 Jun-16 Jul-16 Aug-16 Sep-16 Oct-16 Nov-16 6-Dec-16
Incoming Bids Awarded Bids % Bid to Cover Ratio (RHS) % Foreign Incoming Bids (RHS)
11
as of Dec.6, 2016
Average awarded bids
2016 = Rp13.37T/auction
Average Incoming Bid 2015 = Rp20.84T while Average Awarded Bid 2015 = Rp10.59T
Average incoming bids
2016 = Rp25.55T/auction
11
GDS PRIMARY MARKET PERFORMANCE 2016 THROUGH AUCTION

Directorate of Government Debt Securities| Directorate General of Budget Financing and Risk Management| Ministry of Finance of The Republic of Indonesia
0%
50%
100%
150%
200%
250%
300%
350%
400%
450%
500%
-
20,000
40,000
60,000
80,000
100,000
120,000
140,000
160,000
Jan-16 Feb-16 Mar-16 Apr-16 May-16 Jun-16 Jul-16 Aug-16 Sep-16 Oct-16 Nov-16 6-Dec-16
Incoming Bids Awarded Bids % Bid to Cover Ratio (RHS)
12
as of Dec. 6, 2016
Average Incoming Bid
2016 = Rp19.05T/auction
Average Awarded bids
2016 = Rp9.37T/auction
GS PRIMARY MARKET PERFORMANCE 2016
Average Incoming Bid 2015 = Rp14.05T, while Average Awarded Bid 2015 = Rp6.75T
12
THROUGH AUCTION
Directorate of Government Debt Securities| Directorate General of Budget Financing and Risk Management| Ministry of Finance of The Republic of Indonesia
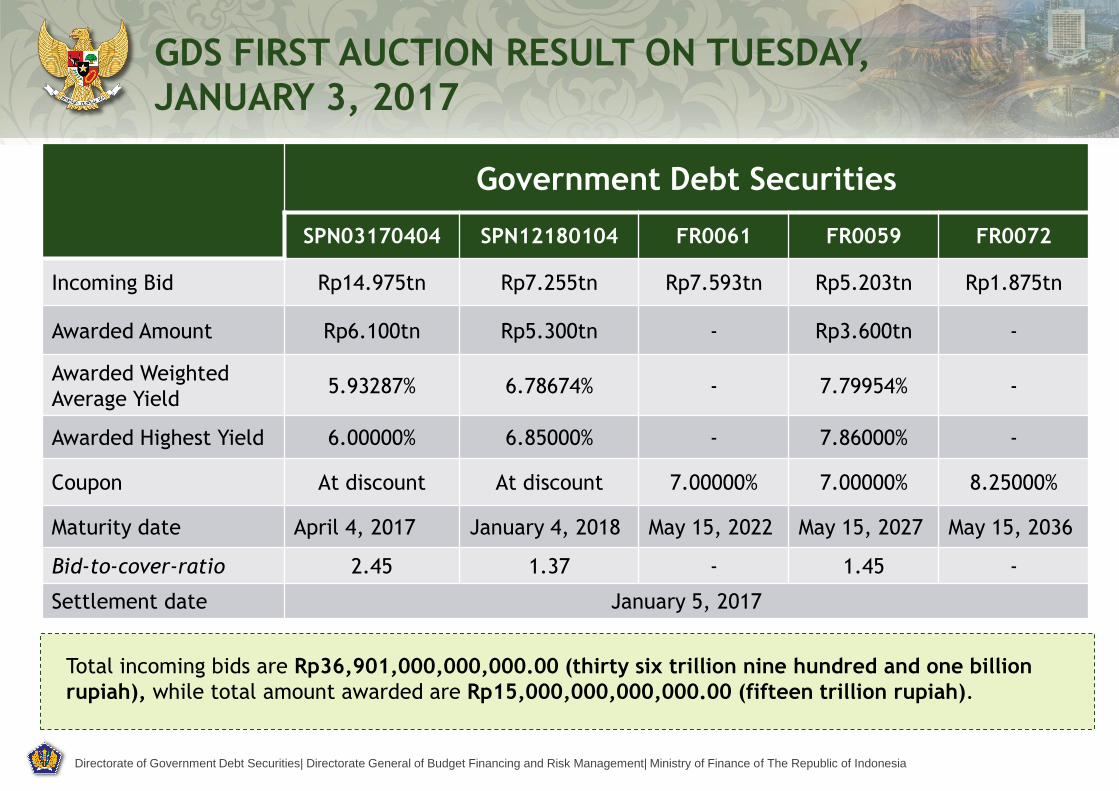
GDS FIRST AUCTION RESULT ON TUESDAY,
JANUARY 3, 2017
Government Debt Securities
SPN03170404 SPN12180104 FR0061 FR0059 FR0072
Incoming Bid Rp14.975tn Rp7.255tn Rp7.593tn Rp5.203tn Rp1.875tn
Awarded Amount Rp6.100tn Rp5.300tn - Rp3.600tn -
Awarded Weighted
Average Yield 5.93287% 6.78674% - 7.79954% -
Awarded Highest Yield 6.00000% 6.85000% - 7.86000% -
Coupon At discount At discount 7.00000% 7.00000% 8.25000%
Maturity date April 4, 2017 January 4, 2018 May 15, 2022 May 15, 2027 May 15, 2036
Bid-to-cover-ratio 2.45 1.37 - 1.45 -
Settlement date January 5, 2017
Total incoming bids are Rp36,901,000,000,000.00 (thirty six trillion nine hundred and one billion
rupiah), while total amount awarded are Rp15,000,000,000,000.00 (fifteen trillion rupiah).

Directorate of Government Debt Securities| Directorate General of Budget Financing and Risk Management| Ministry of Finance of The Republic of Indonesia
0.000
5.000
10.000
15.000
20.000
25.000
30.000
35.000
40.000
Spread (bid-ask)
5.88 5.73 5.31 7.91 9.38 8.19 9.54 5.18
0.16 0.38 0.25
0.76 0.72
0.68 0.61
0.79
1.54 3.07
6.46
8.80
10.15 12.09
15.50
24.44
-
10.00
20.00
30.00
40.00
2011 2012 2013 2014 2015 Des-16 2016 s.d 10 Jan'17
OUTRIGHT REPO BANK REPO BI
2
4
6
8
10
12
14
16
18
20
22
Dec'1
0
Mar'1
1
Jun'1
1
Sep'1
1
Dec'1
1
Mar'1
2
Jun'1
2
Sep'1
2
Dec'1
2
Mar'1
3
Jun'1
3
Sep'1
3
Dec'1
3
Mar'1
4
Jun'1
4
Sep'1
4
Dec'1
4
Mar'1
5
Jun'1
5
Sep'1
5
Dec'1
5
Mar'1
6
Jun'1
6
Sep'1
6
Dec'1
6
5Y 10Y 15Y 20Y
7.47 (5Y), 7.87 (10Y), 8.04 (15Y), 8.07 (20Y)
As of Jan. 11, 2017
[In Percentage]
Average Daily Trading Yields of Benchmark Series
Bid Ask Spread 10 Y Government Bond Turn Over 10 Y Government Bond
SECONDARY MARKET PERFORMANCE
Spread 7.878 bps
Ask 7.511 Bid 7.918
As of Jan. 2017
14
As of Jan. 10, 2017
0
100
200
300
400
500
600
700
800
0
2
4
6
8
10
12
14
Jan-13 Jul-13 Jan-14 Jul-14 Jan-15 Jul-15 Jan-16 Jul-16 Jan-17
[%] [Rp Triliun]
Non Residen [RHS]
Yield 10 Y [LHS]

Directorate of Government Debt Securities| Directorate General of Budget Financing and Risk Management| Ministry of Finance of The Republic of Indonesia
-
2
4
6
8
10
12
14
16
18
20
22
1Y 2Y 3Y 4Y 5Y 6Y 7Y 8Y 9Y 10Y 15Y 20Y 30Y
11 Jan '17 4 Jan '17 13 Dec '16 9 Feb '12
22 Sep '11 27 Oct '08 13 Sep'05
[in percentage]
• Market Watch as of Jan. 11, 2017
• Source: Asian Bonds Online
YIELD GOVT BONDS ON PEER’S MARKET
Source: IDMA, Bloomberg, as of Jan. 11, 2017
LCY 10 Year
Government
Bonds
Latest Yield YTD Change (BP) MTD
Change (BP)
HK 1.785 -18.9 -18.9
ID 7.786 -18.7 -18.7
JP 0.059 +1.3 +1.3
KR 2.137 +4.5 +4.5
MY 4.233 +0.5 +0.5
PH 4.918 +29.0 +29.0
SG 2.407 -6.7 -6.7
TH 2.740 +9.2 +9.2
US 2.365 -8.0 -8.0
VN 6.367 -0.8 -0.8
15

Directorate of Government Debt Securities| Directorate General of Budget Financing and Risk Management| Ministry of Finance of The Republic of Indonesia
OWNERSHIP OF TRADABLE DOMESTIC
GOVERNMENT SECURITIES
(in trillion IDR)
1) Non Resident consists of Private Bank, Fund/Asset Manager, Securities Company, Insurance Company, and Pension Fund.
2) Others such as Securities Company, Corporation, and Foundation.
*) Including the Government Securities used in monetary operation with Bank Indonesia.
**) net, excluding Government Securities used in monetary operation with Banks.
16
Description
Banks* 375.55 31.04% 350.07 23.95% 361.54 21.95% 399.46 22.53% 470.01 26.39%
Govt Institutions (Bank Indonesia**) 41.63 3.44% 148.91 10.19% 150.13 9.12% 134.25 7.57% 67.72 3.80%
Bank Indonesia (gross) 149.07 9.05% 157.88 8.90% 159.23 8.94%
GS used for Monetary Operation -1.05 -0.06% 23.63 1.33% 91.51 5.14%
Non-Banks 792.78 65.52% 962.86 65.87% 1135.18 68.93% 1239.57 69.90% 1243.55 69.81%
Mutual Funds 45.79 3.78% 61.60 4.21% 76.44 4.64% 85.66 4.83% 86.47 4.85%
Insurance Company 150.60 12.45% 171.62 11.74% 214.47 13.02% 238.24 13.43% 238.03 13.36%
Foreign Holders 461.35 38.13% 558.52 38.21% 643.99 39.10% 665.81 37.55% 670.00 37.61%
Foreign Govt's&Central Banks 103.42 8.55% 110.32 7.55% 118.53 7.20% 120.84 6.81% 120.09 6.74%
Pension Fund 43.30 3.58% 49.83 3.41% 64.67 3.93% 87.28 4.92% 87.24 4.90%
Individual 30.41 2.51% 42.53 2.91% 48.90 2.97% 57.75 3.26% 57.82 3.25%
Others 60.51 5.00% 78.50 5.37% 86.72 5.27% 104.84 5.91% 103.99 5.84%
Total 1,209.96 100% 1,461.85 100% 1,646.85 100% 1,773.28 100% 1,781.28 100%
Dec-16 10-Jan-17Jun-16Dec-15Dec-14

Directorate of Government Debt Securities| Directorate General of Budget Financing and Risk Management| Ministry of Finance of The Republic of Indonesia
-
10
20
30
40
50
De
c-0
3
Ap
r-0
4
Au
g-0
4
De
c-0
4
Ap
r-0
5
Au
g-0
5
De
c-0
5
Ap
r-0
6
Au
g-0
6
De
c-0
6
Ap
r-0
7
Au
g-0
7
De
c-0
7
Ap
r-0
8
Au
g-0
8
De
c-0
8
Ap
r-0
9
Au
g-0
9
De
c-0
9
Ap
r-1
0
Au
g-1
0
De
c-1
0
Ap
r-1
1
Au
g-1
1
De
c-1
1
Ap
r-1
2
Au
g-1
2
De
c-1
2
Ap
r-1
3
Au
g-1
3
De
c-1
3
Ap
r-1
4
Au
g-1
4
De
c-1
4
Ap
r-1
5
Au
g-1
5
De
c-1
5
Ap
r-1
6
Au
g-1
6
Indonesia Jepang Korea Selatan Malaysia Thailand
Reflecting increasing investor’s confidence over Indonesia credit story
Countries Sep 16 Mar 16 Dec 15 Mar 15 Dec 14 Mar 08 Dec 03
Indonesia 39.16% 38.48% 38.21% 38.61% 38.13% 16.20% 1.55%
Japan 10.27% 10.72% 9.08% 9.33% 7.37% 3.13%
Korea Selatan 9.70% 10.05% 10.90% 10.81% 8.22% 0.26%
Malaysia 35.75% 33.06% 31.70% 30.20% 29.02% 19.62%
Thailand 13.59% 14.23% 17.35% 18.30% 1.76% 1.27%
FOREIGN OWNERSHIP IN GOVERNMENT BONDS
ACROSS ASIA

Directorate of Government Debt Securities| Directorate General of Budget Financing and Risk Management| Ministry of Finance of The Republic of Indonesia
63.17
18.63
15.81
21.02
97.17
6.52
12.12
17.44
27.22
28.64
24.00
66.36
107.34
37.31
15.27
26.15
- 20 40 60 80 100 120
Banks*
Bank Indonesia**
Mutual Fund
Insurance Company
Foreign Holders
Pension Fund
Individual
Others
RP TRILIUN
INV
ES
TO
R T
YP
E
NET BUY DECEMBER YTD 2016 NET BUY DECEMBER YTD 2015
18
LOCAL INSURANCE AND PENSION FUND INCREASED
THEIR GOVT SECURITIES PORTFOLIO SIGNIFICANTLY
[In trillion IDR]
18
*) Net, excluding Government Securities used in monetary operation with Banks.
**) Gross, including the Government Securities used in monetary operation with Bank Indonesia.

Directorate of Government Debt Securities| Directorate General of Budget Financing and Risk Management| Ministry of Finance of The Republic of Indonesia
FSA (OJK) Regulation No 1/POJK.05/2016* on Investment in Government Securities for Non-Bank Financial Institution
Life Insurance Company
Min. 20% of total investment ( by Dec.
31 2016).
Min 30% of total investment ( by Dec.
31 2017).
General Insurance, Reinsurance & Guarantee
Company
Min. 10% of total investment ( by Dec.
31 2016).
Min. 20% of total investment ( by Dec.
31 2017).
Employer Pension Fund
Min. 20% of total investment ( by Dec.
31 2016)
Min 30% of total investment ( by Dec.
31 2017).
BPJS Ketenagakerjaan (The Social Security
Administration Body for Employment)
Min. 50% of total investment of
Employment Social Security Fund (by Dec. 31 2016).
Min. 30% of total portfolio investment
of BPJS Ketenagakerjaan (by
Dec. 31 2016)
BPJS Kesehatan (Healthcare Social Security Agency)
Min. 30% of total investment of BPJS Kesehatan (by Dec.
31 2016).
DOMESTIC INSTITUTIONAL INVESTORS
19
*Since November 14, 2016 this regulation is revised to be FSA (OJK) Regulation No.36/POJK.05/2016 . The revised regulation has added
SOE infrastructure bonds as instrument other than Gov’t Securities that can be utilized to fulfill the minimum investment requirement.

Directorate of Government Debt Securities| Directorate General of Budget Financing and Risk Management| Ministry of Finance of The Republic of Indonesia
4.82
16.49 15.77 16.10
20.15
6.43
14.67 15.95
13.17 12.49
21.34
(19.84)
39.48
6.84
(3.59)
4.10 6.31
23.04
(3.90)
(7.96)
(2.30)
5.39
8.38
21.37 19.80
9.46
18.30 20.09
(4.21)
22.03
15.04
9.06
16.89
(9.35)
(19.58)
9.35 9.75
4.20
-0.08
-0.06
-0.04
-0.02
0
0.02
0.04
0.06
0.08
0.1
(30.00)
(20.00)
(10.00)
0.00
10.00
20.00
30.00
40.00
50.00
Ja
n-1
4
Ma
r-1
4
Ma
y-1
4
Ju
l-1
4
Se
p-1
4
No
v-1
4
Ja
n-1
5
Ma
r-1
5
Ma
y-1
5
Ju
l-1
5
Se
p-1
5
No
v-1
5
Ja
n-1
6
Ma
r-1
6
Ma
y-1
6
Ju
l-1
6
Se
p-1
6
No
v-1
6
Ja
n-1
7
Capital Inflows [LHS] capital inflows over foreign [RHS]
FOREIGN INVESTOR ACTIVITY
Monthly Net Buyer (Seller) - Non Resident Foreign Ownership - Proportion by Tenor
[In IDR Trillion]
FOREIGN INVESTORS MOSTLY DOMINATED BY HIGH QUALITY LONG TERM INVESTORS
As of Jan. 10, 2017
20
5.20% 4.65% 3.23% 3.04% 3.54% 2.69% 3.50% 1.86%
5.41% 3.73%1.28% 1.55% 1.82% 2.62%
5.35%2.16%
12.88% 15.23%
11.82% 11.89% 10.78% 11.13%
17.75%
17.97%
32.04% 33.58%
38.98% 38.36% 36.92% 35.85%
37.43%
38.86%
44.46% 42.81% 44.68% 45.16% 46.95% 47.72%
35.96% 39.16%
32.54%
38.13% 38.21% 38.94% 38.85% 39.10% 37.55% 37.61%
0%
20%
40%
60%
80%
100%
Dec 13 Dec 14 Dec-15 Jan-16 Apr-16 Jun-16 Dec-16 10-Jan-16
0-1 ≥1-2 ≥2-5 ≥5-10 ≥10 %Foreign Ownership of Total
Directorate of Government Debt Securities| Directorate General of Budget Financing and Risk Management| Ministry of Finance of The Republic of Indonesia
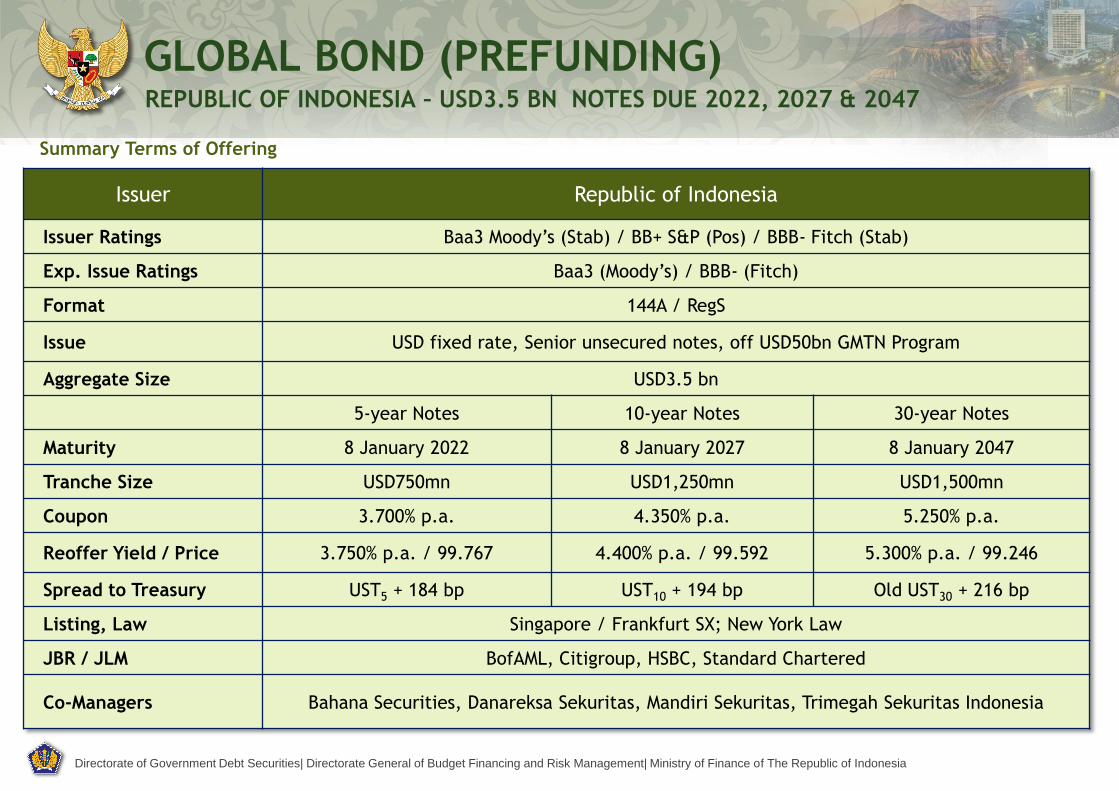
Issuer Republic of Indonesia
Issuer Ratings Baa3 Moody’s (Stab) / BB+ S&P (Pos) / BBB- Fitch (Stab)
Exp. Issue Ratings Baa3 (Moody’s) / BBB- (Fitch)
Format 144A / RegS
Issue USD fixed rate, Senior unsecured notes, off USD50bn GMTN Program
Aggregate Size USD3.5 bn
5-year Notes 10-year Notes 30-year Notes
Maturity 8 January 2022 8 January 2027 8 January 2047
Tranche Size USD750mn USD1,250mn USD1,500mn
Coupon 3.700% p.a. 4.350% p.a. 5.250% p.a.
Reoffer Yield / Price 3.750% p.a. / 99.767 4.400% p.a. / 99.592 5.300% p.a. / 99.246
Spread to Treasury UST5 + 184 bp UST10 + 194 bp Old UST30 + 216 bp
Listing, Law Singapore / Frankfurt SX; New York Law
JBR / JLM BofAML, Citigroup, HSBC, Standard Chartered
Co-Managers Bahana Securities, Danareksa Sekuritas, Mandiri Sekuritas, Trimegah Sekuritas Indonesia
GLOBAL BOND (PREFUNDING)
Summary Terms of Offering
REPUBLIC OF INDONESIA – USD3.5 BN NOTES DUE 2022, 2027 & 2047

CRISIS MANAGEMENT PROTOCOL & BOND STABILIZATION FRAMEWORK

Directorate of Government Debt Securities| Directorate General of Budget Financing and Risk Management| Ministry of Finance of The Republic of Indonesia
Pre-emptive Measures
Implementing Crisis Management Protocol (CMP)
Implementing Bond Stabilization Framework (BSF)
Enhancing coordination between government
institutions and continuous dialogue with market
participants
Specific policies in place to address crises enacted in
2016 budget law
Swap facility arrangements based on international
cooperation
Crisis Management Protocol
Indicators to determine crisis level of Government
Securities Market condition (normal, aware, alert,
crisis)
Several market indicators that are monitored daily:
- Yield of benchmark series;
- Exchange rate;
- Jakarta Composite Index;
- Foreign ownership in government securities
Policies to address the crisis at every level :
- Repurchase the government securities at
secondary market
- Postpone or stop the issuance
First Line of Defense
State’s Budget
Buyback fund at DG of Budget Financing
and Risk Management
Investment fund at Public Service Agency
(BLU) (min. level Aware)
State Owned Enterprises
(BUMN)’s Budget Related BUMNs (min. level Aware)
Social Security Organizing
Agency (BPJS)’s Budget BPJS (min. level Aware)
Second Line of Defense
State’s Budget
State General Treasury Account (Rekening
KUN) (min. level Alert)
Accumulated cash surplus (SAL) (min.
Level Crisis)
State Owned Enterprises
(BUMN)’s Budget Related BUMNs (min. level Alert)
Social Security Organizing
Agency (BPJS)’s Budget BPJS (min. level Alert)
Bond Stabilization Framework
IMPLEMENT MEASURES TO MANAGE EXTERNAL VOLATILITY …TO MITIGATE SUDDEN REVERSALS
23

DEBT OUTSTANDING & RISK PROFILE

0
20
40
60
80
100
120
140
160
180
200
220
240
Domestic Foreign
-
20
40
60
80
100
120
140
160
180
200
220
240
Loan Gov't Sec
TOTAL DEBT MATURITY PROFILE AS OF END OF NOVEMBER, 2016
25
42%
58%
Domestic Foreign
Maturity Profile of Central Government by Currencies (in trillion IDR)
79%
21%
Gov't Sec Loan
Maturity Profile of Central Government by Instruments (in trillion IDR)

Directorate of Government Debt Securities| Directorate General of Budget Financing and Risk Management| Ministry of Finance of The Republic of Indonesia
Notes: *) Not included accrued interest IDR 35.21 Trillion
OUTSTANDING CENTRAL GOVERNMENT DEBT
BY INSTRUMENT
26
Nominal %
a. Foreign Loan (in billion USD) 68.6 68.4 63.6 58.4 54.2 54.4 54.5 21.2%
Bilateral 42.3 42.1 37.2 31.5 26.9 24.7 24.1 9.4%
Multilateral 23.2 23.5 23.8 23.7 23.5 26.1 27.0 10.5%
Commercial 3.0 2.8 2.5 3.3 3.8 3.6 3.4 1.3%
Suppliers 0.1 0.1 0.0 0.0 0.0 0.0 0.0 0.0%
b Domestic Loan (in billion USD) 0.0 0.1 0.19 0.2 0.3 0.3 0.4 0.1%
c. Government Securities (in billion USD) 118.4 131.0 140.8 136.3 155.2 174.7 202.1 78.6%
Foreign Currency Denominated 18.0 21.6 27.4 32.8 36.7 47.8 53.7 20.9%
Rupiah Denominated 100.4 109.4 113.4 103.5 118.5 126.9 148.4 57.7%
Total Central Government Debt
(in billion USD)187.0 199.5 194.9 209.7 229.4 257.0
Total Central Government Debt
(in trilion IDR)1,681.7 1,808.9 2,375.5 2,608.8 3,165.1 3,485.4
Exchange Rate Assumption (IDR/USD1) 8,991.0 9,068.0 12,189.0 12,440.0 13,795.0 13,563.0
GDP (in trillion IDR) 6,864.1 7,831.7 9,524.7 10,542.7 11,540.8
Debt to GDP Ratio 24.5% 23.1% 23.0% 24.9% 24.7% 27.4%
2010Description
Nov. 16*)
2011 2012 2013 2014 2015
204.5
1,977.7
9,670.0
8,615.7

Directorate of Government Debt Securities| Directorate General of Budget Financing and Risk Management| Ministry of Finance of The Republic of Indonesia
OUTSTANDING CENTRAL GOVERNMENT DEBT
BY CURRENCY
Notes: *) Preliminary Figures **) Not included accrued interest IDR 35.21 Trillion
27
Description 2011 2015*)
Original Currency
IDR (in trillion) 993.0 1,098.0 1,263.9 1,477.8 1,755.2 2,017.2
Gov't Securities 992.0 1,096.2 1,261.7 1,474.6 1,751.1 2,012.1
Loan 1.0 1.8 2.2 3.2 4.1 5.1
USD (in billion) 43.9 49.8 56.8 61.0 73.3 76.2
Gov't Securities 20.4 25.6 31.3 34.2 43.2 45.0
Loan 23.5 24.2 25.4 26.8 30.1 31.2
JPY (in billion) 2,589.8 2,498.8 2,395.3 2,223.1 2,143.4 2,088.8
Gov't Securities 95.0 155.0 155.0 155.0 255.0 355.0
Loan 2,494.8 2,343.8 2,228.8 2,068.1 1,888.4 1,733.8
EUR (in billion) 5.0 4.5 4.2 5.1 6.2 9.0
Gov't Securities - - - 1.0 2.3 5.3
Loan 5.0 4.5 4.2 4.1 3.9 3.7
Other currencies
Equivalent in Billion USD
IDR 109.5 113.5 103.7 118.8 127.2 148.8 57.9%
USD 43.9 49.8 56.8 61.0 73.3 76.2 29.6%
JPY 33.4 29.1 22.8 18.6 17.8 18.6 7.2%
EUR 6.4 6.0 5.8 6.3 6.7 9.5 3.7%
Other currencies 6.3 6.1 5.8 5.1 4.4 3.9 1.5%
Total Eq. in Billion USD 199.5 204.5 194.9 209.7 229.4 257.0
Equivalent in Trillion IDR
IDR 993.0 1,098.0 1,263.9 1,477.8 1,755.2 2,006.1
USD 397.9 481.9 692.0 758.6 1,009.2 993.2
JPY 302.5 281.2 278.3 231.8 245.5 260.6
EUR 58.5 57.5 71.1 77.7 92.4 127.8
Other currencies 57.1 59.1 70.2 62.9 62.9 52.0
Total Eq. in Trillion IDR 1,808.9 1,977.7 2,375.5 2,608.8 3,165.1 3,439.8
Foreign Currency Portion 45.1% 44.5% 46.8% 43.4% 44.5% 41.7%
Exchange Rate Assumption USD/IDR 9,068 9,670 12,189.0 12,440.0 13,795.0 13,563.0
2013 2014 Nov. 16**)2012
----------------Multiple Currencies -----------------------

Directorate of Government Debt Securities| Directorate General of Budget Financing and Risk Management| Ministry of Finance of The Republic of Indonesia
10
.7%
10
.3%
10
.5%
11
.6%
12
.6%
10
.6%
9.9
%
9.9
%
11
.1%
13
.2%
0%
2%
4%
6%
8%
10%
12%
14%
2011 2012 2013 2014 2015
to Tax Revenue to Central Gov't Expenditures
CENTRAL GOVERNMENT DEBT RATIOS
Debt to GDP Ratio Interest Payment to Revenue and
Expenditure Ratio
Debt Service to GDP Ratio Interest Payment to Tax Revenue &
Central Government Expenditure Ratio
Notes: Using GDP at Current Market Prices [2010 Version]
24.5% 23.1% 23.0%
24.9% 24.7%
27.4%
0%
5%
10%
15%
20%
25%
30%
2010 2011 2012 2013 2014 2015
7.7
%
7.5
%
7.9
%
8.6
%
10
.3%
7.2
%
6.7
%
6.8
%
7.5
%
8.6
%
0%
2%
4%
6%
8%
10%
12%
2011 2012 2013 2014 2015
to Revenue to Expenditure
2.9% 3.2%
2.9%
3.5% 3.3%
0%
1%
2%
3%
4%
2011 2012 2013 2014 2015
28
Directorate of Government Debt Securities| Directorate General of Budget Financing and Risk Management| Ministry of Finance of The Republic of Indonesia
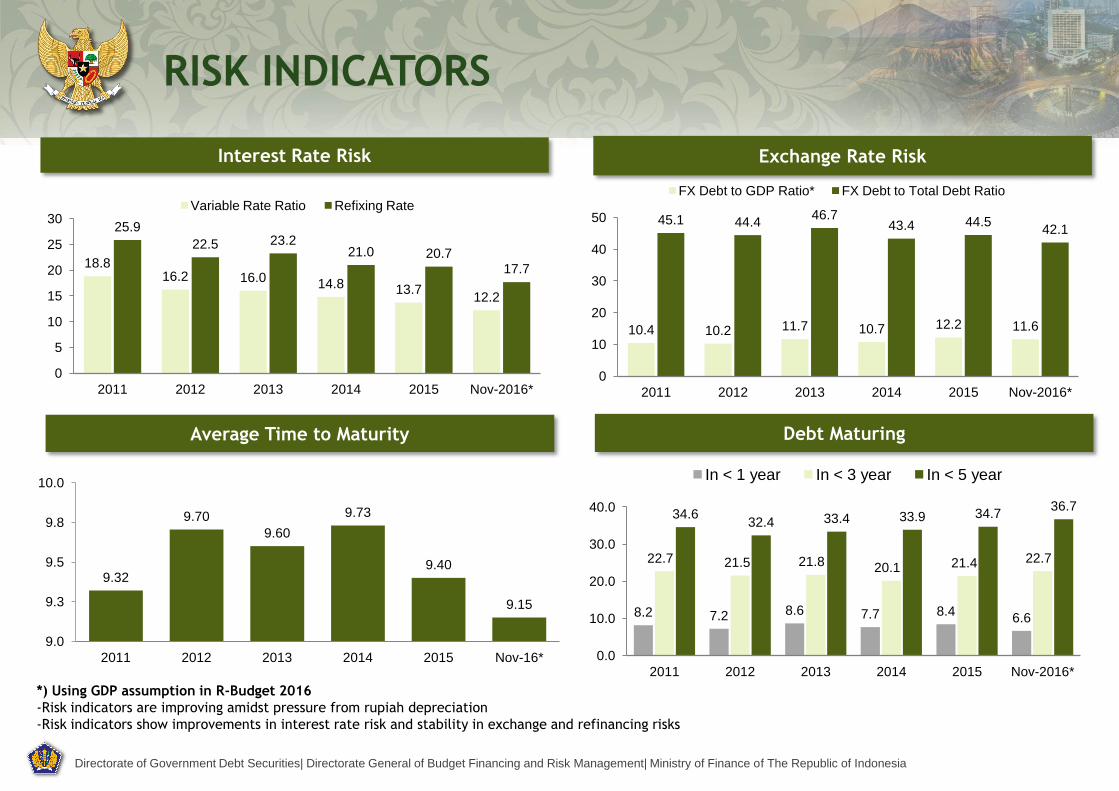
18.8 16.2 16.0 14.8 13.7
12.2
25.9
22.5 23.2 21.0 20.7
17.7
0
5
10
15
20
25
30
2011 2012 2013 2014 2015 Nov-2016*
Variable Rate Ratio Refixing Rate
10.4 10.2 11.7 10.7 12.2 11.6
45.1 44.4 46.7
43.4 44.5 42.1
0
10
20
30
40
50
2011 2012 2013 2014 2015 Nov-2016*
FX Debt to GDP Ratio* FX Debt to Total Debt Ratio
9.32
9.70
9.60
9.73
9.40
9.15
9.0
9.3
9.5
9.8
10.0
2011 2012 2013 2014 2015 Nov-16*
Interest Rate Risk Exchange Rate Risk
Average Time to Maturity Debt Maturing
RISK INDICATORS
*) Using GDP assumption in R-Budget 2016
-Risk indicators are improving amidst pressure from rupiah depreciation
-Risk indicators show improvements in interest rate risk and stability in exchange and refinancing risks
8.2 7.2 8.6 7.7 8.4 6.6
22.7 21.5 21.8 20.1 21.4 22.7
34.6 32.4 33.4 33.9 34.7
36.7
0.0
10.0
20.0
30.0
40.0
2011 2012 2013 2014 2015 Nov-2016*
In < 1 year In < 3 year In < 5 year

Directorate General of Budget Financing and Risk Management Ministry of Finance of The Republic of Indonesia Directorate of Government Debt Securities Frans Seda building, 4th Floor Jl. Wahidin Raya No. 1, Jakarta Pusat – Postal Code: 10710 Phone: +6221 3810175 Fax. : +6221 3846516 Website: www.djppr.kemenkeu.go.id
END OF PRESENTATION