governor corzine and legislative leaders to … · governor corzine and legislative leaders to...
TRANSCRIPT

State of New Jersey
OFFICE OF THE GOVERNOR 125 WEST STATE STREET
PO BOX 001 TRENTON NJ 08625-0001
JON S. CORZINE Governor
FOR IMMEDIATE RELEASE CONTACT: Robert Corrales DATE: March 19, 2009 PHONE: 609-777-2600 The Budget in Brief publication has been amended to reflect Governor Corzine’s restoration of the Property Tax Deduction in the FY 2010 budget proposal as described in the press release below:
GOVERNOR CORZINE AND LEGISLATIVE LEADERS TO RESTORE PROPERTY TAX DEDUCTION FOR FY2010 BUDGET PROPOSAL
TRENTON – Governor Jon S. Corzine today adjusted his $29.8 billion budget proposal to include the restoration of the property tax deduction for all New Jersey taxpayers earning up to $150,000. The original proposal retained the deduction for all senior taxpayers, and this adjustment will restore the deduction for all other taxpayers earning up to $150,000. “I've been listening to New Jerseyans and think we need to preserve this deduction to continue our fight to ease the burden of property taxes,” Governor Corzine said. “To that end, I will adjust the budget proposal I made to the Legislature by restoring the property tax deduction to nearly 1.5 million working families.” Under the Governor’s adjusted budget proposal, 84 percent of New Jersey taxpayers will get a full deduction. For this near-complete restoration, a one-year only increase in the “millionaire’s tax” will be implemented. That tax was enacted in 2004 and applies to the wealthiest one percent of New Jerseyans, those who make more than $500,000 a year. “Given the circumstances, allowing people to maintain their property tax deduction is the right thing to do and will help ease the pain for those being squeezed the most,” Senate President Richard J. Codey said.

“Preserving property tax relief for working families has always been our shared goal,” Assembly Speaker Joseph J. Roberts, Jr. said. “The concerns of New Jersey homeowners remain our top priority as we work to craft a budget that meets their needs in these difficult economic times.”
(more)
The Governor’s FY10 budget proposal will still include:
• $4 billion in baseline spending cuts, with more than 850 line items being cut; • an increase in education of $300 million, including $25 million for pre-K aid; • sustaining the expanded Senior Freeze; • funding for food banks, charity care, worker retraining and the job tax credit
“With this adjustment, my administration continues its efforts to assist working families in New Jersey in every way possible, but especially by providing relief from high property taxes,” Governor Corzine said. “There are things in the proposed budget that we might not choose to do in normal times but even when the choices are tough, we must choose to do what is right for New Jersey.”
###

Fiscal 2010
BUDGET IN
BRIEF
Jon S. Corzine, Governor R. David Rousseau
State Treasurer Charlene M. Holzbaur Robert L. Peden Director Deputy Director Gary J. Brune Jacki L. Stevens Associate Director Assistant Director
Office of Management and Budget
March 10, 2009 This document is available via the Internet at http://www.state.nj.us/treasury/omb


TABLE OF CONTENTS Page
Governor’s Message .......................................................................................................................... 1 Budget Highlights .............................................................................................................................. 12 Chapter 1: Executive Summary ...................................................................................................... 13 Chapter 2: An Economic Challenge Engulfs the Nation ................................................................ 17 Chapter 3: Governor’s Core Fiscal Principles ................................................................................ 23
A. Restoring Fiscal Solvency ........................................................................................................ 26 B. A Commitment to Transparency .............................................................................................. 34 C. Spending Your Tax Dollars Wisely .......................................................................................... 35 D. Focusing On Key Services ....................................................................................................... 39
Chapter 4: FY 2010 Budget Solutions ............................................................................................. 49
How FY 2010 Budget Balanced .................................................................................................... 52 FY 2010 Revenue Solutions .......................................................................................................... 56
Chapter 5: Property Tax Overview ................................................................................................... 63
Direct Property Tax Relief ............................................................................................................ 66 Municipal Aid ............................................................................................................................... 70 School Aid ..................................................................................................................................... 72
Chapter 6: Management Efficiency and Savings Measures ........................................................... 73 Chapter 7: Revenue Forecasts and Proposed Revenue Enhancements .......................................... 81 Appendix I: Fiscal 2010 Budget Details ........................................................................................... 1
Additional Charts ................................................................................................................. 2 Major Increases and Decreases ............................................................................................ 7 Tables I through V – Summaries .......................................................................................... 15 Grants-In-Aid, State Aid, Capital Construction, Debt Service Summaries .......................... 29 Summary Estimated Revenues, Expenditure and Fund Balance .......................................... 32 State Revenues FY 2009 and FY 2010 Estimates ................................................................ 33 Schedule 1 – State Revenues ................................................................................................ 34 Schedule 2 – Other Revenues ............................................................................................... 41 Schedule 3 – Expenditures Budgeted ................................................................................... 57 Schedule 4 – Expenditures Not Budgeted ............................................................................ 59
Appendix II: Fiscal 2009 Current Actions ....................................................................................... 1
Current Year Actions to Keep NJ’s Budget in Balance—FY09 Problem and Solutions ..... 1 FY 2009 Summary of All Reductions .................................................................................. 13

The FY 2010 Budget Address
State of New Jersey Budget Address March 10, 2009 Governor Jon S. Corzine Good afternoon, and thank you all for attending today's budget address. Reverend clergy; Senate President Codey; Speaker Roberts; Chief Justice Rabner; Judge Glen Grant; Members of the Legislature; Members of the Cabinet; Former governors Byrne and DiFrancesco; Honored guests and fellow New Jerseyans. Every day, across New Jersey, across America, millions of people are sitting down at their kitchen tables and sorting out their family budgets. On the backs of envelopes ... with pencils and calculators in hand ... surrounded by stacks of bills and receipts ... families are figuring out how to balance their income and expenses ...And they're doing this amid alarming economic circumstances. You pick up the newspaper and see the national unemployment rate rising above 8%. You see neighbors losing their jobs, their homes and their health care. People worry they might be next. The economy may not be "in shambles" as Warren Buffet remarked last week, but it is clear that this is no ordinary recession. And the costs of this economic crisis are exacting a serious, human toll. People from all walks of life are tightening their belts. Around the kitchen table, every family knows what it means to make tough choices in these tough times. But people also understand the importance of making the right choices. They identify their most important priorities, and they change their spending habits to live within their means.
That's exactly what those of us in this chamber must do in this budget season. I come before you today to speak candidly and directly about our state's finances - not just to you, but also to the people of New Jersey. Make no mistake: because of where the world is right now, we must move in directions we might not otherwise choose. Tough times require that we make the right choices, and that we do the right thing for the common good. By making the right decisions now, New Jersey can and will emerge from this national economic crisis stronger, sooner, and more prosperous.
1

To that purpose, the budget I am proposing for FY 2010 totals $29.8 billion - that's $1 billion less than the first budget I presented in 2006. Stop and think about it, since 1947, every governor before me has grown spending over their four years. With this proposal, we will have reduced spending two years in a row and will literally spend less than in the first budget I presented in 2006. This isn't a matter of debate or nuance. It's a fact. It is also a measure of the times in which we live. It is a demonstration that here in Trenton, we are dealing with the state's finances exactly as every family in New Jersey is dealing with theirs. We are living within our means. We are not spending more than we are taking in. We are making the tough choices to do the right thing. And ... just like the choices that a family makes around the kitchen table about its spending, the decisions I have made in laying out this budget reflect a clear ranking of my priorities and a core values. These priorities and values are the same ones that have guided my administration since I took office. Those values reflect a lifetime of experience and are informed by the voices of our fellow citizens, not just the loudest voices, but those who too often don't have a voice. Yes, we are cutting the size of government, but because of our values, we have made it a priority to continue: Nurturing our children, honoring seniors, protecting the most vulnerable among us, and I want to make it clear that we must maintain these priorities at the same time that we work to minimize the tax burden on our citizens. We've been able to enshrine these values in a leaner budget because, for three years, we governed responsibly. We eliminated the gimmicks and one-shots that past administrations used to paper over the state's debt. We reduced and streamlined state government. We funded state employee pensions and the unemployment trust fund. We were the first state in the nation to respond to the global recession with a comprehensive economic recovery program. Because we chose to do the right things yesterday, we are able to keep doing the right things today. In FY 2009, declining revenues required cuts of over $2 billion in state spending, as it turns out, that was just the start. The global recession took a further toll on our revenues, so we have cut almost $4 billion in baseline spending from this year's budget. But before we cut, we made a value-based judgment to take some things off the table.
2

There are certain parts of our government's work that we must sustain. In New Jersey, we recognize the importance of our children, they are our bright hope for the future. To that purpose, in this budget, we have increased, rather than cut, classroom funding for K-12 education. And with the federal government's help, we're giving our children a jump-start on a lifetime of learning. This budget funds Pre-K education for 50,000 kids - an important down payment on our commitment to universal early childhood education. Our increase in classroom funding allows the state to press ahead with a new formula for school aid that is rooted in educational needs and fairness -- not zip codes. Our formula recognizes that half of all "at-risk" children live outside of Abbott districts. The state's school aid allows communities, rich and poor, urban and suburban, to hire talented educators who fire up our children's minds and imaginations, because here in New Jersey we believe that every child has a right to be inspired and challenged every day in schools that are among the world's best. School aid is just one reflection of the value we have placed on learning. Today, I want to again congratulate the legislature for passing the $3.9 billion school construction program that is about to put 15,000 to 20,000 New Jerseyans back to work while modernizing schools for hundreds of thousands of children, Every generation of children has the right to schools that offer a clean, safe, and stimulating environment for learning. Just as we value our kids' education, we value their health. That's why we've expanded our Family Care program to include a child mandate and enrolled many thousands more kids and their families - particularly mothers seeking pre- and post-natal care. Providing health care for our children is a priority in this budget, just as it has been in years past. On this point, I have been clear. When the Bush administration tried to cut 10,000 kids out of New Jersey's Family Care program, we said "no." We even went to court and made it a "federal case". Throwing kids off health care is not the way we do business in New Jersey. Now, with the help of key members of New Jersey's congressional delegation, we can be certain of advancing children's health in partnership with the federal government. And just as with education and health care, we are spending wisely to improve the lives of children who require placement outside of their homes. Our Division of Children and Families has gone from being among the most poorly-rated in the country, to among the very best. Our budget priorities make it clear kids count!
3

We are also protecting seniors in this budget because we believe that, as a community, we have a responsibility to honor our parents and grandparents. Not only does this budget preserve the senior property tax freeze, it expands it. We have also preserved all homestead rebates for senior homeowners and renters. We want to make sure that our parents have a choice of staying in the homes where they have raised their families. And we want to make sure that our grandparents can live where they're most comfortable and where long-term care is most affordable. Seniors have a right to live in dignity and comfort ...that's why my administration has found ways to increase assistance for home heating and senior health care. This budget also reflects the view that when people who have played by the rules fall on hard times. When they get sick, or lose their jobs, or stumble into a run of bad luck government will help them get back on their feet - with a hand up, not a hand out. This budget provides that helping hand by maintaining emergency funds for food banks, avoiding cuts to charity care, investing in worker re-training, expanding the earned income tax credit, funding our groundbreaking efforts to stave off home foreclosures, through mortgage mediation and loan modification, and by preserving funding for the developmentally disabled and community providers.
We must not - and we will not - balance this budget on the backs of people, who through little or no fault of their own, have been caught in the rip-tide of the economic tsunami. Let me repeat: Even as we cut the cost of government in unprecedented and historic amounts, we are doing so in the right way -- the way that sustains our abiding commitment to those core values... Again, nurturing our children, honoring our seniors, and protecting the most vulnerable. These are the basic values I have held for the past decade as I've fought for New Jersey families on the floor of the United States Senate and here in the State House. Throughout those years, I have guided my judgment by doing only what is best for New Jerseyans. Whether the question has been balancing the budget, or sending our soldiers to war, or holding corporations accountable, I may not have always done what was popular in the moment, but you can be damn sure I have always done what I thought was right. But it's not just me. I take great pride in my administration.
4

Even in the face of this dire financial circumstance, people have stayed true to our core values. From the cabinet members on down, this administration has refused to look for the easy way out. Even so, I don't need to remind you that the current economic crisis has taken a sharp toll on our revenues, as it has in every state across the nation. The difference is New Jersey is weathering the storm with better outcomes than many. Our unemployment rate is below the national average. And as of January, at least 18 states had higher jobless rates than New Jersey -- often, significantly higher. Our incomes are nearly the highest in the nation, and while our budget gap is among the larger, we are managing that challenge without shuttering government, like California, or missing a payroll, like Kansas, or ignoring the unemployed, like South Carolina. Now, let's lay out the numbers in basic terms. This fiscal year, which runs through June, the state will take in about $30 billion - about $3 billion less than we originally planned. In the coming FY 2010, we're projecting base revenues of only $28.5 billion. Even with important help from the federal government -- the declining revenue meant we had to make deep cuts in spending to balance the 2010 budget. With respect to budget cuts, there are two ways to compare the numbers: in absolute terms - as I just outlined - or in terms that reflect baseline growth. In absolute terms, we need to cut $3 billion to bring this budget into balance. In baseline growth, we need to find a "staggering" $7 billion in spending and revenue solutions. As you all can appreciate, baseline growth is a more practical measure of the state's budget gap. Baseline numbers include increases that are mandated by statute, contract, and the courts - contractual wage increases, for instance. A baseline comparison also includes increases in health care and energy costs, supplemental school funding, debt service and court-mandated actions that increase child-welfare expenses. A family sitting around the kitchen table understands the real pressures in baseline growth. Their health care costs are going up every year their energy costs soared in 2009 and the cost of nearly everything else - from food, to child care, to college tuition - continues to rise. The state budget is no different. In fact, if we did nothing to curtail growth or adjust our contractual, statutory, and court-mandated obligations, the FY 2010 budget would come in just under $36 billion. As I noted, that's more than $7 billion over projected revenues. Fortunately, President Barack Obama understood the pressure on states to meet these shortfalls while still keeping teachers in the classroom and police on the street. The American Recovery and Reinvestment Act provides New Jersey about $2 billion in aid to be used for current operations on education and health care.
5

That still leaves a $5 billion gap in the budget, which we have attacked with $4 billion in cuts to programs, rebates, pension payments, and state worker salaries, In all, over 850 line items in the budget have been cut. The largest cuts will come from reductions in a scaling back of homestead rebates by $500 million, and reducing by another $500 million payments to the pension fund. I am proposing to save $400 million in personnel costs through a wage freeze and furloughs for employees. This approach calls for shared sacrifice but I believe it is far better for employees to share in these reductions and continue working than it is for savings to be achieved by the layoff of up to 7,000 workers. It most certainly is better to keep people at work and insured, than in the unemployment lines and on the Medicaid rolls. I'm sure state workers understand the household principle, just as we do, that when a family's income drops everybody has to tighten their belts. We all have to share the responsibility of keeping our financial house in order. Now, let me take a moment to briefly describe some of the options we sought to balance through this budget in hundreds of hours of meetings over the past few months. In these discussions, we would have preferred not to reduce rebates or pension contributions but we chose to preserve our children's health care and education funding. We would have preferred not to cut funding for the arts and humanities but we chose in this financial emergency not to close hospitals or eliminate senior prescription drug assistance. We didn't want to cut funding for tourism advertising and beach replenishment but we chose to maintain safe neighborhoods, safe highways, and homeland security. During those discussions, even as we cut spending, and cut, and then "cut some more", we also came to a decision that we had to preserve as much property tax relief as possible, given the severe financial pressure middle-class New Jersey homeowners are experiencing. For instance, this budget has less than a two-percent cut in municipal aid - a small amount in comparison to other line items but one that recognizes that municipalities took a big hit last year. Further, in order to help municipalities balance their budgets and stabilize property taxes, I recommended the much-debated, optional pension deferral. This deferral will provide many communities with enough breathing room to avoid layoffs of police and firefighters.
6

Following the same reasoning, my budget preserves homestead rebates for over one million moderate and middle-income families earning $75,000 or less. Protecting rebates as much as possible is consistent with one of the most basic priorities of my administration, providing direct property tax relief on a progressive basis. With this budget, my administration will have provided more direct property tax relief in four years than any other governor in New Jersey's history - nearly $7 billion put directly into the pockets of homeowners. This substantial commitment recognizes the heavy burden property taxes place on New Jersey families. It also recognizes the power and traditions of home rule. Obviously, no governor can single-handedly fix New Jersey's local property tax problem. Our state's 566 towns and 616 school districts need to rationalize their cost structures and hold spending under the cap. They need to share and consolidate services. Until these actions broadly take hold, the underlying problem will remain. Simply put, New Jersey has too many layers of government. To the credit of many, the process of restructuring is gaining momentum across the state, and we will continue to promote consolidation and shared services wherever and whenever they make sense. There are incentive dollars in this budget that do just that. In the meantime, however, rebates remain the primary tool by which the state can ease the property tax burden on individual citizens. That is why we should restore the rebates for higher income families as soon as the recovery of state revenues allows. Make no mistake -- a $1,000 rebate check is more than meaningful for families who are working out their finances around the kitchen table. We know that's absolutely true for fixed-income seniors, many of whom could receive as much as $2,500 -- combining both their senior freeze and homestead rebates. And, as family members lose jobs or see their hourly wages fall, the number of taxpayers making less than $75,000 grows. For those citizens, rebates count. To help pay for the rebates, we have proposed eliminating the property tax deduction next year on state income taxes for everyone but seniors. Now, as I commented, New Jersey faces difficult challenges, but from a better position than many states. One of the reasons is that, together, we've taken serious steps toward fiscal responsibility. As we all understand, for 15 or 20 years, New Jersey budgetary decisions had often gone in another direction - reflecting expediency rather than responsibility.
7

For many of those years, our government chose to meet its constitutional obligation to balance the budget by using one-shots and gimmicks. Whether it was raiding the unemployment trust fund, borrowing to fill unfunded pension liabilities or securitizing tobacco settlements for current spending. These gimmicks and others undermined the state's long-term financial strength and stability. At the time, they were easy fixes. They didn't require tough choices about what the state could and could not afford. They were actions that didn't require telling the public the truth. Even worse, they saddled future generations with the cost of that irresponsibility. With your help, I stopped it. You can't correct 15 or 20 years of bad decisions in 38 months, but the steps we've taken have put our state's finances on more solid ground. Over the past three years, we've contributed more money to the public pension system than did our predecessors in the preceding 15 years, combined. Regrettably, in the current crisis we need to temporarily reduce pension funding so that we can sustain our first priorities - our children, seniors, and the most vulnerable. In better times, such an action would be unacceptable. But this is a time of unprecedented economic stress. It is the right choice to make. Similarly, over the 14 years before I took office, repeated raids of the unemployment trust fund - totaling nearly $5 billion - were used to balance the state's operating budgets. My administration stopped the raids and in fact bolstered the fund by over $400 million, which avoided sharply higher payroll taxes - over $650 million to be exact - that would have fallen hardest on small businesses. The unemployment trust fund is now under even more stress, and it would take as much as $500 million dollars in additional spending to avoid a dramatic payroll tax increase. We cannot make that kind of payment while still maintaining our priorities and preserving property tax relief. But we will make a significant payment that will soften the impact on employers. And we will also seek legislation to require a tax decrease when the fund recovers in a growing economy. In this budget, we continue in our effort to make state government do more with less, and to hold ourselves accountable to the taxpayers.
8

My administration has reduced the payrolls of the state and its authorities' by almost 7,000 employees. We have eliminated departments. We negotiated with public employees and asked them to contribute toward the cost of their health care. We extended the retirement age to 62 and capped the pensions of new state workers. We recognized that sustainable employee benefit programs require serious restructuring to avoid future breakdowns. The measures we have taken will save the state and local governments $6.4 billion over 15 years. Those dollars count in a year like this. This kind of restructuring needs to be adopted across all levels of government in New Jersey. We have scrubbed departments for inefficiencies - line by line - and implemented consolidations. We've sold cars, cut up state credit cards, and moved out of half-filled, leased warehouse space. By measures big and small, we have reshaped and resized state government. We have also confronted and put an end to the entrenched ways of doing business in the State House. We ended Christmas tree spending. We approved a constitutional amendment to give voters a voice on state borrowing. And by executive order, I required that recurring expenditures be matched with recurring revenues. Other governors have talked about doing these things. I did them. This budget continues a 4-year pattern of making the right choices - choices that may not be politically popular today, but which put our state on a stronger footing for tomorrow. In a time of crisis, we must all share in the responsibility for balancing our finances and that's why I'm asking those who are the most fortunate among us - the one percent of New Jerseyans with incomes of a half-million dollars or more - to carry a little more of the burden. To this end, I am proposing a one-year, only, rate increase of ¾ of a percent for those earning more than $500,000. This new revenue, along with small increases in alcohol and cigarette taxes, will allow us to finish closing that $7 billion gap. As I've said repeatedly, the unprecedented circumstances of our national economic crisis requires choices we might not otherwise make. Our responsibility requires us to have the courage to meet these challenges, deliberatively, honestly, with compassion and good judgment. And that is precisely what we have done in crafting this budget. We faced down a $7 billion shortfall with roughly $4 billion in spending cuts, $2 billion in federal aid, and $1 billion in new revenue. That left us with $29.8 billion in which to prioritize our children, our seniors, and those who play by the rules but find themselves in dire straits. I'm asking you all to review the proposed budget.
9

Offer alternatives where you find them - as long as those alternatives honestly meet the challenges of full funding, meet legal requirements, and fit within the broad priorities laid out. I welcome ideas from everyone. I only ask that the ideas be real, be specific, and be fiscally responsible. The last thing that New Jersey needs in today's environment is political posturing. Posturing won't save one job, it won't help one family with property taxes, it won't improve a single school or save a single business. As I close, let me be clear, this budget is one part - only one part - of our responsibility to meet head-on the challenges of the global economic crisis. It is not our first step - and it won't be our last. Last fall, when the banking and credit sectors collapsed, my administration was ahead of the curve in dealing with the global economic crisis. We were the first state in the nation to pass a comprehensive economic recovery plan. I thank the legislature for your forceful and timely response in passing the nine pieces of legislation that made up that recovery package. Our mortgage mediation and modification program is stabilizing our state's housing sector, and now, other states - and the federal government - are making similar efforts. With our Invest New Jersey initiative, we offered a $3,000 grant for every new job created and sustained for at least a year, along with a sales tax exemption for the purchase of new business equipment. In the ten weeks since that grant program has been in place, we've received over 800 applications representing 20,000 jobs and hundreds of millions of dollars in investment. Each of those 20,000 people represents a New Jerseyan who has the opportunity to wake up every day, knowing that he or she has a job. We also reformed New Jersey's corporate tax code to make our state more business friendly. We enabled businesses to carry forward tax loss benefits for up to 20 years. We eliminated the Throw-Out and Regular Place of Business Rules that penalized companies headquartered in New Jersey. We enacted permit extension provisions. We created a clean energy fund and put in place incentives for public investments in energy efficiency. All of these measures have cushioned us against the blow of this global recession. These actions may even produce growing revenues for future state budgets. Now, I've taken some heat from our neighbors -- particularly up north. Some have accused me of trying to steal their companies. I get accused of a lot of things, but this is one offense I'm willing to cop to. Let's be clear - our economic recovery plan sends a clear and unequivocal message to employers: New Jersey is a great place to do business.
10

When we move legislation to expand the urban hub tax credits, when we pass the revenue allocation district act, when we move forward on allowing license site professionals to certify brownfield cleanups, we'll lay an extraordinary foundation for New Jersey's strong economic recovery. When the global and national economy rebounds, New Jersey will be in a stronger position than its neighbors and competitors. We will prosper tomorrow because of the decisions we make today. Now, I'd like to close by citing President Obama, who reminded us two weeks ago in his address to Congress that we are in the eye of an economic storm, the likes of which we haven't seen since the breadline days of the 1930's. That said -- with a strong national recovery program, and with a true partner for New Jersey in the White House, we will come through this storm. While today's crisis is challenging and often painful, we will pull together as a community and a nation and build for a more prosperous tomorrow. History is clear - the economy will turn. With the talent, the work ethic, and the strong character of our people, New Jersey will lead the way. I believe in our common desire to do what is right. I hope and expect to see that spirit reflected in the final budget, a budget that values children, seniors, and the most vulnerable, and asks a little more from the rest of us. Thank you. May God bless each of you, and God bless New Jersey.
11

FY 2010 Budget Highlights
Despite facing the most severe global economic crisis of our lifetimes, the FY 2010 Budget is based on the underlying principle of “doing the right thing” and not abandoning the principles of providing education and health care for children; maintaining public safety; protecting the most vulnerable; and maintaining the commitment to providing the greatest level of property tax relief to the citizens of New Jersey.
Governor Corzine’s FY 2010 $29.841 billion Budget is over $3.4 billion, or over 10 percent, below the adjusted appropriation level of the current year and more than $1 billion below the first budget that he proposed in March 2006.
The Budget is nearly $6 billion below the projected baseline spending required under current statutes and contractual obligations.
For the second consecutive year, this Governor has submitted a budget that is less than the previous year’s budget. No other Governor in New Jersey history has cut budget spending in back to back years.
Over the past two years Governor Corzine has reduced the Budget by $3.5 billion from the budget he signed in June 2007 (Fiscal Year 2008 budget).
The average annual growth rate of the four budgets presented by Governor Corzine is about 1.6 percent – which represents the smallest increase of any four years in modern history. More than 75 percent of the increase is in property tax relief programs (school aid, Homestead Rebate and Senior Freeze).
The Budget, inclusive of new federal assistance, provides $15.7 billion in property tax relief – over 50 percent of the entire Budget.
The Budget, with federal stimulus, provides over $13.5 billion for support of PreK-12 and college education – about 45 percent of the budget.
The Budget reduces the cost of operating government by over $380 million.
Reductions have been made to approximately 450 of the 2,400 line items in the budget – nearly 20 percent – and another 400 line items will be affected by the allocation of employee savings, increasing the share of reductions to 36 percent.
12

CHAPTER 1: EXECUTIVE SUMMARY
Chapter 1
As New Jersey, other states and the world navigate through what is arguably the most severe and pervasive economic crisis since the Great Depression, Governor Jon S. Corzine has proposed a FY 2010 Budget that is in tune with these difficult times. The Budget is approximately $3 billion below the FY 2009 budget enacted last June and $1 billion less than the first Budget (FY 2007) Governor Corzine proposed in March 2006. The FY 2010 Budget totals $29.84 billion. Over the last three years, the Budget has re-prioritized spending to the critical areas of educating New Jersey’s children; protecting the health and well-being of children; safeguarding New Jersey’s most vulnerable citizens; securing public safety; and easing the property tax burden in New Jersey. While the FY 2010 Budget contains by far the largest dollar and percentage decrease in modern New Jersey history, these priorities continue to be shielded from harsh but unavoidable reductions in spending. Key elements of the FY 2010 Budget include:
• Closure of a projected $7 billion shortfall through $4 billion in direct cuts or reductions in baseline growth, $2 billion in Federal Economic Stimulus assistance and $1 billion in revenue solutions;
• Reductions in about 850 - about 36 percent - of the 2,400 line items in the Budget; • Cuts in the operational costs of State government of more than $380 million; • Increased funding for schools and early childhood education programs; • Near level funding preserved for municipalities, hospitals and higher education; • More than half of all Budget spending for property tax relief.
Defining and Solving the FY 2010 Shortfall Problem As the last three budgets moved New Jersey closer to true structural balance, in which recurring revenues matched recurring expenses, the FY 2009 Budget projected a succeeding fiscal year shortfall of between $1.5 billion and $2 billion. This estimate took into account the largest year-to-year spending reduction in State history, no new costly policies or government programs and revenue assumptions built around a continuing slowdown of the national and regional economy. The slowdown in the economy, however, quickly evolved into an overwhelming economic crisis of global proportions. As a result, a shortfall of more than $3 billion opened in New Jersey’s FY 2009 Budget, and restoring balance required the implementation of solutions that straddled both the current and new fiscal years.
13

Chapter 1
With a shortfall estimated at $7 billion, the Corzine Administration relied on multiple approaches to meet the constitutional requirement for a balanced budget. We closed the shortfall with the use of nearly $4 billion in cuts or spending restraints. These cuts include the proposed imposition of a wage freeze and a furlough program for State employees. The balance of the shortfall was closed with the application of just over $2 billion in federal stimulus monies and temporary changes in tax policy, including a one-time increase in the Gross Income Tax rate for about 1% of New Jersey’s wealthiest citizens and increases in the taxes on cigarettes and alcohol (excluding beer). Reducing Size and Cost of Government In order to meet the State’s funding priorities in the face of an extraordinary decline in fiscal resources, the FY 2010 Budget includes another major wave of cuts. These reductions are on top of approximately $3.1 billion in spending cuts and restraints in the original FY 2009 Budget, plus an additional $1.8 billion in mid-year cuts to keep the budget in balance. Prominent among the FY 2010 reductions is approximately $420 million in savings to be achieved through a proposed salary freeze and proposed workforce furlough over the course of the fiscal year. For the third straight year, operational budgets for State departments have been reduced. The FY 2010 Budget assumes more than $380 million in year-to-year spending reductions on departmental operations. Since January 2006, the Executive Branch workforce has been reduced by close to 4,000 employees. When reductions in State authorities and agencies are taken into account, the total workforce has been reduced by about 7,000 employees. The workforce will continue to shrink in FY 2010 through a continuation of a strict hiring freeze and attrition. Putting Children First For the second consecutive year, the Budget invests additional resources into New Jersey’s school classrooms, increasing direct school aid by $300 million to $8.8 billon. This increase includes $52 million more for existing preschool programs. Formula aid represents one-half of the $300 million increase. No school district will receive less than it received in FY 2009, and 171 school districts will receive increases, some up to five percent. The Budget also makes good on Governor Corzine’s commitment to phase-in preschool expansion with $25 million in new funding for newly-created Preschool Incentive Aid. The $25 million will be available to the “universal” non-Abbott preschool districts for expansion in the 2009-10 school year if they commit their new recovery Title I funds to preschool. Total school aid is funded at $11.4 billion, inclusive of federal stimulus funding, which is well over one-third of the $29.8 billion FY 2010 Budget. Combined, aid to preschool - 12 education and Higher Education represents about 45 percent of the total budget.
14

Chapter 1
Preserving and Continuing Property Tax Relief The FY 2010 Budget includes $15.7 billion in property tax relief, more than one-half of all spending, with more than $1.1 billion being directed to the Homestead Rebate Program. All funding for direct relief programs in FY 2010, including all rebates, the Senior Freeze and direct payments, brings total spending over all Corzine Administration budgets to nearly $7 billion, which is significantly higher than the cumulative total of any previous administration. Despite the unprecedented strains on State finances, rebates for all senior homeowners have been preserved at last year’s levels, averaging over $1,200. This aid helps to ensure that seniors on fixed income can remain in their homes. In addition, the Budget continues rebates for non-senior households with incomes below $75,000. Non-senior homeowners with incomes between $50,000 and $75,000 will receive checks averaging about $700, while those non-seniors with incomes below $50,000 will receive rebate checks averaging $900. More than one million New Jersey homeowners will receive in excess of $1 billion in rebates, averaging more than $1,000. Two-thirds of homeowners who received rebates last year will continue to receive rebates. The FY 2010 program preserves rebates for both senior and non-senior tenants. The FY 2010 Budget also funds the Senior Property Tax Freeze program. Spending rises by $3.5 million to $172.5 million. Senior Freeze checks averaged in excess of $1,000 last year. The Governor and Legislature also enacted legislation last year that raised the income eligibility for Senior Freeze benefits. Conclusion The $29.8 billion Budget proposed by Governor Corzine is an austere budget, proportionate to these difficult economic times, yet responsive to the core needs of educating and protecting our children, protecting New Jersey’s health care safety net and easing the property tax burden shouldered by all citizens. If the FY 2010 Budget is adopted at $29.8 billion, the total spending level since Governor Codey’s FY 2006 Budget will have increased by $1.9 billion, or at an annual rate of 1.6%. Approximately $1.5 billion, or 75 percent of this increase in spending is directly attributable to property tax relief programs, including school aid, the Homestead Rebate and the Senior Freeze Program. Providing health care for children and families and protection for children under the care of the Department of Children and Families accounts for another $600 million of this increase.
15

16

CHAPTER 2: AN ECONOMIC CHALLENGE ENGULFS THE NATION
Chapter 2
No budget is proposed in a vacuum. A budget reflects the economic health of the State. It relies on the amount of revenue that is generated by citizens and businesses, which declines during economic slowdowns. The budget also responds to the needs of residents. As the jobless rate increases, New Jersey families turn to the State for help in securing unemployment benefits; in obtaining Medicaid health care; in helping them keep their homes and not succumb to foreclosure. During any economic downturn, it is difficult to balance falling revenues with rising needs. This Budget, however, is proposed at a truly historic juncture—New Jersey joins its fellow states in facing an international economic challenge, a slowdown larger than any this nation has faced since the Great Depression. The U.S. officially entered recession in the final quarter of 2007, but the downturn intensified dramatically in the third quarter of 2008. The nation’s Gross Domestic Product plummeted in the fourth quarter of 2008 to a level not seen in the post-World War II era. The national unemployment rate has increased by more than 50% since the beginning of 2008. Forty-six states are struggling to fill budget gaps, which, when combined, are estimated to reach $350 billion or more by fiscal year 2011. We truly face a once-in-a-generation fiscal emergency. Last year’s Budget began to prepare New Jersey for the possibility of an economic downturn. Governor Corzine had the foresight to reduce the Fiscal 2009 Budget by $600 million below that of fiscal 2008. When combined with the reductions recommended for fiscal 2010, the total savings over that two-year period exceeds the total State appropriation provided for the entire State Budget in 1978. State government has become leaner; our State workers are working harder with fewer resources to provide the citizens with the services they need. Due in part to such actions, the deficit that New Jersey faces is not as deep as some of the other states. We are thankful that the State’s unemployment rate continues to be below the national average. Nevertheless, there is no question that we as a State have been hit terribly hard by this downturn. The State’s base revenues have dropped by over 12% the last two fiscal years. The Proposed Budget is now at a lower level than Governor Corzine’s first proposed budget, even as the needs of our citizens have increased. The following charts help illustrate the international economic downturn that shapes the Governor’s Proposed Budget for Fiscal 2010, and help explain the excruciatingly difficult decisions that this Administration made in preparing this document.
17

Chapter 2
The Nation Faces the Greatest Economic Crisis since the Great Depression • The nation is dealing with a historic economic slowdown, which has already resulted in the largest
yearly decline in U.S. Gross Domestic Product in the post-war era
The U.S. 2008 GDP Decline is the Worst in Post-War History
-5
-4
-3
-2
-1
0
1948 1953 1957 1960 1970 1973 1980 1981 1990 2001 2008
Peak-to-Trough Percent Change in Real GDP
Dated by Year of the GDP PeakSource: IHS Global Insight (March 2009)
Forecast
18

Chapter 2
Almost All States Are Facing Crippling Budget Shortfalls, Estimated to Total a Combined $350 Billion by Fiscal Year 2011 • 46 states are facing fiscal stress in their current and upcoming fiscal years, according to the Center on
Budget & Policy Priorities
• The shortfalls are expected to become worse over the next two years
• When combined, these shortfalls are estimated to total $350 billion to $370 billion by fiscal year 2011
$51
$145$154
$0
$20
$40
$60
$80
$100
$120
$140
$160
$180
Mid-Year FY2009 Shortfa lls
Projected FY2010 Shortfa lls
Projected Lower Limit of FY2011 Shortfa lls
Combined State Budget Shortfalls
State Budget Shortfalls Predicted to Worsen Through FY2011
(In Billions)
Source: Center on Budget & Policy Priorities, 2/10/09
19

Chapter 2
The Unemployment Rate Has Risen in New Jersey over the Course of This Economic Crisis, but It Remains Below the National Unemployment Rate • The U.S. unemployment rate has increased by more than 50% since the beginning of 2008, to 7.6% in
January 2009
• New Jersey’s unemployment rate has risen from 4.6% to 7.3%, but remains below the national unemployment rate
4.0%
4.5%
5.0%
5.5%
6.0%
6.5%
7.0%
7.5%
8.0%
Jan Feb Mar Apr May Jun Jul Aug Sep Oct Nov Dec Jan
Unemployment Rate
Month
Actual NJ Unemployment Rate vs. U.S. Rate, 2008-2009
NJ
US
20

Chapter 2
NJ’s Fiscal Challenge—Revenues Have Dropped 12% Over Two Years • New Jersey’s base revenues are down 12% since fiscal 2008
• In fiscal 2009, revised revenues have decreased in all three major categories of taxes:
o Corporate revenue is down 12.0% o Sales tax revenue is down 7.6% o Income tax revenue is down 11.4%
• Revenues are now below the level they were when Governor Corzine assumed office in 2006, even as
inflation and citizens’ need for services have increased
R e v e nu e H is tor y F Y 2 0 10 B as e R e v e nu e B e lo w
F Y 2 0 0 6 A c tua l R e v e nu e( In B il lio n s )
$ 2 8 .7
$ 3 1 .2
$ 32 . 6
$ 2 9 .5
$ 2 8 .6
$ 2 6 .0
$ 2 7 .0
$ 2 8 .0
$ 2 9 .0
$ 3 0 .0
$ 3 1 .0
$ 3 2 .0
$ 3 3 .0
FY 0 6 C A FR F Y 0 7 C A F R F Y0 8 C A F R FY 0 9 A d j u s ted Ap p r o p *
F Y 1 0 B u d ge t*
* W ith out s olut io nsC AF R – Com p re he n siv e A nn ua l F in a nc ia l Re p or t
21

22

CHAPTER 3: GOVERNOR’S CORE FISCAL PRINCIPLES
Chapter 3
The road ahead will be difficult, but this Governor’s Budget is a roadmap for how the State will navigate the current economic crisis. Although the crisis leaves New Jersey no choice but to make do with billions of dollars less in financial resources to meet its priorities, this Budget meets core needs without overburdening taxpayers and positions the State for a return to prosperity for all its citizens. In the interim, this Administration continues to follow a set of core fiscal principles, not just in preparing this Budget, but in all its policies and actions. These core principles are: Restoring Fiscal Solvency From his first day in office, Governor Corzine has committed his Administration to helping the State overcome the structural deficit he inherited. Moody’s downgraded the State’s bond ratings three times from 1992 until the Governor assumed office. In response, and for the first time in State history, the Governor proposed two consecutive budgets that cut spending from the previous year. His Fiscal 2008 and 2009 Budgets assumed no new taxes, while reducing the tax burden for working families and New Jersey businesses. This year’s Budget continues to make the hard decisions necessary to achieve balance while maintaining core services. A Commitment to Transparency The Governor issued Executive Order 103, which commits his Administration, whenever possible, to pay for recurring costs through recurring revenues, while publicly reporting on his Administration’s success in doing so. Due to the current economic situation, the Governor has been forced to suspend this executive order so he can limit tax increases for one year. Working with the Legislature, he signed new budget reforms requiring that all changes to the Governor’s Budget be made public before being voted on. Moreover, the Governor has pledged that citizens have access to information about every dollar of federal stimulus funding that the State will receive. Spending Your Tax Dollars Wisely Governor Corzine’s budgets have increased at an annual rate of 1.6% over the past four years. This increase is well below the average annual rate of inflation (3.3% between 2006 and 2008) and the growth rate of administrations since 1951 (11.6%), even as the cost of services has increased. Governor Corzine has done so, in part, by making sure that State Government is leaner and more efficient. He has reduced staffing levels by a total of nearly 4,000, and cut spending on government’s direct costs. To reduce the property tax burden, he has strengthened the 4% caps on local governments to slow the costs of local government. Like residents and businesses throughout this State, New Jersey government is tightening its belt to deliver the best services possible at the lowest price.
23

Chapter 3
Focusing on Key Services The State faces a drop in base revenue of over 12% since fiscal year 2008. However, the Governor has committed his Administration to maintaining the key services that citizens expect from their government. Thus, this Budget maintains the State’s commitment to funding the Governor’s new Education Formula, which ensures that all disadvantaged children are supported, no matter where they live. The Governor has, whenever possible, supported the State’s pension obligations, paying more into the pension funds over his Administration than other administrations had done for defined benefit plans over the previous fifteen years combined. He continues to fund property tax refunds to help as many residents as possible to offset this burden. His Administration has provided more in property tax refunds than any previous administration. Moreover, even during this fiscal emergency, his proposed Budget maintains State aid to municipalities and counties. Shared Sacrifice The current economic crisis is deep, and no one is under any illusions that it will be short. The Governor believes that, to weather this crisis, all stakeholders in the budget must share some responsibility to keep New Jersey’s fiscal house in order. State workers are paying a higher percentage of their wages for pension and health-care costs, just like so many of their private sector counterparts. Making the Right Choices The Governor is now calling on State workers to help even more by agreeing to furloughs and wage freezes through the end of fiscal 2010. In his last two budgets, the Governor proposed to reduce spending below the prior year amount, something that has never happened in New Jersey’s history. While he did not rely on tax increases in his Fiscal 2008 and 2009 Budgets, he is asking for all citizens and businesses to shoulder some of the burden through targeted and temporary revenue increases. By working together to move the State in the right direction, we can collectively navigate through this difficult period and emerge stronger and more prosperous. The following charts help illustrate the types of actions that this Administration has taken, and will continue to take, to help guide New Jersey to a more fiscally sound future.
24
Chapter 3
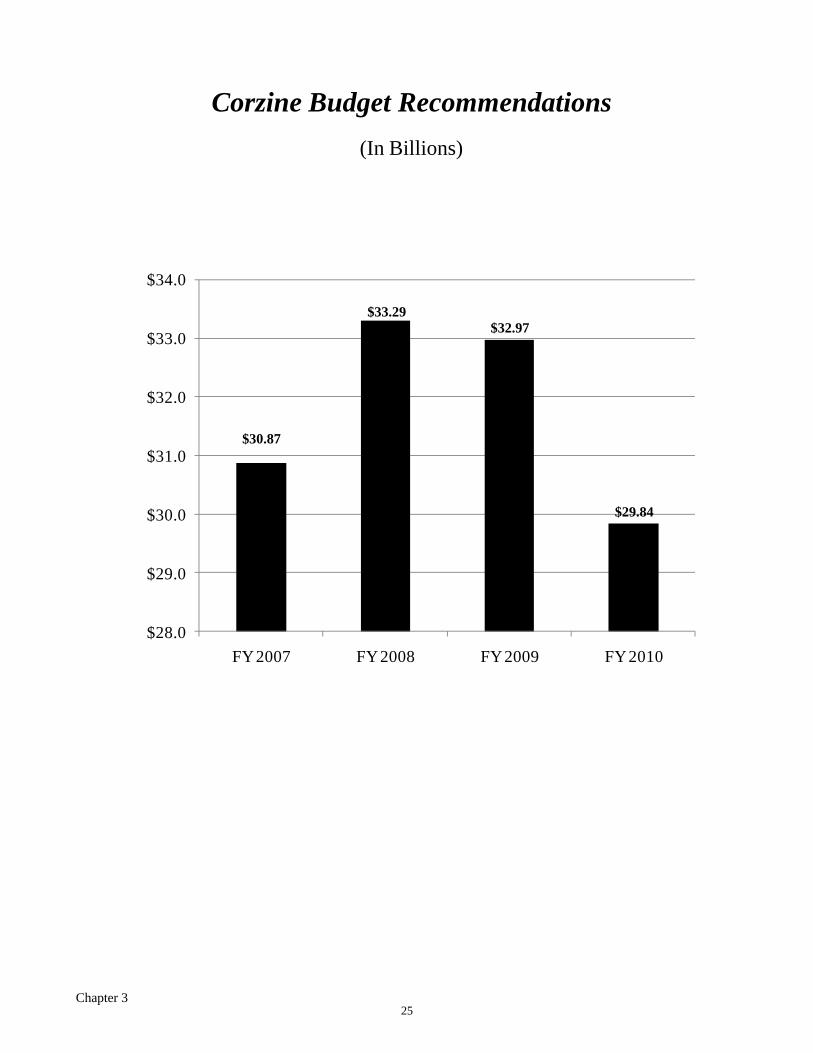
Corzine Budget Recommendations(In Billions)
$30.87
$33.29$32.97
$29.84
$28.0
$29.0
$30.0
$31.0
$32.0
$33.0
$34.0
FY 2007 FY 2008 FY 2009 FY 2010
25

Chapter 3
A. Restoring Fiscal Solvency In Preparation, Governor Corzine Began Cutting the Budget Last Year, Before the Economic Slowdown Was Evident • For the first time ever in State history, this Administration has proposed two consecutive Budgets that
decrease spending from the previous year
Corzine Administration Spending(In Billions)
$30.82
$33.61
$30.95
$29.84
$27.0
$28.0
$29.0
$30.0
$31.0
$32.0
$33.0
$34.0
FY 2007 FY 2008 FY 2009 FY 2010
26

Chapter 3
Corzine Administration has Lowest Average Percent Change in Adjusted Appropriations
21.0%
9.4%
9.9%
27.3%
18.9%17.2%
10.3%
14.0%
8.9%
7.1%
2.5%
8.9%
5.3%
1.6%
0%
5%
10%
15%
20%
25%
30%
Mey
ner
Mey
ner -
2nd
Hug
hes
Hug
hes
-2nd
Cah
ill
Byr
ne
Byr
ne -
2nd
Kea
n
Kea
n -2
nd
Flo
rio
Whi
tman
Whi
tman
2nd
-DiF
ranc
esco
McG
reev
ey -
Cod
ey
Cor
zine
% Change Average % Change
=11.6%
27

Chapter 3
Governor Corzine Has Held the Growth in His State Budgets to Less Than Half the Rate of Inflation
• Governor Corzine’s Budgets have grown at an average annual rate of 1.6%, less than half the rate of inflation since 2006 (3.3%)
$28.1
$29.8
$15
$18
$21
$24
$27
$30
FY2006* FY2010 **
Gov. Corzine's Budgets Have Grown 1.6% Per Year
* FY 2006 Adjusted Appropriation, for the final year of the Codey Admin** FY 2010 Proposed Budget, for the 4th year of the Corzine Admin
28

Chapter 3
Combined Reductions over the Last Two Budgets Exceed the Entire 1978 State Budget
• The combined amount of reductions in the Fiscal 2009 Budget and proposed reductions in the
Fiscal 2010 Budget ($4.1 billion), exceeds the ENTIRE fiscal 1978 State Budget ($4.0 billion)
Total FY 2009/FY 2010 Budget ReductionsExceed FY 1978 State Budget
($ in Bill ions)
$4.0
0.7
3.4
$0
$1
$2
$3
$4
$5
FY1978 State Budget FY2009 -FY2010 Budget Cuts
FY 09 vs FY 10
FY 08 vs FY 09
$4.1
29

Chapter 3
Comparison of State Pension Contributions Prior to the Corzine Administration
• Despite the constraints in the economy, even with reduced pension contributions in fiscal 2009 and fiscal 2010, this Administration has provided more funding for all pension systems than the State’s total combined contributions from fiscal 1993 through fiscal 2006.
• When considering the contributions for only the defined benefit plans, the State will have contributed more in the past three years than the amount contributed in the preceding 15 years, combined.
$3.2
$3.4
$3.0
$3.1
$3.2
$3.3
$3.4
$3.5
FY93‐FY06 FY07‐FY10
Comparison of State Pension ContributionsPrior to the Corzine Administration
(In Billions)
30

Chapter 3
Projected FY 2008 – FY 2022 Savings from the Pension and Health Benefit Reforms Effective July 1, 2007
(In Millions)
State Local TotalPension Savings PERS/TPAF PERS PERS/TPAFRetirement age from 55 to 60 287.3$ 83.3$ 370.6$ Cap on defined benefit salary 501.5 399.3 900.8 Increase employee contribution from 5% to 5.5% 1,497.8 794.4 2,292.2 Mandatory defined contribution for elected/appointed 1.3 15.4 16.7
TOTAL PENSION SAVINGS 2,287.8$ 1,292.4$ 3,580.2$
Locals IncludingMunicipalities, Counties Total
Health Benefit Savings State & School Boards State/Local1.5% of salary contribution (1) 1,850.3$ -$ 1,850.3$ Co-pay changes 191.3 - 191.3 Plan design changes (2) 476.0 300.9 776.9
TOTAL HEALTH BENEFIT SAVINGS 2,517.6$ 300.9$ 2,818.5$
GRAND TOTAL PENSION & 4,805.4$ 1,593.3$ 6,398.7$ HEALTH BENEFIT SAVINGS
(1) For local employers if 50% of them negotiate and adopt with their employees the 1.5% of salary contribution toward health benefits it is projected that the aggregate savings through FY 2022 would be $2.546 billion.(2) State savings for plan design changes includes savings attributable to retired teachers and other school board retirees funded by the State.
• In the first year of the Corzine Administration, various benefit reforms were enacted that are expected to yield long-term savings and provide long-term stability and security for the pension and health benefit systems.
• Recent reforms such as the increase in employee contributions toward pensions and health benefit costs are expected to yield $6.4 billion in combined State and local savings by fiscal 2022.
31

Chapter 3
Projected FY 2009 – FY 2022 Savings from Further Pension and Health Benefits Reforms
(In Millions)
State Local TotalPension Savings PERS/TPAF PERS PERS/TPAFRetirement age from 60 to 62 53.6$ 53.4$ 107.0$ Raise eligibility threshold to $7,500 0.8 12.2 13.1 New adjunct faculty from PERS to ABP (no estimate at this time) - - - Appeals heard by OAL (no savings) - - -
TOTAL PENSION SAVINGS 54.5$ 65.6$ 120.1$
Locals IncludingMunicipalities, Counties Total
Health Benefit Savings State & School Boards State/LocalAllow State to offer incentive to waive SHBP coverage (no est. at this time) -$ -$ -$ Out-of-state purchase not count towards PRM (no estimate at this time) - - - Codification of current regs for definition of full-time for locals (no savings) - - -
TOTAL HEALTH BENEFIT SAVINGS -$ -$ -$
TOTAL PENSION & HEALTH BENEFIT SAVINGS 54.5$ 65.6$ 120.1$
Other SavingsEliminate Lincoln's Birthday as Holiday 32.2$ -$ 32.2$
GRAND TOTAL SAVINGS 86.6$ 65.6$ 152.2$
• As part of its continued commitment to controlling rising employee benefit costs, this Administration in conjunction with the Legislature enacted additional pension and benefit reforms that are expected to result in $152.2 million in State and local savings by fiscal 2022.
32
Chapter 3
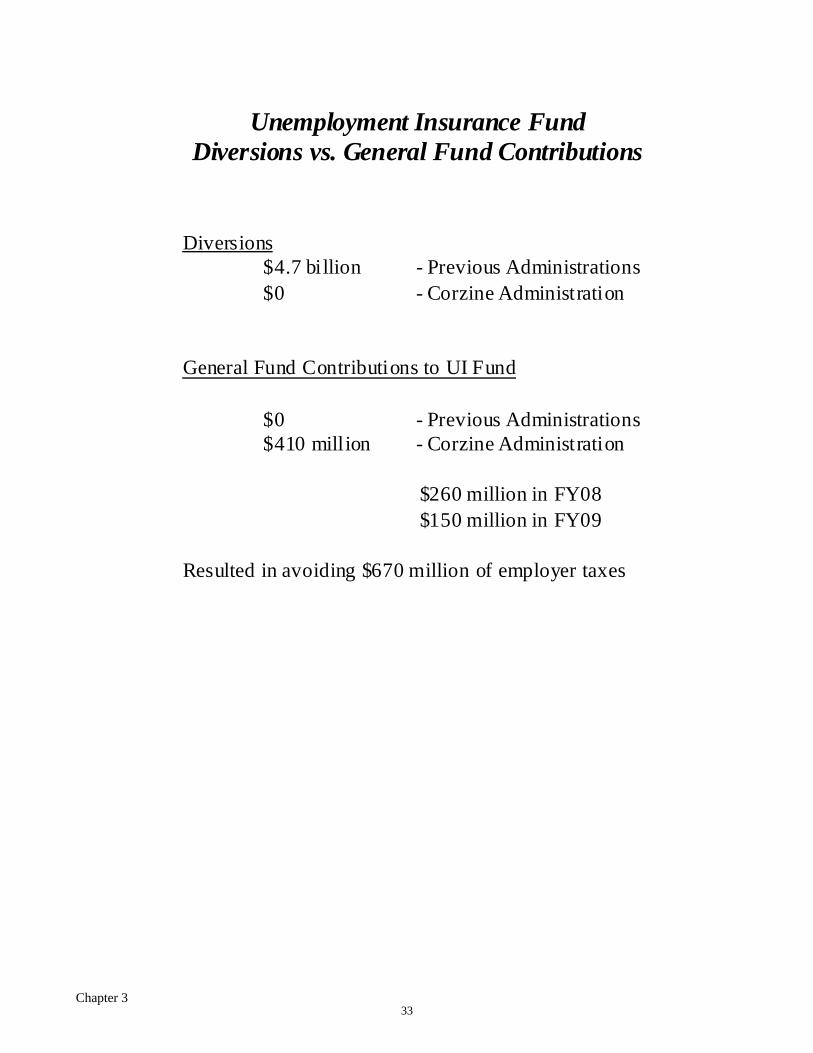
Unemployment Insurance FundDiversions vs. General Fund Contributions
Diversions$4.7 billion - Previous Administrations$0 - Corzine Administration
General Fund Contributions to UI Fund
$0 - Previous Administrations$410 million - Corzine Administration
$260 million in FY08$150 million in FY09
Resulted in avoiding $670 million of employer taxes
33

Chapter 3
B. Commitment to Transparency
• Working with the Legislature, the Governor reformed the budget process. For example, any changes to the Governor’s Budget now must be publicized before they can be considered by the Legislature, so that everyone knows who requested every additional taxpayer dollar.
• Under Executive Order No. 103, the Governor publicly certifies the amount of recurring revenue, with a goal of only relying on such revenue to fund day-to-day State spending. Due to the current economic situation, the Governor has been forced to suspend this executive order so he can limit tax increases for one year.
• Once the Budget is approved, the Governor publishes a new Citizens’ Guide to the Budget, to give citizens a clear, concise understanding of how much the State will be spending, and for what purposes.
• The Governor has launched a new website, so each citizen can monitor how the State distributes
and uses every dollar of the federal stimulus funds. These funds will be overseen by a new NJ Recovery Accountability Task Force. The website can be accessed at: www.recover.nj.gov
Enhanced Medicaid Funding
$2,009.6(36%)
Education
$1,980.9(36%)
Infrastructure & Energy
$1,244.5(22%)
Social Services, Health, Public Safety
$192.7(4%)
Unemployment & Job Training
$114.5(2%)
Federal Stimulus Funds to State of New Jersey($ millions)
Of the federal stimulus funds received by the State of New Jersey between fiscal 2009-2011, approximately 72% will go towards Medicaid and Education.
Total Funds: $5.5 billion
34

Chapter 3
C. Spending Your Tax Dollars Wisely • This Administration has reduced the number of Executive Branch State workers by almost 5.5%
during its time in office
62000
63000
64000
65000
66000
67000
68000
69000
70000
71000
Whitman 2002 McGreevey 2006 Corzine 2009
Number of Full Time Employees By Administration
Number of Full Time Employees
35

Chapter 3
Working to Make State Government More Efficient • In next year’s proposed Budget, Direct State Services Spending is about 20% of total appropriations
• In contrast, in fiscal 1989, Direct State Services Spending made up almost 35% of total appropriations
FY 2010 FY 1989DSS 20.49% DSS 34.49%Other 80.31% Other 65.51%
DSS20.49%
Other80.31%
DSS Spending as % of Total Appropriations FY2010
DSS34.49%
Other65.51%
DSS Spending as % of Total Appropriations FY1989
FY 2010 Direct State Services (DSS)Reduced by Nearly Half in 20 Years
36

Chapter 3
FY 2009Adjusted FY 2010 Change
Departme nt Approp. B udge t $ %
Chief Executive 5,268$ 4 ,684$ (584)$ (11. 1) Agriculture 7,540 7 ,081 (459) (6. 1)Banking a nd Insurance 71,441 67,548 (3,893) (5. 4)Children & Familie s 334,686 327,936 (6,750) (2. 0)Community Affairs 38,127 37,515 (612) (1. 6)Corrections 1,053,054 1,020,307 (32,747) (3. 1)Educa tion 72,183 71,186 (997) (1. 4)Environmenta l Protect ion 231,011 216,286 (14,725) (6. 4)Healt h & Senior Services 60,880 64,615 3 ,735 6. 1Human Se rvic es 522,883 497,040 (25,843) (4. 9)La bor and Workforce Development (a ) 82,644 81,851 (793) (1. 0)La w & Public Sa fety 566,036 546,574 (19,462) (3. 4)Military & Vete rans' Affairs 91,551 87,943 (3,608) (3. 9)Public Advoc ate 17,130 16,834 (296) (1. 7)State 36,636 31,469 (5,167) (14. 1)Transportat ion 100,614 61,764 (38,850) (38. 6)
Treasury (a)
467,361 452,879 (14,482) (3. 1)Miscellaneous Commissions 1,456 1 ,456 - -
Total Executive B ranch 3,760,501$ 3,594,968$ (165,533)$ (4. 4)
Interdepartme ntal 2,166,463 1,798,341 (368,122) (17. 0)
Legisl ature 74,644 73,815 (829) (1. 1)
Judic iary 641,007 648,385 7 ,378 1. 2
Total 6,642,615$ 6,115,509$ (527,106)$ (7. 9)
(a ) FY 2009 includes app ropr iat ions shifted from Depart men t of Per sonnel.
Dep ar tmental bud gets will be furt her impacted by Statewide Savin gs Initiat iv es r eflected in In terdepar tmental, $192.2 million and p rocurement sav ings , $25 million .
Gro wt h in Judiciary fo r incarceratio n divers ion progr ams g enerates savings in t he Dep ar tment of Cor rections , Grants in A id
Direct State Services By Department(In Thousands)
$6.6
$6.1
$5.8
$5.9
$6.0
$6.1
$6.2
$6.3
$6.4
$6.5
$6.6
$6.7
2009 Adjusted FY 2010
$527 million (7.9%) decline in Direct State Services
FY 2010 Direct State Services Reduction(In Billions)
37

Chapter 3
Where Does the Money Go?State Aid and Grants Represent Nearly Three Quarters
of the Budget(In Billions)
State Aid$12.141%
Grants-In-Aid$9.933%
Operations Executive
$3.612%
Employee Benefits, Rent and Utilities
$1.66%
Capital$0.1
Operations Legislature and
Judiciary$0.72%
Debt Service (1)$1.86%
Nearly three quarters of every dollar goes to Property Tax Relief and Grants-in-Aid
State Aid: includes Education Aid programs, Municipal Aid, Property Tax Relief programs, General Assistance, and Aid to County Colleges.
Grant-In-Aid: includes Property Tax Relief programs, Medicaid, Pharmaceutical Assistance for the Aged and Disabled, Nursing Home and long-term care alternative programs, and support for Higher Education.
Operations Executive: includes funding for adult prisons and juvenile facilities, State Police and other law enforcement programs, Human Services institutions, veterans homes, Children and Families and the Public Advocate Departments.
(1) Total Debt Service is $2.5 billion; School Construction Debt is reflected in State Aid.
Total Budget is $29.8 Billion
38

Chapter 3
D. Focusing on Key Services
$8.9 $9.3
$10.2$10.9
$11.5 $11.4
$6.0
$7.0
$8.0
$9.0
$10.0
$11.0
$12.0
$13.0
FY05 FY06 FY07 FY08 FY09 Adj Approp
FY10 Rec
State Aid for Education(Includes Pension Contributions)
(In Billions)
State Aid for Education has increased 28% since 2005.
FY 10 includes $1.05 billion in federal stimulus funding.
39

Chapter 3
School Aid
Education Remains Governor Corzine’s Top Priority Governor Corzine fought to fund the new school funding formula for the Fiscal 2010 Budget as well as make other strategic investments in education. In total, direct school aid will increase by about $300 million in fiscal 2010, which translates into a real increase in funding reaching the classroom. This is notable in light of current economic circumstances, particularly considering the decreases in school aid that other states have been forced to make.
Supporting the New School Funding Formula (SFRA) The new school funding formula distributes aid to all school districts on a more equitable and predictable basis than the prior funding formulas or other methods used by the State prior to the School Funding Reform Act (SFRA).
For the 2009-10 school year, the caps on increases in aid for districts above and below adequacy have been adjusted, due to the extraordinary fiscal circumstances the State is facing. Increases will be capped at 5% for districts with budgets below the adequacy budget benchmark. All districts currently spending above the adequacy benchmark will not receive an increase in state aid under the formula. The total increase in formula aid is about $151 million with 171 districts receiving increases. Expanding Preschool: The Right Decision in Difficult Times Governor Corzine has also kept his commitment to a phase-in of the preschool expansion with a $25 million increase in the FY 2010 Budget for the newly-created Preschool Incentive Aid. This is in addition to $596 million invested in existing preschool programs, the vast majority of which is spent on the Abbott preschool programs. This is an extraordinary investment and commitment in light of the current economic circumstances. It is based on the Governor’s longstanding recognition of the need for high quality early childhood education to help close the achievement gap for students before they reach kindergarten and his recognition of the need to replicate Abbott preschool opportunities for students in Non-Abbott districts.
The new $25 million in Preschool Incentive Aid will be available to the “universal” Non-Abbott preschool districts for preschool expansion for the 2009-2010 school year. The “universal districts” are those in District Factor Group A and B, as well as districts with 40% or more at-risk students among District Factor Group C and D. These districts are not required to provide preschool in the 2009-10 school year. However, Preschool Incentive Aid is being provided to leverage new federal funds to begin phase-in of the preschool expansion set forth in the School Funding Reform Act (SFRA). Eligible districts must meet specified criteria to access these funds for preschool expansion: first, the districts must provide full-day kindergarten and second, the districts must use their new Title I funds made available under the federal recovery act, the American Recovery and Reinvestment Act (ARRA), for preschool. Additional criteria and information will be specified by the NJ Department of Education. Given constraints on state resources, state funds are not available for FY 2010 for the “targeted” districts (districts that are only required to serve at-risk students) for preschool expansion. As a result, “targeted” districts will not be required to begin offering preschool to at-risk students in the fall of 2009. However, the Governor strongly encourages the “targeted” districts to use their new Title I funds provided by the ARRA to support preschool. Additional guidance forthcoming from the U.S. Department of Education should help districts determine the best way to use their Title I dollars to support preschool expansion.
40

Chapter 3
School Aid
• For the second consecutive year, the Budget invests additional resources into New Jersey’s school classrooms, increasing direct school aid by over $300 million to $8.8 billion.
• The Administration continues its commitment to early childhood education by including $52 million more for existing preschool programs.
• The Budget also includes $25 million in funding for newly created Preschool Incentive Aid. These
funds will be available to non-Abbott districts with high concentrations of poverty for expansion in the 2009-2010 school years if they commit their new recovery Title 1 funds to preschool.
School Aid$ 304 Million Increase in Funding for Classrooms
School Aid Represents 35% of Total Budget(In Millions)
FY 2009Adjusted FY 2010
Approp. Budget* $ Change
Formula Aid 7,795.4$ 7,946.4$ 151.0$
Preschool Programs 543.8 596.1 52.3
Preschool Incentive Aid - 25.0 25.0
Extraordinary Special Education Aid 52.0 130.0 78.0
Adult Education 10.0 - (10.0)
Other Aid 124.5 132.5 8.0
Total Direct School Aid 8,525.7$ 8,830.0$ 304.3$
Teachers' Pension and Annuity Fund 693.3$ 128.6$ (564.7)$
Post Retirement Medical 750.1 775.5 25.4
Debt Service on Pension Obligation Bonds 112.5 122.3 9.8
Teachers' Social Security 735.3 774.0 38.7
Total Direct State Payments for Education 2,291.2$ 1,800.4$ (490.8)$
School Construction and Renovation Fund 559.5$ 655.9$ 96.4$
Debt Service Aid 103.1 99.2 (3.9)
Total School Building Aid 662.6$ 755.1$ 92.5$
Total School Aid 11,479.5$ 11,385.5$ (94.0)$
* Includes $1,057 million in federal stimulus funding.
41

Chapter 3
Providing Services for Our Children and Young Adults School Aid
• The School Funding Reform Act has provided a total of over $665 million in increased formula aid in FY 2009 and FY 2010. Direct aid increased by $795 million in that same period.
$7.3$7.5
$7.6
$8.0
$8.5
$8.8
$6.0
$7.0
$8.0
$9.0
$10.0
FY05 FY06 FY07 FY08 FY09 FY10
Direct School Aid History(in Billions)
42

Chapter 3
Maintaining Support for Higher Education
• Overall support for Higher Education increases by 2%.
• The largest area of percentage growth is in student financial assistance, which is expected to grow rapidly as more people turn to higher education in response to shrinking employment opportunities due to the recession.
• Debt service costs are declining, as higher education facilities bonds mature and are paid
off.
• Major growth is funded for UMDNJ-Stabilization support, institutional fringe benefits, and Student Assistance (Tuition Aid Grants).
• Tuition Aid Grants growth is supported in Fiscal 2010 by federal Fiscal Stabilization Funds from the stimulus bill.
• Operating support for institutions (all sectors) is reduced by 5% - but implementation of
furlough days by public colleges and universities in fiscal 2010 could yield savings to more than offset reductions in operating support.
FY 2009Adjusted FY 2010
Approp. Budget $ %
Colleges and Universities Senior Public Colleges and Universities 1,456.7$ 1,481.8$ 25.1$ 1.7 County Colleges 221.6 219.2 (2.4) (1.1) Independent Colleges and Universities 18.4 17.5 (0.9) (5.0)
Student Financial Assistance 288.5 322.4 33.9 11.7 Educational Opportunity Fund 41.2 41.2 - - Facility and Capital Improvement Programs 88.1 76.4 (11.7) (13.3) Other Programs 10.4 9.3 (1.1) (10.7) Total Higher Education 2,124.9$ 2,167.8$ 42.9$ 2.0
Change
Higher Education(In Millions)
43

Chapter 3
Higher Education(In Millions)
FY 2009 Adjusted FY 2010Approp. Budget $ Change
Senior Public Institutions Rutgers University 309.5$ 294.0$ (15.5)$ UMDNJ 218.5 218.5 - UMDNJ - Stabilization - 30.9 30.9 NJIT 45.1 42.1 (3.0) Thomas Edison State College 5.6 5.3 (0.3) Rowan University 36.2 34.4 (1.8) New Jersey City University 30.7 29.1 (1.5) Kean University 39.4 37.4 (2.0) William Paterson University 38.7 36.7 (1.9) Montclair State University 45.5 43.2 (2.3) College of New Jersey 34.5 32.8 (1.7) Ramapo College of New Jersey 19.0 18.0 (0.9) Richard Stockton College of New Jersey 23.5 22.3 (1.2)
Subtotal Senior Publics Direct Aid 846.2$ 844.9$ (1.3)$ Senior Publics Salary Funding - - - Senior Publics Net Fringe Benefits 610.5 636.9 26.4
Total Senior Publics 1,456.7$ 1,481.8$ 25.1$ County Colleges
Operating Support(a)
149.1$ 141.6$ (7.5)$ Fringe Benefits 34.5 36.3 1.8 Chapter 12 Debt Service 38.0 41.3 3.3
Total County Colleges 221.6$ 219.2$ (2.4)$
Total Independent Colleges and Universities 18.4$ 17.5$ (0.9)$ Student Financial Assistance
Tuition Aid Grants (TAG)(b)
250.5$ 283.2$ 32.7$ Part-time TAG for County Colleges 6.0 7.1 1.1 NJSTARS I & II 14.7 17.8 3.1 EOF Grants and Scholarships 41.2 41.2 - Loan Forgiveness for Mental Health Workers 3.5 3.5 - Other Student Aid Programs 13.9 10.8 (3.1)
Total Student Financial Assistance 329.7$ 363.6$ 33.9$ Other Programs
Capital Grants and Facilities Support(c)
88.1$ 76.4$ (11.7)$ All Other Programs 10.4 9.3 (1.1)
Total Other Programs 98.5$ 85.7$ (12.9)$
Grand Total Higher Education 2,124.9$ 2,167.8$ 42.9$
(a) Includes funding from Supplemental Workforce Fund for Basic Skills of $16.0 million in FY 2009 and $14.0 million in FY 2010.(b) Includes funding from Federal Fiscal Stabilization of $34.08 million in FY 2010.(c) Includes use of off-budget fund balances totaling $1 million in FY 2009.
Note: Implementation of furlough days by public colleges and universities in FY 2010 could yield savings to more than offsetreductions in operating support.
44
Chapter 3
Protecting the Most Vulnerable of Our Population Department of Children and Family Growth • Growth in the Department of Children and Families of $368 million represents an increase
of over 50% during the Corzine Administration, largely for the requirements of the Modified Settlement Agreement (which mandates DCF to meet specific requirements agreed to by both parties).
NJ FamilyCare /KidCare • Between fiscal 2006 and fiscal 2009, enrollment was re-opened to parents with incomes
between 100% and 200% of federal poverty level. Beginning January 2006, the Governor’s initiative to promote health insurance to children has increased their enrollment.
Divisions of Developmental Disabilities and Mental Health Services • Between fiscal 2006 and 2009, growth was provided in community-based services to
address the U.S. Supreme Court’s Olmstead decision, to provide services for developmentally disabled clients on the Community Services Waiting List, and to provide prior year cost of living increases to community providers.
• Additionally, growth was provided to state institutions for salary increases for employees at the five state psychiatric hospitals and seven state developmental centers, and increased support for the six county psychiatric hospitals.
• Finally, savings also were achieved from maximizing federal and dedicated revenues, management efficiencies, overtime reductions, and shifts of several programs to other departments and divisions within Human Services.
45

Chapter 3
School Aid 973$
Rebates / Senior Property Tax Freeze 557
Subtotal Property Tax Relief 1,530
Children and Families 368
Business Employment Incentive Program 194
Family Care / Kid Care 193
Employee and Retiree Taxes and Benefits* 159
Mental Health / Developmental Disabilities 113
NJ Transit 23
Other Increases and Decreases (659)
Total 1,921$
Major Changes Between FY 2006 Appropriations Act &
FY 2010 Governor’s Budget Message(In Millions)
*State Employees & Higher Education Employees only
46

Chapter 3
Employee Benefit costs
• The costs for employee benefits continue to represent a significant dedication of state resources
• Growth has been contained in fiscal 2010 through a temporary reduction in funding for pensions. The lower contributions are necessary to sustain the Administrations’s first priorities—nurturing our children, honoring seniors, and protecting the most vulnerable.
$0
$500
$1,000
$1,500
$2,000
$2,500
$3,000
$3,500
$4,000
$4,500
$5,000
FY02 FY03 FY04 FY05 FY06 FY07 FY08 FY09 FY10
Health Benefits/PRM Pensions/Debt Service Employer Taxes
Employee Benefit Costs(In Millions)
Footnote: FY09 reflects the revised proposed spending for pensions.
47

48

CHAPTER 4: FISCAL YEAR 2010 BUDGET SOLUTIONS
Chapter 4
The Fiscal 2010 Budget achieves balance through the largest reduction in modern state history.
Faced with the worst economic crisis in seven decades, the Corzine Administration undertook a painstaking, line-by-line review of state spending. If the budget is adopted intact, about 850 of the 2,400 line items - nearly 40% - will be trimmed or eliminated.
The result: A budget that makes the right choices, after many painful decisions, to close a $7 billion projected shortfall. State workers, taxpayers, mayors, hospital administrators, college and universities all are being asked to play a small part in helping their government manage through this unprecedented crisis.
Despite the size of the overall reduction, the budget succeeds in dedicating precious public resources to our children, our elderly, the jobless, the poor, and other vulnerable residents. The safety of our citizens remains a top priority.
In comparison to the current year adjusted appropriation, the proposed Fiscal 2010 Budget slashes total spending by $3.4 billion to $29.8 billion. The budget is $1 billion smaller than the first one recommended by Governor Corzine four years ago. It is the second year in a row the Governor has sought a budget that is less than the one he signed the year before. The budget would have been $6 billion higher if growth had gone unchecked. This increase was offset by nearly $4 billion in cuts or growth deferrals and $2.2 billion in federal stimulus funds. The Fiscal 2010 Budget reduces the cost of State Operations by $380 million. A proposed salary freeze and a proposed workforce furlough will result in $420 million in savings. With federal stimulus, the Budget still provides $15.7 billion in property tax relief, more than half the budget. This includes $11.4 billion in support for preschool-12 education. Direct school aid will rise by $304 million - one of the few increases in the budget, and the largest. The Fiscal 2010 Budget maintains Homestead Rebates for nearly 1.9 million households, including senior citizens who earn $150,000 or less as well as non-seniors who earn $75,000 or less. More than 1 million homeowners will receive an average check of more than $1,000. It sets aside a $500 million reserve as a buffer against further unexpected downturns. Despite the harsh fiscal climate, the Fiscal 2010 Budget contributes $400 million into the state pension funds. Over the four-year term, the Corzine Administration has contributed more than $3.4 billion into the retirement systems. That exceeds combined state payments from fiscal 1993 through fiscal 2006. For these same four years, this Administration will have contributed more to the defined benefit plans than the combined prior 15 years.
To help offset a historically large falloff in revenues, it requires some temporary, limited tax increases, including a one-year increase in the income tax rate for those earning more than $500,000. Only 1% of all taxpayers must pay the higher rate.
49
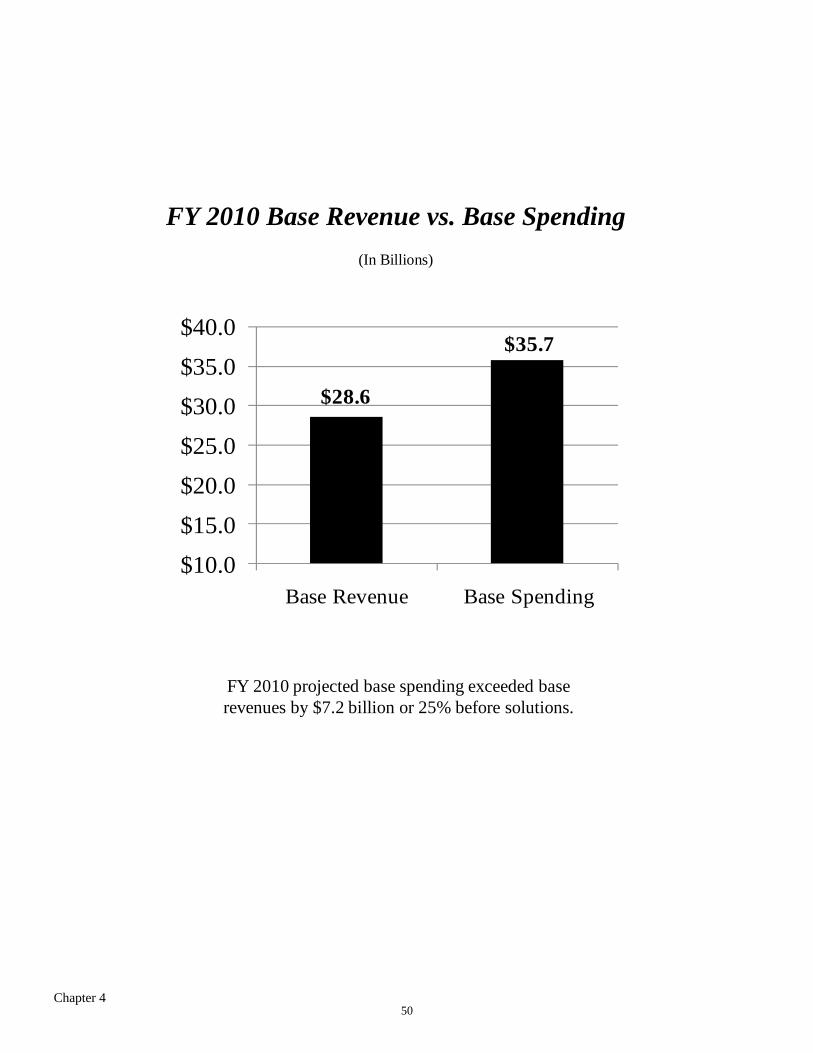
Chapter 4
FY 2010 Base Revenue vs. Base Spending(In Billions)
$28.6
$35.7
$10.0
$15.0
$20.0
$25.0
$30.0
$35.0
$40.0
Base Revenue Base Spending
FY 2010 projected base spending exceeded base revenues by $7.2 billion or 25% before solutions.
50

Chapter 4
The FY 2010 Budget(In Millions)
FY2009Adjusted FY 2010Approp. Budget $ %
Opening Surplus 1,308$ 702$ (606)$ (46.3)
Revenues Income 11,309 11,343 34 0.3 EITC Expansion (60) (55) 5 (8.3) Sales 7,925 8,085 160 2.0 Corporate 2,350 2,030 (320) (13.6) Other 8,456 8,238 (218) (2.6)
- Total Revenues 29,980$ 29,641$ (339) (1.1)
Lapses 1,760 Enhanced Medicaid Funding 533 Long Term Obligation and Capital Expenditure Fund 365
Total Resources 33,946$ 30,343$ (3,603)$ (10.6)
Appropriations Original 32,868$ 29,841$ (3,027) (9.2) Supplemental 376
Total Appropriations 33,244$ 29,841$ (3,403)$ (10.2)
Fund Balance 702$ 502$ (200) (28.5)
Change
Fiscal Year 2009 projected spending $31 billion
51

Chapter 4
How FY 2010 Budget Balanced(In Thousands)
FY 2009 Adjusted Appropriation $33,244,317 FY 2010 Net Growth 2,467,288 FY 2010 Total Projected Model 35,711,605 FY 2010 Base Revenue 28,560,514 FY 2010 Projected Structural Gap $7,151,091
ACTIONS TO CLOSE STRUCTURAL GAP $7,151,091 Reductions to Base Budget $2,516,089 Pensions 895,306 Homeowner and Tenant Rebates 517,100 Debt Restructuring 361,000 Operating Budget and Interdepartmental 184,485 Furlough and Other Employee Actions 156,600 Medicaid/PAAD 85,847 NJ Transit 62,000 Municipal and County Aid 50,545 Higher Education 22,199 Hospitals 20,800 Other 160,207 Elimination or Reduction of Projected Growth $1,108,976 Limit School Aid Increases 306,575 Salary Freezes for Public Employees Including Colleges 261,939 No Inflationary Increase for Municipal Aid 103,841 Offset FamilyCare Inflation with Federal SCHIP Funding 85,000 No Inflationary Increase for Rebates 77,700 No Rate Inflation for Nursing Homes 50,030 No Inflationary Increase for Higher Education 30,183 Other 193,708 Federal Fiscal Stimulus $2,220,892 Enhanced Medicaid Funding 1,060,000 Fiscal Stabilization 1,091,000 NJ Transit 59,100 Other 10,792 Revenue Solutions $1,080,783 Revenue Adjustments-Policy 916,500 Other Revenue Actions 164,283
Added Reductions in FY 2009 to Generate Excess Surplus $199,460 Growth Offset by Other Sources $24,891
52

Chapter 4
Portion of FY 2009 Excess Surplus,
$0.199
Reductions to Base Budget, $2.516
Elimination or Reduction of
Projected Growth, $1.109
Growth Offset by Other Sources,
$0.025Federal Fiscal
Stimulus, $2.221
Revenue Solutions, $1.081
FY 2010 Actions to Close the Gap(In Billions)
Total $7.2 billion
Of the $7.2 billion in solutions used to eliminate the FY 2010 deficit, only 15% relate to revenue initiatives.
53

Chapter 4
DEFERRALSSalary Freezes for Public and College Employees $261.9No Inflation for Municipal Aid 103.8No Inflation for Homestead Rebates 77.7No Rate Inflation for Nursing Homes 50.0No Growth in Higher Education Operating 30.2No New Community Provider COLA 28.7
DECREASESPension Contribution $895.3Homeowner and Tenant Rebates 517.1Employee Related Savings/Operating 341.1NJ FamilyCare (due to increased federal funds) 85.0NJ Transit 62.0Municipal and County Aid 50.5College and University Operating Support 39.8Savings from Enhanced Medicaid Fraud Prevention 25.0Savings from Smarter Procurements 25.0Hospital Reductions 20.8
FY 2010 Deferrals/Decreases(In Millions)
54

Chapter 4
School Aid (excludes school construction) $374.3
School Construction Debt Service 96.4
Governor's Economic Recovery Program 75.2
Tuition Aid Grants / NJ STARS 37.0
Olmstead Funding (Mental Health / Developmental Disabilities) 20.7
Aid to County Psychiatric Hospitals 15.1
Includes only a sampling of increases
FY 2010 Increases(In Millions)
55

Chapter 4
Tax Policy Changes Gross Income Tax One-year tax rate increase for incomes over $500,000 620$ One-year suspension of Property Tax Deduction for Non-Seniors 160 with incomes greater than $150,000 Tax Lottery winnings > $10k 8
788 Corporation Business Tax - extend 4% surcharge that was to expire 80 Cigarette Tax - increase of 12.5 cents to $2.70/pack 26 Alcohol Tax - 25% increase excluding beer 22
916$
Alternate Use of Other Funds State Disability Benefit Fund 50 Workers' Compensation Security Fund 20 Enterprise Zone Assistance Fund 14 New Home Warranty Security Fund 10 Unemployment Compensation Auxiliary Fund 2 Motor Vehicle Fees 20
116
Other Mental Health Hospital County Share - increase from 12.5% to 15% 5 Casino Revenue Fund - unclaimed slot machine vouchers 4 Lottery - NJ Powerball 40
49
Total Revenue Solutions 1,081$
Fiscal Year 2010 Revenue Solutions(In Millions)
56

Chapter 4
Impact of Proposed Income Tax Increase
1% > $500,000
Income
Approximately 44,000 of the nearly 3.9 million income tax filers and taxpayers not required to file State income tax returns will be impacted by the proposed change.
57

Chapter 4
FY 2010Approp. Budget $ %
Chief Executive 5,268$ 4,684$ (584)$ (11.1)Agriculture 22,463 24,629 2,166 9.6Banking and Insurance 71,441 67,548 (3,893) (5.4)Children and Families (a) 1,089,292 1,092,294 3,002 0.3Community Affairs 1,150,936 1,109,903 (41,033) (3.6)Corrections 1,196,087 1,189,378 (6,709) (0.6)Education (b) 11,570,338 10,413,691 (1,156,647) (10.0)Environmental Protection 434,178 370,092 (64,086) (14.8)Health and Senior Services (a) 1,602,124 1,243,878 (358,246) (22.4)Human Services (a) 4,958,236 4,592,365 (365,871) (7.4)Labor & Workforce Development (c) 306,130 147,029 (159,101) (52.0)Law and Public Safety 609,539 591,184 (18,355) (3.0)Military and Veterans' Affairs 94,725 91,292 (3,433) (3.6)Public Advocate 17,130 16,834 (296) (1.7)State (b) 1,283,674 1,258,396 (25,278) (2.0)Transportation 1,386,832 1,283,197 (103,635) (7.5)Treasury (c) 3,440,393 2,670,238 (770,155) (22.4)Miscellaneous Commissions 1,456 1,456 - -
Subtotal Executive Branch 29,240,242$ 26,168,088$ (3,072,154)$ (10.5)
Interdepartmental 3,288,424$ 2,950,469$ (337,955)$ (10.3)
Legislature 74,644$ 73,815$ (829)$ (1.1)Judiciary 641,007$ 648,385$ 7,378$ 1.2
Total 33,244,317$ 29,840,757$ (3,403,560)$ (10.2)
(a) FY 2010 appropriations are net of $1,060 million in federal stimulus.(b) FY 2010 appropriations are net of a total of $1,091 million in savings in DOE ($1,057 million) and Higher Education/State($34 million) from federal stimulus.(c) FY 2009 includes appropriations shifted from Department of Personnel.Growth in Judiciary for incarceration diversion programs generates savings in the Department of Corrections Grants-in-Aid.
FY 2009 Adjusted Change
Appropriations Comparison(In Thousands)
Fiscal Year 2009 projected spending $31 billion
58

Chapter 4
Hospital Funding – State and Federal(In Millions)
FY 2009Adjusted F Y 2010Approp. Budget Change
Charity Care $605.0 $605.0 $ -
Health Care Stabilization Fund 44.0 40.0 (4.0)
Hospital Relief Offset Payments 198.0 191.6 (6.4)
Cancer Grants 48.0 38.4 (9.6)
Graduate Medical Education 68.0 60.0 (8.0)
Hospital Asset Transformation Program 12.5 16.5 4.0
TOTAL $975.5 $951.5 ($24.0)
State support for hospitals declines by only 2.5% in FY 2010 while maintaining level funding for Charity Care.
59

Chapter 4
Use of Non-Recurring Resources(In Millions)
Gov Budget
FY 2003 FY 2004 FY 2005 FY 2006 FY 2007 FY 2008 FY 2009 FY 2010
Tobacco Securitization 1,557$ 1,612$ -$ -$ -$ -$ -$ -$ New Revenue Securitization - - 1,930 - - - - - Unemployment Insurance Fund 325 325 100 350 - - - - Millionaire's Tax - Retroactive Impact - - 156 - - - - - PAAD Waiver 147 148 - - - - - - CBT Accelerated Payments 651 - - - - - - - Car Registration Acceleration - - 16 22 22 6 - - Unclaimed Property 100 - - - - - - - Securities Enforcement Collections - 10 2 - - - - - Real Estate Guarantee - 1 - - - - - - NJ Redevelopment Authority - 9 - - - - - - Hotel Revenue State Share - 25 - - - - - - Economic Development Authority - 30 2 2 - - - - Catastrophic Illness in Children Relief Fund - 4 - - - 5 - Educational Facilities Authority - - 2 - - - - - Federal TANF Balances 70 86 18 - - - - - VOI/TIS Federal Funds 12 13 - - - - - - Cash Management Fund 20 - - 12 - - - - Free Public Schools 25 - - - - - - - Meadowlands Commission 62 - - - - - - - Sanitary Landfill Contingency 6 6 - - - - - - Second Injury Fund 20 - - 5 - - - - Surplus Lines 43 - - - - - - - UMDNJ Self Insurance Fund 77 - - - - - - - UEZ Balances 37 - - - - - 6 - Mutual Workers' Compensation Fund - - 5 - - - - - Petroleum Surcharge Fund - - - 5 - - - - PAAD / ADDP Rebate Receivable - - - 56 - - - - PAAD Medicare D Administration - - - 5 - - - - Bond Refinancing - - - 150 - - - - Benefit Enhancement Fund / Pensions - 126 265 385 - - - - Asset Sales - - - 200 - - - - Family Care * - - - - - - 55 - Tobacco Settlement Fund - - - 10 13 - - - New Home Warranty Security Fund - - - 20 - - 10 10 Phase-out of Casino Comps - - - 43 - - - - Public Records Preservation Fund - - - 5 - 10 - - G.O. / Bldg. Authority Refinance Savings - - - 266 - - - - Health Benefits / Rx Fund Balance - - - 60 - - - - Health Care Subsidy Fund - - - - 12 6 - Passaic River Litigation - Spill Fund - - - - - - 6 6 Higher Education Capital Improvement Fund - - - - - - 1 - Market Transition Facility - - - - 11 - - Supplemental Workforce Fund - - - - 6 - - Cigarette Tax Revenue (Non-Pledged) - - - - 42 - - Cigarette and MVC Revenues - - - 243 - - - - Tobacco Settlement Debt Restructuring - - - - - 56 - - Workers Compensation Security Fund - - 5 - - - - 20 Recycling Fund - - - - - - 7 - Emergency Services Fund - - - - - - 6 - Body Armour Fund - - - - - - 5 - Emergency Medical Tech. Training - - - - - - 4 - Unclaimed County Deposits - - - - - - 3 - Worker and Community Right to Know - - - - - - 3 - Fund Shifts (various) - - - - 44 - - -
Total, Dedicated fund Diversions 3,152$ 2,395$ 2,501$ 1,839$ 79$ 143$ 117$ 36$ General Fund Surplus ** 15 - 463 44 794 1,597 500 200 Federal Stimulus / Fiscal Stabilazation 106 433 - - - - 250 1,091
Grand Total *** 3,273$ 2,828$ 2,964$ 1,883$ 873$ 1,740$ 867$ 1,327$
Comparing Approp Act to Approp Act * FY 2008 Budget assumed federal funding shortfall which did not materialize.** Of the FY 2007 amount, $650 million was related to Sales Tax Revenue deferred for Property Tax Relief purposes.*** Certain actions reflected on past versions of this chart were removed if the diversion was maintained for at least three years and is expected to continue.
60

Chapter 4
Average Annual Diversions from Dedicated Funds Down by 96% Compared to FY 2003 – FY 2006
(In Billions)
$3.2
$2.4 $2.5
$1.8
$0.1 $0.1 $0.1$0.1
$0.0
$0.5
$1.0
$1.5
$2.0
$2.5
$3.0
$3.5
$4.0
2003 2004 2005 2006 2007 2008 2009 2010
Average FY 2003 – 2006 $2.6 billion
Average FY 2007 – 2010$0.1 billion
61

Chapter 4
$1.3
$0.9
$1.7
$0.9
$1.9
$3.0$2.8
$3.3
$0.0
$0.5
$1.0
$1.5
$2.0
$2.5
$3.0
$3.5
$4.0
2003 2004 2005 2006 2007 2008 * 2009** 2010***
Average FY 2003 - 2006$2.8 billion
Average FY 2007 - 2010$1.2 billion
Diversions from Dedicated Funds, Federal Stimulus and Prior Year Surpluses
(In Billions)
* Includes $650 million of deferred Sales Tax revenue.** FY09 includes $250 million in federal stimulus-stabilization funds.*** FY10 includes $1.1 billion in federal stimulus-stabilization funds.
62

CHAPTER 5: PROPERTY TAX OVERVIEW
Chapter 5
Governor Corzine has taken important steps to alleviate the property tax burden, which, to many, is New Jersey’s most pressing problem. In 2007, in conjunction with the Legislature, he enacted a new law requiring local officials to limit annual increases in property tax levies. The goal was 4 percent, with several exceptions that would permit higher levies. The so-called “levy cap” law took full effect in 2008. In the five years before the new limits were put in place, the total levy rose by an annual average of 6.6 percent. In 2008, the school levy - by far the largest part of most local property tax bills - rose by just 3 percent. The growth of the total levy - including municipal and county taxes - was limited to 4.9 percent. While higher than the desired goal of 4 percent, it was the lowest rate of growth in a decade. Had the 2008 levy instead risen by the 6.6 percent five-year average, local taxpayers would have paid nearly $378 million more in property taxes. The stabilizing effect of the Governor’s policies is also reflected in average tax bills, where growth in 2008 was limited to 3.7 percent. In the previous five years, the average annual increase was 6.5 percent. At that rate, last year’s statewide average tax bill would have been $193 higher. Looking at another measure, in 2005, average bills increased by 10 percent or more in 82 municipalities. As further evidence that 2007 property tax reforms are taking hold, that number fell to 20 last year. In 2005, average bills rose 4 percent or less in just 114 municipalities. Last year, the number jumped to 266. That’s nearly half of all New Jersey municipalities. The proposed Fiscal 2010 Budget furthers the Governor’s commitment to try to ease the property tax burden. With federal assistance, more than half the budget - $15.7 billion - is dedicated to programs that reduce the burden on property taxpayers. This includes $11.4 billion in support for preschool - 12 education. Direct school aid will rise by $304 million - one of the few increases in the budget, and the largest. The current global recession will force temporary reductions in direct property tax relief payments to state residents in the 2010 budget year. Even so, no previous administration will have provided more direct relief to property taxpayers. Counting payments planned for the new budget year, taxpayers will have received a record $6.9 billion during Governor Corzine’s administration. The Fiscal 2010 Budget allots nearly $1.7 billion for property tax relief through direct cash payments or credits to State residents. The largest of the state’s direct property tax relief programs is the Homestead Property Tax Credit/Rebate program for homeowners and tenants. Despite severe budget constraints, this Budget still allocates $1.174 billion for fiscal 2010.
63

Chapter 5
The homeowner’s portion of the Fiscal 2010 Homestead Credits/Rebates for Homeowners program is recommended at $1.044 billion. In excess of one million homeowners will receive rebates at an overall average of more than $1,000 per homeowner. An estimated 500,000 seniors will receive average checks of $1,250, while more than 500,000 non-seniors will receive average rebate checks of $800. Overall, nearly 782,000 homeowners will receive the same rebate levels that they received in fiscal 2009. Funding for Homestead Property Tax Rebates for Tenants totals $129 million. More than 800,000 tenants will also continue to receive direct property tax relief in the form of rebates from the Homestead Rebates for Tenants program. The Fiscal 2010 Budget also funds the Senior Property Tax Freeze program. Spending rises by $3.5 million to $172.5 million. Senior Freeze checks averaged in excess of $1,000 last year. The Governor and Legislature also enacted legislation last year that raised the income eligibility. While many other states have reduced aid support for public education during these difficult economic times, Governor Corzine’s budget increases direct aid by approximately $300 million. This increase will provide vitally important resources for the classroom. No district will receive less than it received in FY 2009, and 171 school districts will receive increases. This aid will help ease the local burden for funding educational programs through the property tax. Also in the Fiscal 2010 Budget, municipal aid has been held essentially flat at $1.803 billion. Governor Corzine and the Legislature also adopted several other reforms that will have a lasting impact on property taxes. The efforts of the State Comptroller will have a strong deterrent effect on wasteful spending, and will continue rooting out mismanagement at all levels of government. This will save taxpayer dollars. Last September, Governor Corzine enacted legislation that mandates sweeping pension and health benefit reforms at both the State and local levels of government. Local savings alone will exceed $1.6 billion through 2022. Governor Corzine also has proposed legislation that would give municipalities, towns, counties and school boards a temporary break from their full pension contributions at a time when local budgets are under the financial strain of a global recession. It would protect property taxpayers from having to shoulder an additional $500 million in budgetary costs to local governments at a time when many households and businesses are experiencing severe fiscal stress.
Since its initial meeting last summer, the Local Unit Alignment, Reorganization and Consolidation Commission have worked hard to identify service areas ripe for municipal cost-sharing. Those areas include health, courts and emergency management. During the Corzine Administration, municipalities have received 104 grants totaling nearly $7.6 million through the Sharing Available Resources Efficiently (SHARE) program.
64
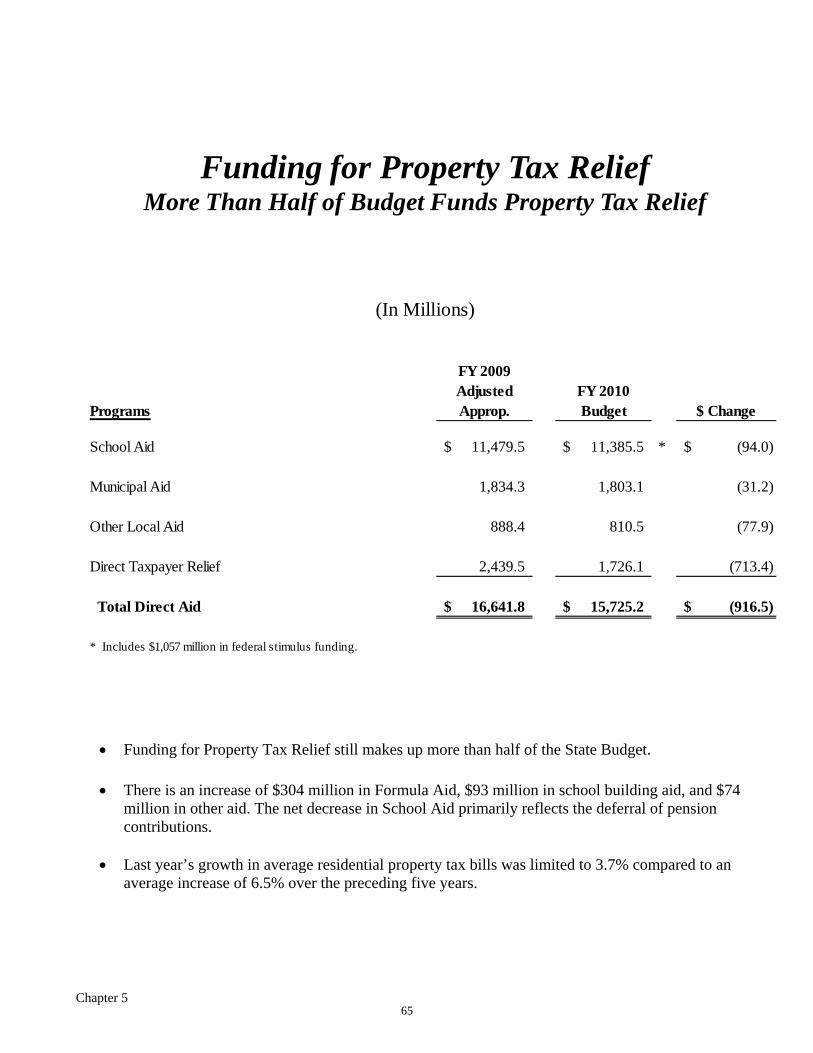
Chapter 5
FY 2009Adjusted FY 2010
Programs Approp. Budget $ Change
School Aid 11,479.5$ 11,385.5$ * (94.0)$ Municipal Aid 1,834.3 1,803.1 (31.2) Other Local Aid 888.4 810.5 (77.9) Direct Taxpayer Relief 2,439.5 1,726.1 (713.4) Total Direct Aid 16,641.8$ 15,725.2$ (916.5)$ * Includes $1,057 million in federal stimulus funding.
Funding for Property Tax ReliefMore Than Half of Budget Funds Property Tax Relief
(In Millions)
• Funding for Property Tax Relief still makes up more than half of the State Budget.
• There is an increase of $304 million in Formula Aid, $93 million in school building aid, and $74
million in other aid. The net decrease in School Aid primarily reflects the deferral of pension contributions.
• Last year’s growth in average residential property tax bills was limited to 3.7% compared to an
average increase of 6.5% over the preceding five years.
65

Chapter 5
Direct Property Tax Relief Is Preserved for Senior Citizens and Those with Incomes under $75,000
• The reduction in Direct Property Tax Relief exclusively affects non-senior residents of the state while preserving and even increasing direct tax relief for senior citizens. Eligibility for the Senior Tax Freeze program is expanded to include 20,000 more seniors.
• In fiscal 2010, homestead rebates for seniors and mid-income non-seniors remain at this year’s level, providing a rebate of 20% of the property tax bill for seniors under $100,000 in income and non-seniors under $50,000 in income. Higher income seniors (over $100,000) will continue to receive rebates at 10% and, for one year, non-seniors up to $75,000 will be reduced to two-thirds of what they received this year.
• Temporary cuts in homestead rebates affect non-seniors over $50,000 in income, with rebates for non-seniors over $75,000 in income temporarily eliminated.
• The property tax deduction on the State’s income tax is preserved for all seniors and for non-
seniors with incomes less than $150,000.
FY 2009Adjusted FY 2010
Approp. Budget $ Change
Homestead Property Tax Credits/Rebates for Homeowners 1,583.5$ 1,044.4$ (539.1)$ Homestead Rebates for Tenants 124.0 129.2 5.2
Senior/Disabled Citizens Property 169.0 172.5 3.5 Tax Freeze
Property Tax Deduction Act 471.0 291.0 (180.0)
Municipal Reimbursement - 71.5 69.5 (2.0) Veterans' Tax Deductions Municipal Reimbursement - Senior/Disabled 20.5 19.5 (1.0) Citizens' Tax Deductions
Total Direct Property Tax Relief 2,439.5$ 1,726.1$ (713.4)$
Direct Property Tax Relief(In Millions)
66

Chapter 5
Governor Corzine Increased Funding for Direct Property Tax Relief
• During Governor Corzine’s Administration, spending on direct property tax relief programs has increased by approximately 33% to nearly $7 billion, from the previous four year period total spending of $5 billion.
• This comprises 5.5% of the four-year total State budget – the highest percentage for any administration since Governor Byrne (FY 1979-1982).
Direct Property Tax Relief ExpendituresFY 1977 – FY 2010
Corzine Administration Provided Nearly $7 Billionin Direct Property Tax Relief
(In Billions)
2.0%
2.5%
3.0%
3.5%
4.0%
4.5%
5.0%
5.5%
6.0%
$-
$1.0
$2.0
$3.0
$4.0
$5.0
$6.0
$7.0
$8.0
FY7 7-78 FY7 9-82 FY83-86 FY87-9 0 FY91 -94 FY95 -98 FY9 9-02 FY03-06 FY07-1 0
Direct Property Tax Relief Exp enditures Direct R elief as % of Bu dget
Programs Included: Homestead Rebates for Homeowners, Homestead Rebates for Tenants, Senior Tax Freeze, NJSAVER, Senior and Disabled Citizens’ Property Tax Deduction and Veterans’ Property Tax Deduction.
67

Chapter 5
$1,830$1,989
$2,242 $2,362 $2,337
$0
$500
$1,000
$1,500
$2,000
$2,500
FY06 FY07 FY08 FY09 FY10
Aver
age
Reba
te A
mou
nts
Substantial Property Tax Relief for Senior Homeowners Continues
Senior Freeze Homestead Rebates
• The average combined reimbursement for property taxes to senior homeowners eligible for both the Homestead Rebate and Senior Property Tax Freeze program will be over $2,300 in fiscal 2010.
• The Senior Freeze program is expanded to include seniors with incomes up to $70,000 in fiscal 2010, an estimated increase of 20,000 seniors, with the average benefit for all 166,000 program recipients estimated at over $1,000.
• The Fiscal 2010 Homestead Rebate program will provide the same benefit level to seniors as in fiscal 2009, with average checks of $1,300 for those with incomes up to $70,000.
68

Chapter 5
Homeowner Income (Seniors)
Projected Recipients Percent of Property Taxes
Average Benefit
$0-100,000 468,000 20% $1,295$100,001-150,000 36,000 10% $763
Homeowner Income (Non-Seniors)
Projected Recipients Percent of Property Taxes
Average Benefit
$0-50,000 278,000 20% $890$50,001-75,000 232,000 13.34% $670
Tenant Income (Seniors)
Projected Recipients Maximum Benefit
$0-100,000 108,000 $860
Tenant Income (Non-Seniors)
Projected Recipients Maximum Benefit
$0-50,000 622,000 $80$50,001-75,000 117,000 $54
Senior Freeze Projected Recipients Average CheckFirst Time Recipients 40,000 $225Repeat Recipients 126,000 $1,298
FY 2010Property Tax Relief Benefit Levels
• In fiscal 2010, homestead rebates for seniors and mid-income non-seniors remain at this year’s level, providing a rebate of 20% of the property tax bill for seniors under $100,000 in income and non-seniors under $50,000 in income. Higher income seniors (over $100,000) will continue to receive rebates at 10% and, for one year, non-seniors up to $75,000 will be reduced to two-thirds of what they received this year.
• Rebates for tenants are unchanged for seniors, temporarily reduced to two-thirds for non-seniors with incomes between $50,000 and $75,000, and temporarily eliminated for non-seniors with incomes over $75,000.
69

Chapter 5
FY 2009Adjusted FY 2010
Approp. Budget $ Change
Consolidated Municipal Property Tax Relief 1,597.4$ 1,565.3$ (32.1)$ Aid (CMPTRA) / Energy Tax Receipts
Special Municipal Aid 145.4 142.4 (2.9)
Trenton Capital City Aid 35.6 34.9 (0.7)
Extraordinary Aid 25.0 24.5 (0.5)
Consolidation Fund / SHARE 3.0 8.0 5.0
Highlands Protection Fund Aid 12.0 12.0 -
Open Space - Payment In Lieu of Taxes (PILOT) 10.0 10.0 -
Regional Efficiency Aid Program (REAP) 6.0 6.0 -
Total Direct Municipal Aid 1,834.3$ 1,803.1$ (31.2)$
Municipal Aid(In Millions)
• The largest pot of municipal funding - $1.6 billion available from Consolidated Municipal Property Tax Relief Aid and Energy Tax Receipts is being reduced by 2 percent. The reduction is being allocated using principles also used to allot most education aid. Municipalities with low tax rates and high incomes will receive 95 percent of their funding, while those with high tax rates and low incomes will receive 100 percent.
• The recommended municipal aid reduction can be offset by local pension deferral savings and federal stimulus funds from the Community Oriented Police Services (COPS) program.
• The total municipal aid reduction represents less than 0.5% of total spending by municipalities last year.
• The median impact on average residential tax bills due to the reduction in Consolidated Municipal
Property Tax Relief Aid (CMPTRA) and Energy Tax Receipts aid will be only about $8.
70

Chapter 5
Impact of 4% Local Spending Cap
• In 2005, average property tax bills increased by 4% or less in only 114 municipalities. That number
jumped to 266 municipalities last year (nearly half of all New Jersey municipalities).
• In 2005, average property tax bill increased by 10% or more in 82 municipalities. That number dropped to only 20 municipalities last year.
0
50
100
150
200
250
300
350
400
Municipalities between 4% and 10%
Municipalities at 4% or lower
Municipalities at 10% or higher
Numbe
r of M
unicipa
lities
Average Property Tax Bill Trends Before 2007 Corzine Reforms...
2004‐05
0
50
100
150
200
250
300
350
400
Municipalities between 4% and 10%
Municipalities at 4% or lower
Municipalities at 10% or higher
Num
ber o
f Mun
icipalities
...and After...
2007‐08
71

Chapter 5
School Aid
• For the second consecutive year, the Budget invests additional resources into New Jersey’s school
classrooms, increasing direct school aid by over $300 million to $8.8 billion.
• The Administration continues its commitment to early childhood education by including $52 million more for existing preschool programs.
• The Budget also includes $25 million in funding for newly created Preschool Incentive Aid. These
funds will be available to non-Abbott districts with high concentrations of poverty for expansion in the 2009-2010 school years if they commit their new recovery Title 1 funds to preschool.
School Aid$ 304 Million Increase in Funding for Classrooms
School Aid Represents 35% of Total Budget(In Millions)
FY 2009Adjusted FY 2010
Approp. Budget* $ Change
Formula Aid 7,795.4$ 7,946.4$ 151.0$
Preschool Programs 543.8 596.1 52.3
Preschool Incentive Aid - 25.0 25.0
Extraordinary Special Education Aid 52.0 130.0 78.0
Adult Education 10.0 - (10.0)
Other Aid 124.5 132.5 8.0
Total Direct School Aid 8,525.7$ 8,830.0$ 304.3$
Teachers' Pension and Annuity Fund 693.3$ 128.6$ (564.7)$
Post Retirement Medical 750.1 775.5 25.4
Debt Service on Pension Obligation Bonds 112.5 122.3 9.8
Teachers' Social Security 735.3 774.0 38.7
Total Direct State Payments for Education 2,291.2$ 1,800.4$ (490.8)$
School Construction and Renovation Fund 559.5$ 655.9$ 96.4$
Debt Service Aid 103.1 99.2 (3.9)
Total School Building Aid 662.6$ 755.1$ 92.5$
Total School Aid 11,479.5$ 11,385.5$ (94.0)$
* Includes $1,057 million in federal stimulus funding.
72

CHAPTER 6: MANAGEMENT EFFICIENCY & SAVINGS MEASURES
Chapter 6
Whether in good or bad economic times, government must apply constant pressure to improve operational efficiency, both to ensure the wisest use of tax dollars and to achieve the standard of best practices. Given today’s extraordinary fiscal challenges, this Administration has intensified these efforts. Every dollar saved and stretched helps to preserve a critical service or function. Most prominently, Governor Corzine has dramatically reduced the size of the State workforce. In the first half of Fiscal 2009 alone, the total number of staff has declined by 1,900 or nearly 3%. Since the start of this Administration in Fiscal 2007, head count has been reduced by a total of nearly 4,000 in the Executive Branch, representing an annualized savings of approximately $312 million in salary and fringe benefits across all fund sources. In order to meet the continuing demands to spend less on the operations of State Government, the Fiscal 2010 Budget assumes additional workforce-centered reductions through $420 million in savings from a proposed salary freeze and proposed workforce furlough. For the third straight year, operational budgets for State departments have been reduced. The Fiscal 2010 Budget assumes more than $380 million in year-to-year spending reductions on departmental operations. The Fiscal 2010 Budget continues the $25 million procurement savings program initiated in the current year and adds a new, centrally-budgeted $40 million savings target for management efficiencies across all State departments. In addition, agencies have been individually challenged to identify new ways to accomplish their mission at less cost. Some of their more innovative responses are highlighted below and on the pages that follow. The Fiscal 2009 Appropriation Act reduced the Interdepartmental Rent Budget by $25 million and directed departments to implement “smarter procurement” initiatives to reduce operational costs. As noted in the chart entitled “FY2009 Procurement Efficiencies”, that goal was successfully attained through a mixture of strategies, including office rent savings, contract reform, and demand reduction. Notable initiatives included:
• Treasury’s renegotiation of long-term office leases will net $2.3 million in rent abatements; • Reform of Human Services’ unit dose drug contract at various institutions will save $450,000 by
adjusting pharmacy staffing at the Division of Development Disabilities and Mental Health residential facilities and moving to 30-day prescriptions that maximize reimbursements from Medicare and third-party insurance;
• The Office of Information Technology’s (OIT) restructuring of mainframe maintenance contracts with top suppliers will save $600,000;
• Elimination of 450 parking spots due to statewide staff attrition will save $700,000, half of which is from State funds; and
• Treasury’s Office of Energy Savings will use a new system to comprehensively monitor all utility costs, saving an estimated $2.7 million by targeting conservation measures at high-use State facilities.
73
Chapter 6
To expand this procurement efficiency effort in Fiscal 2010, the Office of the Treasurer has arranged cross-agency teams to examine unique savings opportunities that span multiple departments in areas such as food purchasing, courier and mail services, hardware maintenance, and consolidation of printing and forms. Though these services are typically low-profile in nature, they contain untapped opportunities for savings by eliminating redundancy, reforming contracts, and purchasing cooperatively. The food group alone identified savings totaling $500,000 in Fiscal 2009 by consolidating across institutional programs (e.g., Corrections, Human Services), substituting less expensive products, and controlling food portions. Each team reports periodically to a Senior Governance Council staffed with high level officials from the Treasurer’s Office, Governor’s Office and the Office of Management and Budget (OMB), thus maintaining momentum and an ongoing expectation of innovation, creativity, and accomplishment. Mirroring similar efforts by private business and other states, the Office of the Treasurer plans to engage vendors who do business with the State in a dialogue designed to produce deeper discounts on a variety of products and services. This initiative will include forums, some of which will be arranged by industry sector, to identify management changes that the State could implement to reduce the current cost of doing business. Those savings will be passed along to the State in the form of pricing adjustments. In addition, a special renegotiation effort will focus on high-volume vendors. In addition, the ongoing moratorium on the purchase of furniture and personal computers was expanded to include all equipment as well as materials and supplies, information technology and professional services. Approval of OMB, the Treasurer’s Office, and in some cases OIT is now required, and agencies are regularly asked to rethink such purchases, justifying their importance and whether they could be addressed in a less expensive manner. The remainder of this section provides prime examples of agency-inspired efficiencies, all of which yielded significant budget savings or cost avoidance in Fiscal 2010. Several of these initiatives -- including the reduction of State staff, a planned reduction of State cars, and program audits to reduce fraud -- address issues that were prominently mentioned by citizens who forwarded budget savings ideas to the website (http://www.state.nj.us/governor/home/index.shtml) established by the Governor’s Office for that purpose.
74

Chapter 6
$1.9 (8%)
$2.4 (10%)
$2.6 (10%)
$3.9 (16%)
$4.2 (17%)
$4.4 (17%)
$5.5 (22%)
$0.0 $1.0 $2.0 $3.0 $4.0 $5.0 $6.0
Equipment/Materials/Supplies
Info. Technology/Communications
Contract Reform
Office Rent/Facilities
Other/Operational
General Admin./Program Cuts
Fuel/Energy
FY2009 $25 Million Procurement Efficiencies(In Millions)
$25 million procurement savings continues into FY2010
75

Chapter 6
$7.3 $7.3
$4.8
$1.1
$4.0
$2.6
$0.0
$2.0
$4.0
$6.0
$8.0
$10.0
$12.0
$14.0
$16.0
$18.0
Requested Recommended
millions
NJ Public Health, Environmental & Agricultural LabFY 2010 Equipment Budget
Telecommunications Equipment
Furniture, Fixtures & Equipment
Scientific Equipment
$16.1
$11.0
New Health and Agriculture Lab – Equipment
• Total FY2010 request reduced by $5.1m (32%), from $16.1m to $11.0m:
• $7.3m - scientific equipment fully approved by Capital Commission • $1.1m - furniture, fixtures and equipment, 77% less than original request ($4.8m) • $2.6m - telecommunications equipment, 35% less than original request ($4m)
• Efficiencies:
• Substituted used furniture from surplus property, Health/Agriculture administration building and Sierra Park Lab;
• Reduced requested quantities to minimal amounts; • Life cycle of existing computers and telecommunications equipment was lengthened; • Requested equipment for a full service cafeteria was removed.
• Funding via a line of credit with a debt service payment of $1.6 million in fiscal 2010 in DHSS
budget;
• Joint effort by the Division of Property Management and Construction, the Office of Management and Budget, the Departments of Health and Senior Services and Agriculture, and the Office of Information Technology.
76

Chapter 6
7,000
7,100
7,200
7,300
7,400
7,500
7,600
7,700
7,800
7,900
8,000
8,100
8,200
8,300
8,400
8,500
McGreevey Administration (1/1/2002)
Corzine Administration (1/17/2006)
Corzine Administration (3/3/2009)
Corzine Administration (FY10 Projected)
State‐Issued Passenger Vehicles2002 ‐ Current
Includes Sedans, Station Wagons, Passenger vans, Mini-vans and SUVs.
Does not include vehicles assigned to the Department of Children and Families which have risen in recent years due to court-mandated requirements.
State-Issued Passenger Vehicles
The Fiscal 2010 Budget includes a reduction of an estimated 400 cars which, together with previous recalls under this Administration, will shrink the total fleet by nearly 1400 cars (17%) from 8,400 to 7,000.
• From the start of this Administration through fiscal 2009, a reduction of 980 vehicles (12%) was implemented.
• The 400 vehicles to be eliminated in fiscal 2010 represent an additional cut of 5%, representing vehicles that are aged, underutilized, or recalled from certain administrative assignments.
• The salvage value of the 400 cars to be withdrawn in fiscal 2009 is estimated at $600,000.
77

Chapter 6
Department of Treasury – Other Efficiencies
Elimination of Commercial Gasoline Credit Cards
• State-issued credit cards used by State employees to purchase motor fuel at commercial gas stations have been eliminated, generating savings of $240,000 in fiscal 2010. Instead, the 1,100 State employees who use these cards must now refuel at one of the 72 State-operated filling stations to take full advantage of bulk-pricing discounts of about 77 cents per gallon. This savings initiative was identified by a cross agency team designed to develop procurement efficiencies.
Printing and Postage Savings through Elimination of Certain Tax Forms
• The Divisions of Taxation and Revenue within the Department of Treasury continue to take advantage of paperless filing technologies, saving over $300,000 in fiscal year 2010 printing and postage costs by eliminating the mailing of various printed forms, including the Corporation Business Tax Booklet, the Income Tax Withholding Table Booklet, and the Quarterly Employers Report package. Also eliminated are the Income Tax Return Form NJ-1040, the Tenant Homestead Rebate Application Form TR-1040, and Partnership Return Booklets to electronic filers.
78

Chapter 6
Department of Human Services
Institutional Non-Salary Savings
Total savings of $1.8 million is projected in energy and other operating costs at three Human Services institutions, including:
• $1 million from moving from the 130-year old Greystone Park Psychiatric Hospital to a more consolidated campus with modern climate control and security systems that will reduce utility costs and enhance patient safety.
• $800,000 in utility and maintenance savings from contracted professional services improvements at Ancora and Hagedorn facilities.
Hospital Savings ReasonGreystone Park $1,000 Move to new, modern, consolidated, energy efficient campus
Ancora $200 Energy and contracted professional services savingsHagedorn $600 Energy, maintenance, and contracted professional services savingsTotal $1,800
Psychiatric Hospital Non‐Salary Savings by Institution ($000's)
Developmental Center Cottage Closures
• Based on the decrease in patients from FY2006 – 2009 at the seven state developmental centers, five residential cottages at these centers will be closed in FY2009, generating $1.3 million in overtime savings in FY2010.
• Affected staff will either move to other cottages at the same campus or will assist clients in the Division of Developmental Disabilities’ community programs.
Greenbrook Vineland North Jersey Woodbine New Lisbon Woodbridge Hunterdon TotalFY2006 99 478 398 506 513 477 591 3,061FY2007 103 472 394 508 499 461 589 3,027FY2008 100 465 394 504 476 435 578 2,950
FY2009 (Proj.) 95 474 383 485 403 405 571 2,816
Developmental Center Census, FY2006 - 2009
79

Chapter 6
Department of Human Services – Other Efficiencies
Reduce Human Services’ Community Provider Ceilings
• Fiscal 2010 appropriations to third party providers serving Department of Human Services’ clients were reduced by $8.2 million in the Divisions of Developmentally Disabled ($7 million) and Mental Health ($1.2 million) if historical spending (e.g., Fiscal 2008) was less than the projected Fiscal 2010 contracted amount. This pro-active approach replaces the current practice of recovering under-spending after the end of the fiscal year and not reducing future year appropriations.
General Assistance Compliance Review
• To ensure that only those who are eligible are receiving benefits, the Division of Family Development will review case management practices at county welfare agencies to verify client eligibility and the accuracy of cash benefits and emergency assistance payments, saving an estimated $3.6 million.
Federally Qualified Health Centers Efficiencies
• Enhanced audits of community health centers will ensure that federally- mandated Medicaid add-on payments made to these facilities are being properly calculated, yielding savings of $1.3 million.
Medicaid Client Eligibility Efficiencies
• New requirements will ensure that individuals receiving services from the State enroll in the federally-funded Medicare program if they are eligible. This will save $6 million in State funds by shifting costs for health care and prescription drugs to the federal government.
Other Efficiencies Space Utilization Initiatives
• Treasury’s Division of Property and Management and Construction identified $4.3 million in total rent consolidation savings in fiscal 2010, including:
• Elimination or consolidation of 14 leases will generate savings of $3.3 million, most prominently in the Departments of Health and Senior Services ($950,000) and Law and Public Safety ($400,000).
• Fiscal 2010 annualized savings from 11 lease eliminations completed in fiscal 2009 total another $980,000.
State Health Benefits Program (SHBP) Dependent Audit
• Consistent with practices used in the private sector, recent Benefits Reform Legislation (P.L. 2008, c.89) called for a Dependent Eligibility Verification Audit of the State Health Benefit Program to ensure that only eligible employees, retirees, and their dependents, are receiving health care coverage under the program. It is expected that coverage for as many as 10,000 to 15,000 ineligible dependents will be terminated as a result of this audit. The Budget assumes $9 million will be saved in fiscal 2010 from this initiative.
80

CHAPTER 7: REVENUE FORECASTS & PROPOSED REVENUE ENHANCEMENTS
Chapter 7
Total revenues for fiscal 2010 are expected to be $29.6 billion, which is $339 million or approximately 1.1% below the revised fiscal 2009 anticipated levels. Base revenues are expected to remain weak in fiscal 2010. Most economic indicators for the nation and New Jersey are projected to remain weak in 2009 as compared to what they were in 2008, but show some improvement in 2010.
Sales Tax
The forecast of $8.1 billion in Sales Tax revenue for fiscal 2010 is an increase of $160 million over the revised fiscal 2009 level. The basic underlying growth rate of 2.0% reflects the anticipated improvements in the economy and consumer spending in fiscal 2010 in part due to the federal economic stimulus package.
If fiscal 2010 sales tax did not include the changes enacted in fiscal 2007, the fiscal 2010 sales tax estimate would be approximately $6.5 billion. This is below the actual fiscal 2006 sales tax revenue of $6.8 billion.
Sales Tax(In Billions)
FY2007 had a change in tax policy.- increase in Sales Tax rate from 6% to 7%- broadened Sales Tax base
Sales Tax excludes the tax on energyCAFR – Comprehensive Annual Financial Report
$8.085$7.925$8.578$8.395$8.181
$6.766$6.511
$0.0
$1.0
$2.0
$3.0
$4.0
$5.0
$6.0
$7.0
$8.0
$9.0
$10.0
FY2005CAFR
FY2006CAFR
FY2007CAFR
FY2008CAFR
FY2009Approp
Act
FY2009Revised
FY2010Estimate
81

Chapter 7
Corporation Business Tax
The fiscal 2010 Corporation Business Tax (CBT) revenue forecast of $2.0 billion represents a decrease of $320 million (-13.6%), compared with the revised fiscal 2009 level. It includes $80 million for the extension of the 4% surcharge, which was due to expire June 30, 2009. It also assumes slower growth in payments for calendar year 2009 associated with the anticipated slowdown in corporate pre-tax profit growth. Pre-tax profit is projected to decrease 14.5% in 2008, followed by another 15% decline in 2009. In addition there has been a significant increase in CBT refunds in the current fiscal year, which is running over $300 million for fiscal 2009 compared to a year ago. The baseline growth, excluding the impact of the extension of the 4% surcharge of $80 million, is a negative 17% over a year ago.
Corporation Business Tax(In Billions)
$2.337
$2.838
$2.997$2.993
$2.670 $2.350
$2.030
$0.0
$0.5
$1.0
$1.5
$2.0
$2.5
$3.0
$3.5
FY2005CAFR
FY2006CAFR
FY2007CAFR
FY2008CAFR
FY2009Approp Act
FY2009Revised
FY2010Estimate
Corporation Business Tax excludes the tax on energyCAFR – Comprehensive Annual Financial Report
82
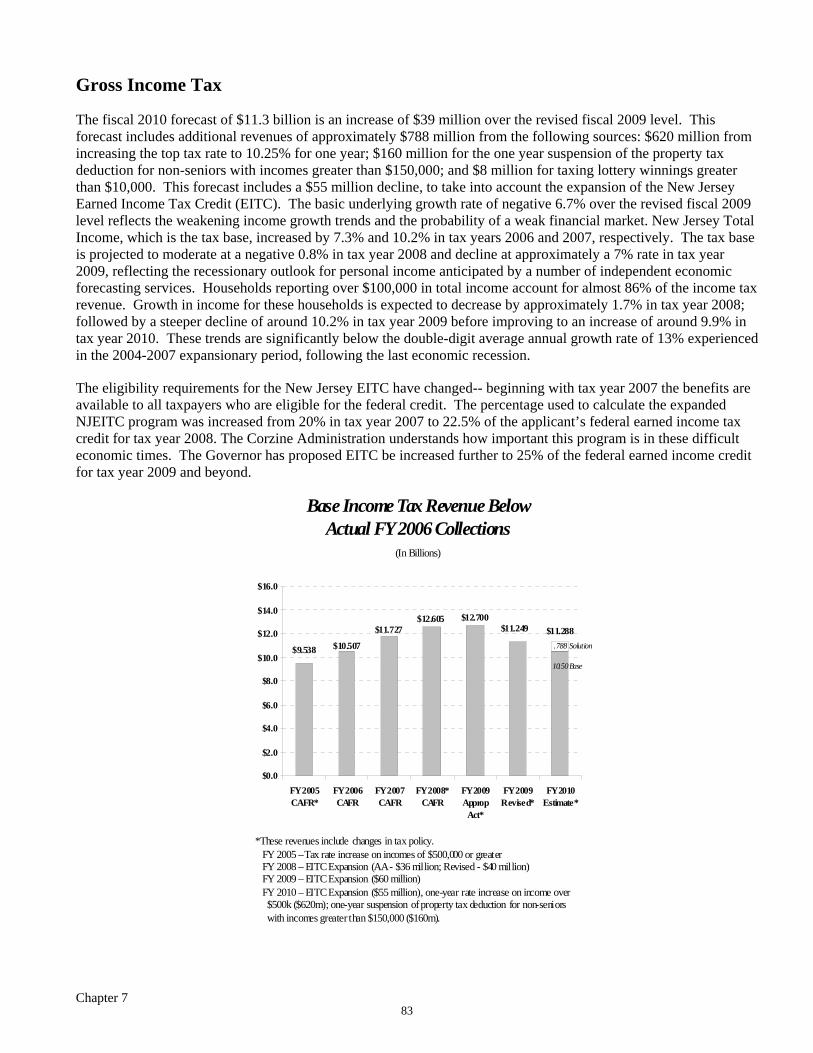
Chapter 7
Gross Income Tax
The fiscal 2010 forecast of $11.3 billion is an increase of $39 million over the revised fiscal 2009 level. This forecast includes additional revenues of approximately $788 million from the following sources: $620 million from increasing the top tax rate to 10.25% for one year; $160 million for the one year suspension of the property tax deduction for non-seniors with incomes greater than $150,000; and $8 million for taxing lottery winnings greater than $10,000. This forecast includes a $55 million decline, to take into account the expansion of the New Jersey Earned Income Tax Credit (EITC). The basic underlying growth rate of negative 6.7% over the revised fiscal 2009 level reflects the weakening income growth trends and the probability of a weak financial market. New Jersey Total Income, which is the tax base, increased by 7.3% and 10.2% in tax years 2006 and 2007, respectively. The tax base is projected to moderate at a negative 0.8% in tax year 2008 and decline at approximately a 7% rate in tax year 2009, reflecting the recessionary outlook for personal income anticipated by a number of independent economic forecasting services. Households reporting over $100,000 in total income account for almost 86% of the income tax revenue. Growth in income for these households is expected to decrease by approximately 1.7% in tax year 2008; followed by a steeper decline of around 10.2% in tax year 2009 before improving to an increase of around 9.9% in tax year 2010. These trends are significantly below the double-digit average annual growth rate of 13% experienced in the 2004-2007 expansionary period, following the last economic recession.
The eligibility requirements for the New Jersey EITC have changed-- beginning with tax year 2007 the benefits are available to all taxpayers who are eligible for the federal credit. The percentage used to calculate the expanded NJEITC program was increased from 20% in tax year 2007 to 22.5% of the applicant’s federal earned income tax credit for tax year 2008. The Corzine Administration understands how important this program is in these difficult economic times. The Governor has proposed EITC be increased further to 25% of the federal earned income credit for tax year 2009 and beyond.
Base Income Tax Revenue Below Actual FY 2006 Collections
(In Billions)
$11.288$11.249$12.700$12.605
$11.727
$10.507$9.538
$0.0
$2.0
$4.0
$6.0
$8.0
$10.0
$12.0
$14.0
$16.0
FY 2005CAFR*
FY 2006CAFR
FY 2007CAFR
FY 2008*CAFR
FY 2009Approp
Act*
FY 2009Revised*
FY 2010Estimate*
*These revenues include changes in tax policy.FY 2005 –Tax rate increase on incomes of $500,000 or greaterFY 2008 – EITC Expansion (AA - $36 million; Revised - $40 million)FY 2009 – EITC Expansion ($60 million)FY 2010 – EITC Expansion ($55 million), one-year rate increase on income over$500k ($620m); one-year suspension of property tax deduction for non-seniorswith incomes greater than $150,000 ($160m).
.788 Solutions
10.50 Base
83

Chapter 7
Cigarette Tax For fiscal 2010, the gross cigarette tax collections are estimated to be $771 million. This estimate assumes a decline in consumption and an increase in the tax rate of 12.5 cents to a rate of $2.70 per pack. From the fiscal 2010 gross collections, $370 million is dedicated to the Health Care Subsidy Fund to assist hospitals with charity care and other uncompensated care disproportionate share payments. Also, $145.7 million has been pledged to bondholders with the issuance of the Cigarette Tax Revenue Bonds, Series 2004. The remaining funds of $255.3 million are available to support the General Fund.
$788.6 $787.6 $770.6 $775.0 $754.0 $757.0 $771.0
$0.0
$200.0
$400.0
$600.0
$800.0
$1,000.0
FY2005* CAFR
FY2006 CAFR
FY2007* CAFR
FY2008 CAFR
FY2009 Approp
Act
FY2009 Revised
FY2010* Estimate
CIGARETTE TAX GROSS COLLECTIONS(In Millions)
*Includes change in tax rate.CAFR - Comprehensive Annual Financial Report
84

Chapter 7
Casino Revenue
The fiscal 2010 Casino Revenue forecast of $351.8 million represents a decrease of $14.5 million from the revised fiscal 2009 level, and includes $4 million of revenue from unclaimed slot machine vouchers. The decline in casino revenue for fiscal 2010 is primarily due to the continuation of difficult economic conditions, increased regional slot machine competition, the anticipation of a full smoking ban effective October 2009, and a statutory reduction in the Comp Tax.
$475.7 $502.3$450.1
$413.0 $414.8 $366.3 $351.8
$0
$100
$200
$300
$400
$500
$600
FY05 CAFR FY06 CAFR FY07 CAFR FY08 CAFR FY09 Approp Act
FY09 Revised
FY10 Estim ate
CASINO REVENUE(In Millions)
85

Chapter 7
Revenue Initiatives As a global recession batters the economy, Governor Corzine remains focused on long-term fiscal stability while he confronts this short-term crisis. The fallout from the downturn came swiftly and harshly, creating a $7 billion shortfall in a budget that would have already been austere under any other conditions. To address this shortfall, Governor Corzine’s Fiscal 2010 Budget relies on a mixture of solutions, with the largest offset coming from $4 billion in cuts and restraints in government spending. The Fiscal 2010 Budget also benefits from more than $2 billion in federal stimulus funding to meet critical health care and educational needs. The imposition of deep cuts, along with additional federal aid, however, fell short of bringing full balance to the Budget. In order to avert even deeper spending reductions, and their damaging effects on education, the health care safety net, public safety and the most vulnerable, the solutions to the Fiscal 2010 Budget shortfall include additional revenues. The revenues are largely temporary, to enable the State to bridge the gap between revenues and expenditures, and to provide a path from these extraordinarily difficult times to a return of stability in the global economy.
Tax Policy Changes
Gross Income Tax
1) One-year Rate Increase for Incomes over $500,000 ($620 million)
A one-year tax rate increase to 10.25% is proposed for incomes greater than $500,000 and is estimated to generate $620 million. Only 1% of the nearly 3.9 million filers and taxpayers not required to file state income tax returns will be impacted by this change.
2) One-year Suspension of Property Tax Deduction ($160 million)
The one-year elimination of the property tax deduction for the 325,000 non-senior recipients above $150,000 is estimated to generate $160 million. Nearly 1.5 million non-senior recipients below $150,000 in income will continue to receive the deduction as will the nearly 340,000 senior citizens.
Wealthier taxpayers will realize a larger portion of the loss of the deduction. For instance, taxpayers with an income of $500,000 and up, who are subject to the top income tax rate, will no longer receive a tax deduction worth $897.
3) Tax Lottery Winnings ($8 million)
$8 million is expected to be generated by taxing lottery winnings in excess of $10,000.
Corporation Business Tax ($80 million)
The Fiscal 2010 Budget assumes that a 4% surcharge, which was effective July 1, 2006 through June 30, 2009, is extended.
Cigarette Tax ($26 million)
The Fiscal 2010 Budget assumes additional revenue from increasing the cigarette tax from $2.575 per pack of 20 cigarettes to $2.70 per pack. This proposed increase assumes an effective date of July 1, 2009.
Alcoholic Beverage Excise ($22 million)
86

Chapter 7
The Fiscal 2010 Budget assumes additional revenue from increasing the alcoholic beverage excise tax by 25%, excluding beer. This proposed increase assumes an effective date of July 1, 2009.
Alternate Use of Other Funds
The Fiscal 2010 Budget assumes the alternate use of $116 million of other funds:
$20 million Motor Vehicle Fees
Receipts derived from the proposed increase in various motor vehicle fees will be diverted in fiscal 2010 from the Motor Vehicle Commission to the General Fund. The fees are comprised of transactions, processes and services including: vehicle and boat titles, motorcycle registrations, commercial driver's license permits, driver improvement programs, and abstracts.
$14 million Enterprise Zone Assistance Fund
The Enterprise Zone Assistance Fund has not contributed its share of the constitutionally dedicated sales tax to the Property Tax Relief Fund since this dedication began in July 2006. Instead, the General Fund has made the contribution on the zones’ behalf. The $14 million to be transferred to the General Fund represents the Enterprise Zone Assistance Fund share of the sales tax dedication for fiscal 2010.
For the following funds, balances are available for transfer to the General Fund:
$50 million State Disability Benefit Fund
$20 million Workers’ Compensation Security Fund
$10 million New Home Warranty Security Fund
$2 million Unemployment Compensation Auxiliary Fund
Other
Mental Health Hospital County Share ($5 million)
This increase in revenue is the result of an increase in the share of costs that county psychiatric hospitals pay for patients at both county and State institutions from 12.5% to 15% beginning January 1, 2010.
Casino Revenue Fund ($4 million)
The Fiscal 2010 Budget assumes additional revenue of $4 million from unclaimed slot machine vouchers. Any obligation owed to a patron by a casino as a result of a gaming transaction would expire in one year, with 25% distributed to the Casino Revenue Fund and 75% to the casino licensee.
Lottery ($40 million)
An increase of $40 million was included in the Fiscal 2010 Budget, which is based on the Lottery joining the Powerball multi-state game effective October 1, 2009.
87

Chapter 7
FY 2010 Revenues(In Millions)
FY 2009Adjusted FY 2010Revenues Budget $ %
Income 11,249$ 11,288$ 39$ 0.3
Base 9,055$ (9,055)$ (100.0) Initiatives - Sales 7,925 8,085 160 2.0 Base 6,520 (6,520) (100.0) Initiatives - Corporate 2,350 2,030 (320) (13.6)
Other* 8,456 8,238 (218) (2.6) Base 9,560 7,654 (1,906) (19.9) Initiatives 808 808
Total 29,980$ 29,641$ (339)$ (1.1)
* All Sales Tax and Corporation Business Taxes on Energy are included in Other.
Change
88

Chapter 7
Revenue History FY 2010 Base Revenue Below
FY 2006 Actual Revenue(In Billions)
$28.7
$31.2
$32.6
$29.5
$28.6
$26.0
$27.0
$28.0
$29.0
$30.0
$31.0
$32.0
$33.0
FY06 CAFR FY07 CAFR FY08 CAFR FY09 Adjusted Approp*
FY10 Budget*
*Without solutionsCAFR – Comprehensive Annual Financial Report
89

Chapter 7
Tax Policy Changes Gross Income Tax One-year tax rate increase for incomes over $500,000 620$ One-year suspension of Property Tax Deduction for Non-Seniors 160 with incomes greater than $150,000 Tax Lottery winnings > $10k 8
788 Corporation Business Tax - extend 4% surcharge that was to expire 80 Cigarette Tax - increase of 12.5 cents to $2.70/pack 26 Alcohol Tax - 25% increase excluding beer 22
916$
Alternate Use of Other Funds State Disability Benefit Fund 50 Workers' Compensation Security Fund 20 Enterprise Zone Assistance Fund 14 New Home Warranty Security Fund 10 Unemployment Compensation Auxiliary Fund 2 Motor Vehicle Fees 20
116
Other Mental Health Hospital County Share - increase from 12.5% to 15% 5 Casino Revenue Fund - unclaimed slot machine vouchers 4 Lottery - NJ Powerball 40
49
Total Revenue Solutions 1,081$
Fiscal Year 2010 Revenue Solutions(In Millions)
90

Chapter 7
Impact of Proposed Income Tax Increase
1% > $500,000
Income
Approximately 44,000 of the nearly 3.9 million income tax filers and taxpayers not required to file state income tax returns will be impacted by the proposed change.
91

92

APPENDIX I: FISCAL 2010 BUDGET DETAILS
Appendix I 1

Fiscal Year 2010(In Billions)
Total Spending $29.8 Billion
Constitutional$1.4 5%
Medicaid$2.9 10%
Other Health/Welfare$3.4 11%
Prisons/State Police/Judiciary$2.1 7%
Higher Education$2.1 7%
Employee Benefits$1.1 4%
Discretionary$2.9 10%
Employer Taxes/Debt Service
$0.9 3%
School Aid$10.3 34%
Property Tax Relief$2.7 9%
Employer Taxes/Debt Service includes debt service for general obligation and miscellaneous contract bonds.
Appendix I 2

Operations Budgets(In Millions)
DHS Institutions, $381.6, 9%
JJC Institutions, $107.5, 2%
Veterans Homes, $70.5, 2%
Environmental Programs, $216.3,
5%
Judiciary and Legislature, $722.2,
17%
Public Safety, $1,386.6, 31%
Taxation, Revenue and Budget, $151.4,
4%Children and Families,
$327.9, 8%
Other, $888.6, 21%
Health, $64.6, 1%
Total Operating Budget is $4.3 billion
Operating budgets will be further impacted by management efficiencies, employee actions, and procurement savings.
Appendix I 3

Salaries and Wages$3,009.4
70%
Special Purpose$575.113%
Additions, Improvements and
Equipment$22.21%Maintenance and
Fixed Charges$89.22%
Services Other Than Personal$443.010%
Materials and Supplies$178.3
4%
Operating Split between Salaries and Other Costs (In Millions)
Total Operating Budget is $4.3 billion
Operating budgets will be further impacted by management efficiencies, employee actions, and procurement savings.
Appendix I 4

Comparison of Budget Message toPrior Fiscal Year Appropriations Act
ORIGINAL BUDGET PRIOR YEAR $ %Fiscal Year RECOMMENDATIONS APPROPRIATIONS ACT CHANGE CHANGE
2010 29,840.8$ 32,868.6$ (3,027.8)$ -9.21%2009 32,968.6$ 33,470.9$ (502.3)$ -1.50%2008 33,291.7$ 30,818.7$ 2,473.0$ 8.02%2007 30 874 5$ 27 919 9$ 2 954 6$ 10 58%2007 30,874.5$ 27,919.9$ 2,954.6$ 10.58%2006 27,412.3$ 28,027.3$ (615.0)$ -2.19%2005 26,259.8$ 24,003.2$ 2,256.6$ 9.40%2004 23,701.8$ 23,401.7$ 300.1$ 1.28%2003 23,663.2$ 22,920.7$ 742.5$ 3.24%2002 23,153.4$ 21,419.7$ 1,733.7$ 8.09%2001 21,252.8$ 19,514.4$ 1,738.4$ 8.91%2000 19,160.5$ 18,123.8$ 1,036.8$ 5.72%1999 17,953.3$ 16,786.6$ 1,166.7$ 6.95%1998 16,420.9$ 15,977.8$ 443.0$ 2.77%1997 15,984.7$ 15,994.6$ (9.9)$ -0.06%1996 15 987 4$ 15 280 7$ 706 7$ 4 63%1996 15,987.4$ 15,280.7$ 706.7$ 4.63%1995 15,377.4$ 15,466.9$ (89.6)$ -0.58%1994 15,649.6$ 14,625.5$ 1,024.1$ 7.00%1993 15,706.7$ 14,651.5$ 1,055.2$ 7.20%1992 14,310.5$ 12,423.8$ 1,886.7$ 15.19%1991 12,145.6$ 11,995.0$ 150.6$ 1.26%1990 12,090.0$ 11,775.1$ 314.9$ 2.67%1989 11,806.2$ 10,396.5$ 1,409.7$ 13.56%1988 10,179.9$ 9,279.4$ 900.5$ 9.70%1987 9,281.5$ 8,681.2$ 600.3$ 6.92%1986 8,824.5$ 7,693.3$ 1,131.2$ 14.70%1985 7 574 6$ 6 771 8$ 802 8$ 11 86%1985 7,574.6$ 6,771.8$ 802.8$ 11.86%1984 6,799.6$ 6,181.7$ 617.9$ 10.00%1983 6,373.4$ 5,691.3$ 682.1$ 11.99%1982 5,635.1$ 5,107.1$ 528.0$ 10.34%1981 4,736.4$ 4,652.1$ 84.4$ 1.81%1980 4,655.5$ 4,394.4$ 261.2$ 5.94%1979 4,407.3$ 4,010.6$ 396.6$ 9.89%1978 4,001.7$ 2,853.3$ 1,148.4$ 40.25%1977 2,762.8$ 2,698.1$ 64.7$ 2.40%1976 2,816.1$ 2,756.1$ 60.0$ 2.18%1975 2,753.0$ 2,385.7$ 367.3$ 15.40%1974 2 380 6$ 2 047 7$ 332 9$ 16 26%1974 2,380.6$ 2,047.7$ 332.9$ 16.26%1973 2,406.8$ 1,779.3$ 627.5$ 35.27%1972 1,784.0$ 1,557.5$ 226.5$ 14.54%1971 1,590.1$ 1,334.4$ 255.7$ 19.16%1970 1,361.9$ 1,088.5$ 273.4$ 25.12%1969 1,064.2$ 992.7$ 71.5$ 7.20%1968 998.8$ 876.6$ 122.2$ 13.94%1967 906.1$ 639.4$ 266.8$ 41.72%1966 646.8$ 584.1$ 62.7$ 10.73%1965 589.9$ 543.8$ 46.1$ 8.48%1964 547.5$ 499.4$ 48.1$ 9.63%1963 500 0$ 467 2$ 32 7$ 7 01%1963 500.0$ 467.2$ 32.7$ 7.01%1962 467.4$ 431.8$ 35.6$ 8.24%1961 431.4$ 405.1$ 26.2$ 6.47%1960 403.3$ 388.6$ 14.7$ 3.78%1959 399.7$ 342.5$ 57.2$ 16.71%1958 342.5$ 320.8$ 21.6$ 6.74%1957 315.5$ 284.4$ 31.1$ 10.92%1956 257.3$ 234.8$ 22.5$ 9.58%1955 235.4$ 219.7$ 15.8$ 7.18%1954 219.3$ 210.7$ 8.6$ 4.10%1953 196.4$ 176.8$ 19.6$ 11.09%19 2 169$ 164 1$ 6$ 3 43%1952 169.7$ 164.1$ 5.6$ 3.43%1951 164.1$ 159.5$ 4.6$ 2.88%
Appendix I 5

ORIGINAL BUDGET PRIOR YEAR $ %Fiscal Year RECOMMENDATIONS ADJUSTED APPROPRIATION CHANGE CHANGE
2010 29,840.8$ 33,244.3$ (3,403.5)$ -10.24%2009 32,968.6$ 33,619.3$ (650.7)$ -1.94%2008 33,291.7$ 31,060.4$ 2,231.3$ 7.18%2007 30,874.5$ 28,265.3$ 2,609.2$ 9.23%2006 27,412.3$ 28,400.4$ (988.2)$ -3.48%2005 26,259.8$ 24,542.3$ 1,717.5$ 7.00%2004 23,701.8$ 24,042.8$ (341.0)$ -1.42%2003 23,663.2$ 23,319.6$ 343.6$ 1.47%2002 23,153.4$ 21,733.6$ 1,419.7$ 6.53%2001 21,252.8$ 19,974.8$ 1,278.0$ 6.40%2000 19,160.5$ 18,363.5$ 797.1$ 4.34%1999 17,953.3$ 17,039.1$ 914.2$ 5.37%1998 16,420.9$ 16,217.8$ 203.1$ 1.25%1997 15,984.7$ 16,109.1$ (124.4)$ -0.77%1996 15,987.4$ 15,503.6$ 483.8$ 3.12%1995 15,377.4$ 15,499.9$ (122.5)$ -0.79%1994 15,649.6$ 14,745.4$ 904.3$ 6.13%1993 15,706.7$ 15,003.7$ 703.0$ 4.69%1992 14,310.5$ 12,577.1$ 1,733.5$ 13.78%1991 12,145.6$ 12,148.0$ (2.5)$ -0.02%1990 12,090.0$ 11,877.0$ 213.0$ 1.79%1989 11,806.2$ 10,497.3$ 1,308.9$ 12.47%1988 10,179.9$ 9,289.6$ 890.2$ 9.58%1987 9,281.5$ 8,996.9$ 284.6$ 3.16%1986 8,824.5$ 7,923.0$ 901.5$ 11.38%1985 7,574.6$ 6,886.1$ 688.5$ 10.00%1984 6,799.6$ 6,288.6$ 511.0$ 8.13%1983 6,373.4$ 5,743.5$ 630.0$ 10.97%1982 5,635.1$ 5,124.7$ 510.4$ 9.96%1981 5,114.2$ 4,736.4$ 377.7$ 7.97%1980 4,655.5$ 4,413.0$ 242.6$ 5.50%1979 4,407.3$ 4,062.4$ 344.9$ 8.49%1978 4,001.7$ 3,381.0$ 620.7$ 18.36%1977 2,762.8$ 2,704.5$ 58.4$ 2.16%1976 2,816.1$ 2,765.5$ 50.6$ 1.83%1975 2,753.0$ 2,402.1$ 350.9$ 14.61%1974 2,380.6$ 2,072.1$ 308.5$ 14.89%1973 2,406.8$ 1,823.6$ 583.2$ 31.98%1972 1,784.0$ 1,609.0$ 175.0$ 10.87%1971 1,590.1$ 1,358.3$ 231.8$ 17.06%1970 1,361.9$ 1,136.0$ 225.9$ 19.88%1969 1,064.2$ 1,005.3$ 58.9$ 5.86%1968 998.8$ 890.5$ 108.4$ 12.17%1967 906.1$ 647.9$ 258.2$ 39.85%1966 646.8$ 590.2$ 56.6$ 9.59%1965 589.9$ 549.9$ 40.0$ 7.27%1964 547.5$ 510.3$ 37.1$ 7.28%1963 500.0$ 470.8$ 29.2$ 6.21%1962 467.4$ 437.7$ 29.7$ 6.79%1961 431.4$ 407.2$ 24.2$ 5.95%1960 403.3$ 393.5$ 9.8$ 2.49%1959 399.7$ 336.3$ 63.3$ 18.84%1958 342.5$ 323.7$ 18.8$ 5.80%1957 315.5$ 298.1$ 17.3$ 5.81%1956 257.3$ 221.8$ 35.5$ 16.03%1955 235.4$ 223.2$ 12.2$ 5.46%1954 219.3$ 220.8$ (1.4)$ -0.65%1953 196.4$ 183.7$ 12.7$ 6.90%1952 169.7$ 168.9$ 0.8$ 0.50%1951 164.1$ 164.3$ (0.2)$ -0.13%
Comparison of Budget Message toAdjusted Appropriation
Appendix I 6

SUMMARY OF APPROPRIATIONS MAJOR INCREASES AND DECREASES
This table summarizes the major increases and decreases in the Fiscal 2010 Budget and is organized by category.
Categories of recommended appropriations are defined as follows:
State Operations consists of programs and services operated directly by the State government. The largest single component is for the salary and benefits of State employees. This portion of the Budget is subject to the spending limitations imposed by the Cap Law.
Grants-in-Aid appropriations are for programs and services provided to the public on behalf of the State by a third party provider, or grants made directly to individuals based on assorted program eligibility criteria. The Medicaid program, Tuition Aid Grant Program, Homestead Rebates, payments for State inmates housed in county jails, and funding for New Jersey Transit and State colleges and universities fall into this category.
State Aid consists of payments to or on behalf of counties, municipalities, and school districts to assist them in carrying out their local responsibilities. In addition to school aid, this category of expenditure includes the Consolidated Municipal Property Tax Relief Aid program and other forms of municipal aid. It also includes funding for county colleges, local public assistance and county psychiatric hospital costs.
Capital Construction represents pay-as-you-go allocations for construction and other infrastructure items. Debt Service payments represent the interest and principal on capital projects funded through the sale of general obligation bonds.
APPROPRIATIONS MAJOR INCREASES AND DECREASES
($ In Millions)
Net Increases Decreases Change State Operations Salary Increases - State Employees (Prior to Savings from Employee Actions) $ 188.844
State Active and Retiree Employee Health Benefits 167.924
Debt Service 12.189
Employer Taxes 10.547
Department of Corrections Inflation 8.678
Judiciary Drug Court and Intensive Supervision for Reduced Prison Costs 7.378
Relocation of Health Lab 4.150
West Nile Virus - Laboratory 0.640
Amistad Commission 0.100
Program Costs to Divert Technical Parole Violators 0.097
Subtotal - State Operations Increases $ 400.547
Pensions $ (253.993)
Executive Branch Wage Freeze/Other Actions Including FICA (162.038)
Executive Branch Furlough Days/Other Actions Including FICA (129.200)
Management Efficiencies (40.000)
Appendix I 7
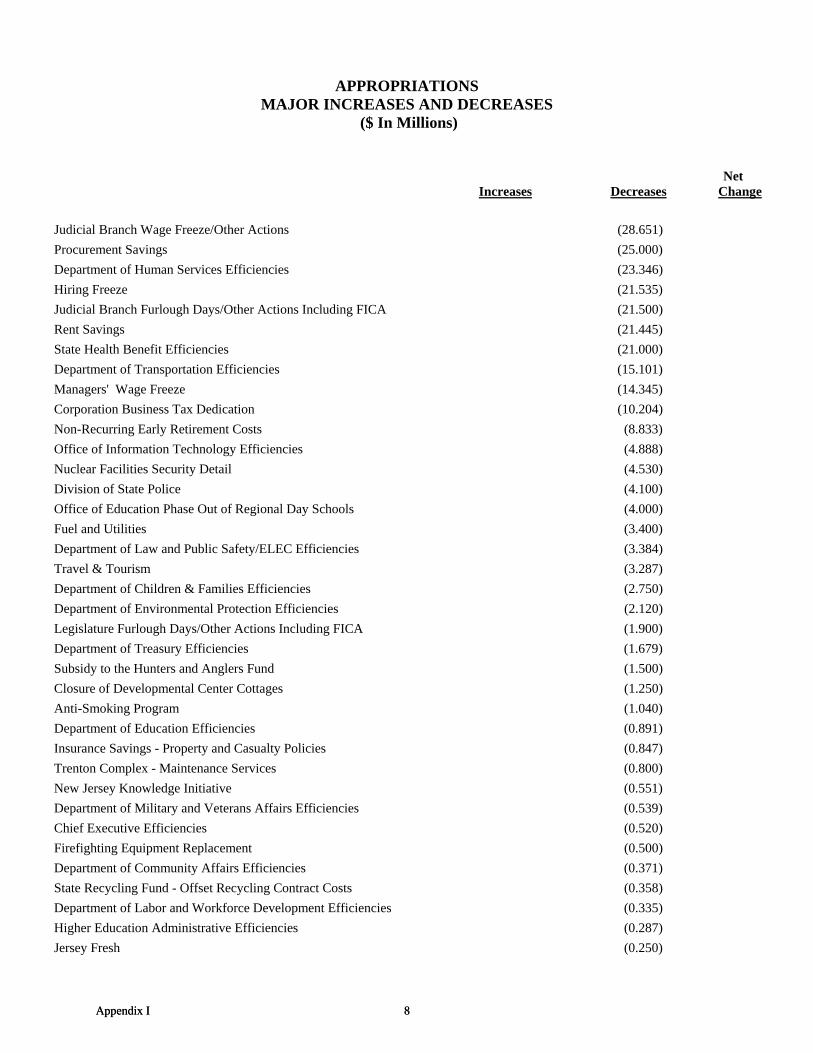
APPROPRIATIONSMAJOR INCREASES AND DECREASES
($ In Millions)
Net Increases Decreases Change
Judicial Branch Wage Freeze/Other Actions (28.651)
Procurement Savings (25.000)
Department of Human Services Efficiencies (23.346)
Hiring Freeze (21.535)
Judicial Branch Furlough Days/Other Actions Including FICA (21.500)
Rent Savings (21.445)
State Health Benefit Efficiencies (21.000)
Department of Transportation Efficiencies (15.101)
Managers' Wage Freeze (14.345)
Corporation Business Tax Dedication (10.204)
Non-Recurring Early Retirement Costs (8.833)
Office of Information Technology Efficiencies (4.888)
Nuclear Facilities Security Detail (4.530)
Division of State Police (4.100)
Office of Education Phase Out of Regional Day Schools (4.000)
Fuel and Utilities (3.400)
Department of Law and Public Safety/ELEC Efficiencies (3.384)
Travel & Tourism (3.287)
Department of Children & Families Efficiencies (2.750)
Department of Environmental Protection Efficiencies (2.120)
Legislature Furlough Days/Other Actions Including FICA (1.900)
Department of Treasury Efficiencies (1.679)
Subsidy to the Hunters and Anglers Fund (1.500)
Closure of Developmental Center Cottages (1.250)
Anti-Smoking Program (1.040)
Department of Education Efficiencies (0.891)
Insurance Savings - Property and Casualty Policies (0.847)
Trenton Complex - Maintenance Services (0.800)
New Jersey Knowledge Initiative (0.551)
Department of Military and Veterans Affairs Efficiencies (0.539)
Chief Executive Efficiencies (0.520)
Firefighting Equipment Replacement (0.500)
Department of Community Affairs Efficiencies (0.371)
State Recycling Fund - Offset Recycling Contract Costs (0.358)
Department of Labor and Workforce Development Efficiencies (0.335)
Higher Education Administrative Efficiencies (0.287)
Jersey Fresh (0.250)
Appendix I 8Appendix I 8

APPROPRIATIONS MAJOR INCREASES AND DECREASES
($ In Millions)
Net Increases Decreases Change Department of Agriculture Efficiencies (0.209)
Criminal Disposition Commission (0.150)
Challenge Youth Program (0.130)
Washington Office Efficiencies (0.119)
Insurance Fraud Prosecution Services (0.106)
Sentencing Commission (0.100)
Maintenance of Old Barracks (0.075)
Holocaust Commission (0.072)
Camp Marcella (0.069)
Italian American Heritage Commission (0.025)
Other (Net) (84.330)
Subtotal - State Operations Decreases $ (927.653)
Net Change (State Operations) $ (527.106)
Grants-In-Aid Medicaid/General Assistance Health Care $ 241.724
NJ FamilyCare 158.821
Governor's Economic Stimulus: InvestNJ 55.200
Child Welfare Reform 49.130
Tuition Aid Grants 33.873
Active and Retiree Employee Health Benefits - Higher Education 33.307
UMDNJ - Stabilization 30.850
Developmental Disabilities and Mental Health Community Placements 12.001
Employer Taxes - Higher Education 11.410
Governors' Economic Stimulus: Legal Services of New Jersey 9.200
AIDS Drug Distribution Program 6.100
Governor's Economic Stimulus: NJ SHARES 5.000
Hospital Asset Transformation Program 4.009
Medical Emergency Preparedness for BioTerrorism 4.000
Health Care Subsidy Fund 3.500
Governor's Economic Stimulus: Senior Tax Freeze 3.500
NJSTARS I & II 3.087
Gubernatorial Election Costs 2.800
Governor's Economic Stimulus: Food Assistance 2.000
Eliminate NJ FamilyCare Premiums for Low Income Children 1.200
Early Childhood Intervention 1.000
Appendix I 9

APPROPRIATIONS MAJOR INCREASES AND DECREASES
($ In Millions)
Net Increases Decreases Change Governor's Economic Stimulus: Community Health Law Project 0.300
World Trade Center Scholarship 0.200
Other (Net) 8.120
Subtotal - Grants-In-Aid Increases $ 680.332
Enhanced Medicaid Funding $ (1,060.000)
Homestead Rebates (533.900)
Unemployment Compensation Insurance (150.000)
NJ Transit Subsidy (62.000)
Tuition Aid Grants - Federal Fiscal Stabilization Funds (34.080)
Colleges and Universities (32.303)
Anti-Fraud and Enhanced Utilization Efficiencies (25.000)
Pharmaceutical Assistance for Aged/Disabled (PAAD) and Senior Gold (22.550)
Medicaid/PAAD Pharmaceutical Savings (22.362)
Medical Day Care Reimbursement (18.000)
Pensions - Higher Education (13.904)
Enhanced 911 Grants (12.425)
DDD Enhanced Efficiencies (12.000)
Cancer Programs (9.600)
Commission on Science and Technology Grants (9.250)
Reform Co-payment for After School/Summer Child Care (7.964)
Debt Service (7.480)
Corporation Business Tax Dedication (7.227)
Fringe Savings from Wage Freeze - Senior Public Employees (7.036)
Child Behavioral Health (7.000)
Federally Qualified Health Centers (6.750)
Lead Hazard Control Assistance Fund (6.000)
Early Intervention Program - Federal Stimulus (5.400)
Federal Stimulus - Foster Care Assistance Revenue (5.392)
Cultural Programs (4.813)
Medicaid Rx $2 Co-Payment with $10 Monthly Maximum (4.597)
New Jersey After 3 (4.020)
Hospital/Health Care Stabilization Fund (4.000)
Hospital Graduate Medical Education (4.000)
Conform Medicaid Coverage of Drugs to Medicare Part D (3.520)
Vocational Rehabilitation Grants (3.487)
Discontinue Medicaid/PAAD coverage of Erectile Dysfunction Drugs (3.300)
Appendix I 10

APPROPRIATIONS MAJOR INCREASES AND DECREASES
($ In Millions)
Net Increases Decreases Change Hospital Relief Offset (3.200)
Outstanding Scholars Recruitment Program (3.003)
Department of Children and Families Contract Efficiencies (2.901)
WorkFirst New Jersey (2.541)
Smart Future Planning Grants (2.295)
Education Incentive Component of Juvenile Detention Alternative Initiative (2.100)
Immigration and Customs Enforcement (ICE) Initiative - Corrections (2.037)
Substance Abuse Surplus (2.000)
Contract Efficiencies Family Development (1.584)
Federal Stimulus - Addressing Violence Against Women (1.500)
Modify Sliding Scale Copays in AIDS Drug Distribution Program (1.356)
NJ FamilyCare Outreach (1.000)
Historical Grants (0.826)
Governor's Literacy Grant (0.780)
NJIT Out-of-State Tuition Reduction (0.752)
Medicare Part "D" Coordination Project Funding Suspension (0.644)
Business Incubator Network (0.630)
Postpartum Education Program (0.500)
Special Needs (0.500)
Sheltered Workshop Employment Placement Incentive Program (0.450)
Center for Hispanic Policy Research and Development (0.410)
Family Planning Services (0.399)
EDA - Division of Business Assistance, Marketing and International Trade (0.320)
NJ Youth Corps Grant (0.308)
Liberty Science Center (0.300)
Tourette Syndrome (0.300)
Court Appointed Special Advocates (0.289)
Veterinary Medicine Education Program (0.263)
EDA - New Jersey Small Business Development Centers (0.250)
Newark Museum (0.243)
Minority Faculty Advancement (0.242)
Office for Prevention of Mental Retardation and Developmental Disabilities (0.180)
Cultural Trust (0.155)
Battleship NJ (0.150)
Office of Faith Based Initiatives (0.150)
Grants to Displaced Homemaker Centers (0.120)
Rape Prevention (0.100)
Appendix I 11

APPROPRIATIONS MAJOR INCREASES AND DECREASES
($ In Millions)
Net Increases Decreases Change Operation CeaseFire (0.085)
Education of Language Minority Students (ELMS) (0.084)
Phase-Out Subsidy for Teacher Board Certification (0.065)
Recreation for the Handicapped (0.065)
Camp Marcella (0.052)
Hispanic Women's Resource Centers (0.050)
Jersey Fresh Matching Grants (0.050)
Low Vision Aids (0.050)
Ellis Island (0.045)
Special Olympics (0.045)
Alzheimer's Disease Program (0.045)
Cleft Palate Programs (0.036)
Defer Equipment Replacement (0.035)
Job Training Center for Urban Women Act (0.030)
Chronic Renal Disease Services (0.025)
New Jersey Council for the Humanities (0.025)
Services to Victims of Huntington's Disease (0.016)
ASPIRA (0.010)
Subtotal - Grants-In-Aid Decreases $ (2,144.951)
Net Change (Grants-In-Aid) $(1,464.619)
State Aid Education Formula Aid $ 152.883
School Construction and Renovation Fund Debt Service 96.326
Extraordinary Special Education 78.000
Preschool Formula Aid 52.255
General Assistance (GA) and Supplemental Security Income (SSI) 41.253
Local School Districts Teacher Social Security Payments 38.750
Other School Aid 36.888
Teachers' Post-Retirement Medical 25.402
Preschool Incentive Aid 25.000
Mental Health State Aid 16.906
Debt Service 12.572
Increase Food Stamp Eligibility - County Administration Cost 8.625
Consolidation Fund 5.000
County College Employee Benefits 1.746
Appendix I 12

APPROPRIATIONS MAJOR INCREASES AND DECREASES
($ In Millions)
Net Increases Decreases Change School Lunch Program 0.675
County Prosecutors and Officials Salary Increase 0.419
County Boards of Taxation 0.064
Subtotal - State Aid Increases $ 592.764
Federal Fiscal Stabilization Funding $ (1,056.920)
Teachers' Pension and Annuity Fund (564.709)
Local Employee Benefits (48.576)
Consolidated Municipal Property Tax Relief Aid (32.090)
SDA New Facilities Transition Aid (13.240)
Nonpublic Aid Reduction (11.131)
Eliminate Adult Education Aid (10.000)
Voter Verified Paper Audit Trail (VVPAT) (10.000)
County College Operating Support (7.455)
Eliminate Integration Assistance Aid (5.000)
General Assistance Compliance Review Efficiencies (4.300)
Homeland Security (4.000)
Charter School Per Pupil Hold Harmless Aid (3.243)
Senior and Veterans' Property Tax Deduction Revised Projections (3.000)
Special Municipal Aid (2.910)
Elderly and Handicapped Transportation Services (2.785)
Reduce State Share of County Psychiatric Hospital Costs (1.827)
Cap Aid in Lieu of Payments - No CPI (1.200)
Eliminate State Aid Payments for Adult Literacy (0.922)
Per Capita State Aid (0.797)
Trenton Capital City Aid (0.715)
Eliminate Aid for Nonpublic School Transportation Over 20 Miles (0.649)
Eliminate State Aid Payments for Vocational Education - Apprenticeship (0.600)
County Inmate Rehabilitation Services (0.575)
Extraordinary Aid (0.500)
State Library Network Aid (0.478)
Domestic Violence Police Training Cost Reimbursement Grants (0.250)
Relocation Assistance Program (0.250)
Homeland Security Advertising (0.250)
Virtual Library Aid (0.130)
Safe and Secure Neighborhoods Program (0.100)
Educational Information and Resource Center (0.045)
Appendix I 13

APPROPRIATIONS MAJOR INCREASES AND DECREASES
($ In Millions)
Net Increases Decreases Change Pinelands Commission (0.016)
Subtotal - State Aid Decreases $ (1,788.663)
Net Change (State Aid) $(1,195.899)
Capital Construction Fire Safety Code Compliance-Albert Wagner State Prison $ 8.800
Modular Unit Replacement Program-Bayside 7.975
HR 6 Flood Control 6.500
Fire Suppression Systems-Juvenile Justice Commission 3.000
Fire Safety Code Compliance-Vineland 2.500
Other (Net) 9.904
Subtotal - Capital Construction Increases $ 38.679
Corporation Business Tax Dedication $ (25.085)
Shore Protection (6.250)
Subtotal - Capital Construction Decreases $ (31.335)
Net Change (Capital Construction) $ 7.344
Debt Service General Obligation Debt Service $ 137.720
Subtotal - Debt Service Increases $ 137.720
Debt Service Restructuring $ (361.000)
Subtotal - Debt Service Decreases $ (361.000)
Net Change (Debt Service) $ (223.280)
GRAND TOTAL $ 1,850.042 $ (5,253.602) $(3,403.560)
Appendix I 14

TABLE ISUMMARY OF FISCAL YEAR 2009--10 APPROPRIATION RECOMMENDATIONS
(thousands of dollars)
Table I shows the appropriations from all State sources by Fund. It highlights the percent change in appropriations between fiscal year
2009Adjusted 2010 ------------------ Change ------------------Approp. Recommended Dollar Percent
GENERAL FUND AND PROPERTY TAX RELIEF FUND
State Aid and Grants 24,751,943 22,105,288 (2,646,655) (10.7)%
State OperationsExecutive Branch 3,684,099 3,523,434 (160,665) (4.4)Legislature 74,644 73,815 (829) (1.1)Judiciary 641,007 648,385 7,378 1.2Interdepartmental 2,166,463 1,798,341 (368,122) (17.0)
Total State Operations 6,566,213 6,043,975 (522,238) (8.0)%
Capital Construction 1,206,313 1,213,657 7,344 0.6Debt Service 270,897 47,617 (223,280) (82.4)
TOTAL GENERAL FUND ANDPROPERTY TAX RELIEF FUND 32,795,366 29,410,537 (3,384,829) (10.3)%
CASINO CONTROL FUND 75,439 70,571 (4,868) (6.5)CASINO REVENUE FUND 368,432 351,769 (16,663) (4.5)GUBERNATORIAL ELECTIONS FUND 5,080 7,880 2,800 55.1
GRAND TOTAL STATE APPROPRIATIONS 33,244,317 29,840,757 (3,403,560) (10.2)%
TABLE IISUMMARY OF FISCAL YEAR 2009--10 APPROPRIATION RECOMMENDATIONS
(thousands of dollars)
Table II shows comprehensive prior year financial data, current year appropriations, and budget year recommendations by fund and major spendingcategory.
Year EndingYear Ending June 30, 2008 June 30, 2010
Orig. & Transfers & 2009(S)Supple-- Reapp. & (E)Emer-- Total Adjusted Recom--
mental (R)Recpts. gencies Available Expended Approp. Requested mendedGeneral Fund
6,598,221 703,179 68,162 7,369,562 6,830,581 Direct State Services 6,566,213 6,048,547 6,043,9759,543,477 456,278 --36,715 9,963,040 9,461,587 Grants--in--Aid 9,351,252 8,603,067 8,428,1111,316,617 66,361 --627 1,382,351 1,273,884 State Aid 1,998,751 1,766,473 1,740,1771,964,634 244,585 --685,451 1,523,768 1,263,168 Capital Construction 1,206,313 1,213,657 1,213,657
438,797 ------ --1 438,796 428,668 Debt Service 270,897 47,617 47,617
19,861,746 1,470,403 -654,632 20,677,517 19,257,888 Total General Fund 19,393,426 17,679,361 17,473,537
14,211,700 6 --131,916 14,079,790 13,853,937 Property Tax Relief Fund 13,401,940 11,937,000 11,937,00074,039 624 ------ 74,663 71,556 Casino Control Fund 75,439 70,571 70,571
433,103 12,331 ------ 445,434 428,567 Casino Revenue Fund 368,432 351,769 351,769------ ------ ------ ------ ------ Gubernatorial Elections Fund 5,080 7,880 7,880
34,580,588 1,483,364 -786,548 35,277,404 33,611,948 GRAND TOTAL STATEAPPROPRIATIONS 33,244,317 30,046,581 29,840,757
Appendix I 15

TABLE IIISUMMARY OF APPROPRIATIONS BY ORGANIZATION
(thousands of dollars)
Table III shows comprehensive prior year financial data, current year appropriations, and budget year recommendations by major spendingcategory, governmental branch, and department.
Year Ending June 30, 2008Orig. & Transfers &
(S)Supple-- Reapp. & (E)Emer-- Totalmental (R)Recpts. gencies Available Expended
Year EndingJune 30, 2010
2009Adjusted Recom--Approp. Requested mended
DIRECT STATE SERVICESLegislative Branch
11,859 4,783 137 16,779 11,382 Senate 11,459 11,459 11,45918,274 2,424 137 20,835 18,589 General Assembly 17,902 17,902 17,90230,111 5,719 640 36,470 31,776 Legislative Support Services 29,787 28,958 28,95815,233 6,743 ------ 21,976 15,723 Legislative Commission 15,496 15,496 15,496
75,477 19,669 914 96,060 77,470 Total Legislative Branch 74,644 73,815 73,815
Executive Branch5,056 1,215 186 6,457 5,125 Chief Executive 5,268 4,684 4,6849,238 3,895 174 13,307 12,019 Department of Agriculture 7,540 7,081 7,081
70,311 1,179 655 72,145 68,640 Department of Banking andInsurance 71,441 67,548 67,548
309,450 3,413 18,508 331,371 327,709 Department of Children and Families 334,686 327,936 327,93638,878 31,490 --5,491 64,877 60,129 Department of Community Affairs 38,127 37,515 37,515
974,226 5,321 33,167 1,012,714 998,676 Department of Corrections 1,053,054 1,020,307 1,020,30777,233 1,602 5,052 83,887 79,662 Department of Education 72,183 71,186 71,186
245,229 58,318 4,969 308,516 280,379 Department of Environmental Protection 231,011 216,286 216,28670,116 14,691 12,481 97,288 90,090 Department of Health and Senior Services 60,880 64,615 64,61569,245 14,661 12,346 96,252 89,146 (From General Fund) 60,009 63,744 63,744
871 30 135 1,036 944 (From Casino Revenue Fund) 871 871 871482,764 101,361 96,508 680,633 547,969 Department of Human Services 522,883 497,040 497,04081,594 62,883 276 144,753 136,836 Department of Labor and
Workforce Development 82,644 81,851 81,851550,995 158,201 28,150 737,346 644,046 Department of Law and Public Safety 566,036 546,574 546,574506,304 157,817 28,150 692,271 600,463 (From General Fund) 519,945 502,483 502,48344,599 384 ------ 44,983 43,491 (From Casino Control Fund) 45,999 43,999 43,999
92 ------ ------ 92 92 (From Casino Revenue Fund) 92 92 9289,379 6,362 2,479 98,220 95,046 Department of Military and
Veterans’ Affairs 91,551 87,943 87,94319,202 6,988 --187 26,003 17,981 Department of the Public Advocate 17,130 16,834 16,83440,816 3,350 942 45,108 41,901 Department of State 36,636 36,041 31,46996,832 5,282 5,136 107,250 105,874 Department of Transportation 100,614 61,764 61,764
486,670 110,671 --49,178 548,163 504,931 Department of the Treasury 467,361 452,879 452,879457,230 110,431 --49,178 518,483 476,866 (From General Fund) 437,921 426,307 426,30729,440 240 ------ 29,680 28,065 (From Casino Control Fund) 29,440 26,572 26,5721,444 1 8 1,453 1,452 Miscellaneous Commissions 1,456 1,456 1,456
3,649,433 576,223 153,835 4,379,491 4,018,465 Total Executive Branch 3,760,501 3,599,540 3,594,9683,574,431 575,569 153,700 4,303,700 3,945,873 (From General Fund) 3,684,099 3,528,006 3,523,434
74,039 624 ------ 74,663 71,556 (From Casino Control Fund) 75,439 70,571 70,571963 30 135 1,128 1,036 (From Casino Revenue Fund) 963 963 963
Interdepartmental Accounts171,931 2,290 4,000 178,221 171,152 Property Rentals 169,687 123,691 123,691114,989 1,388 ------ 116,377 98,151 Insurance and Other Services 116,907 113,060 113,060
1,771,123 60,843 --15 1,831,951 1,822,441 Employee Benefits 1,778,031 1,464,843 1,464,84313,271 1,845 57,388 72,504 57,373 Other Interdepartmental Accounts 16,675 27,675 27,675
223,145 30,672 --145,101 108,716 10,784 Salary Increases and Other Benefits 19,333 10,500 10,50059,456 627 --16,840 43,243 41,863 Utilities and Other Services 65,830 58,572 58,572
2,353,915 97,665 -100,568 2,351,012 2,201,764 Total Interdepartmental Accounts 2,166,463 1,798,341 1,798,341
Appendix I 16

Year Ending June 30, 2008Orig. & Transfers &
(S)Supple-- Reapp. & (E)Emer-- Totalmental (R)Recpts. gencies Available Expended
Year EndingJune 30, 2010
2009Adjusted Recom--Approp. Requested mended
DIRECT STATE SERVICESJudicial Branch
594,398 10,276 14,116 618,790 605,474 The Judiciary 641,007 648,385 648,385
594,398 10,276 14,116 618,790 605,474 Total Judicial Branch 641,007 648,385 648,385
6,673,223 703,833 68,297 7,445,353 6,903,173 Total Direct State Services 6,642,615 6,120,081 6,115,5096,598,221 703,179 68,162 7,369,562 6,830,581 (From General Fund) 6,566,213 6,048,547 6,043,975
74,039 624 ------ 74,663 71,556 (From Casino Control Fund) 75,439 70,571 70,571963 30 135 1,128 1,036 (From Casino Revenue Fund) 963 963 963
GRANTS--IN--AIDExecutive Branch
5,175 1,340 908 7,423 6,211 Department of Agriculture 4,050 6,000 6,000754,909 196 --9,036 746,069 713,941 Department of Children and Families 754,606 764,118 764,11854,255 18,639 6,975 79,869 77,173 Department of Community Affairs 65,360 56,235 56,235
151,098 424 --35 151,487 134,162 Department of Corrections 120,033 129,871 129,87131,688 ------ --1,271 30,417 29,564 Department of Education 18,653 13,488 13,48835,947 38,845 1,100 75,892 9,352 Department of Environmental Protection 22,161 14,934 14,934
1,666,074 19,639 --14,348 1,671,365 1,602,579 Department of Health and Senior Services 1,531,692 1,169,711 1,169,7111,386,146 7,338 --14,213 1,379,271 1,327,258 (From General Fund) 1,330,138 981,791 981,791
279,928 12,301 --135 292,094 275,321 (From Casino Revenue Fund) 201,554 187,920 187,9204,012,026 296,779 --15,917 4,292,888 4,099,864 Department of Human Services 4,004,856 3,599,296 3,599,2963,899,182 296,779 --15,917 4,180,044 3,987,022 (From General Fund) 3,874,399 3,468,839 3,468,839
112,844 ------ ------ 112,844 112,842 (From Casino Revenue Fund) 130,457 130,457 130,457332,175 ------ --500 331,675 331,670 Department of Labor and
Workforce Development 221,964 65,178 65,178329,735 ------ --500 329,235 329,230 (From General Fund) 219,524 62,982 62,982
2,440 ------ ------ 2,440 2,440 (From Casino Revenue Fund) 2,440 2,196 2,19628,085 663 --299 28,449 25,801 Department of Law and Public Safety 32,503 31,330 31,33028,085 663 --299 28,449 25,801 (From General Fund) 27,423 23,450 23,450
------ ------ ------ ------ ------ (From Gubernatorial Elections Fund) 5,080 7,880 7,8803,044 3 106 3,153 2,566 Department of Military and
Veterans’ Affairs 3,174 3,174 3,1741,245,381 11,976 10,837 1,268,194 1,253,686 Department of State 1,212,182 1,366,965 1,203,478
298,200 3,217 143 301,560 298,284 Department of Transportation 358,200 296,200 296,2002,820,211 75,036 --2,540 2,892,707 2,622,797 Department of the Treasury 2,305,288 1,821,476 1,810,007
408,286 75,036 --2,540 480,782 379,399 (From General Fund) 428,788 475,376 463,9072,411,925 ------ ------ 2,411,925 2,243,398 (From Property Tax Relief Fund) 1,876,500 1,346,100 1,346,100
11,438,268 466,757 -23,877 11,881,148 11,207,650 Total Executive Branch 10,654,722 9,337,976 9,163,0208,631,131 454,456 --23,742 9,061,845 8,573,649 (From General Fund) 8,438,691 7,663,423 7,488,4672,411,925 ------ ------ 2,411,925 2,243,398 (From Property Tax Relief Fund) 1,876,500 1,346,100 1,346,100
395,212 12,301 --135 407,378 390,603 (From Casino Revenue Fund) 334,451 320,573 320,573------ ------ ------ ------ ------ (From Gubernatorial Elections Fund) 5,080 7,880 7,880
Interdepartmental Accounts745,995 83 --300 745,778 738,282 Employee Benefits 768,514 792,709 792,709
------ 1,739 --1,634 105 ------ Other Interdepartmental Accounts ------ ------ ------11,047 ------ --11,047 ------ ------ Salary Increases and Other Benefits ------ ------ ------
155,304 ------ ------ 155,304 149,648 Aid to Independent Authorities 144,047 146,935 146,935
912,346 1,822 -12,981 901,187 887,930 Total Interdepartmental Accounts 912,561 939,644 939,644
Judicial Branch------ ------ 8 8 8 The Judiciary ------ ------ ------
- - - - - - 8 8 8 Total Judicial Branch - - - - - - - - -
Appendix I 17

Year Ending June 30, 2008Orig. & Transfers &
(S)Supple-- Reapp. & (E)Emer-- Totalmental (R)Recpts. gencies Available Expended
Year EndingJune 30, 2010
2009Adjusted Recom--Approp. Requested mended
GRANTS--IN--AID12,350,614 468,579 -36,850 12,782,343 12,095,588 Total Grants- in-Aid 11,567,283 10,277,620 10,102,6649,543,477 456,278 --36,715 9,963,040 9,461,587 (From General Fund) 9,351,252 8,603,067 8,428,1112,411,925 ------ ------ 2,411,925 2,243,398 (From Property Tax Relief Fund) 1,876,500 1,346,100 1,346,100
395,212 12,301 --135 407,378 390,603 (From Casino Revenue Fund) 334,451 320,573 320,573------ ------ ------ ------ ------ (From Gubernatorial Elections Fund) 5,080 7,880 7,880
STATE AIDExecutive Branch
11,727 3,162 ------ 14,889 10,969 Department of Agriculture 10,873 11,548 11,5481,212,608 7,981 --132,436 1,088,153 1,062,832 Department of Community Affairs 1,047,449 1,016,153 1,016,153
52,281 7,981 --699 59,563 52,131 (From General Fund) 199,956 196,465 196,4651,160,327 ------ --131,737 1,028,590 1,010,701 (From Property Tax Relief Fund) 847,493 819,688 819,688
20,000 ------ ------ 20,000 20,000 Department of Corrections 23,000 22,425 22,42510,896,738 1,293 633 10,898,664 10,850,527 Department of Education 11,479,502 10,328,617 10,328,617
639,355 1,287 812 641,454 626,146 (From General Fund) 976,961 725,291 725,29110,257,383 6 --179 10,257,210 10,224,381 (From Property Tax Relief Fund) 10,502,541 9,603,326 9,603,326
21,044 291 112 21,447 21,257 Department of Environmental Protection 19,358 19,342 19,34211,216 291 112 11,619 11,429 (From General Fund) 9,358 9,342 9,3429,828 ------ ------ 9,828 9,828 (From Property Tax Relief Fund) 10,000 10,000 10,0009,552 ------ ------ 9,552 9,413 Department of Health and Senior Services 9,552 9,552 9,552
409,166 8,315 379 417,860 414,258 Department of Human Services 430,497 491,154 491,154261,122 8,315 379 269,816 266,214 (From General Fund) 430,497 491,154 491,154148,044 ------ ------ 148,044 148,044 (From Property Tax Relief Fund) ------ ------ ------
1,522 ------ ------ 1,522 1,481 Department of Labor andWorkforce Development 1,522 ------ ------
24,000 7,562 --1,431 30,131 17,053 Department of Law and Public Safety 11,000 6,650 6,65047,565 ------ ------ 47,565 36,781 Department of State 34,856 27,890 23,44936,928 ------ 200 37,128 37,128 Department of Transportation 33,018 30,233 30,233
------ ------ 200 200 200 (From General Fund) ------ ------ ------36,928 ------ ------ 36,928 36,928 (From Casino Revenue Fund) 33,018 30,233 30,233
462,470 37,763 ------ 500,233 439,652 Department of the Treasury 456,582 424,042 402,187238,277 37,763 ------ 276,040 222,067 (From General Fund) 291,176 266,156 244,301224,193 ------ ------ 224,193 217,585 (From Property Tax Relief Fund) 165,406 157,886 157,886
13,153,320 66,367 -132,543 13,087,144 12,921,351 Total Executive Branch 13,557,209 12,387,606 12,361,3101,316,617 66,361 --627 1,382,351 1,273,884 (From General Fund) 1,998,751 1,766,473 1,740,177
11,799,775 6 --131,916 11,667,865 11,610,539 (From Property Tax Relief Fund) 11,525,440 10,590,900 10,590,90036,928 ------ ------ 36,928 36,928 (From Casino Revenue Fund) 33,018 30,233 30,233
13,153,320 66,367 -132,543 13,087,144 12,921,351 Total State Aid 13,557,209 12,387,606 12,361,3101,316,617 66,361 --627 1,382,351 1,273,884 (From General Fund) 1,998,751 1,766,473 1,740,177
11,799,775 6 --131,916 11,667,865 11,610,539 (From Property Tax Relief Fund) 11,525,440 10,590,900 10,590,90036,928 ------ ------ 36,928 36,928 (From Casino Revenue Fund) 33,018 30,233 30,233
CAPITAL CONSTRUCTIONLegislative Branch
------ 2,341 ------ 2,341 3 Legislative Support Services ------ ------ ------
- - - 2,341 - - - 2,341 3 Total Legislative Branch - - - - - - - - -
Executive Branch250 1,799 ------ 2,049 1,049 Department of Agriculture ------ ------ ------------ 9,632 ------ 9,632 5,214 Department of Children and Families ------ 240 240
3,936 8,928 ------ 12,864 948 Department of Corrections ------ 16,775 16,7752,800 2,869 ------ 5,669 1,234 Department of Education ------ 400 400
117,024 121,265 --16,589 221,700 94,995 Department of Environmental Protection 101,913 77,078 77,078------ 161 ------ 161 17 Department of Health and Senior Services ------ ------ ------
2,800 15,522 ------ 18,322 2,967 Department of Human Services ------ 4,875 4,8753,800 10,461 ------ 14,261 4,604 Department of Law and Public Safety ------ 6,630 6,630
Appendix I 18

Year Ending June 30, 2008Orig. & Transfers &
(S)Supple-- Reapp. & (E)Emer-- Totalmental (R)Recpts. gencies Available Expended
Year EndingJune 30, 2010
2009Adjusted Recom--Approp. Requested mended
CAPITAL CONSTRUCTION1,318 4,481 2,152 7,951 4,249 Department of Military and
Veterans’ Affairs ------ 175 175------ 468 --63 405 402 Department of State ------ ------ ------
895,000 191 ------ 895,191 895,000 Department of Transportation 895,000 895,000 895,0006,500 18,877 --4,569 20,808 8,888 Department of the Treasury ------ ------ ------
1,033,428 194,654 -19,069 1,209,013 1,019,567 Total Executive Branch 996,913 1,001,173 1,001,173
Interdepartmental Accounts247,137 47,590 17,687 312,414 243,598 Capital Projects -- Statewide 209,400 212,484 212,484684,069 ------ --684,069 ------ ------ Long Term Obligation and Capital
Expenditure Fund ------ ------ ------
931,206 47,590 -666,382 312,414 243,598 Total Interdepartmental Accounts 209,400 212,484 212,484
1,964,634 244,585 -685,451 1,523,768 1,263,168 Total Capital Construction 1,206,313 1,213,657 1,213,657
DEBT SERVICEExecutive Branch
56,790 ------ 8,941 65,731 65,730 Department of EnvironmentalProtection 59,735 42,452 42,452
382,007 ------ --8,942 373,065 362,938 Department of the Treasury 211,162 5,165 5,165
438,797 - - - -1 438,796 428,668 Total Executive Branch 270,897 47,617 47,617
438,797 - - - -1 438,796 428,668 Total Debt Service 270,897 47,617 47,617
34,580,588 1,483,364 -786,548 35,277,404 33,611,948 GRAND TOTAL-STATEAPPROPRIATIONS 33,244,317 30,046,581 29,840,757
19,861,746 1,470,403 --654,632 20,677,517 19,257,888 (From General Fund) 19,393,426 17,679,361 17,473,53774,039 624 ------ 74,663 71,556 (From Casino Control Fund) 75,439 70,571 70,571
14,211,700 6 --131,916 14,079,790 13,853,937 (From Property Tax Relief Fund) 13,401,940 11,937,000 11,937,000433,103 12,331 ------ 445,434 428,567 (From Casino Revenue Fund) 368,432 351,769 351,769
------ ------ ------ ------ ------ (From Gubernatorial Elections Fund) 5,080 7,880 7,880
TABLE IVSUMMARY OF APPROPRIATIONS BY CATEGORY OR PURPOSE
(thousands of dollars)
Table IV shows prior year expenditures, current year appropriations, and budget year request & recommendations by Category or Purpose withinfund and major spending category.
2009 20102008 Adjusted 2010 Recom--
Expenditures Appropriation Requested mendedGeneral Fund----Direct State Services----Personal Services 3,136,778 3,055,778 2,767,925 2,765,409. . . . . . . . . . . . . . . . . . . . . . . . . . . . . . . . . . . . . . . . . . . . . . . .Materials and Supplies 253,657 239,486 230,592 230,492. . . . . . . . . . . . . . . . . . . . . . . . . . . . . . . . . . . . . . . . . . . .Services Other Than Personal 521,393 453,853 450,123 450,051. . . . . . . . . . . . . . . . . . . . . . . . . . . . . . . . . . . . . .Maintenance and Fixed Charges 264,044 275,276 203,827 203,749. . . . . . . . . . . . . . . . . . . . . . . . . . . . . . . . . . . .Improvements and Equipment 52,646 30,077 26,889 26,884. . . . . . . . . . . . . . . . . . . . . . . . . . . . . . . . . . . . . .Employee Pension and Health Benefits 1,822,441 1,778,031 1,657,043 1,657,043. . . . . . . . . . . . . . . . . . . . . . . . . . . . . . .Special Purpose 779,622 733,712 712,148 710,347. . . . . . . . . . . . . . . . . . . . . . . . . . . . . . . . . . . . . . . . . . . . . . . . .
Total Direct State Services 6,830,581 6,566,213 6,048,547 6,043,975. . . . . . . . . . . . . . . . . . . . . . . . . . . . . . . . . . . . . . . . .
Appendix I 19

2009 20102008 Adjusted 2010 Recom--
Expenditures Appropriation Requested mendedGrants--in--Aid----Employee Benefits--Colleges and Universities 738,282 768,514 792,709 792,709. . . . . . . . . . . . . . . . . . . . . . . . .Rutgers, The State University 328,804 309,523 333,381 294,047. . . . . . . . . . . . . . . . . . . . . . . . . . . . . . . . . . . . . .University of Medicine and Dentistry of New Jersey 231,112 218,548 259,098 249,398. . . . . . . . . . . . . . . . . . . .New Jersey Institute of Technology 49,098 45,134 47,841 42,125. . . . . . . . . . . . . . . . . . . . . . . . . . . . . . . . . .State Colleges and Universities 292,572 272,985 368,072 259,335. . . . . . . . . . . . . . . . . . . . . . . . . . . . . . . . . . . . .Other Higher Education Programs 84,004 93,836 82,224 82,224. . . . . . . . . . . . . . . . . . . . . . . . . . . . . . . . . . .Student Aid--Scholarships and Grants 306,452 329,798 329,612 329,612. . . . . . . . . . . . . . . . . . . . . . . . . . . . . . . .Support of Independent Higher Education Institutions 21,672 19,628 30,177 18,708. . . . . . . . . . . . . . . . . . .Correctional Facilities 134,162 120,033 129,871 129,871. . . . . . . . . . . . . . . . . . . . . . . . . . . . . . . . . . . . . . . . . . . .Support of the Arts 27,953 22,305 17,094 17,094. . . . . . . . . . . . . . . . . . . . . . . . . . . . . . . . . . . . . . . . . . . . . . .Transit Subsidy 298,200 358,200 296,200 296,200. . . . . . . . . . . . . . . . . . . . . . . . . . . . . . . . . . . . . . . . . . . . . . . . . .Welfare Support Programs 275,289 271,638 263,090 263,090. . . . . . . . . . . . . . . . . . . . . . . . . . . . . . . . . . . . . . . . .Medicaid 3,628,382 3,560,954 2,835,058 2,835,058. . . . . . . . . . . . . . . . . . . . . . . . . . . . . . . . . . . . . . . . . . . . . . . . . . . . . . .Pharmaceutical Assistance Programs 18,294 97,710 83,814 83,814. . . . . . . . . . . . . . . . . . . . . . . . . . . . . . . . .Children and Families 713,941 754,606 764,118 764,118. . . . . . . . . . . . . . . . . . . . . . . . . . . . . . . . . . . . . . . . . . . .Services for the Developmentally Disabled 571,172 558,107 553,153 553,153. . . . . . . . . . . . . . . . . . . . . . . . . . . .Community Mental Health Services 301,109 328,655 340,823 340,823. . . . . . . . . . . . . . . . . . . . . . . . . . . . . . . . .AIDS Progams 23,264 30,551 34,513 34,513. . . . . . . . . . . . . . . . . . . . . . . . . . . . . . . . . . . . . . . . . . . . . . . . . .Other Health and Human Services Programs 482,871 356,922 336,179 336,179. . . . . . . . . . . . . . . . . . . . . . . . . . .Economic Development 347,745 354,296 402,050 402,050. . . . . . . . . . . . . . . . . . . . . . . . . . . . . . . . . . . . . . . . . . .Other Grants--In--Aid 587,209 479,309 303,990 303,990. . . . . . . . . . . . . . . . . . . . . . . . . . . . . . . . . . . . . . . . . . . . .
Total Grants--in--Aid 9,461,587 9,351,252 8,603,067 8,428,111. . . . . . . . . . . . . . . . . . . . . . . . . . . . . . . . . . . . . . . . . . . . . .
State Aid----Aid to County Colleges 176,732 169,604 185,760 163,905. . . . . . . . . . . . . . . . . . . . . . . . . . . . . . . . . . . . . . . . . . .Educational 626,146 976,961 725,291 725,291. . . . . . . . . . . . . . . . . . . . . . . . . . . . . . . . . . . . . . . . . . . . . . . . . . . . .Cash Assistance and County Welfare Administration 266,182 306,681 352,259 352,259. . . . . . . . . . . . . . . . . . . .Health and Senior Services and Human Services 9,445 133,368 148,447 148,447. . . . . . . . . . . . . . . . . . . . . . . .Aid to Counties and Municipalities 135,383 357,434 293,643 289,202. . . . . . . . . . . . . . . . . . . . . . . . . . . . . . . . . .Other State Aid 59,996 54,703 61,073 61,073. . . . . . . . . . . . . . . . . . . . . . . . . . . . . . . . . . . . . . . . . . . . . . . . . .
Total State Aid 1,273,884 1,998,751 1,766,473 1,740,177. . . . . . . . . . . . . . . . . . . . . . . . . . . . . . . . . . . . . . . . . . . . . . . . . .
Capital Construction----Transportation Trust Fund 895,000 895,000 895,000 895,000. . . . . . . . . . . . . . . . . . . . . . . . . . . . . . . . . . . . . . . . .Environmental 43,650 25,000 18,750 18,750. . . . . . . . . . . . . . . . . . . . . . . . . . . . . . . . . . . . . . . . . . . . . . . . . .Educational 1,234 ------ 400 400. . . . . . . . . . . . . . . . . . . . . . . . . . . . . . . . . . . . . . . . . . . . . . . . . . . . .Institutional 3,915 ------ 21,650 21,650. . . . . . . . . . . . . . . . . . . . . . . . . . . . . . . . . . . . . . . . . . . . . . . . . . . .Constitutionally Dedicated Projects 152,115 174,913 149,828 149,828. . . . . . . . . . . . . . . . . . . . . . . . . . . . . . . . . .All Other 167,254 111,400 128,029 128,029. . . . . . . . . . . . . . . . . . . . . . . . . . . . . . . . . . . . . . . . . . . . . . . . . . . . . . .
Total Capital Construction 1,263,168 1,206,313 1,213,657 1,213,657. . . . . . . . . . . . . . . . . . . . . . . . . . . . . . . . . . . . . . . . .
Debt Service----Principal 265,941 113,112 32,431 32,431. . . . . . . . . . . . . . . . . . . . . . . . . . . . . . . . . . . . . . . . . . . . . . . . . . . . . . .Interest 162,727 157,785 15,186 15,186. . . . . . . . . . . . . . . . . . . . . . . . . . . . . . . . . . . . . . . . . . . . . . . . . . . . . . . .
Total Debt Service 428,668 270,897 47,617 47,617. . . . . . . . . . . . . . . . . . . . . . . . . . . . . . . . . . . . . . . . . . . . . . .
Total General Fund 19,257,888 19,393,426 17,679,361 17,473,537. . . . . . . . . . . . . . . . . . . . . . . . . . . . . . . . . . . . . . . . . . . . . .
Property Tax Relief Fund----Aid to County Colleges 33,021 38,026 41,358 41,358. . . . . . . . . . . . . . . . . . . . . . . . . . . . . . . . . . . . . . . . . . . .Educational 10,224,381 10,502,541 9,603,326 9,603,326. . . . . . . . . . . . . . . . . . . . . . . . . . . . . . . . . . . . . . . . . . . . . . . . . . . . . .Direct Property Tax Relief 2,327,550 1,968,500 1,435,100 1,435,100. . . . . . . . . . . . . . . . . . . . . . . . . . . . . . . . . . . . . . . . . .Aid to Municipalities 1,268,985 892,873 857,216 857,216. . . . . . . . . . . . . . . . . . . . . . . . . . . . . . . . . . . . . . . . . . . . . .
Total Property Tax Relief Fund 13,853,937 13,401,940 11,937,000 11,937,000. . . . . . . . . . . . . . . . . . . . . . . . . . . . . . . . . . . . .
Appendix I 20

2009 20102008 Adjusted 2010 Recom--
Expenditures Appropriation Requested mendedCasino Control Fund----Enforcement 43,491 45,999 43,999 43,999. . . . . . . . . . . . . . . . . . . . . . . . . . . . . . . . . . . . . . . . . . . . . . . . . . . . .Administration 28,065 29,440 26,572 26,572. . . . . . . . . . . . . . . . . . . . . . . . . . . . . . . . . . . . . . . . . . . . . . . . . . .
Total Casino Control Fund 71,556 75,439 70,571 70,571. . . . . . . . . . . . . . . . . . . . . . . . . . . . . . . . . . . . . . . . .
Casino Revenue Fund----Medicaid 108,079 125,500 125,500 125,500. . . . . . . . . . . . . . . . . . . . . . . . . . . . . . . . . . . . . . . . . . . . . . . . . . . . . . . .Pharmaceutical Assistance Programs 232,359 158,518 144,884 144,884. . . . . . . . . . . . . . . . . . . . . . . . . . . . . . . . . .Programs for Senior Citizens and the Disabled 88,129 84,414 81,385 81,385. . . . . . . . . . . . . . . . . . . . . . . . . .
Total Casino Revenue Fund 428,567 368,432 351,769 351,769. . . . . . . . . . . . . . . . . . . . . . . . . . . . . . . . . . . . . . . .
Gubernatorial Elections Fund----Public Financing of Gubernatorial General Election ------ 5,080 7,880 7,880. . . . . . . . . . . . . . . . . . . . . .
Total Gubernatorial Elections Fund - - - 5,080 7,880 7,880. . . . . . . . . . . . . . . . . . . . . . . . . . . . . . . . . .
GRAND TOTAL STATE APPROPRIATIONS 33,611,948 33,244,317 30,046,581 29,840,757. . . . . . . . . . . . . . . . . . . . . . . . .
TABLE VSUMMARY OF APPROPRIATIONS BY STATEWIDE PROGRAM
(thousands of dollars)
Table V shows detailed prior year financial data, current year appropriations, and budget year recommendations by fund, major spending category,and Statewide Program.
Year EndingYear Ending June 30, 2008 June 30, 2010
Orig. & Transfers & 2009(S)Supple-- Reapp. & (E)Emer-- Total Adjusted Recom--
mental (R)Recpts. gencies Available Expended Approp. Requested mendedGENERAL FUND
Direct State Services10. Public Safety and Criminal Justice
325,513 21,745 22,292 369,550 361,153 12. Law Enforcement 335,256 322,313 322,3137,245 7,388 --1,730 12,903 11,329 13. Special Law Enforcement Activities 6,181 5,989 5,989
16,435 4,914 --1,024 20,325 17,426 14. Military Services 14,225 10,986 10,986594,398 10,276 14,116 618,790 605,474 15. Judicial Services 641,007 648,385 648,385894,797 5,148 30,778 930,723 918,228 16. Detention and Rehabilitation 964,153 932,808 932,80861,815 140 1,470 63,425 62,166 17. Parole 70,989 69,681 69,68199,132 47 6,982 106,161 106,150 18. Juvenile Services 107,492 107,492 107,49235,791 335 468 36,594 35,517 19. Central Planning, Direction and Management 34,071 30,958 30,958
2,035,126 49,993 73,352 2,158,471 2,117,443 Total Appropriation 2,173,374 2,128,612 2,128,612
20. Physical and Mental Health41,679 6,074 2,128 49,881 47,529 21. Health Services 36,909 40,644 40,6448,444 8,121 --4,869 11,696 11,114 22. Health Planning and Evaluation 6,565 6,565 6,565
283,070 2,640 42,819 328,529 327,598 23. Mental Health Services 315,906 304,434 304,43424,249 9,979 2,915 37,143 29,184 24. Special Health Services 23,489 26,511 26,5113,498 5 5,224 8,727 8,692 25. Health Administration 3,135 3,135 3,135
15,624 461 9,863 25,948 21,811 26. Senior Services 13,400 13,400 13,4001,263 ------ ------ 1,263 1,263 27. Disability Services 1,293 1,293 1,293
377,827 27,280 58,080 463,187 447,191 Total Appropriation 400,697 395,982 395,982
Appendix I 21

Year EndingYear Ending June 30, 2008 June 30, 2010
Orig. & Transfers & 2009(S)Supple-- Reapp. & (E)Emer-- Total Adjusted Recom--
mental (R)Recpts. gencies Available Expended Approp. Requested mended30. Educational, Cultural, and Intellectual Development
------ ------ ------ ------ ------ 31. Direct Educational Services and Assistance ------ ------ ------111,586 77,252 24,736 213,574 110,821 32. Operation and Support of Educational
Institutions 120,228 106,498 106,49810,112 767 1,034 11,913 11,899 33. Supplemental Education and Training Programs 13,169 12,738 12,73856,770 1,262 --3,012 55,020 51,062 34. Educational Support Services 49,387 48,499 48,49916,873 219 7,764 24,856 24,692 35. Education Administration and Management 18,785 18,676 18,6763,244 1 1 3,246 3,140 36. Higher Educational Services 2,498 2,207 2,207
30,106 131 1,033 31,270 31,125 37. Cultural and Intellectual Development Services 27,707 27,476 22,904
228,691 79,632 31,556 339,879 232,739 Total Appropriation 231,774 216,094 211,522
40. Community Development and Environmental Management27,099 31,303 --5,581 52,821 48,327 41. Community Development Management 29,173 28,930 28,93070,268 7,732 5,485 83,485 77,215 42. Natural Resource Management 61,431 58,886 58,88644,866 8,587 --3,472 49,981 47,724 43. Science and Technical Programs 44,447 37,689 37,68948,749 24,805 --475 73,079 64,122 44. Site Remediation and Waste Management 49,080 45,167 45,16736,920 13,339 --1,608 48,651 41,123 45. Environmental Regulation 35,851 34,273 34,27320,892 4 1,477 22,373 22,373 46. Environmental Planning and Administration 19,939 20,008 20,00824,810 3,851 3,562 32,223 29,098 47. Compliance and Enforcement 21,539 21,539 21,5399,238 3,895 174 13,307 12,019 49. Agricultural Resources, Planning, and Regulation 7,540 7,081 7,081
282,842 93,516 --438 375,920 342,001 Total Appropriation 269,000 253,573 253,573
50. Economic Planning, Development, and Security4,249 28 1,451 5,728 5,439 51. Economic Planning and Development 4,231 4,115 4,115
97,276 3,669 1,933 102,878 95,540 52. Economic Regulation 99,504 94,009 94,00968,264 30,410 --115 98,559 79,985 53. Economic Assistance and Security 69,129 66,384 66,38421,278 39,076 --34 60,320 55,726 54. Manpower and Employment Services 20,964 20,869 20,869
313,044 3,413 39,110 355,567 351,717 55. Social Services Programs 337,769 330,973 330,973
504,111 76,596 42,345 623,052 588,407 Total Appropriation 531,597 516,350 516,350
60. Transportation Programs93,742 5,093 4,968 103,803 102,446 61. State and Local Highway Facilities 97,903 59,289 59,2893,090 189 168 3,447 3,428 64. Regulation and General Management 2,711 2,475 2,475
96,832 5,282 5,136 107,250 105,874 Total Appropriation 100,614 61,764 61,764
70. Government Direction, Management, and Control60,244 12,926 914 74,084 61,747 71. Legislative Activities 59,148 58,319 58,31926,763 75,988 --65,502 37,249 23,898 72. Governmental Review and Oversight 27,323 27,195 27,195
170,092 15,658 549 186,299 178,970 73. Financial Administration 164,151 159,969 159,9692,503,200 116,229 --95,771 2,523,658 2,356,901 74. General Government Services 2,298,022 1,924,732 1,924,732
3,914 187 --33 4,068 3,976 75. State Subsidies and Financial Aid 2,953 2,703 2,70354,805 5,473 9,887 70,165 60,994 76. Management and Administration 45,195 42,854 42,85415,233 6,743 ------ 21,976 15,723 77. Legislative Commissions and Committees 15,496 15,496 15,496
2,834,251 233,204 --149,956 2,917,499 2,702,209 Total Appropriation 2,612,288 2,231,268 2,231,268
80. Special Government Services165,597 136,228 4,584 306,409 217,097 82. Protection of Citizens’ Rights 169,543 167,947 167,94772,944 1,448 3,503 77,895 77,620 83. Services to Veterans 77,326 76,957 76,957
238,541 137,676 8,087 384,304 294,717 Total Appropriation 246,869 244,904 244,904
6,598,221 703,179 68,162 7,369,562 6,830,581 Total Direct State Services --General Fund 6,566,213 6,048,547 6,043,975
Appendix I 22

Year EndingYear Ending June 30, 2008 June 30, 2010
Orig. & Transfers & 2009(S)Supple-- Reapp. & (E)Emer-- Total Adjusted Recom--
mental (R)Recpts. gencies Available Expended Approp. Requested mendedGrants--In--Aid
10. Public Safety and Criminal Justice2,915 663 ------ 3,578 930 12. Law Enforcement 2,615 1,030 1,030
35 ------ ------ 35 35 14. Military Services ------ ------ ------------ ------ 8 8 8 15. Judicial Services ------ ------ ------
114,420 424 --35 114,809 97,500 16. Detention and Rehabilitation 82,951 92,789 92,78936,678 ------ ------ 36,678 36,662 17. Parole 37,082 37,082 37,08225,120 ------ --299 24,821 24,821 18. Juvenile Services 24,808 22,420 22,420
179,168 1,087 --326 179,929 159,956 Total Appropriation 147,456 153,321 153,321
20. Physical and Mental Health246,615 6,102 --2,332 250,385 240,932 21. Health Services 234,740 225,935 225,935201,462 ------ --2,000 199,462 179,462 22. Health Planning and Evaluation 62,462 60,462 60,462299,859 ------ 1,250 301,109 301,109 23. Mental Health Services 328,655 340,823 340,823
2,612,173 235,794 --25,043 2,822,924 2,680,463 24. Special Health Services 2,580,778 2,217,824 2,217,824938,069 1,236 --9,881 929,424 906,864 26. Senior Services 1,032,936 695,394 695,39490,970 ------ 106 91,076 90,812 27. Disability Services 75,395 36,054 36,054
4,389,148 243,132 --37,900 4,594,380 4,399,642 Total Appropriation 4,314,966 3,576,492 3,576,492
30. Educational, Cultural, and Intellectual Development10,000 ------ --1,271 8,729 8,500 31. Direct Educational Services and Assistance ------ ------ ------
546,436 40,327 9,358 596,121 571,172 32. Operation and Support of EducationalInstitutions 558,107 553,153 553,153
4,256 ------ 21 4,277 4,277 33. Supplemental Education and Training Programs 4,298 4,114 4,11421,688 ------ ------ 21,688 21,064 34. Educational Support Services 18,653 13,488 13,488
1,326,684 28,292 11,373 1,366,349 1,313,661 36. Higher Educational Services 1,289,350 1,450,303 1,275,34736,727 ------ --741 35,986 35,986 37. Cultural and Intellectual Development Services 27,943 21,841 21,841
1,945,791 68,619 18,740 2,033,150 1,954,660 Total Appropriation 1,898,351 2,042,899 1,867,943
40. Community Development and Environmental Management33,745 18,578 6,975 59,298 56,650 41. Community Development Management 48,650 48,650 48,650
------ 15 ------ 15 ------ 42. Natural Resource Management ------ ------ ------3,100 2,231 2,000 7,331 1,352 43. Science and Technical Programs ------ ------ ------8,000 ------ ------ 8,000 8,000 44. Site Remediation and Waste Management ------ ------ ------
24,847 36,599 --900 60,546 ------ 45. Environmental Regulation 22,161 14,934 14,9345,175 1,340 908 7,423 6,211 49. Agricultural Resources, Planning, and Regulation 4,050 6,000 6,000
74,867 58,763 8,983 142,613 72,213 Total Appropriation 74,861 69,584 69,584
50. Economic Planning, Development, and Security195,091 58,713 --4,174 249,630 201,017 51. Economic Planning and Development 220,186 262,641 262,64170,840 ------ ------ 70,840 64,891 52. Economic Regulation 70,840 75,840 75,840
532,307 10,632 2,579 545,518 535,289 53. Economic Assistance and Security 421,638 263,090 263,09069,735 ------ --500 69,235 69,230 54. Manpower and Employment Services 69,524 62,982 62,982
813,363 10,235 8,860 832,458 785,213 55. Social Services Programs 814,867 816,049 816,049
1,681,336 79,580 6,765 1,767,681 1,655,640 Total Appropriation 1,597,055 1,480,602 1,480,602
60. Transportation Programs298,200 ------ ------ 298,200 298,200 62. Public Transportation 358,200 296,200 296,200
------ 3,217 143 3,360 84 64. Regulation and General Management ------ ------ ------
298,200 3,217 143 301,560 298,284 Total Appropriation 358,200 296,200 296,200
Appendix I 23

Year EndingYear Ending June 30, 2008 June 30, 2010
Orig. & Transfers & 2009(S)Supple-- Reapp. & (E)Emer-- Total Adjusted Recom--
mental (R)Recpts. gencies Available Expended Approp. Requested mended70. Government Direction, Management, and Control
922,566 1,822 --11,142 913,246 891,355 74. General Government Services 927,107 941,460 941,460------ 48 ------ 48 ------ 75. State Subsidies and Financial Aid ------ ------ ------
32,942 7 --22,084 10,865 10,856 76. Management and Administration 9,682 9,435 9,435
955,508 1,877 --33,226 924,159 902,211 Total Appropriation 936,789 950,895 950,895
80. Special Government Services16,450 ------ ------ 16,450 16,450 82. Protection of Citizens’ Rights 20,400 29,900 29,9003,009 3 106 3,118 2,531 83. Services to Veterans 3,174 3,174 3,174
19,459 3 106 19,568 18,981 Total Appropriation 23,574 33,074 33,074
9,543,477 456,278 --36,715 9,963,040 9,461,587 Total Grants--In--Aid --General Fund 9,351,252 8,603,067 8,428,111
State Aid10. Public Safety and Criminal Justice
9,000 802 ------ 9,802 9,086 12. Law Enforcement 1,000 900 900------ ------ ------ ------ ------ 13. Special Law Enforcement Activities ------ ------ ------
20,000 ------ ------ 20,000 20,000 16. Detention and Rehabilitation 23,000 22,425 22,42515,000 6,760 --1,431 20,329 7,967 19. Central Planning, Direction and
Management 10,000 5,750 5,750
44,000 7,562 --1,431 50,131 37,053 Total Appropriation 34,000 29,075 29,075
20. Physical and Mental Health2,400 ------ ------ 2,400 2,261 21. Health Services 2,400 2,400 2,400
------ 3,544 ------ 3,544 32 23. Mental Health Services 123,816 138,895 138,8957,152 ------ ------ 7,152 7,152 26. Senior Services 7,152 7,152 7,152
9,552 3,544 ------ 13,096 9,445 Total Appropriation 133,368 148,447 148,447
30. Educational, Cultural, and Intellectual Development167,532 692 812 169,036 168,013 31. Direct Educational Services and
Assistance 470,707 483,633 483,6334,860 1 ------ 4,861 4,858 33. Supplemental Education and Training Programs 4,860 4,860 4,860
466,963 594 ------ 467,557 453,275 34. Educational Support Services 501,394 236,798 236,798177,959 ------ ------ 177,959 176,732 36. Higher Educational Services 169,604 185,760 163,90518,520 ------ ------ 18,520 18,469 37. Cultural and Intellectual Development Services 17,826 20,860 16,419
835,834 1,287 812 837,933 821,347 Total Appropriation 1,164,391 931,911 905,615
40. Community Development and Environmental Management16,925 1,010 --699 17,236 17,168 41. Community Development Management 14,175 13,925 13,9257,763 291 112 8,166 7,981 46. Environmental Planning and Administration 6,658 6,642 6,6423,453 ------ ------ 3,453 3,448 47. Compliance and Enforcement 2,700 2,700 2,700
11,727 3,162 ------ 14,889 10,969 49. Agricultural Resources, Planning, and Regulation10,873 11,548 11,548
39,868 4,463 --587 43,744 39,566 Total Appropriation 34,406 34,815 34,815
50. Economic Planning, Development, and Security------ ------ ------ ------ ------ 51. Economic Planning and Development ------ ------ ------
261,122 4,771 379 266,272 266,182 53. Economic Assistance and Security 306,681 352,259 352,2591,522 ------ ------ 1,522 1,481 54. Manpower and Employment Services 1,522 ------ ------
------ ------ ------ ------ ------ 55. Social Services Programs ------ ------ ------
262,644 4,771 379 267,794 267,663 Total Appropriation 308,203 352,259 352,259
Appendix I 24

Year EndingYear Ending June 30, 2008 June 30, 2010
Orig. & Transfers & 2009(S)Supple-- Reapp. & (E)Emer-- Total Adjusted Recom--
mental (R)Recpts. gencies Available Expended Approp. Requested mended60. Transportation Programs
------ ------ 200 200 200 64. Regulation and General Management ------ ------ ------
------ ------ 200 200 200 Total Appropriation ------ ------ ------
70. Government Direction, Management, and Control29,045 ------ ------ 29,045 18,312 74. General Government Services 17,030 7,030 7,03095,674 44,734 ------ 140,408 80,298 75. State Subsidies and Financial Aid 307,353 262,936 262,936
124,719 44,734 ------ 169,453 98,610 Total Appropriation 324,383 269,966 269,966
1,316,617 66,361 --627 1,382,351 1,273,884 Total State Aid -- General Fund 1,998,751 1,766,473 1,740,177
Capital Construction10. Public Safety and Criminal Justice
------ 191 ------ 191 ------ 11. Vehicular Safety ------ ------ ------------ 3,533 ------ 3,533 1,140 12. Law Enforcement ------ 2,630 2,630
1,000 2,605 2,152 5,757 3,918 14. Military Services ------ ------ ------------ 108 ------ 108 ------ 16. Detention and Rehabilitation ------ ------ ------
3,800 6,928 ------ 10,728 3,464 18. Juvenile Services ------ 4,000 4,0003,936 8,820 ------ 12,756 948 19. Central Planning, Direction and
Management ------ 16,775 16,775
8,736 22,185 2,152 33,073 9,470 Total Appropriation ------ 23,405 23,405
20. Physical and Mental Health------ 150 ------ 150 17 21. Health Services ------ ------ ------------ 3,457 ------ 3,457 1,291 23. Mental Health Services ------ ------ ------------ 11 ------ 11 ------ 25. Health Administration ------ ------ ------
------ 3,618 ------ 3,618 1,308 Total Appropriation ------ ------ ------
30. Educational, Cultural, and Intellectual Development2,400 3,561 ------ 5,961 1,606 32. Operation and Support of Educational
Institutions ------ 400 400------ 597 ------ 597 ------ 33. Supplemental Education and Training
Programs ------ ------ ------400 805 ------ 1,205 255 35. Education Administration and
Management ------ ------ ------------ 405 ------ 405 402 37. Cultural and Intellectual Development
Services ------ ------ ------
2,800 5,368 ------ 8,168 2,263 Total Appropriation ------ 400 400
40. Community Development and Environmental Management52,714 58,869 --4,739 106,844 43,650 42. Natural Resource Management 44,554 38,426 38,42664,310 62,396 --12,000 114,706 51,345 44. Site Remediation and Waste Management 57,359 38,652 38,652
------ ------ 150 150 ------ 46. Environmental Planning and Administration ------ ------ ------250 1,799 ------ 2,049 1,049 49. Agricultural Resources, Planning, and Regulation ------ ------ ------
117,274 123,064 --16,589 223,749 96,044 Total Appropriation 101,913 77,078 77,078
50. Economic Planning, Development, and Security------ 1 ------ 1 ------ 52. Economic Regulation ------ ------ ------------ 9,632 ------ 9,632 5,214 55. Social Services Programs ------ 240 240
------ 9,633 ------ 9,633 5,214 Total Appropriation ------ 240 240
Appendix I 25

Year EndingYear Ending June 30, 2008 June 30, 2010
Orig. & Transfers & 2009(S)Supple-- Reapp. & (E)Emer-- Total Adjusted Recom--
mental (R)Recpts. gencies Available Expended Approp. Requested mended60. Transportation Programs
895,000 ------ ------ 895,000 895,000 61. State and Local Highway Facilities 895,000 895,000 895,000
895,000 ------ ------ 895,000 895,000 Total Appropriation 895,000 895,000 895,000
70. Government Direction, Management, and Control------ 2,341 ------ 2,341 3 71. Legislative Activities ------ ------ ------
937,706 66,529 --671,014 333,221 252,486 74. General Government Services 209,400 212,484 212,4842,800 9,971 ------ 12,771 1,049 76. Management and Administration ------ 4,875 4,875
940,506 78,841 --671,014 348,333 253,538 Total Appropriation 209,400 217,359 217,359
80. Special Government Services318 1,876 ------ 2,194 331 83. Services to Veterans ------ 175 175
318 1,876 ------ 2,194 331 Total Appropriation ------ 175 175
1,964,634 244,585 --685,451 1,523,768 1,263,168 Total Capital Construction 1,206,313 1,213,657 1,213,657
Debt Service40. Community Development and Environmental Management
56,790 ------ 8,941 65,731 65,730 46. Environmental Planning and Administration 59,735 42,452 42,452
56,790 ------ 8,941 65,731 65,730 Total Appropriation 59,735 42,452 42,452
70. Government Direction, Management, and Control382,007 ------ --8,942 373,065 362,938 76. Management and Administration 211,162 5,165 5,165
382,007 ------ --8,942 373,065 362,938 Total Appropriation 211,162 5,165 5,165
438,797 ------ --1 438,796 428,668 Total Debt Service 270,897 47,617 47,617
19,861,746 1,470,403 -654,632 20,677,517 19,257,888 Total General Fund 19,393,426 17,679,361 17,473,537
PROPERTY TAX RELIEF FUNDGrants--In--Aid
70. Government Direction, Management, and Control7,925 ------ ------ 7,925 7,925 74. General Government Services ------ ------ ------
2,404,000 ------ ------ 2,404,000 2,235,473 75. State Subsidies and Financial Aid 1,876,500 1,346,100 1,346,100
2,411,925 ------ ------ 2,411,925 2,243,398 Total Appropriation 1,876,500 1,346,100 1,346,100
2,411,925 ------ ------ 2,411,925 2,243,398 Total Grants--In--Aid --Property Tax Relief Fund 1,876,500 1,346,100 1,346,100
State Aid20. Physical and Mental Health
122,039 ------ ------ 122,039 122,039 23. Mental Health Services ------ ------ ------
122,039 ------ ------ 122,039 122,039 Total Appropriation ------ ------ ------
30. Educational, Cultural, and Intellectual Development7,479,701 6 35,804 7,515,511 7,506,828 31. Direct Educational Services and Assistance 7,753,420 6,921,530 6,921,530
38,948 ------ ------ 38,948 38,948 33. Supplemental Education and Training Programs ------ ------ ------2,738,734 ------ --35,983 2,702,751 2,678,605 34. Educational Support Services 2,749,121 2,681,796 2,681,796
33,464 ------ ------ 33,464 33,021 36. Higher Educational Services 38,026 41,358 41,358
10,290,847 6 --179 10,290,674 10,257,402 Total Appropriation 10,540,567 9,644,684 9,644,684
Appendix I 26

Year EndingYear Ending June 30, 2008 June 30, 2010
Orig. & Transfers & 2009(S)Supple-- Reapp. & (E)Emer-- Total Adjusted Recom--
mental (R)Recpts. gencies Available Expended Approp. Requested mended40. Community Development and Environmental Management
9,828 ------ ------ 9,828 9,828 46. Environmental Planning and Administration 10,000 10,000 10,000
9,828 ------ ------ 9,828 9,828 Total Appropriation 10,000 10,000 10,000
50. Economic Planning, Development, and Security26,005 ------ ------ 26,005 26,005 53. Economic Assistance and Security ------ ------ ------
26,005 ------ ------ 26,005 26,005 Total Appropriation ------ ------ ------
70. Government Direction, Management, and Control1,351,056 ------ --131,737 1,219,319 1,195,265 75. State Subsidies and Financial Aid 974,873 936,216 936,216
1,351,056 ------ --131,737 1,219,319 1,195,265 Total Appropriation 974,873 936,216 936,216
11,799,775 6 --131,916 11,667,865 11,610,539 Total State Aid --Property Tax Relief Fund 11,525,440 10,590,900 10,590,900
14,211,700 6 -131,916 14,079,790 13,853,937 Total Property Tax Relief Fund 13,401,940 11,937,000 11,937,000
CASINO CONTROL FUNDDirect State Services
10. Public Safety and Criminal Justice44,599 384 ------ 44,983 43,491 12. Law Enforcement 45,999 43,999 43,999
44,599 384 ------ 44,983 43,491 Total Appropriation 45,999 43,999 43,999
70. Government Direction, Management, and Control29,440 240 ------ 29,680 28,065 73. Financial Administration 29,440 26,572 26,572
29,440 240 ------ 29,680 28,065 Total Appropriation 29,440 26,572 26,572
74,039 624 ------ 74,663 71,556 Total Direct State Services --Casino Control Fund 75,439 70,571 70,571
74,039 624 - - - 74,663 71,556 Total Casino Control Fund 75,439 70,571 70,571
CASINO REVENUE FUNDDirect State Services
20. Physical and Mental Health871 30 135 1,036 944 26. Senior Services 871 871 871
871 30 135 1,036 944 Total Appropriation 871 871 871
80. Special Government Services92 ------ ------ 92 92 82. Protection of Citizens’ Rights 92 92 92
92 ------ ------ 92 92 Total Appropriation 92 92 92
963 30 135 1,128 1,036 Total Direct State Services --Casino Revenue Fund 963 963 963
Grants--In--Aid20. Physical and Mental Health
529 ------ ------ 529 529 21. Health Services 529 529 529279,399 12,301 --135 291,565 274,792 26. Senior Services 201,025 187,391 187,39180,328 ------ ------ 80,328 80,328 27. Disability Services 97,941 97,941 97,941
360,256 12,301 --135 372,422 355,649 Total Appropriation 299,495 285,861 285,861
Appendix I 27

Year EndingYear Ending June 30, 2008 June 30, 2010
Orig. & Transfers & 2009(S)Supple-- Reapp. & (E)Emer-- Total Adjusted Recom--
mental (R)Recpts. gencies Available Expended Approp. Requested mended30. Educational, Cultural, and Intellectual Development
32,516 ------ ------ 32,516 32,514 32. Operation and Support of EducationalInstitutions 32,516 32,516 32,516
32,516 ------ ------ 32,516 32,514 Total Appropriation 32,516 32,516 32,516
50. Economic Planning, Development, and Security2,440 ------ ------ 2,440 2,440 54. Manpower and Employment Services 2,440 2,196 2,196
2,440 ------ ------ 2,440 2,440 Total Appropriation 2,440 2,196 2,196
395,212 12,301 --135 407,378 390,603 Total Grants--In--Aid --Casino Revenue Fund 334,451 320,573 320,573
State Aid60. Transportation Programs
36,928 ------ ------ 36,928 36,928 62. Public Transportation 33,018 30,233 30,233
36,928 ------ ------ 36,928 36,928 Total Appropriation 33,018 30,233 30,233
36,928 ------ ------ 36,928 36,928 Total State Aid --Casino Revenue Fund 33,018 30,233 30,233
433,103 12,331 - - - 445,434 428,567 Total Casino Revenue Fund 368,432 351,769 351,769
GUBERNATORIAL ELECTIONS FUNDGrants--In--Aid
10. Public Safety and Criminal Justice------ ------ ------ ------ ------ 13. Special Law Enforcement Activities 5,080 7,880 7,880
------ ------ ------ ------ ------ Total Appropriation 5,080 7,880 7,880
------ ------ ------ ------ ------ Total Grants--In--Aid --Gubernatorial Elections Fund 5,080 7,880 7,880
- - - - - - - - - - - - - - - Total Gubernatorial Elections Fund 5,080 7,880 7,880
34,580,588 1,483,364 -786,548 35,277,404 33,611,948 GRAND TOTAL STATEAPPROPRIATIONS 33,244,317 30,046,581 29,840,757
Appendix I 28

GRANTS--IN--AIDSummary of Appropriations by Department
(thousands of dollars)Year Ending
Year Ending June 30, 2008 June 30, 2010Orig. & Transfers & 2009
(S)Supple-- Reapp. & (E)Emer-- Total Adjusted Recom--mental (R)Recpts. gencies Available Expended Approp. Requested mended
5,175 1,340 908 7,423 6,211 Department of Agriculture 4,050 6,000 6,000754,909 196 --9,036 746,069 713,941 Department of Children and Families 754,606 764,118 764,11854,255 18,639 6,975 79,869 77,173 Department of Community Affairs 65,360 56,235 56,235
151,098 424 --35 151,487 134,162 Department of Corrections 120,033 129,871 129,87131,688 ------ --1,271 30,417 29,564 Department of Education 18,653 13,488 13,48835,947 38,845 1,100 75,892 9,352 Department of Environmental Protection 22,161 14,934 14,934
1,386,146 7,338 --14,213 1,379,271 1,327,258 Department of Health and Senior Services 1,330,138 981,791 981,7913,899,182 296,779 --15,917 4,180,044 3,987,022 Department of Human Services 3,874,399 3,468,839 3,468,839
329,735 ------ --500 329,235 329,230 Department of Labor andWorkforce Development 219,524 62,982 62,982
28,085 663 --299 28,449 25,801 Department of Law and Public Safety 27,423 23,450 23,4503,044 3 106 3,153 2,566 Department of Military and Veterans’ Affairs 3,174 3,174 3,174
1,245,381 11,976 10,837 1,268,194 1,253,686 Department of State 1,212,182 1,366,965 1,203,478298,200 3,217 143 301,560 298,284 Department of Transportation 358,200 296,200 296,200408,286 75,036 --2,540 480,782 379,399 Department of the Treasury 428,788 475,376 463,907912,346 1,822 --12,981 901,187 887,930 Interdepartmental Accounts 912,561 939,644 939,644
------ ------ 8 8 8 The Judiciary ------ ------ ------
9,543,477 456,278 -36,715 9,963,040 9,461,587 Total Appropriation - Grants- in-Aid 9,351,252 8,603,067 8,428,111
STATE AIDSummary of Appropriations by Department
(thousands of dollars)Year Ending
Year Ending June 30, 2008 June 30, 2010Orig. & Transfers & 2009
(S)Supple-- Reapp. & (E)Emer-- Total Adjusted Recom--mental (R)Recpts. gencies Available Expended Approp. Requested mended
11,727 3,162 ------ 14,889 10,969 Department of Agriculture 10,873 11,548 11,54852,281 7,981 --699 59,563 52,131 Department of Community Affairs 199,956 196,465 196,46520,000 ------ ------ 20,000 20,000 Department of Corrections 23,000 22,425 22,425
639,355 1,287 812 641,454 626,146 Department of Education 976,961 725,291 725,29111,216 291 112 11,619 11,429 Department of Environmental Protection 9,358 9,342 9,3429,552 ------ ------ 9,552 9,413 Department of Health and Senior Services 9,552 9,552 9,552
261,122 8,315 379 269,816 266,214 Department of Human Services 430,497 491,154 491,1541,522 ------ ------ 1,522 1,481 Department of Labor and
Workforce Development 1,522 ------ ------24,000 7,562 --1,431 30,131 17,053 Department of Law and Public Safety 11,000 6,650 6,65047,565 ------ ------ 47,565 36,781 Department of State 34,856 27,890 23,449
------ ------ 200 200 200 Department of Transportation ------ ------ ------238,277 37,763 ------ 276,040 222,067 Department of the Treasury 291,176 266,156 244,301
1,316,617 66,361 -627 1,382,351 1,273,884 Total Appropriation - State Aid 1,998,751 1,766,473 1,740,177
Appendix I 29

CAPITAL CONSTRUCTION
Summary of Appropriations by Department(thousands of dollars)
Year EndingYear Ending June 30, 2008 June 30, 2010
Orig. & Transfers & 2009(S)Supple-- Reapp. & (E)Emer-- Total Adjusted Recom--
mental (R)Recpts. gencies Available Expended Approp. Requested mended------ 2,341 ------ 2,341 3 Legislature ------ ------ ------250 1,799 ------ 2,049 1,049 Department of Agriculture ------ ------ ------------ 9,632 ------ 9,632 5,214 Department of Children and Families ------ 240 240
3,936 8,928 ------ 12,864 948 Department of Corrections ------ 16,775 16,7752,800 2,869 ------ 5,669 1,234 Department of Education ------ 400 400
117,024 121,265 --16,589 221,700 94,995 Department of Environmental Protection 101,913 77,078 77,078------ 161 ------ 161 17 Department of Health and Senior Services ------ ------ ------
2,800 15,522 ------ 18,322 2,967 Department of Human Services ------ 4,875 4,8753,800 10,461 ------ 14,261 4,604 Department of Law and Public Safety ------ 6,630 6,6301,318 4,481 2,152 7,951 4,249 Department of Military and Veterans’ Affairs ------ 175 175
------ 468 --63 405 402 Department of State ------ ------ ------895,000 191 ------ 895,191 895,000 Department of Transportation 895,000 895,000 895,000
6,500 18,877 --4,569 20,808 8,888 Department of the Treasury ------ ------ ------931,206 47,590 --666,382 312,414 243,598 Interdepartmental Accounts 209,400 212,484 212,484
1,964,634 244,585 -685,451 1,523,768 1,263,168 Total Appropriation -Captial Construction 1,206,313 1,213,657 1,213,657
DEBT SERVICE(thousands of dollars)
Year EndingYear Ending June 30, 2008 June 30, 2010
Orig. & Transfers & 2009(S)Supple-- Reapp. & (E)Emer-- Total Adjusted Recom--
mental (R)Recpts. gencies Available Expended Approp. Requested mended
171,722 ------ --3,641 168,081 162,727 Interest on Bonds 157,785 127,437 127,437267,075 ------ 3,640 270,715 265,941 Bond Redemption 248,112 281,180 281,180
438,797 - - - -1 438,796 428,668 Total Appropriation 405,897 408,617 408,617
721 ------ ------ 721 721 Water Conservation Bonds(P.L. 1969, c. 127) ------ ------ ------
100 ------ 53 153 153 Clean Waters Bonds(P.L. 1976, c. 92) 105 103 103
277 ------ 69 346 346 State Land Acquisition and Development Bonds(P.L. 1978, c. 118) 433 452 452
236 ------ ------ 236 236 Energy Conservation Bonds(P.L. 1980, c. 68) 40 45 45
1,731 ------ ------ 1,731 1,731 Natural Resources Bonds(P.L. 1980, c. 70) 1,729 2,164 2,164
587 ------ ------ 587 587 Hazardous Discharge Bonds(P.L. 1981, c. 275) 336 341 341
318 ------ ------ 318 318 Community Development Bonds(P.L. 1981, c. 486) ------ ------ ------
100 ------ ------ 100 100 1983 New Jersey Green Acres Bonds(P.L. 1983, c. 354) ------ ------ ------
1,338 ------ ------ 1,338 1,338 Resource Recovery and Solid Waste DisposalFacility Bonds (P.L. 1985, c. 330) 1,341 1,341 1,341
10,164 ------ ------ 10,164 10,164 Hazardous Discharge Bonds(P.L. 1986, c. 113) 7,897 7,897 7,897
806 ------ 243 1,049 1,049 Green Acres, Cultural Centers and HistoricPreservation Bonds (P.L. 1987, c. 265) 1,330 1,343 1,343
Appendix I 30

Year EndingYear Ending June 30, 2008 June 30, 2010
Orig. & Transfers & 2009(S)Supple-- Reapp. & (E)Emer-- Total Adjusted Recom--
mental (R)Recpts. gencies Available Expended Approp. Requested mended
1,954 ------ ------ 1,954 1,954 Jobs, Education and Competitiveness Bonds(P.L. 1988, c. 78) 1,407 1,511 1,511
3,614 ------ ------ 3,614 3,614 Bridge Rehabilitation and Improvement andRailroad Right--of--way Preservation Bonds(P.L. 1989, c. 180) 2,120 2,123 2,123
682 ------ 166 848 848 Stormwater Management and Combined SewerOverflow Abatement Bonds(P.L. 1989, c. 181) 1,040 1,122 1,122
4,903 ------ ------ 4,903 4,903 New Jersey Open Space Preservation Bonds(P.L. 1989, c. 183) 1,976 1,977 1,977
1,736 ------ ------ 1,736 1,736 Public Purpose Buildings and Community--BasedFacilities Construction Bonds(P.L. 1989, c. 184) 1,734 1,848 1,848
13,748 ------ 93 13,841 13,841 Green Acres, Clean Water, Farmland andHistoric Preservation Bonds(P.L. 1992, c. 88) 7,497 7,292 7,292
8,646 ------ 155 8,801 8,801 Developmental Disabilities Waiting ListReduction and Human Services Facilities(P.L. 1994, c. 108) 6,742 5,784 5,784
16,512 ------ 182 16,694 16,694 Green Acres, Farmland and HistoricPreservation and Blue Acres Bonds(P.L. 1995, c. 204) 13,515 13,912 13,912
5,121 ------ 2,441 7,562 7,561 Port of New Jersey Revitalization, Dredging Bonds(P.L. 1996, c. 70) 10,343 10,386 10,386
3,809 ------ ------ 3,809 3,809 Urban and Rural Centers Unsafe BuildingsDemolition Bonds (P.L. 1997, c. 125) 3,808 ------ ------
24,853 ------ ------ 24,853 24,853 Statewide Transportation and Local BridgeBond Act of 1999 (P.L. 1999, c. 181) 24,855 28,578 28,578
------ ------ 5,694 5,694 5,694 Dam, Lake, Stream, Water Resources, andWastewater Treatment Project Bonds(P.L. 2003, c. 162) 12,193 12,208 12,208
189,925 ------ ------ 189,925 185,151 Refunding Bonds (P.L.1985, c.74,as amended by P.L.1992, c.182) 180,212 209,915 209,915
132,467 ------ ------ 132,467 132,466 Refunding Bonds (P.L.1985, c.74,as amended by P.L.1992, c.182) 125,244 98,275 98,275
14,449 ------ --9,097 5,352 ------ Payments on Future Bond Sales ------ ------ ------
438,797 - - - -1 438,796 428,668 Subtotal Appropriation 405,897 408,617 408,617
------ ------ ------ ------ ------ Savings from Retirement and/orDefeasance of Bonds (135,000) (361,000) (361,000)
438,797 - - - -1 438,796 428,668 Total Appropriation - Debt Service 270,897 47,617 47,617
Appendix I 31

---------- Fiscal Year Ending June 30 ----------
2009 2010Estimated Estimated
ESTIMATED REVENUES, EXPENDITURES AND FUND BALANCES
(thousands of dollars)
SUMMARY
Beginning Balances July 1Undesignated Fund Balances
General Fund $ 469,827 $ 699,059. . . . . . . . . . . . . . . . . . . . . . . . . . . . . . . . . . . . . . . . . . . . . . . . . . . . . . . . . . .Surplus Revenue Fund 734,707 ------. . . . . . . . . . . . . . . . . . . . . . . . . . . . . . . . . . . . . . . . . . . . . . . . . . . .Property Tax Relief Fund 98,947 ------. . . . . . . . . . . . . . . . . . . . . . . . . . . . . . . . . . . . . . . . . . . . . . . . . .Gubernatorial Elections Fund 1,090 ------. . . . . . . . . . . . . . . . . . . . . . . . . . . . . . . . . . . . . . . . . . . . . .Casino Control Fund 3,007 2,507. . . . . . . . . . . . . . . . . . . . . . . . . . . . . . . . . . . . . . . . . . . . . . . . . . . . .Casino Revenue Fund ------ ------. . . . . . . . . . . . . . . . . . . . . . . . . . . . . . . . . . . . . . . . . . . . . . . . . . . .
Total Undesignated Fund Balances 1,307,578 701,566. . . . . . . . . . . . . . . . . . . . . . . . . . . . . . . . . . . . . . . . . .
State RevenuesGeneral Fund 17,653,081 17,281,757. . . . . . . . . . . . . . . . . . . . . . . . . . . . . . . . . . . . . . . . . . . . . . . . . . . . . . . . . . .Property Tax Relief Fund 11,885,000 11,937,000. . . . . . . . . . . . . . . . . . . . . . . . . . . . . . . . . . . . . . . . . . . . . . . . . .Gubernatorial Elections Fund 700 700. . . . . . . . . . . . . . . . . . . . . . . . . . . . . . . . . . . . . . . . . . . . . .Casino Control Fund 74,939 70,071. . . . . . . . . . . . . . . . . . . . . . . . . . . . . . . . . . . . . . . . . . . . . . . . . . . . .Casino Revenue Fund 366,321 351,769. . . . . . . . . . . . . . . . . . . . . . . . . . . . . . . . . . . . . . . . . . . . . . . . . . . .
Total State Revenues 29,980,041 29,641,297. . . . . . . . . . . . . . . . . . . . . . . . . . . . . . . . . . . . . . . . . . . . . . . . . . . . .
Other AdjustmentsGeneral Fund
Balances lapsed 1,622,445 ------. . . . . . . . . . . . . . . . . . . . . . . . . . . . . . . . . . . . . . . . . . . . . . . . . . . . . . .From/(To) Property Tax Relief Fund (41,778) ------. . . . . . . . . . . . . . . . . . . . . . . . . . . . . . . . . . . . . . .From/(To) Surplus Revenue Fund 392,200 ------. . . . . . . . . . . . . . . . . . . . . . . . . . . . . . . . . . . . . . . . .From/(To) Gubernatorial Elections Fund (3,290) (7,180). . . . . . . . . . . . . . . . . . . . . . . . . . . . . . . . . . . .
Property Tax Relief FundBalances lapsed 668,708 ------. . . . . . . . . . . . . . . . . . . . . . . . . . . . . . . . . . . . . . . . . . . . . . . . . . . . . . .From/(To) General Fund 41,778 ------. . . . . . . . . . . . . . . . . . . . . . . . . . . . . . . . . . . . . . . . . . . . . . . .From/(To) Surplus Revenue Fund 342,507 ------. . . . . . . . . . . . . . . . . . . . . . . . . . . . . . . . . . . . . . . . .
From (To) Long Term Obligation and CapitalExpenditure Fund 365,000. . . . . . . . . . . . . . . . . . . . . . . . . . . . . . . . . . . . . . . . . . . . . . . . . . . . . . .Surplus Revenue Fund
From/(To) General Fund (392,200) ------. . . . . . . . . . . . . . . . . . . . . . . . . . . . . . . . . . . . . . . . . . . . . . . .From/(To) Property Tax Relief Fund (342,507) ------. . . . . . . . . . . . . . . . . . . . . . . . . . . . . . . . . . . . . . .
Gubernatorial Elections FundFrom/(To) General Fund 3,290 7,180. . . . . . . . . . . . . . . . . . . . . . . . . . . . . . . . . . . . . . . . . . . . . . . .
Casino Control FundBalances lapsed 1,718 ------. . . . . . . . . . . . . . . . . . . . . . . . . . . . . . . . . . . . . . . . . . . . . . . . . . . . . . .From/(To) Casino Revenue Fund (1,718) ------. . . . . . . . . . . . . . . . . . . . . . . . . . . . . . . . . . . . . . . . . .
Casino Revenue FundBalances lapsed 393 ------. . . . . . . . . . . . . . . . . . . . . . . . . . . . . . . . . . . . . . . . . . . . . . . . . . . . . . .From/(To) Casino Control Fund 1,718 ------. . . . . . . . . . . . . . . . . . . . . . . . . . . . . . . . . . . . . . . . . . .
Total Other Adjustments 2,658,264 ------. . . . . . . . . . . . . . . . . . . . . . . . . . . . . . . . . . . . . . . . . . . . . . . . . .
Total Available 33,945,883 30,342,863. . . . . . . . . . . . . . . . . . . . . . . . . . . . . . . . . . . . . . . . . . . . . . . . . . . . . . . . . .
AppropriationsGeneral Fund 19,393,426 17,473,537. . . . . . . . . . . . . . . . . . . . . . . . . . . . . . . . . . . . . . . . . . . . . . . . . . . . . . . . . . .Property Tax Relief Fund 13,401,940 11,937,000. . . . . . . . . . . . . . . . . . . . . . . . . . . . . . . . . . . . . . . . . . . . . . . . . .Gubernatorial Elections Fund 5,080 7,880. . . . . . . . . . . . . . . . . . . . . . . . . . . . . . . . . . . . . . . . . . . . . .Casino Control Fund 75,439 70,571. . . . . . . . . . . . . . . . . . . . . . . . . . . . . . . . . . . . . . . . . . . . . . . . . . . . .Casino Revenue Fund 368,432 351,769. . . . . . . . . . . . . . . . . . . . . . . . . . . . . . . . . . . . . . . . . . . . . . . . . . . .
Total Appropriations 33,244,317 29,840,757. . . . . . . . . . . . . . . . . . . . . . . . . . . . . . . . . . . . . . . . . . . . . . . . . . .
Ending Balances June 30Undesignated Fund BalancesGeneral Fund 699,059 500,099. . . . . . . . . . . . . . . . . . . . . . . . . . . . . . . . . . . . . . . . . . . . . . . . . . . . . . . . . . .Surplus Revenue Fund ------ ------. . . . . . . . . . . . . . . . . . . . . . . . . . . . . . . . . . . . . . . . . . . . . . . . . . . .Property Tax Relief Fund ------ ------. . . . . . . . . . . . . . . . . . . . . . . . . . . . . . . . . . . . . . . . . . . . . . . . . .Gubernatorial Elections Fund ------ ------. . . . . . . . . . . . . . . . . . . . . . . . . . . . . . . . . . . . . . . . . . . . . .Casino Control Fund 2,507 2,007. . . . . . . . . . . . . . . . . . . . . . . . . . . . . . . . . . . . . . . . . . . . . . . . . . . . .Casino Revenue Fund ------ ------. . . . . . . . . . . . . . . . . . . . . . . . . . . . . . . . . . . . . . . . . . . . . . . . . . . .
Total Undesignated Fund Balances $ 701,566 $ 502,106. . . . . . . . . . . . . . . . . . . . . . . . . . . . . . . . . . . . . . . .
Appendix I 32

2009 2009 2009 2010 2009 to 2010Approp Act Revised Change Estimate Change
Sales Tax 8,578,000$ 7,925,000$ (653,000)$ 8,085,000$ 160,000$ Sales Tax Dedication (683,000) (636,000) 47,000 (649,000) (13,000) Sales Energy 558,000 523,300 (34,700) 627,200 103,900 Corporate Business 2,670,000 2,350,000 (320,000) 2,030,000 (320,000) Corporation Business-Energy 141,600 92,300 (49,300) 111,500 19,200 Motor Fuels 557,830 542,560 (15,270) 553,420 10,860 Motor Vehicle Fees 391,725 380,500 (11,225) 400,050 19,550 Transfer Inheritance 671,870 671,870 --- 671,870 --- Insurance Premium 446,640 466,000 19,360 475,320 9,320 Cigarette 234,404 236,809 2,405 255,293 18,484 Petroleum Products Gross Receipts 229,800 224,380 (5,420) 228,860 4,480 Public Utility Excise (Reform) 10,751 12,234 1,483 12,234 --- Corporation Banks and Financial Institutions 86,350 54,580 (31,770) 54,580 --- Alcoholic Beverage Excise 93,320 93,790 470 117,310 23,520 Realty Transfer 352,740 260,000 (92,740) 234,000 (26,000) Tobacco Products Wholesale Sales 16,860 13,920 (2,940) 14,200 280
Total Major Taxes 14,356,890 13,211,243 (1,145,647) 13,221,837 10,594
Assessment on Real Property Greater Than $1 Million 122,460 91,110 (31,350) 82,000 (9,110) Medicaid Uncompensated Care 454,819 493,014 38,195 490,270 (2,744) Good Driver 79,000 72,300 (6,700) 72,300 --- Hotel/Motel Occupancy Tax 90,000 80,000 (10,000) 85,000 5,000
Investment Earnings 18,000 --- (18,000) --- --- Public Utility GRFT 87,225 87,550 325 87,550 ---
TEFA 245,653 234,489 (11,164) 239,679 5,190 Fringe Benefit Recoveries 474,165 434,700 (39,465) 447,450 12,750 Federal Stabilization-Federal Economic Stimulus --- 250,000 250,000 --- (250,000) Other Miscellaneous 1,188,685 1,211,340 22,655 1,096,549 (114,791)
Total Miscellaneous Taxes, Fees, Revenues 2,760,007 2,954,503 194,496 2,600,798 (353,705)
State Lottery Fund 888,000 888,000 --- 928,800 40,800 Tobacco Settlement Fund 62,068 68,440 6,372 63,845 (4,595) Other Funds 427,908 530,895 102,987 466,477 (64,418)
Total Interfund Transfers 1,377,976 1,487,335 109,359 1,459,122 (28,213)
Total State Revenues General Fund 18,494,873 17,653,081 (841,792) 17,281,757 (371,324)
Gross Income Tax 12,760,000 11,309,000 (1,451,000) 11,343,000 34,000 EITC Expansion (60,000) (60,000) --- (55,000) 5,000 Sales Tax Dedication 683,000 636,000 (47,000) 649,000 13,000
Total Property Tax Relief Fund 13,383,000 11,885,000 (1,498,000) 11,937,000 52,000
Casino Control Fund 75,139 74,939 (200) 70,071 (4,868) Casino Revenue Fund 414,759 366,321 (48,438) 351,769 (14,552) Gubernatorial Elections 700 700 --- 700 ---
TOTAL STATE REVENUES 32,368,471$ 29,980,041$ (2,388,430)$ 29,641,297$ (338,744)$
Interfund Transfers
Property Tax Relief Fund
STATE REVENUESFISCAL YEARS 2009 AND 2010 ESTIMATES
(thousands of dollars)
Major Taxes
Miscellaneous Taxes, Fees, Revenues
Appendix I 33

SCHEDULE 1STATE REVENUES
(thousands of dollars)----------------------Fiscal Year Ending June 30----------------------
2008 2009 2010Actual Estimated Estimated
Major Taxes:
Sales 8,915,515 8,448,300 8,712,200. . . . . . . . . . . . . . . . . . . . . . . . . . . . . . . . . . . . . . . . . . . . . . . . . . . . . . . . . . . . . . . . . . . . .Less: Sales Tax Dedication (665,992) (636,000) (649,000). . . . . . . . . . . . . . . . . . . . . . . . . . . . . . . . . . . . . . . . . . . . . . . . . .
Corporation Business 3,062,447 2,442,300 2,141,500. . . . . . . . . . . . . . . . . . . . . . . . . . . . . . . . . . . . . . . . . . . . . . . . . . . . . . . .Transfer Inheritance 698,694 671,870 671,870. . . . . . . . . . . . . . . . . . . . . . . . . . . . . . . . . . . . . . . . . . . . . . . . . . . . . . . . .Motor Fuels 563,266 542,560 553,420. . . . . . . . . . . . . . . . . . . . . . . . . . . . . . . . . . . . . . . . . . . . . . . . . . . . . . . . . . . . . . .Insurance Premium 512,690 466,000 475,320. . . . . . . . . . . . . . . . . . . . . . . . . . . . . . . . . . . . . . . . . . . . . . . . . . . . . . . . . .Motor Vehicle Fees 400,853 380,500 400,050. . . . . . . . . . . . . . . . . . . . . . . . . . . . . . . . . . . . . . . . . . . . . . . . . . . . . . . . . .Cigarette 251,248 236,809 255,293. . . . . . . . . . . . . . . . . . . . . . . . . . . . . . . . . . . . . . . . . . . . . . . . . . . . . . . . . . . . . . . . . .Realty Transfer 320,751 260,000 234,000. . . . . . . . . . . . . . . . . . . . . . . . . . . . . . . . . . . . . . . . . . . . . . . . . . . . . . . . . . . . .Petroleum Products Gross Receipts 230,667 224,380 228,860. . . . . . . . . . . . . . . . . . . . . . . . . . . . . . . . . . . . . . . . . . . . .Alcoholic Beverage Excise 93,101 93,790 117,310. . . . . . . . . . . . . . . . . . . . . . . . . . . . . . . . . . . . . . . . . . . . . . . . . . . .Corporation Banks and Financial Institutions 70,851 54,580 54,580. . . . . . . . . . . . . . . . . . . . . . . . . . . . . . . . . . . . .Tobacco Products Wholesale Sales 14,360 13,920 14,200. . . . . . . . . . . . . . . . . . . . . . . . . . . . . . . . . . . . . . . . . . . . .Public Utility Excise (Reform) 12,234 12,234 12,234. . . . . . . . . . . . . . . . . . . . . . . . . . . . . . . . . . . . . . . . . . . . . . . . .
Total Major Taxes 14,480,685 13,211,243 13,221,837. . . . . . . . . . . . . . . . . . . . . . . . . . . . . . . . . . . . . . . . . . . . . . . . . . . . . . .
Miscellaneous Taxes, Fees, and Revenues:
Executive Branch----Department of Agriculture:
Animal Disease Control 225 ------ ------. . . . . . . . . . . . . . . . . . . . . . . . . . . . . . . . . . . . . . . . . . . . . . . . . .Environmental Services 198 ------ ------. . . . . . . . . . . . . . . . . . . . . . . . . . . . . . . . . . . . . . . . . . . . . . . . . . .Fertilizer Inspection Fees 564 366 366. . . . . . . . . . . . . . . . . . . . . . . . . . . . . . . . . . . . . . . . . . . . . . . . .Garden State Farmland Preservation Fund 670 ------ ------. . . . . . . . . . . . . . . . . . . . . . . . . . . . . . . . . . . .Milk Control Licenses and Fees 684 ------ ------. . . . . . . . . . . . . . . . . . . . . . . . . . . . . . . . . . . . . . . . . . . .Miscellaneous Revenue 385 7 7. . . . . . . . . . . . . . . . . . . . . . . . . . . . . . . . . . . . . . . . . . . . . . . . . . .
Total Department of Agriculture 2,726 373 373
Department of Banking and Insurance:Actuarial Services 120 55 55. . . . . . . . . . . . . . . . . . . . . . . . . . . . . . . . . . . . . . . . . . . . . . . . . . . . . . .Banking -- Assessments 10,369 10,000 9,140. . . . . . . . . . . . . . . . . . . . . . . . . . . . . . . . . . . . . . . . . . . . . . . . . . .Banking -- Examination Fees 2 ------ ------. . . . . . . . . . . . . . . . . . . . . . . . . . . . . . . . . . . . . . . . . . . . . . .Banking -- Licenses and Other Fees 3,181 2,850 2,850. . . . . . . . . . . . . . . . . . . . . . . . . . . . . . . . . . . . . . . . .FAIR Act Administration 23,348 21,000 21,000. . . . . . . . . . . . . . . . . . . . . . . . . . . . . . . . . . . . . . . . . . . . . . . . .Fraud Fines 1,495 1,500 1,500. . . . . . . . . . . . . . . . . . . . . . . . . . . . . . . . . . . . . . . . . . . . . . . . . . . . . . . . . . . .HMO Covered Lives 1,571 1,595 1,595. . . . . . . . . . . . . . . . . . . . . . . . . . . . . . . . . . . . . . . . . . . . . . . . . . . . .Insurance -- Examination Billings 2,076 2,500 2,500. . . . . . . . . . . . . . . . . . . . . . . . . . . . . . . . . . . . . . . . . . .Insurance -- Special Purpose Assessment 12,091 13,000 10,513. . . . . . . . . . . . . . . . . . . . . . . . . . . . . . . . . . . . .Insurance Fraud Prevention 30,958 32,894 32,454. . . . . . . . . . . . . . . . . . . . . . . . . . . . . . . . . . . . . . . . . . . . . . . .Insurance Licenses and Other Fees 40,210 44,480 30,480. . . . . . . . . . . . . . . . . . . . . . . . . . . . . . . . . . . . . . . . . .Public Adjusters Licensing 72 ------ ------. . . . . . . . . . . . . . . . . . . . . . . . . . . . . . . . . . . . . . . . . . . . . . . .Real Estate Commission 7,849 10,000 7,500. . . . . . . . . . . . . . . . . . . . . . . . . . . . . . . . . . . . . . . . . . . . . . . . . .
Total Department of Banking and Insurance 133,342 139,874 119,587
Department of Children and Families:Child Care Licensing/Adoption Law 307 340 340. . . . . . . . . . . . . . . . . . . . . . . . . . . . . . . . . . . . . . . . .Marriage License Fees 1,257 1,260 1,260. . . . . . . . . . . . . . . . . . . . . . . . . . . . . . . . . . . . . . . . . . . . . . . . . . . .
Total Department of Children and Families 1,564 1,600 1,600
Department of Community Affairs:Affordable Housing and Neighborhood Preservation -- Fair Housing 21,775 20,975 20,975. . . . . . . . . . . . . . .Boarding Home Fees 765 ------ ------. . . . . . . . . . . . . . . . . . . . . . . . . . . . . . . . . . . . . . . . . . . . . . . . . . . . .Construction Fees 25,138 16,049 13,754. . . . . . . . . . . . . . . . . . . . . . . . . . . . . . . . . . . . . . . . . . . . . . . . . . . . . . .Divorce Filing Fees 1,564 1,500 1,500. . . . . . . . . . . . . . . . . . . . . . . . . . . . . . . . . . . . . . . . . . . . . . . . . . . . . .Fire Safety 26,921 16,217 16,217. . . . . . . . . . . . . . . . . . . . . . . . . . . . . . . . . . . . . . . . . . . . . . . . . . . . . . . . . . . . .Housing Inspection Fees 11,333 9,031 9,031. . . . . . . . . . . . . . . . . . . . . . . . . . . . . . . . . . . . . . . . . . . . . . . . . .Miscellaneous Revenue 92 ------ ------. . . . . . . . . . . . . . . . . . . . . . . . . . . . . . . . . . . . . . . . . . . . . . . . . . .NJ Meadowlands Commission 110 ------ ------. . . . . . . . . . . . . . . . . . . . . . . . . . . . . . . . . . . . . . . . . . . . .Planned Real Estate Development Fees 1,919 828 828. . . . . . . . . . . . . . . . . . . . . . . . . . . . . . . . . . . . . .Truth In Renting 149 ------ ------. . . . . . . . . . . . . . . . . . . . . . . . . . . . . . . . . . . . . . . . . . . . . . . . . . . . . . . .
Total Department of Community Affairs 89,766 64,600 62,305
Department of Corrections:Miscellaneous Revenue 75 ------ ------. . . . . . . . . . . . . . . . . . . . . . . . . . . . . . . . . . . . . . . . . . . . . . . . . . .
Appendix I 34

SCHEDULE 1STATE REVENUES
(thousands of dollars)----------------------Fiscal Year Ending June 30----------------------
2008 2009 2010Actual Estimated Estimated
Department of Education:Audit Recoveries 1,239 800 500. . . . . . . . . . . . . . . . . . . . . . . . . . . . . . . . . . . . . . . . . . . . . . . . . . . . . . . .Audit of Enrollments 42 205 135. . . . . . . . . . . . . . . . . . . . . . . . . . . . . . . . . . . . . . . . . . . . . . . . . . . . .Federal Stabilization -- Federal Economic Stimulus ------ 250,000 ------. . . . . . . . . . . . . . . . . . . . . . . . . . . . .Local School District Loan Recoveries -- NJEDA 7,010 6,867 5,495. . . . . . . . . . . . . . . . . . . . . . . . . . . . . .Nonpublic Schools Handicapped and Auxiliary Recoveries 13,913 6,000 6,000. . . . . . . . . . . . . . . . . . . . . . .Nonpublic Schools Textbook Recoveries 1,368 1,200 1,200. . . . . . . . . . . . . . . . . . . . . . . . . . . . . . . . . . . . .School Construction Inspection Fees 499 500 500. . . . . . . . . . . . . . . . . . . . . . . . . . . . . . . . . . . . . . . .State Board of Examiners 5,770 4,925 5,125. . . . . . . . . . . . . . . . . . . . . . . . . . . . . . . . . . . . . . . . . . . . . . . . .
Total Department of Education 29,841 270,497 18,955
Department of Environmental Protection:Air Pollution Fees -- Minor Sources 7,643 6,270 6,300. . . . . . . . . . . . . . . . . . . . . . . . . . . . . . . . . . . . . . . . .Air Pollution Fees -- Title V Operating Permits 12,576 10,300 10,200. . . . . . . . . . . . . . . . . . . . . . . . . . . . . . . .Air Pollution Fines 7,373 2,500 2,250. . . . . . . . . . . . . . . . . . . . . . . . . . . . . . . . . . . . . . . . . . . . . . . . . . . . . .Clean Water Enforcement Act 3,328 2,500 2,500. . . . . . . . . . . . . . . . . . . . . . . . . . . . . . . . . . . . . . . . . . . . . .Coastal Area Facility Review Act 1,890 2,100 2,100. . . . . . . . . . . . . . . . . . . . . . . . . . . . . . . . . . . . . . . . . . .Endangered Species Tax Checkoff 239 158 158. . . . . . . . . . . . . . . . . . . . . . . . . . . . . . . . . . . . . . . . . .Environmental Infrastructure Financing Program Administrative Fee 6,889 5,000 5,000. . . . . . . . . . . . . . .Excess Diversion 320 230 230. . . . . . . . . . . . . . . . . . . . . . . . . . . . . . . . . . . . . . . . . . . . . . . . . . . . . . . .Freshwater Wetlands Fees 4,001 3,082 3,507. . . . . . . . . . . . . . . . . . . . . . . . . . . . . . . . . . . . . . . . . . . . . . . . .Freshwater Wetlands Fines 603 300 400. . . . . . . . . . . . . . . . . . . . . . . . . . . . . . . . . . . . . . . . . . . . . . . .Garden State Green Acres Preservation Trust Fund 321 ------ ------. . . . . . . . . . . . . . . . . . . . . . . . . . . . .Hazardous Discharge Site Cleanup 9,128 ------ ------. . . . . . . . . . . . . . . . . . . . . . . . . . . . . . . . . . . . . . . . . .Hazardous Waste Fees 2,904 3,539 3,624. . . . . . . . . . . . . . . . . . . . . . . . . . . . . . . . . . . . . . . . . . . . . . . . . . . .Hazardous Waste Fines 668 550 550. . . . . . . . . . . . . . . . . . . . . . . . . . . . . . . . . . . . . . . . . . . . . . . . . . .Highlands Permitting 542 543 551. . . . . . . . . . . . . . . . . . . . . . . . . . . . . . . . . . . . . . . . . . . . . . . . . . . . .Hunters’ and Anglers’ Licenses 13,212 11,000 11,000. . . . . . . . . . . . . . . . . . . . . . . . . . . . . . . . . . . . . . . . . . . .Industrial Site Recovery Act 704 815 630. . . . . . . . . . . . . . . . . . . . . . . . . . . . . . . . . . . . . . . . . . . . . . .Laboratory Certification Fees 801 800 2,400. . . . . . . . . . . . . . . . . . . . . . . . . . . . . . . . . . . . . . . . . . . . . .Laboratory Certification Fines 82 80 80. . . . . . . . . . . . . . . . . . . . . . . . . . . . . . . . . . . . . . . . . . . . .Lake Restoration Fund 228 ------ ------. . . . . . . . . . . . . . . . . . . . . . . . . . . . . . . . . . . . . . . . . . . . . . . . . . .Marina Rentals 1,206 885 885. . . . . . . . . . . . . . . . . . . . . . . . . . . . . . . . . . . . . . . . . . . . . . . . . . . . . . . . .Marine Lands -- Preparation and Filing Fees 2,776 159 159. . . . . . . . . . . . . . . . . . . . . . . . . . . . . . . . . . .Medical Waste 4,635 4,400 4,400. . . . . . . . . . . . . . . . . . . . . . . . . . . . . . . . . . . . . . . . . . . . . . . . . . . . . . . . . .Miscellaneous Revenue 74 ------ ------. . . . . . . . . . . . . . . . . . . . . . . . . . . . . . . . . . . . . . . . . . . . . . . . . . .NJ Economic Development Authority 1,000 ------ ------. . . . . . . . . . . . . . . . . . . . . . . . . . . . . . . . . . . . . . .New Jersey Pollutant Discharge Elimination System/Stormwater Permits 22,034 16,700 16,700. . . . . . . . . . . .New Jersey Spill Compensation Fund 5,729 ------ ------. . . . . . . . . . . . . . . . . . . . . . . . . . . . . . . . . . . . . . . .Parks Management Fees and Permits 6,172 4,300 4,300. . . . . . . . . . . . . . . . . . . . . . . . . . . . . . . . . . . . . . . .Parks Management Fines 123 125 125. . . . . . . . . . . . . . . . . . . . . . . . . . . . . . . . . . . . . . . . . . . . . . . . . .Pesticide Control Fees 4,492 4,400 4,400. . . . . . . . . . . . . . . . . . . . . . . . . . . . . . . . . . . . . . . . . . . . . . . . . . . .Pesticide Control Fines 85 90 90. . . . . . . . . . . . . . . . . . . . . . . . . . . . . . . . . . . . . . . . . . . . . . . . . . .Pollution Prevention Fund 195 ------ ------. . . . . . . . . . . . . . . . . . . . . . . . . . . . . . . . . . . . . . . . . . . . . . . . .Radiation Protection Fees 3,885 5,825 3,268. . . . . . . . . . . . . . . . . . . . . . . . . . . . . . . . . . . . . . . . . . . . . . . . .Radiation Protection Fines 164 110 110. . . . . . . . . . . . . . . . . . . . . . . . . . . . . . . . . . . . . . . . . . . . . . . .Radon Testers Certification 223 200 200. . . . . . . . . . . . . . . . . . . . . . . . . . . . . . . . . . . . . . . . . . . . . . . .Safe Drinking Water Fund 4 ------ ------. . . . . . . . . . . . . . . . . . . . . . . . . . . . . . . . . . . . . . . . . . . . . . . . .Shellfish and Marine Fisheries 8 8 9. . . . . . . . . . . . . . . . . . . . . . . . . . . . . . . . . . . . . . . . . . . . .Solid Waste -- Utility Regulation Assessments 5,105 3,100 3,100. . . . . . . . . . . . . . . . . . . . . . . . . . . . . . . . .Solid Waste Fines 944 550 500. . . . . . . . . . . . . . . . . . . . . . . . . . . . . . . . . . . . . . . . . . . . . . . . . . . . . . .Solid Waste Management Fees 7,294 10,054 7,081. . . . . . . . . . . . . . . . . . . . . . . . . . . . . . . . . . . . . . . . . . . . .Solid and Hazardous Waste Disclosure 266 ------ ------. . . . . . . . . . . . . . . . . . . . . . . . . . . . . . . . . . . . . . .Spring Meadow Golf Course 250 250 250. . . . . . . . . . . . . . . . . . . . . . . . . . . . . . . . . . . . . . . . . . . . . . .Stream Encroachment 3,758 2,710 3,210. . . . . . . . . . . . . . . . . . . . . . . . . . . . . . . . . . . . . . . . . . . . . . . . . . . .Toxic Catastrophe Prevention Fees 1,456 1,500 1,587. . . . . . . . . . . . . . . . . . . . . . . . . . . . . . . . . . . . . . . . . .Toxic Catastrophe Prevention Fines 101 80 80. . . . . . . . . . . . . . . . . . . . . . . . . . . . . . . . . . . . . . . . .Treatment Works Approval 1,625 1,890 1,890. . . . . . . . . . . . . . . . . . . . . . . . . . . . . . . . . . . . . . . . . . . . . . . .Underground Storage Tanks Fees 1,457 1,200 1,100. . . . . . . . . . . . . . . . . . . . . . . . . . . . . . . . . . . . . . . . . . .Water Allocation 5,143 2,050 2,050. . . . . . . . . . . . . . . . . . . . . . . . . . . . . . . . . . . . . . . . . . . . . . . . . . . . . . . .Water Supply Fund 19 ------ ------. . . . . . . . . . . . . . . . . . . . . . . . . . . . . . . . . . . . . . . . . . . . . . . . . . . . . .Water Supply Management Regulations 1,720 1,700 1,700. . . . . . . . . . . . . . . . . . . . . . . . . . . . . . . . . . . . . .Water/Wastewater Operators Licenses 202 210 210. . . . . . . . . . . . . . . . . . . . . . . . . . . . . . . . . . . . . . .Waterfront Development Fees 3,315 2,638 2,638. . . . . . . . . . . . . . . . . . . . . . . . . . . . . . . . . . . . . . . . . . . . . .Waterfront Development Fines 18 10 20. . . . . . . . . . . . . . . . . . . . . . . . . . . . . . . . . . . . . . . . . . . . .Well Permits/Well Drillers/Pump Installers Licenses 2,410 1,100 1,100. . . . . . . . . . . . . . . . . . . . . . . . . . . .Wetlands 105 44 44. . . . . . . . . . . . . . . . . . . . . . . . . . . . . . . . . . . . . . . . . . . . . . . . . . . . . . . . . . . . . .Worker Community Right to Know -- Fees 394 ------ ------. . . . . . . . . . . . . . . . . . . . . . . . . . . . . . . . . . . .Worker Community Right to Know -- Fines 60 100 100. . . . . . . . . . . . . . . . . . . . . . . . . . . . . . . . . . .
Total Department of Environmental Protection 161,899 116,155 112,786
Appendix I 35

SCHEDULE 1STATE REVENUES
(thousands of dollars)----------------------Fiscal Year Ending June 30----------------------
2008 2009 2010Actual Estimated Estimated
Department of Health and Senior Services:Admission Charge Hospital Assessment 6,000 6,000 6,000. . . . . . . . . . . . . . . . . . . . . . . . . . . . . . . . . . . . . .Clinical Laboratory 654 ------ ------. . . . . . . . . . . . . . . . . . . . . . . . . . . . . . . . . . . . . . . . . . . . . . . . . . . . . .Consumer Health Penalties 5,245 ------ ------. . . . . . . . . . . . . . . . . . . . . . . . . . . . . . . . . . . . . . . . . . . . . . . .Health Care Reform 1,200 1,200 1,200. . . . . . . . . . . . . . . . . . . . . . . . . . . . . . . . . . . . . . . . . . . . . . . . . . . . . .Licenses, Fines, Permits, Penalties and Fees 7,857 790 790. . . . . . . . . . . . . . . . . . . . . . . . . . . . . . . . . . .Miscellaneous Revenue 322 400 400. . . . . . . . . . . . . . . . . . . . . . . . . . . . . . . . . . . . . . . . . . . . . . . . . . .Pharmaceutical Assistance to the Aged and Disabled -- Recoveries 1,236 ------ ------. . . . . . . . . . . . . . . . .
Total Department of Health and Senior Services 22,514 8,390 8,390
Department of Human Services:Commission for the Blind 698 ------ ------. . . . . . . . . . . . . . . . . . . . . . . . . . . . . . . . . . . . . . . . . . . . . . . . .Early Periodic Screening, Diagnosis and Treatment 2,148 ------ ------. . . . . . . . . . . . . . . . . . . . . . . . . . . . .Family Care II 239 ------ ------. . . . . . . . . . . . . . . . . . . . . . . . . . . . . . . . . . . . . . . . . . . . . . . . . . . . . . . . . .General Assistance Prescription Drug Rebates 12,474 ------ ------. . . . . . . . . . . . . . . . . . . . . . . . . . . . . . . . .Interim Assistance 641 ------ ------. . . . . . . . . . . . . . . . . . . . . . . . . . . . . . . . . . . . . . . . . . . . . . . . . . . . . . .Medicaid Uncompensated Care -- Acute 289,881 277,254 274,510. . . . . . . . . . . . . . . . . . . . . . . . . . . . . . . . . . . . . .Medicaid Uncompensated Care -- Mental Health 39,798 37,075 37,075. . . . . . . . . . . . . . . . . . . . . . . . . . . . . . .Medicaid Uncompensated Care -- Psychiatric 175,701 178,685 178,685. . . . . . . . . . . . . . . . . . . . . . . . . . . . . . . . . .Medical Assistance -- Federal Match on PAAD/Medicaid Dual Eligibles 457 ------ ------. . . . . . . . . . . .Medical Assistance -- Recoveries 1,139 ------ ------. . . . . . . . . . . . . . . . . . . . . . . . . . . . . . . . . . . . . . . . . . .Miscellaneous Revenue 856 1,500 1,500. . . . . . . . . . . . . . . . . . . . . . . . . . . . . . . . . . . . . . . . . . . . . . . . . . .Patients’ and Residents’ Cost Recovery -- Developmental Disabilities 17,442 19,020 19,020. . . . . . . . . . . . . .Patients’ and Residents’ Cost Recovery -- Psychiatric Hospitals 70,799 73,534 82,568. . . . . . . . . . . . . . . . . . .Payments for Medical Assistance Recipients -- Prescription Drugs 186,148 ------ ------. . . . . . . . . . . . . . . . .Purchased Institutional Care 4,202 ------ ------. . . . . . . . . . . . . . . . . . . . . . . . . . . . . . . . . . . . . . . . . . . . . . .School Based Medicaid 24,023 ------ ------. . . . . . . . . . . . . . . . . . . . . . . . . . . . . . . . . . . . . . . . . . . . . . . . . . .
Total Department of Human Services 826,646 587,068 593,358
Department of Labor and Workforce Development:Examination Fees 2,253 ------ ------. . . . . . . . . . . . . . . . . . . . . . . . . . . . . . . . . . . . . . . . . . . . . . . . . . . . . . .Miscellaneous Revenue 133 155 155. . . . . . . . . . . . . . . . . . . . . . . . . . . . . . . . . . . . . . . . . . . . . . . . . . .New Jersey Workforce Development Partnership Fund -- WDP Program 2,528 ------ ------. . . . . . . . . . . .New Jersey Workforce Development Partnership Fund -- WorkFirst NJ 25,115 ------ ------. . . . . . . . . . . . .Special Compensation Fund 2,457 1,798 1,798. . . . . . . . . . . . . . . . . . . . . . . . . . . . . . . . . . . . . . . . . . . . . . .State Disability Benefits Fund 9,735 ------ ------. . . . . . . . . . . . . . . . . . . . . . . . . . . . . . . . . . . . . . . . . . . . . .Urban Enterprise Zone Administration Cost 26 ------ ------. . . . . . . . . . . . . . . . . . . . . . . . . . . . . . . . . . .Workers’ Compensation Assessment 21,041 13,198 12,829. . . . . . . . . . . . . . . . . . . . . . . . . . . . . . . . . . . . . . . .Workplace Standards -- Licenses, Permits and Fines 14,780 4,720 4,351. . . . . . . . . . . . . . . . . . . . . . . . . . . . .
Total Department of Labor and Workforce Development 78,068 19,871 19,133
Department of Law and Public Safety:Beverage Licenses 10,143 3,960 3,960. . . . . . . . . . . . . . . . . . . . . . . . . . . . . . . . . . . . . . . . . . . . . . . . . . . . . . .Charities Registration Section 1,758 695 695. . . . . . . . . . . . . . . . . . . . . . . . . . . . . . . . . . . . . . . . . . . . . .Consumer Affairs 6,471 ------ ------. . . . . . . . . . . . . . . . . . . . . . . . . . . . . . . . . . . . . . . . . . . . . . . . . . . . . . .Controlled Dangerous Substances 830 100 100. . . . . . . . . . . . . . . . . . . . . . . . . . . . . . . . . . . . . . . . . . .EDA School Construction Recoveries ------ 166 166. . . . . . . . . . . . . . . . . . . . . . . . . . . . . . . . . . . . . . .Forfeiture Funds 250 250 250. . . . . . . . . . . . . . . . . . . . . . . . . . . . . . . . . . . . . . . . . . . . . . . . . . . . . . . .General Client Services 29,805 ------ ------. . . . . . . . . . . . . . . . . . . . . . . . . . . . . . . . . . . . . . . . . . . . . . . . . . .Legal Services 34,852 ------ ------. . . . . . . . . . . . . . . . . . . . . . . . . . . . . . . . . . . . . . . . . . . . . . . . . . . . . . . . . .Legalized Games of Chance Control 2,132 1,200 1,200. . . . . . . . . . . . . . . . . . . . . . . . . . . . . . . . . . . . . . . . .Miscellaneous Revenue 565 55 55. . . . . . . . . . . . . . . . . . . . . . . . . . . . . . . . . . . . . . . . . . . . . . . . . . .New Jersey Cemetery Board 198 22 124. . . . . . . . . . . . . . . . . . . . . . . . . . . . . . . . . . . . . . . . . . . . . . .Pleasure Boat Licenses 2,695 2,695 2,695. . . . . . . . . . . . . . . . . . . . . . . . . . . . . . . . . . . . . . . . . . . . . . . . . . .Private Employment Agencies 740 258 258. . . . . . . . . . . . . . . . . . . . . . . . . . . . . . . . . . . . . . . . . . . . .Retired Officer Handgun Permit 253 ------ ------. . . . . . . . . . . . . . . . . . . . . . . . . . . . . . . . . . . . . . . . . . . .Securities Enforcement 13,169 8,994 8,994. . . . . . . . . . . . . . . . . . . . . . . . . . . . . . . . . . . . . . . . . . . . . . . . . . .State Board of Architects 1,065 360 553. . . . . . . . . . . . . . . . . . . . . . . . . . . . . . . . . . . . . . . . . . . . . . . . . .State Board of Audiology and Speech--Language Pathology Advisory 815 14 501. . . . . . . . . . . . . .State Board of Certified Public Accountants 574 850 39. . . . . . . . . . . . . . . . . . . . . . . . . . . . . . . . . . .State Board of Chiropractors 1,124 72 618. . . . . . . . . . . . . . . . . . . . . . . . . . . . . . . . . . . . . . . . . . . . . . .State Board of Cosmetology and Hairstyling 1,785 2,398 520. . . . . . . . . . . . . . . . . . . . . . . . . . . . . . . . . .State Board of Court Reporting 220 5 130. . . . . . . . . . . . . . . . . . . . . . . . . . . . . . . . . . . . . . . . . . . . .State Board of Dentistry 4,558 180 1,486. . . . . . . . . . . . . . . . . . . . . . . . . . . . . . . . . . . . . . . . . . . . . . . . . .State Board of Electrical Contractors 581 684 280. . . . . . . . . . . . . . . . . . . . . . . . . . . . . . . . . . . . . . . .State Board of HVAC Contractors ------ ------ 20. . . . . . . . . . . . . . . . . . . . . . . . . . . . . . . . . . . . . . . . . . .State Board of Marriage Counselor Examiners 504 362 228. . . . . . . . . . . . . . . . . . . . . . . . . . . . . . . . .State Board of Master Plumbers 234 283 52. . . . . . . . . . . . . . . . . . . . . . . . . . . . . . . . . . . . . . . . . . . .
Appendix I 36

SCHEDULE 1STATE REVENUES
(thousands of dollars)----------------------Fiscal Year Ending June 30----------------------
2008 2009 2010Actual Estimated Estimated
State Board of Medical Examiners 6,139 4,403 1,995. . . . . . . . . . . . . . . . . . . . . . . . . . . . . . . . . . . . . . . . . .State Board of Mortuary Science 517 191 233. . . . . . . . . . . . . . . . . . . . . . . . . . . . . . . . . . . . . . . . . . .State Board of Nursing 10,933 4,114 6,431. . . . . . . . . . . . . . . . . . . . . . . . . . . . . . . . . . . . . . . . . . . . . . . . . . .State Board of Occupational Therapists and Assistants 745 13 449. . . . . . . . . . . . . . . . . . . . . . . . . .State Board of Ophthalmic Dispensers and Ophthalmic Technicians 665 11 423. . . . . . . . . . . . . . . .State Board of Optometrists 124 239 17. . . . . . . . . . . . . . . . . . . . . . . . . . . . . . . . . . . . . . . . . . . . . . .State Board of Orthotics and Prosthetics 3 33 1. . . . . . . . . . . . . . . . . . . . . . . . . . . . . . . . . . . . . .State Board of Pharmacy 1,257 1,195 358. . . . . . . . . . . . . . . . . . . . . . . . . . . . . . . . . . . . . . . . . . . . . . . . . .State Board of Physical Therapy 1,164 20 618. . . . . . . . . . . . . . . . . . . . . . . . . . . . . . . . . . . . . . . . . . . .State Board of Polysomnography ------ 50 35. . . . . . . . . . . . . . . . . . . . . . . . . . . . . . . . . . . . . . . . . . .State Board of Professional Engineers and Land Surveyors 1,747 225 992. . . . . . . . . . . . . . . . . . . . . . .State Board of Professional Planners 233 117 130. . . . . . . . . . . . . . . . . . . . . . . . . . . . . . . . . . . . . . . .State Board of Psychological Examiners 189 256 59. . . . . . . . . . . . . . . . . . . . . . . . . . . . . . . . . . . . . .State Board of Public Movers and Warehousemen 237 ------ ------. . . . . . . . . . . . . . . . . . . . . . . . . . . . . .State Board of Real Estate Appraisers 2,021 78 456. . . . . . . . . . . . . . . . . . . . . . . . . . . . . . . . . . . . . . . .State Board of Respiratory Care 368 22 208. . . . . . . . . . . . . . . . . . . . . . . . . . . . . . . . . . . . . . . . . . . .State Board of Social Workers 378 633 52. . . . . . . . . . . . . . . . . . . . . . . . . . . . . . . . . . . . . . . . . . . . . .State Board of Veterinary Medical Examiners 255 211 33. . . . . . . . . . . . . . . . . . . . . . . . . . . . . . . . .State Police -- Fingerprint Fees 15,650 3,694 3,694. . . . . . . . . . . . . . . . . . . . . . . . . . . . . . . . . . . . . . . . . . . . .State Police -- Nuclear Facilities Security Detail 2,568 1,432 ------. . . . . . . . . . . . . . . . . . . . . . . . . . . . . . . .State Police -- Other Licenses 295 295 295. . . . . . . . . . . . . . . . . . . . . . . . . . . . . . . . . . . . . . . . . . . . . .State Police -- Private Detective Licenses 265 220 220. . . . . . . . . . . . . . . . . . . . . . . . . . . . . . . . . . . . .Victim and Witness Advocacy Fund 1,356 ------ ------. . . . . . . . . . . . . . . . . . . . . . . . . . . . . . . . . . . . . . . . .Victims of Violent Crime Compensation 9,283 430 430. . . . . . . . . . . . . . . . . . . . . . . . . . . . . . . . . . . . . .Weights and Measures -- General 4,134 2,612 2,612. . . . . . . . . . . . . . . . . . . . . . . . . . . . . . . . . . . . . . . . . . .
Total Department of Law and Public Safety 175,847 44,097 42,665
Department of Military and Veterans’ Affairs:Miscellaneous Revenue 2,964 ------ ------. . . . . . . . . . . . . . . . . . . . . . . . . . . . . . . . . . . . . . . . . . . . . . . . . . .Nuclear Facilities Security Detail 4,985 2,340 ------. . . . . . . . . . . . . . . . . . . . . . . . . . . . . . . . . . . . . . . . . . .Soldiers’ Homes 38,979 44,093 45,622. . . . . . . . . . . . . . . . . . . . . . . . . . . . . . . . . . . . . . . . . . . . . . . . . . . . . . . .
Total Department of Military and Veterans’ Affairs 46,928 46,433 45,622
Department of the Public Advocate:Licenses, Fines, Permits, Penalties and Fees 16 ------ ------. . . . . . . . . . . . . . . . . . . . . . . . . . . . . . . . . . .Office of Dispute Settlement Mediation 57 50 50. . . . . . . . . . . . . . . . . . . . . . . . . . . . . . . . . . . . . .Rate Counsel 7,447 6,561 6,561. . . . . . . . . . . . . . . . . . . . . . . . . . . . . . . . . . . . . . . . . . . . . . . . . . . . . . . . . . .
Total Department of the Public Advocate 7,520 6,611 6,611
Department of State:Governor’s Teaching Scholars Program Loan Repayment 55 76 44. . . . . . . . . . . . . . . . . . . . . . . .Miscellaneous Revenue 9 9 9. . . . . . . . . . . . . . . . . . . . . . . . . . . . . . . . . . . . . . . . . . . . . . . . . . .New Jersey World Trade Center Scholarship Program 11 ------ ------. . . . . . . . . . . . . . . . . . . . . . . . . . .
Total Department of State 75 85 53
Department of Transportation:Air Safety Fund 723 965 965. . . . . . . . . . . . . . . . . . . . . . . . . . . . . . . . . . . . . . . . . . . . . . . . . . . . . . . . .Applications and Highway Permits 2,553 1,300 1,300. . . . . . . . . . . . . . . . . . . . . . . . . . . . . . . . . . . . . . . . . .Autonomous Transportation Authorities 24,504 24,500 24,500. . . . . . . . . . . . . . . . . . . . . . . . . . . . . . . . . . . . . .Drunk Driving Fines 469 350 350. . . . . . . . . . . . . . . . . . . . . . . . . . . . . . . . . . . . . . . . . . . . . . . . . . . . .Good Driver 75,570 72,300 72,300. . . . . . . . . . . . . . . . . . . . . . . . . . . . . . . . . . . . . . . . . . . . . . . . . . . . . . . . . . . .Interest on Purchase of Right of Way 37 5 5. . . . . . . . . . . . . . . . . . . . . . . . . . . . . . . . . . . . . . . .Logo Sign Program Fees 420 300 300. . . . . . . . . . . . . . . . . . . . . . . . . . . . . . . . . . . . . . . . . . . . . . . . . .Miscellaneous Revenue 49 ------ ------. . . . . . . . . . . . . . . . . . . . . . . . . . . . . . . . . . . . . . . . . . . . . . . . . . .Outdoor Advertising 2,229 740 740. . . . . . . . . . . . . . . . . . . . . . . . . . . . . . . . . . . . . . . . . . . . . . . . . . . . .Placarded Railcar 188 ------ ------. . . . . . . . . . . . . . . . . . . . . . . . . . . . . . . . . . . . . . . . . . . . . . . . . . . . . . . .Rental Receipts -- Tenant Relocation Program 381 ------ ------. . . . . . . . . . . . . . . . . . . . . . . . . . . . . . . . .
Total Department of Transportation 107,123 100,460 100,460
Department of the Treasury:Amnesty ------ 100,000 ------. . . . . . . . . . . . . . . . . . . . . . . . . . . . . . . . . . . . . . . . . . . . . . . . . . . . . . . . . . . . . .Assessment on Real Property Greater Than $1 Million 118,689 91,110 82,000. . . . . . . . . . . . . . . . . . . . . . . . . .Assessments -- Cable TV 4,886 4,770 4,770. . . . . . . . . . . . . . . . . . . . . . . . . . . . . . . . . . . . . . . . . . . . . . . . . .Assessments -- Public Utility 31,953 30,760 29,158. . . . . . . . . . . . . . . . . . . . . . . . . . . . . . . . . . . . . . . . . . . . . . .Casino Fines 662 ------ ------. . . . . . . . . . . . . . . . . . . . . . . . . . . . . . . . . . . . . . . . . . . . . . . . . . . . . . . . . . .Coin Operated Telephones 4,428 4,800 4,800. . . . . . . . . . . . . . . . . . . . . . . . . . . . . . . . . . . . . . . . . . . . . . . .Commercial Recording -- Expedited 3,284 2,153 2,153. . . . . . . . . . . . . . . . . . . . . . . . . . . . . . . . . . . . . . . . .
Appendix I 37

SCHEDULE 1STATE REVENUES
(thousands of dollars)----------------------Fiscal Year Ending June 30----------------------
2008 2009 2010Actual Estimated Estimated
Commissions (Notary) 1,629 1,600 1,600. . . . . . . . . . . . . . . . . . . . . . . . . . . . . . . . . . . . . . . . . . . . . . . . . . .Communication Fee -- Lottery 33 ------ ------. . . . . . . . . . . . . . . . . . . . . . . . . . . . . . . . . . . . . . . . . . . . . .Cost Assessment 5,927 ------ ------. . . . . . . . . . . . . . . . . . . . . . . . . . . . . . . . . . . . . . . . . . . . . . . . . . . . . . . .Criminal Disposition 658 ------ ------. . . . . . . . . . . . . . . . . . . . . . . . . . . . . . . . . . . . . . . . . . . . . . . . . . . . .Domestic Security 33,951 31,000 31,000. . . . . . . . . . . . . . . . . . . . . . . . . . . . . . . . . . . . . . . . . . . . . . . . . . . . . . .Dormitory Safety Trust Fund -- Debt Service Recovery ------ 5,694 5,680. . . . . . . . . . . . . . . . . . . . . . . . . .Equipment Leasing Fund -- Debt Service Recovery 3,532 2,289 1,002. . . . . . . . . . . . . . . . . . . . . . . . . . . . .Escrow Interest -- Construction Accounts 61 35 35. . . . . . . . . . . . . . . . . . . . . . . . . . . . . . . . . . . . .Fur Clothing Tax 1,640 200 ------. . . . . . . . . . . . . . . . . . . . . . . . . . . . . . . . . . . . . . . . . . . . . . . . . . . . . . . .General Revenue -- Fees (Commercial Recording and UCC) 52,314 48,600 48,600. . . . . . . . . . . . . . . . . . . . . .Higher Education Capital Improvement Fund -- Debt Service Recovery ------ 15,298 15,298. . . . . . . . . . . . .Hotel/Motel Occupancy Tax 86,285 80,000 85,000. . . . . . . . . . . . . . . . . . . . . . . . . . . . . . . . . . . . . . . . . . . . . . .Human Resource Development Institute 2,554 ------ ------. . . . . . . . . . . . . . . . . . . . . . . . . . . . . . . . . . . . . .Investment Earnings 117,738 ------ ------. . . . . . . . . . . . . . . . . . . . . . . . . . . . . . . . . . . . . . . . . . . . . . . . . . . . .MVC Securitization 131 ------ ------. . . . . . . . . . . . . . . . . . . . . . . . . . . . . . . . . . . . . . . . . . . . . . . . . . . . . .Miscellaneous Revenue 13,132 2,300 2,300. . . . . . . . . . . . . . . . . . . . . . . . . . . . . . . . . . . . . . . . . . . . . . . . . . .NJ Public Records Preservation 34,992 15,500 17,100. . . . . . . . . . . . . . . . . . . . . . . . . . . . . . . . . . . . . . . . . . . .Nuclear Emergency Response Assessment 5,335 5,424 4,346. . . . . . . . . . . . . . . . . . . . . . . . . . . . . . . . . . . .Office of Information Technology Receipts 60,944 ------ ------. . . . . . . . . . . . . . . . . . . . . . . . . . . . . . . . . . .Public Defender Client Receipts 5,236 3,400 3,400. . . . . . . . . . . . . . . . . . . . . . . . . . . . . . . . . . . . . . . . . . . .Public Utility Fines 1,308 1,000 1,000. . . . . . . . . . . . . . . . . . . . . . . . . . . . . . . . . . . . . . . . . . . . . . . . . . . . . .Public Utility Gross Receipts and Franchise Taxes (Water/Sewer) 87,557 87,550 87,550. . . . . . . . . . . . . . . . . .Railroad Tax -- Class II 2,998 3,700 3,700. . . . . . . . . . . . . . . . . . . . . . . . . . . . . . . . . . . . . . . . . . . . . . . . . . .Railroad Tax -- Franchise 1,476 1,300 1,300. . . . . . . . . . . . . . . . . . . . . . . . . . . . . . . . . . . . . . . . . . . . . . . . . .Sale of Real Property 215 ------ ------. . . . . . . . . . . . . . . . . . . . . . . . . . . . . . . . . . . . . . . . . . . . . . . . . . . . .State Disability Benefits Fund 65 ------ ------. . . . . . . . . . . . . . . . . . . . . . . . . . . . . . . . . . . . . . . . . . . . . .State Lottery Fund 2,740 ------ ------. . . . . . . . . . . . . . . . . . . . . . . . . . . . . . . . . . . . . . . . . . . . . . . . . . . . . . .Stormwater Management--Combined Sewer Overflow 950 ------ ------. . . . . . . . . . . . . . . . . . . . . . . . . . .Surplus Property 1,930 1,500 1,500. . . . . . . . . . . . . . . . . . . . . . . . . . . . . . . . . . . . . . . . . . . . . . . . . . . . . . . .Tax Audit Services -- Uncollected Revenue Recovery 320 ------ ------. . . . . . . . . . . . . . . . . . . . . . . . . . .Tax Referral Cost Recovery Fee 6,091 5,400 5,400. . . . . . . . . . . . . . . . . . . . . . . . . . . . . . . . . . . . . . . . . . . .Telephone Assessment 130,245 132,000 137,000. . . . . . . . . . . . . . . . . . . . . . . . . . . . . . . . . . . . . . . . . . . . . . . . . . .Tire Clean--Up Surcharge 9,637 10,000 10,000. . . . . . . . . . . . . . . . . . . . . . . . . . . . . . . . . . . . . . . . . . . . . . . . .Transitional Energy Facilities Assessment 257,222 234,489 239,679. . . . . . . . . . . . . . . . . . . . . . . . . . . . . . . . . . . .
Total Department of the Treasury 1,092,748 921,872 825,371
Other Sources:Miscellaneous Revenue 13,273 500 500. . . . . . . . . . . . . . . . . . . . . . . . . . . . . . . . . . . . . . . . . . . . . . . . . . .
Interdepartmental Accounts:Administration and Investment of Pension and Health Benefit Funds -- Recoveries 3,114 3,114 3,114. . . .Employee Maintenance Deductions 419 300 300. . . . . . . . . . . . . . . . . . . . . . . . . . . . . . . . . . . . . . . . .Fringe Benefit Recoveries from Colleges and Universities 144,819 158,000 155,780. . . . . . . . . . . . . . . . . . . . . . .Fringe Benefit Recoveries from Federal and Other Funds 233,178 250,000 259,470. . . . . . . . . . . . . . . . . . . . . . . .Fringe Benefit Recoveries from School Districts 51,384 26,700 32,200. . . . . . . . . . . . . . . . . . . . . . . . . . . . . . .Indirect Cost Recoveries -- DEP Other Funds 8,520 8,100 8,100. . . . . . . . . . . . . . . . . . . . . . . . . . . . . . . . . .MTF Revenue Fund 30,806 40,500 35,500. . . . . . . . . . . . . . . . . . . . . . . . . . . . . . . . . . . . . . . . . . . . . . . . . . . . . .Miscellaneous Revenue 67 ------ ------. . . . . . . . . . . . . . . . . . . . . . . . . . . . . . . . . . . . . . . . . . . . . . . . . . .Rent of State Building Space 2,923 2,900 2,900. . . . . . . . . . . . . . . . . . . . . . . . . . . . . . . . . . . . . . . . . . . . . . .Social Security Recoveries from Federal and Other Funds 64,724 66,000 76,000. . . . . . . . . . . . . . . . . . . . . . . .Standard Offer Payments -- Utilities 525 ------ ------. . . . . . . . . . . . . . . . . . . . . . . . . . . . . . . . . . . . . . . . .
Total Interdepartmental Accounts 540,479 555,614 573,364
Judicial Branch----The Judiciary:
Civil Arbitration Program 2,602 ------ ------. . . . . . . . . . . . . . . . . . . . . . . . . . . . . . . . . . . . . . . . . . . . . . . . .Court Fees 68,764 70,403 69,665. . . . . . . . . . . . . . . . . . . . . . . . . . . . . . . . . . . . . . . . . . . . . . . . . . . . . . . . . . . . .Miscellaneous Revenue 615 ------ ------. . . . . . . . . . . . . . . . . . . . . . . . . . . . . . . . . . . . . . . . . . . . . . . . . . .
Total Judiciary 71,981 70,403 69,665
Total Miscellaneous Taxes, Fees, and Revenues 3,402,415 2,954,503 2,600,798. . . . . . . . . . . . . . . . . . . . . . . . . . . . . . . .
Interfund Transfers:
Beaches and Harbor Fund 46 46 46. . . . . . . . . . . . . . . . . . . . . . . . . . . . . . . . . . . . . . . . . . . . . . . . . . . . .Body Armor Replacement Fund ------ 5,000 ------. . . . . . . . . . . . . . . . . . . . . . . . . . . . . . . . . . . . . . . . . . . . . . . .Catastrophic Illness In Children--Relief Fund ------ 5,000 ------. . . . . . . . . . . . . . . . . . . . . . . . . . . . . . . . . . . . .Clean Energy Fund 10,000 10,000 10,000. . . . . . . . . . . . . . . . . . . . . . . . . . . . . . . . . . . . . . . . . . . . . . . . . . . . . . . . . .
Appendix I 38

SCHEDULE 1STATE REVENUES
(thousands of dollars)----------------------Fiscal Year Ending June 30----------------------
2008 2009 2010Actual Estimated Estimated
Interfund Transfers (cont)
Clean Waters Fund 18 36 36. . . . . . . . . . . . . . . . . . . . . . . . . . . . . . . . . . . . . . . . . . . . . . . . . . . . . . . . . .Correctional Facilities Construction Fund 25 15 15. . . . . . . . . . . . . . . . . . . . . . . . . . . . . . . . . . . . . . . .Correctional Facilities Construction Fund of 1987 31 13 13. . . . . . . . . . . . . . . . . . . . . . . . . . . . . . . . .Cultural Centers and Historic Preservation Fund 49 50 50. . . . . . . . . . . . . . . . . . . . . . . . . . . . . . . . . . .Dam, Lake, Stream and Flood Control Project Fund -- 2003 271 300 300. . . . . . . . . . . . . . . . . . . . . . . . . .Developmental Disabilities Waiting List Reduction Fund 324 235 185. . . . . . . . . . . . . . . . . . . . . . . . . . . .Dredging and Containment Facility Fund 375 405 405. . . . . . . . . . . . . . . . . . . . . . . . . . . . . . . . . . . . . . . .Emergency Flood Control Fund 15 13 12. . . . . . . . . . . . . . . . . . . . . . . . . . . . . . . . . . . . . . . . . . . . . . . .Emergency Medical Technicians Training ------ 4,000 ------. . . . . . . . . . . . . . . . . . . . . . . . . . . . . . . . . . . . . . . .Emergency Service Fund ------ 6,000 ------. . . . . . . . . . . . . . . . . . . . . . . . . . . . . . . . . . . . . . . . . . . . . . . . . . . . .Energy Conservation Fund 12 15 15. . . . . . . . . . . . . . . . . . . . . . . . . . . . . . . . . . . . . . . . . . . . . . . . . . . .Enterprise Zone Assistance Fund 12,067 53,234 21,016. . . . . . . . . . . . . . . . . . . . . . . . . . . . . . . . . . . . . . . . . . . . . . .Fund for the Support of Free Public Schools 4,940 2,540 2,540. . . . . . . . . . . . . . . . . . . . . . . . . . . . . . . . . . . . . .Garden State Farmland Preservation Trust Fund 1,692 1,867 1,867. . . . . . . . . . . . . . . . . . . . . . . . . . . . . . . . . . .Garden State Green Acres Preservation Trust Fund 4,787 5,416 5,416. . . . . . . . . . . . . . . . . . . . . . . . . . . . . . . . .Garden State Historic Preservation Trust Fund 453 616 616. . . . . . . . . . . . . . . . . . . . . . . . . . . . . . . . . . . .Hazardous Discharge Fund 8 4 4. . . . . . . . . . . . . . . . . . . . . . . . . . . . . . . . . . . . . . . . . . . . . . . . . . . .Hazardous Discharge Site Cleanup Fund 14,773 17,465 17,465. . . . . . . . . . . . . . . . . . . . . . . . . . . . . . . . . . . . . . . . .Housing Assistance Fund 181 160 84. . . . . . . . . . . . . . . . . . . . . . . . . . . . . . . . . . . . . . . . . . . . . . . . . . . . .Human Services Facilities Construction Fund 2 ------ ------. . . . . . . . . . . . . . . . . . . . . . . . . . . . . . . . . . . . .Jobs, Education and Competitiveness Fund 85 43 23. . . . . . . . . . . . . . . . . . . . . . . . . . . . . . . . . . . . . . .Judiciary Bail Fund 1,551 768 768. . . . . . . . . . . . . . . . . . . . . . . . . . . . . . . . . . . . . . . . . . . . . . . . . . . . . . . . . .Judiciary Child Support and Paternity Fund 328 265 265. . . . . . . . . . . . . . . . . . . . . . . . . . . . . . . . . . . . . . .Judiciary Probation Fund 399 216 216. . . . . . . . . . . . . . . . . . . . . . . . . . . . . . . . . . . . . . . . . . . . . . . . . . . . .Judiciary Special Civil Fund 130 65 65. . . . . . . . . . . . . . . . . . . . . . . . . . . . . . . . . . . . . . . . . . . . . . . . . . .Judiciary Superior Court Miscellaneous Fund 209 170 170. . . . . . . . . . . . . . . . . . . . . . . . . . . . . . . . . . . . .Legal Services Fund 11,204 11,000 11,000. . . . . . . . . . . . . . . . . . . . . . . . . . . . . . . . . . . . . . . . . . . . . . . . . . . . . . . . .Medical Malpractice Reinsurance Recovery Fund ------ ------ 1,800. . . . . . . . . . . . . . . . . . . . . . . . . . . . . . . . . .Mortgage Assistance Fund 840 725 496. . . . . . . . . . . . . . . . . . . . . . . . . . . . . . . . . . . . . . . . . . . . . . . . . . . .Motor Vehicle Security Responsibility Fund 10 13 3. . . . . . . . . . . . . . . . . . . . . . . . . . . . . . . . . . . . . .NJ Bridge Rehab. and Improvement and R.R. Right--of--Way Preservation Fund 266 185 185. . . . . . . . . .Natural Resources Fund 144 78 78. . . . . . . . . . . . . . . . . . . . . . . . . . . . . . . . . . . . . . . . . . . . . . . . . . . . . .New Home Warranty Security Fund ------ 10,000 10,000. . . . . . . . . . . . . . . . . . . . . . . . . . . . . . . . . . . . . . . . . . . . .New Jersey Green Acres Fund -- 1983 849 850 850. . . . . . . . . . . . . . . . . . . . . . . . . . . . . . . . . . . . . . . . . . .New Jersey Spill Compensation Fund 14,879 15,783 15,783. . . . . . . . . . . . . . . . . . . . . . . . . . . . . . . . . . . . . . . . . . .New Jersey Workforce Development Partnership Fund 13,540 32,654 17,654. . . . . . . . . . . . . . . . . . . . . . . . . . . . . .Pollution Prevention Fund 1,496 1,549 1,549. . . . . . . . . . . . . . . . . . . . . . . . . . . . . . . . . . . . . . . . . . . . . . . . . . . .Public Purpose Buildings Construction Fund 7 8 8. . . . . . . . . . . . . . . . . . . . . . . . . . . . . . . . . . . . . .Public Purpose Buildings and Community--Based Facilities Construction Fund 132 60 60. . . . . . . . . . .Safe Drinking Water Fund 2,215 2,433 2,433. . . . . . . . . . . . . . . . . . . . . . . . . . . . . . . . . . . . . . . . . . . . . . . . . . . .School Fund Investment Account 3,808 4,160 4,160. . . . . . . . . . . . . . . . . . . . . . . . . . . . . . . . . . . . . . . . . . . . . . .Shore Protection Fund 428 295 295. . . . . . . . . . . . . . . . . . . . . . . . . . . . . . . . . . . . . . . . . . . . . . . . . . . . . . .Solid Waste Service Tax Fund 8 8 8. . . . . . . . . . . . . . . . . . . . . . . . . . . . . . . . . . . . . . . . . . . . . . . . .State Disability Benefit Fund 102,867 79,768 79,524. . . . . . . . . . . . . . . . . . . . . . . . . . . . . . . . . . . . . . . . . . . . . . . . . .State Land Acquisition and Development Fund 19 ------ ------. . . . . . . . . . . . . . . . . . . . . . . . . . . . . . . . . . . .State Lottery Fund 882,058 888,000 928,800. . . . . . . . . . . . . . . . . . . . . . . . . . . . . . . . . . . . . . . . . . . . . . . . . . . . . . . . . .State Lottery Fund -- Administration 20,210 22,118 22,118. . . . . . . . . . . . . . . . . . . . . . . . . . . . . . . . . . . . . . . . . . . .State Recreation and Conservation Land Acquisition and Development Fund 19 20 20. . . . . . . . . . . .State Recycling Fund ------ 7,000 1,000. . . . . . . . . . . . . . . . . . . . . . . . . . . . . . . . . . . . . . . . . . . . . . . . . . . . . . . .State of New Jersey Cash Management Fund 2,798 2,798 2,798. . . . . . . . . . . . . . . . . . . . . . . . . . . . . . . . . . . . .Statewide Transportation and Local Bridge Fund 1,032 1,000 1,000. . . . . . . . . . . . . . . . . . . . . . . . . . . . . . . . . .Supplemental Workforce Fund for Basic Skills 1,998 2,000 2,000. . . . . . . . . . . . . . . . . . . . . . . . . . . . . . . . . . . .Tobacco Settlement Fund 117,548 68,440 63,845. . . . . . . . . . . . . . . . . . . . . . . . . . . . . . . . . . . . . . . . . . . . . . . . . . . . .Unclaimed County Deposits Trust Fund ------ 3,000 ------. . . . . . . . . . . . . . . . . . . . . . . . . . . . . . . . . . . . . . . . .Unclaimed Personal Property Trust Fund 244,900 106,500 101,000. . . . . . . . . . . . . . . . . . . . . . . . . . . . . . . . . . . . . . . . .Unclaimed Utility Deposits Trust Fund 144 150 150. . . . . . . . . . . . . . . . . . . . . . . . . . . . . . . . . . . . . . . . . .Unemployment Compensation Auxiliary Fund 26,559 29,357 28,057. . . . . . . . . . . . . . . . . . . . . . . . . . . . . . . . . . . .Universal Services Fund 73,137 72,616 72,646. . . . . . . . . . . . . . . . . . . . . . . . . . . . . . . . . . . . . . . . . . . . . . . . . . . . . .Wage and Hour Trust Fund 107 75 75. . . . . . . . . . . . . . . . . . . . . . . . . . . . . . . . . . . . . . . . . . . . . . . . . . . .Water Conservation Fund 31 31 31. . . . . . . . . . . . . . . . . . . . . . . . . . . . . . . . . . . . . . . . . . . . . . . . . . . . .Water Supply Fund 4,022 4,321 4,321. . . . . . . . . . . . . . . . . . . . . . . . . . . . . . . . . . . . . . . . . . . . . . . . . . . . . . . . . .Worker and Community Right to Know Fund 3,281 6,383 3,783. . . . . . . . . . . . . . . . . . . . . . . . . . . . . . . . . . . . .Workers’ Compensation Security Fund ------ ------ 20,000. . . . . . . . . . . . . . . . . . . . . . . . . . . . . . . . . . . . . . . . . .
Total Interfund Transfers 1,583,327 1,487,335 1,459,122. . . . . . . . . . . . . . . . . . . . . . . . . . . . . . . . . . . . . . . . . . . . . . . . . .
Total State Revenues General Fund 19,466,427 17,653,081 17,281,757. . . . . . . . . . . . . . . . . . . . . . . . . . . . . . . . . . . . . . . .
Appendix I 39

SCHEDULE 1STATE REVENUES
(thousands of dollars)----------------------Fiscal Year Ending June 30----------------------
2008 2009 2010Actual Estimated Estimated
PROPERTY TAX RELIEF FUND
Gross Income Tax 12,605,545 11,249,000 11,288,000. . . . . . . . . . . . . . . . . . . . . . . . . . . . . . . . . . . . . . . . . . . . . . . . . . . . . . . . . . .Sales Tax Dedication 665,992 636,000 649,000. . . . . . . . . . . . . . . . . . . . . . . . . . . . . . . . . . . . . . . . . . . . . . . . . . . . . . . .
Total Property Tax Relief Fund 13,271,537 11,885,000 11,937,000. . . . . . . . . . . . . . . . . . . . . . . . . . . . . . . . . . . . . . . . . . . . .
CASINO CONTROL FUND
Investment Earnings 462 300 300. . . . . . . . . . . . . . . . . . . . . . . . . . . . . . . . . . . . . . . . . . . . . . . . . . . . . . . . .License Fees 72,511 74,639 69,771. . . . . . . . . . . . . . . . . . . . . . . . . . . . . . . . . . . . . . . . . . . . . . . . . . . . . . . . . . . . . . .
Total Casino Control Fund 72,973 74,939 70,071. . . . . . . . . . . . . . . . . . . . . . . . . . . . . . . . . . . . . . . . . . . . . . . .
CASINO REVENUE FUND
Casino Simulcasting Fund 546 500 500. . . . . . . . . . . . . . . . . . . . . . . . . . . . . . . . . . . . . . . . . . . . . . . . . . . .Gross Revenue Tax 383,183 343,519 335,154. . . . . . . . . . . . . . . . . . . . . . . . . . . . . . . . . . . . . . . . . . . . . . . . . . . . . . . . . .Investment Earnings 1,345 ------ 200. . . . . . . . . . . . . . . . . . . . . . . . . . . . . . . . . . . . . . . . . . . . . . . . . . . . . . . . .Other Casino Taxes and Fees 27,911 22,302 15,915. . . . . . . . . . . . . . . . . . . . . . . . . . . . . . . . . . . . . . . . . . . . . . . . . .PAAD Recoveries 12,301 ------ ------. . . . . . . . . . . . . . . . . . . . . . . . . . . . . . . . . . . . . . . . . . . . . . . . . . . . . . . . . . .
Total Casino Revenue Fund 425,286 366,321 351,769. . . . . . . . . . . . . . . . . . . . . . . . . . . . . . . . . . . . . . . . . . . . . . . .
GUBERNATORIAL ELECTIONS FUND
Taxpayers’ Designations 520 700 700. . . . . . . . . . . . . . . . . . . . . . . . . . . . . . . . . . . . . . . . . . . . . . . . . . . . . .
TOTAL STATE REVENUES 33,236,743 29,980,041 29,641,297. . . . . . . . . . . . . . . . . . . . . . . . . . . . . . . . . . . . . . . . . . . . . .
Appendix I 40

SCHEDULE 2OTHER REVENUES
(thousands of dollars)----------------------Fiscal Year Ending June 30----------------------
2008 2009 2010Actual Estimated Estimated
Dedicated:
Executive Branch----Chief Executive:
State Authority Review and Oversight 409 900 750. . . . . . . . . . . . . . . . . . . . . . . . . . . . . . . . . . . . . . .
Department of Agriculture:Animal Disease Control ------ 227 227. . . . . . . . . . . . . . . . . . . . . . . . . . . . . . . . . . . . . . . . . . . . . . . . . .Commodity Distribution 1,645 1,501 1,501. . . . . . . . . . . . . . . . . . . . . . . . . . . . . . . . . . . . . . . . . . . . . . . . . .Dairy Fee Administration 665 660 660. . . . . . . . . . . . . . . . . . . . . . . . . . . . . . . . . . . . . . . . . . . . . . . . .Development Potential Transfer Bank Administration 53 125 125. . . . . . . . . . . . . . . . . . . . . . . . . . .Environmental Services ------ 140 140. . . . . . . . . . . . . . . . . . . . . . . . . . . . . . . . . . . . . . . . . . . . . . . . . . .Food Distribution Assessment 21 15 15. . . . . . . . . . . . . . . . . . . . . . . . . . . . . . . . . . . . . . . . . . . . . .Fruit and Vegetable Grading Service 508 500 500. . . . . . . . . . . . . . . . . . . . . . . . . . . . . . . . . . . . . . . . .Future Farmers of America -- Student Loans from Department of Education 80 75 74. . . . . . . . . .Garden State Preservation Trust ------ 1,029 1,029. . . . . . . . . . . . . . . . . . . . . . . . . . . . . . . . . . . . . . . . . . . .Horse Breeding and Development Fund 327 320 300. . . . . . . . . . . . . . . . . . . . . . . . . . . . . . . . . . . . . .Marketing and Development Services ------ 724 724. . . . . . . . . . . . . . . . . . . . . . . . . . . . . . . . . . . . . . . .Northeast Center for Risk Management Education -- University of Delaware 14 ------ ------. . . . . . . . .Nursery Inspection Program ------ 265 265. . . . . . . . . . . . . . . . . . . . . . . . . . . . . . . . . . . . . . . . . . . . . . .Organic Certification 235 225 225. . . . . . . . . . . . . . . . . . . . . . . . . . . . . . . . . . . . . . . . . . . . . . . . . . . . .Plant Pest and Disease Control ------ 13 13. . . . . . . . . . . . . . . . . . . . . . . . . . . . . . . . . . . . . . . . . . . . .Poultry Service 704 608 408. . . . . . . . . . . . . . . . . . . . . . . . . . . . . . . . . . . . . . . . . . . . . . . . . . . . . . . . .Sire Stakes 4,423 4,000 4,000. . . . . . . . . . . . . . . . . . . . . . . . . . . . . . . . . . . . . . . . . . . . . . . . . . . . . . . . . . . . .Standardbred Breeder Awards 173 170 170. . . . . . . . . . . . . . . . . . . . . . . . . . . . . . . . . . . . . . . . . . . . . .Stormwater Discharge Administration 193 187 244. . . . . . . . . . . . . . . . . . . . . . . . . . . . . . . . . . . . . . .Wine Promotion Program 136 90 90. . . . . . . . . . . . . . . . . . . . . . . . . . . . . . . . . . . . . . . . . . . . . . . . .Miscellaneous 290 247 250. . . . . . . . . . . . . . . . . . . . . . . . . . . . . . . . . . . . . . . . . . . . . . . . . . . . . . . . . .
Total Department of Agriculture 9,467 11,121 10,960
Department of Banking and Insurance:Bryce Curry Memorial Scholarship Fund 22 ------ ------. . . . . . . . . . . . . . . . . . . . . . . . . . . . . . . . . . . . .Health Insurance Security and Privacy Collaboration (HISPC) 153 ------ ------. . . . . . . . . . . . . . . . . . . .Individual Health Care Program Assessments 4,073 ------ ------. . . . . . . . . . . . . . . . . . . . . . . . . . . . . . . . .Public Adjusters Licensing ------ 52 52. . . . . . . . . . . . . . . . . . . . . . . . . . . . . . . . . . . . . . . . . . . . . . . .Small Employer Health Benefits 530 380 444. . . . . . . . . . . . . . . . . . . . . . . . . . . . . . . . . . . . . . . . . . . .Supervision and Examination of Financial Institutions ------ 400 ------. . . . . . . . . . . . . . . . . . . . . . . . . . .Miscellaneous 89 ------ ------. . . . . . . . . . . . . . . . . . . . . . . . . . . . . . . . . . . . . . . . . . . . . . . . . . . . . . . . . .
Total Department of Banking and Insurance 4,867 832 496
Department of Children and Families:Adopt U.S. Kids 23 ------ ------. . . . . . . . . . . . . . . . . . . . . . . . . . . . . . . . . . . . . . . . . . . . . . . . . . . . . . . .Children’s Trust Fund ------ 280 280. . . . . . . . . . . . . . . . . . . . . . . . . . . . . . . . . . . . . . . . . . . . . . . . . . . .Criminal History Record Checks 395 120 120. . . . . . . . . . . . . . . . . . . . . . . . . . . . . . . . . . . . . . . . . . . .Domestic Violence Fund 631 ------ ------. . . . . . . . . . . . . . . . . . . . . . . . . . . . . . . . . . . . . . . . . . . . . . . . . .Education Consolidation Improvement Act -- General and Administration 11 ------ ------. . . . . . . . . . .Education Services 56,384 53,878 49,704. . . . . . . . . . . . . . . . . . . . . . . . . . . . . . . . . . . . . . . . . . . . . . . . . . . . . .Legally Responsible Relatives -- Probation Supplement 4,540 2,054 2,054. . . . . . . . . . . . . . . . . . . . . . . . . .Old Age Survivors Insurance 2,696 1,492 1,492. . . . . . . . . . . . . . . . . . . . . . . . . . . . . . . . . . . . . . . . . . . . . .Treatment Homes -- Title IV--E 240 ------ ------. . . . . . . . . . . . . . . . . . . . . . . . . . . . . . . . . . . . . . . . . . . . .
Total Department of Children and Families 64,920 57,824 53,650
Department of Community Affairs:Boarding Home Regulation and Assistance ------ 975 975. . . . . . . . . . . . . . . . . . . . . . . . . . . . . . . . . . .Comfort Partners Program 2,564 4,800 4,800. . . . . . . . . . . . . . . . . . . . . . . . . . . . . . . . . . . . . . . . . . . . . . . . .Fire Certification Program 88 342 194. . . . . . . . . . . . . . . . . . . . . . . . . . . . . . . . . . . . . . . . . . . . . . . . .Grants to Displaced Homemaker Centers 722 688 688. . . . . . . . . . . . . . . . . . . . . . . . . . . . . . . . . . . . .Historic Preservation License 26 25 25. . . . . . . . . . . . . . . . . . . . . . . . . . . . . . . . . . . . . . . . . . . . . .Housing Code Enforcement ------ 770 2,400. . . . . . . . . . . . . . . . . . . . . . . . . . . . . . . . . . . . . . . . . . . . . . .Housing Opportunities for Persons with AIDS 627 1,318 1,452. . . . . . . . . . . . . . . . . . . . . . . . . . . . . . . . .Housing Services 56,189 31,225 26,000. . . . . . . . . . . . . . . . . . . . . . . . . . . . . . . . . . . . . . . . . . . . . . . . . . . . . . . .Lead Hazard Control Assistance Fund 812 1,012 1,018. . . . . . . . . . . . . . . . . . . . . . . . . . . . . . . . . . . . . . .Neighborhood Revitalization Tax Credit 7,181 7,500 7,500. . . . . . . . . . . . . . . . . . . . . . . . . . . . . . . . . . . . . .New Home Warranty Program 4,821 5,408 5,310. . . . . . . . . . . . . . . . . . . . . . . . . . . . . . . . . . . . . . . . . . . . .New Jersey Meadowlands Commission -- Operations ------ 125 125. . . . . . . . . . . . . . . . . . . . . . . . . . . .Paterson Housing Opportunities for Persons with AIDS Program 899 987 1,079. . . . . . . . . . . . . . . . . .Prevention of Homelessness 165 243 243. . . . . . . . . . . . . . . . . . . . . . . . . . . . . . . . . . . . . . . . . . . . . . .Reduced Cigarette Ignition Propensity & Firefighter Protection Fund 169 60 60. . . . . . . . . . . . . . .Subcontract with the City of Camden -- Section 8 563 637 701. . . . . . . . . . . . . . . . . . . . . . . . . . . . . . .Truth in Renting ------ 100 100. . . . . . . . . . . . . . . . . . . . . . . . . . . . . . . . . . . . . . . . . . . . . . . . . . . . . . . .
Appendix I 41

SCHEDULE 2OTHER REVENUES
(thousands of dollars)----------------------Fiscal Year Ending June 30----------------------
2008 2009 2010Actual Estimated Estimated
Uniform Construction Code ------ 6,700 11,100. . . . . . . . . . . . . . . . . . . . . . . . . . . . . . . . . . . . . . . . . . . . . . .Uniform Fire Code ------ 9,500 9,785. . . . . . . . . . . . . . . . . . . . . . . . . . . . . . . . . . . . . . . . . . . . . . . . . . . . . .Universal Service Fund 3,892 4,600 5,060. . . . . . . . . . . . . . . . . . . . . . . . . . . . . . . . . . . . . . . . . . . . . . . . . . .Urban Enterprise Zone Authority Administration ------ 2,685 2,685. . . . . . . . . . . . . . . . . . . . . . . . . . . . . . .Miscellaneous 1,562 1,400 1,400. . . . . . . . . . . . . . . . . . . . . . . . . . . . . . . . . . . . . . . . . . . . . . . . . . . . . . . . . .
Total Department of Community Affairs 80,280 81,100 82,700
Department of Corrections:Administration and Support Services 28,880 24,586 23,870. . . . . . . . . . . . . . . . . . . . . . . . . . . . . . . . . . . . . . . .Auto Theft Penalty Collections 7 ------ ------. . . . . . . . . . . . . . . . . . . . . . . . . . . . . . . . . . . . . . . . . . . . .Nicholson -- Female Integration and Reentry Management (FIRM) 24 ------ 76. . . . . . . . . . . . . . . . .Nicholson Foundation -- Distance Learning Pilot Program 5 ------ ------. . . . . . . . . . . . . . . . . . . . . . . .Nicholson Foundation -- Reentry Grant 86 122 135. . . . . . . . . . . . . . . . . . . . . . . . . . . . . . . . . . . . . . .Nicholson Foundation -- Reentry Initiative Expansion 26 71 71. . . . . . . . . . . . . . . . . . . . . . . . . . .Nicholson Foundation Grant -- Reentry and Access to Programs 5 235 235. . . . . . . . . . . . . . . . . . .Nicholson Foundation Reentry Initiative and Research Study 119 ------ ------. . . . . . . . . . . . . . . . . . . . .Workplace Literacy -- Learning Lab Program 543 ------ ------. . . . . . . . . . . . . . . . . . . . . . . . . . . . . . . . . .Miscellaneous 291 ------ ------. . . . . . . . . . . . . . . . . . . . . . . . . . . . . . . . . . . . . . . . . . . . . . . . . . . . . . . . . .
Total Department of Corrections 29,986 25,014 24,387
Department of Education:Compliance and Auditing 901 850 850. . . . . . . . . . . . . . . . . . . . . . . . . . . . . . . . . . . . . . . . . . . . . . . . .Comprehensive Eye Exam Fund 10 ------ ------. . . . . . . . . . . . . . . . . . . . . . . . . . . . . . . . . . . . . . . . . . . .Katzenbach One on One Aides 555 604 576. . . . . . . . . . . . . . . . . . . . . . . . . . . . . . . . . . . . . . . . . . . . .Katzenbach PLUS Program 766 1,097 784. . . . . . . . . . . . . . . . . . . . . . . . . . . . . . . . . . . . . . . . . . . . . . . .Katzenbach Partnership Programs 128 ------ ------. . . . . . . . . . . . . . . . . . . . . . . . . . . . . . . . . . . . . . . . . . .Katzenbach Summer Program 249 320 400. . . . . . . . . . . . . . . . . . . . . . . . . . . . . . . . . . . . . . . . . . . . . .Marie H. Katzenbach School for the Deaf -- Tuition from Local Boards 9,357 10,679 10,652. . . . . . . . . . . . .NJSIAA Steriod Testing ------ 50 50. . . . . . . . . . . . . . . . . . . . . . . . . . . . . . . . . . . . . . . . . . . . . . . . . .Professional Development and Licensure ------ 1,491 1,389. . . . . . . . . . . . . . . . . . . . . . . . . . . . . . . . . . . . .Rental of Vacant Building Space 428 262 334. . . . . . . . . . . . . . . . . . . . . . . . . . . . . . . . . . . . . . . . . . . .School District Deficit Relief 1,000 5,686 1,075. . . . . . . . . . . . . . . . . . . . . . . . . . . . . . . . . . . . . . . . . . . . . .State Action for Education Leadership Project 75 ------ ------. . . . . . . . . . . . . . . . . . . . . . . . . . . . . . . . .Miscellaneous 118 41 41. . . . . . . . . . . . . . . . . . . . . . . . . . . . . . . . . . . . . . . . . . . . . . . . . . . . . . . . . .
Total Department of Education 13,587 21,080 16,151
Department of Environmental Protection:Administrative Costs -- Natural Resources Damages 1,076 1,819 1,337. . . . . . . . . . . . . . . . . . . . . . . . . . . .Administrative Costs Water Supply Bond Act of 1981 -- Management ------ 84 102. . . . . . . . . . . . . .Administrative Costs Water Supply Bond Act of 1981 -- Planning and Standards ------ 9 10. . . . . .Administrative Costs Water Supply Bond Act of 1981 -- Watershed and Aquifer ------ 56 54. . . . . .Air Pollution Monitoring and Control Programs ------ ------ 410. . . . . . . . . . . . . . . . . . . . . . . . . . . . . . . .B.L. England Environmental Project Donation 1,500 ------ ------. . . . . . . . . . . . . . . . . . . . . . . . . . . . . . . . .Battleship New Jersey Memorial Fund 180 170 168. . . . . . . . . . . . . . . . . . . . . . . . . . . . . . . . . . . . . . .Battleship New Jersey Tax Check--Off 67 65 64. . . . . . . . . . . . . . . . . . . . . . . . . . . . . . . . . . . . . . .Delaware Bay Oyster Revitalization Project 112 112 110. . . . . . . . . . . . . . . . . . . . . . . . . . . . . . . . . . .Delaware Estuary Ecological Systems Mapping 9 ------ ------. . . . . . . . . . . . . . . . . . . . . . . . . . . . . . . .Drinking Water State Revolving Fund -- Capacity Development 491 450 450. . . . . . . . . . . . . . . . . . .Drinking Water State Revolving Fund -- Operator Certification 356 400 400. . . . . . . . . . . . . . . . . . . .Drinking Water State Revolving Fund -- Program Administration 708 800 800. . . . . . . . . . . . . . . . . .Drinking Water State Revolving Fund -- Small System Technical Assistance 361 400 400. . . . . . . . .Drinking Water State Revolving Fund -- Source Water Program Administration 331 150 150. . . . . . .Endangered and Nongame Species Wildlife Fund 178 125 150. . . . . . . . . . . . . . . . . . . . . . . . . . . . . .Environmental Infrastructure Trust Loan Fund ------ 1,592 1,729. . . . . . . . . . . . . . . . . . . . . . . . . . . . . . . . .Environmental Inspection of Child Care Facilities 629 770 860. . . . . . . . . . . . . . . . . . . . . . . . . . . . . .Exotic and Nongame Species Inspection Fund 166 163 160. . . . . . . . . . . . . . . . . . . . . . . . . . . . . . . . .Expenses of the Delaware and Raritan Canal Commission ------ ------ 480. . . . . . . . . . . . . . . . . . . . . . . .Farley Marina Escrow 2,200 1,200 1,200. . . . . . . . . . . . . . . . . . . . . . . . . . . . . . . . . . . . . . . . . . . . . . . . . . . .Forest Resource Management Special Revenue 288 250 250. . . . . . . . . . . . . . . . . . . . . . . . . . . . . . . .Global Warming Solutions Fund -- Administration ------ 1,839 2,786. . . . . . . . . . . . . . . . . . . . . . . . . . . . . .Green Acres / Open Space Administration ------ 419 431. . . . . . . . . . . . . . . . . . . . . . . . . . . . . . . . . . . .HR--6 Flood Control 670 600 600. . . . . . . . . . . . . . . . . . . . . . . . . . . . . . . . . . . . . . . . . . . . . . . . . . . . .Hazardous Discharge Site Cleanup Fund -- Responsible Party ------ 10,970 10,437. . . . . . . . . . . . . . . . . . . . .Hazardous Discharge Site Remediation Fund -- Grants to Child Care Centers 394 370 370. . . . . . . . .Historic Preservation Fund 100 50 50. . . . . . . . . . . . . . . . . . . . . . . . . . . . . . . . . . . . . . . . . . . . . . . .Hunters’ and Anglers’ License Fund ------ 2,000 2,000. . . . . . . . . . . . . . . . . . . . . . . . . . . . . . . . . . . . . . . . .Landscape Irrigation Contractor Certification 60 148 62. . . . . . . . . . . . . . . . . . . . . . . . . . . . . . . . . .Liberty State Park -- Central Parking 212 250 250. . . . . . . . . . . . . . . . . . . . . . . . . . . . . . . . . . . . . . . . .Liberty State Park License Plates 57 50 50. . . . . . . . . . . . . . . . . . . . . . . . . . . . . . . . . . . . . . . . . . .Low Emission Vehicle Program 151 120 120. . . . . . . . . . . . . . . . . . . . . . . . . . . . . . . . . . . . . . . . . . . .
Appendix I 42

SCHEDULE 2OTHER REVENUES
(thousands of dollars)----------------------Fiscal Year Ending June 30----------------------
2008 2009 2010Actual Estimated Estimated
Mammography Quality Standards Act 191 321 306. . . . . . . . . . . . . . . . . . . . . . . . . . . . . . . . . . . . . . .Marina Rentals ------ 415 440. . . . . . . . . . . . . . . . . . . . . . . . . . . . . . . . . . . . . . . . . . . . . . . . . . . . . . . . .New Jersey Shade Tree and Community Forestry Program 77 80 80. . . . . . . . . . . . . . . . . . . . . . .New Jersey Waterfowl Stamp Act 100 100 100. . . . . . . . . . . . . . . . . . . . . . . . . . . . . . . . . . . . . . . . . . .Northern Pine Snake Mgmt -- Stafford Business Park ------ ------ 5. . . . . . . . . . . . . . . . . . . . . . . . . . . .Nuclear Emergency Response ------ ------ 685. . . . . . . . . . . . . . . . . . . . . . . . . . . . . . . . . . . . . . . . . . . . . .Nuclear Regulatory Commission -- Agreement State Program ------ ------ 2,500. . . . . . . . . . . . . . . . . . . . .Ocean/Wind Power Ecological Baseline Study 2,000 ------ ------. . . . . . . . . . . . . . . . . . . . . . . . . . . . . . . . .Office of Dredging and Sediment Technology ------ 241 280. . . . . . . . . . . . . . . . . . . . . . . . . . . . . . . . .Ohio Edison Settlement for Environmentally Beneficial Projects 520 520 670. . . . . . . . . . . . . . . . . .Oil Spill Prevention ------ 1,147 1,302. . . . . . . . . . . . . . . . . . . . . . . . . . . . . . . . . . . . . . . . . . . . . . . . . . . . . .Oyster Cultch Fund 152 120 130. . . . . . . . . . . . . . . . . . . . . . . . . . . . . . . . . . . . . . . . . . . . . . . . . . . . . .PSE&G/D&R Canal Pole Line 275 ------ ------. . . . . . . . . . . . . . . . . . . . . . . . . . . . . . . . . . . . . . . . . . . . .Palisades Interstate Park Commission (PIPC) -- Court Fund Revenue ------ 1,506 1,502. . . . . . . . . . . . . . .Palisades Interstate Park Commission (PIPC) -- Gas Station Revenue ------ 2,613 2,603. . . . . . . . . . . . . . .Palisades Interstate Park Commission (PIPC) -- Operating Fund Revenue ------ 745 750. . . . . . . . . . . .Parks Management ------ 1,400 2,740. . . . . . . . . . . . . . . . . . . . . . . . . . . . . . . . . . . . . . . . . . . . . . . . . . . . . .Parks Management Revolving Fund 1,093 1,275 1,275. . . . . . . . . . . . . . . . . . . . . . . . . . . . . . . . . . . . . . . . .Pesticide Control ------ 600 600. . . . . . . . . . . . . . . . . . . . . . . . . . . . . . . . . . . . . . . . . . . . . . . . . . . . . . . .Pinelands Preservation 63 56 60. . . . . . . . . . . . . . . . . . . . . . . . . . . . . . . . . . . . . . . . . . . . . . . . . . .Pollution Prevention ------ 630 645. . . . . . . . . . . . . . . . . . . . . . . . . . . . . . . . . . . . . . . . . . . . . . . . . . . . .Private Dredging Disposal ------ 50 50. . . . . . . . . . . . . . . . . . . . . . . . . . . . . . . . . . . . . . . . . . . . . . . . .Private Underground Tank Administrative Costs -- Constitutional Dedication ------ 1,000 1,000. . . . . . . . .Recycling of Solid Waste ------ 358 892. . . . . . . . . . . . . . . . . . . . . . . . . . . . . . . . . . . . . . . . . . . . . . . . .Remediation Management and Response ------ 6,161 6,722. . . . . . . . . . . . . . . . . . . . . . . . . . . . . . . . . . . . .Safe Drinking Water Fund ------ 1,279 1,272. . . . . . . . . . . . . . . . . . . . . . . . . . . . . . . . . . . . . . . . . . . . . . . . .Sedge Island 48 30 35. . . . . . . . . . . . . . . . . . . . . . . . . . . . . . . . . . . . . . . . . . . . . . . . . . . . . . . . . . .Shellfish Enforcement 119 120 120. . . . . . . . . . . . . . . . . . . . . . . . . . . . . . . . . . . . . . . . . . . . . . . . . . . .Shellfish Enhancement and Management 110 110 110. . . . . . . . . . . . . . . . . . . . . . . . . . . . . . . . . . . . .Shellfish Management 27 40 40. . . . . . . . . . . . . . . . . . . . . . . . . . . . . . . . . . . . . . . . . . . . . . . . . . . .Shore Protection Fund Projects 3,620 3,300 4,000. . . . . . . . . . . . . . . . . . . . . . . . . . . . . . . . . . . . . . . . . . . . .Shore Protection License Plates 893 900 1,000. . . . . . . . . . . . . . . . . . . . . . . . . . . . . . . . . . . . . . . . . . . .Skylands Manor 262 270 270. . . . . . . . . . . . . . . . . . . . . . . . . . . . . . . . . . . . . . . . . . . . . . . . . . . . . . . . .Solid Waste Utility Regulation ------ 1,300 1,300. . . . . . . . . . . . . . . . . . . . . . . . . . . . . . . . . . . . . . . . . . . . .Spring Meadow Golf Course 971 960 1,050. . . . . . . . . . . . . . . . . . . . . . . . . . . . . . . . . . . . . . . . . . . . . . .State Public Water System Supervision Program 1,036 1,000 1,000. . . . . . . . . . . . . . . . . . . . . . . . . . . . . . .State Revolving Fund -- Administrative Costs 1,343 1,112 1,200. . . . . . . . . . . . . . . . . . . . . . . . . . . . . . . . .Statewide Development 52 60 60. . . . . . . . . . . . . . . . . . . . . . . . . . . . . . . . . . . . . . . . . . . . . . . . . . .Tidelands Peak Demands ------ 3,626 3,622. . . . . . . . . . . . . . . . . . . . . . . . . . . . . . . . . . . . . . . . . . . . . . . . . .UMDNJ Radiation Preparedness 60 60 41. . . . . . . . . . . . . . . . . . . . . . . . . . . . . . . . . . . . . . . . . . . .Urban Forest Energy Efficiency Initiative 669 4,000 4,000. . . . . . . . . . . . . . . . . . . . . . . . . . . . . . . . . . . . .Water Allocation ------ 2,975 3,181. . . . . . . . . . . . . . . . . . . . . . . . . . . . . . . . . . . . . . . . . . . . . . . . . . . . . . . .Water Pollution Control ------ 4,900 4,900. . . . . . . . . . . . . . . . . . . . . . . . . . . . . . . . . . . . . . . . . . . . . . . . . . .Water/Wastewater Operators Licenses ------ 35 257. . . . . . . . . . . . . . . . . . . . . . . . . . . . . . . . . . . . . . .Waterfront Development Shellfish Mitigation 190 ------ ------. . . . . . . . . . . . . . . . . . . . . . . . . . . . . . . . .Well Permits, Well Driller, Pump Installer Licenses ------ 1,000 1,000. . . . . . . . . . . . . . . . . . . . . . . . . . . . .Wetlands ------ 10 10. . . . . . . . . . . . . . . . . . . . . . . . . . . . . . . . . . . . . . . . . . . . . . . . . . . . . . . . . . . . . .Worker and Community Right to Know Act ------ 548 551. . . . . . . . . . . . . . . . . . . . . . . . . . . . . . . . . . .Miscellaneous 440 333 418. . . . . . . . . . . . . . . . . . . . . . . . . . . . . . . . . . . . . . . . . . . . . . . . . . . . . . . . . .
Total Department of Environmental Protection 24,607 72,737 81,214
Department of Health and Senior Services:AIDS Drug Distribution Program Copays ------ ------ 1,356. . . . . . . . . . . . . . . . . . . . . . . . . . . . . . . . . . . . .AIDS Drug Distribution Program Rebates 25,000 25,000 25,000. . . . . . . . . . . . . . . . . . . . . . . . . . . . . . . . . . . .Administrative Overhead -- Non State Program 1,497 1,400 1,500. . . . . . . . . . . . . . . . . . . . . . . . . . . . . . . .Animal Population Control Program 262 270 270. . . . . . . . . . . . . . . . . . . . . . . . . . . . . . . . . . . . . . . . .Brain Injury Research Fund 4,643 3,600 3,600. . . . . . . . . . . . . . . . . . . . . . . . . . . . . . . . . . . . . . . . . . . . . . .Breast Cancer Screening 73 ------ ------. . . . . . . . . . . . . . . . . . . . . . . . . . . . . . . . . . . . . . . . . . . . . . . . . .Certificate of Need Program 1,145 667 667. . . . . . . . . . . . . . . . . . . . . . . . . . . . . . . . . . . . . . . . . . . . . . .Child Care / School Certification Program ------ 1,500 1,500. . . . . . . . . . . . . . . . . . . . . . . . . . . . . . . . . . . .Clinical Laboratory Improvement Services 169 150 150. . . . . . . . . . . . . . . . . . . . . . . . . . . . . . . . . . . .Consumer Health Penalties ------ 5,175 5,175. . . . . . . . . . . . . . . . . . . . . . . . . . . . . . . . . . . . . . . . . . . . . . . .Early Intervention Program (EIP) Copays ------ 7,000 7,000. . . . . . . . . . . . . . . . . . . . . . . . . . . . . . . . . . . . .Electronic Death Registration Support Fund 360 600 600. . . . . . . . . . . . . . . . . . . . . . . . . . . . . . . . . . .Emergency Medical Services 48 79 79. . . . . . . . . . . . . . . . . . . . . . . . . . . . . . . . . . . . . . . . . . . . . .Emergency Medical Services for Children 150 154 154. . . . . . . . . . . . . . . . . . . . . . . . . . . . . . . . . . . .Emergency Medical Technician Training Fund 108 1,800 200. . . . . . . . . . . . . . . . . . . . . . . . . . . . . . . . .First Response Emergency Medical Technician Cardiac Training Program 65 125 125. . . . . . . . . . .Gerber Infant Cereal and Infant Juice Rebates 890 ------ ------. . . . . . . . . . . . . . . . . . . . . . . . . . . . . . . . .Governor’s Council for Medical Research and Treatment of Autism 14,792 4,000 4,000. . . . . . . . . . . . . . . .
Appendix I 43

SCHEDULE 2OTHER REVENUES
(thousands of dollars)----------------------Fiscal Year Ending June 30----------------------
2008 2009 2010Actual Estimated Estimated
Health Care Cost Reduction Fund 32,342 40,000 40,000. . . . . . . . . . . . . . . . . . . . . . . . . . . . . . . . . . . . . . . . . . .Health Care Planning 8,442 7,200 7,200. . . . . . . . . . . . . . . . . . . . . . . . . . . . . . . . . . . . . . . . . . . . . . . . . . . . .Laboratory Services ------ 650 650. . . . . . . . . . . . . . . . . . . . . . . . . . . . . . . . . . . . . . . . . . . . . . . . . . . . . .Licenses, Fines, Permits, Penalties and Fees ------ 6,485 6,485. . . . . . . . . . . . . . . . . . . . . . . . . . . . . . . . . . .Live Long Live Well ------ 150 150. . . . . . . . . . . . . . . . . . . . . . . . . . . . . . . . . . . . . . . . . . . . . . . . . . . . .Managed Care Oversight 100 ------ ------. . . . . . . . . . . . . . . . . . . . . . . . . . . . . . . . . . . . . . . . . . . . . . . . . .New Jersey Emergency Medical Services Helicopter Response Program ------ 2,884 3,100. . . . . . . . . . . .New Jersey Health Information Technology Commission ------ 1,000 1,000. . . . . . . . . . . . . . . . . . . . . . . .New Jersey Turnpike Authority / Garden State Parkway Food Inspections 247 273 273. . . . . . . . . . .Newborn Screening, Follow--up, and Treatment 3,492 3,306 3,306. . . . . . . . . . . . . . . . . . . . . . . . . . . . . . . .Nursing Home Provider Assessment Fee 135,065 136,000 136,000. . . . . . . . . . . . . . . . . . . . . . . . . . . . . . . . . . . . .Office of the Public Guardian 584 1,106 1,344. . . . . . . . . . . . . . . . . . . . . . . . . . . . . . . . . . . . . . . . . . . . . .Osteosarcoma Surveillance Study 7 25 25. . . . . . . . . . . . . . . . . . . . . . . . . . . . . . . . . . . . . . . . . . .Ovarian Cancer Study 29 ------ ------. . . . . . . . . . . . . . . . . . . . . . . . . . . . . . . . . . . . . . . . . . . . . . . . . . . .Rabies Control Program 486 475 475. . . . . . . . . . . . . . . . . . . . . . . . . . . . . . . . . . . . . . . . . . . . . . . . . .Race and Risk Factors for Early / Aggressive Breast Cancer 50 100 100. . . . . . . . . . . . . . . . . . . . . .Wholesale Drug Program ------ 2,166 2,166. . . . . . . . . . . . . . . . . . . . . . . . . . . . . . . . . . . . . . . . . . . . . . . . .Women, Infants, and Children (WIC) Rebates 38,579 40,000 40,000. . . . . . . . . . . . . . . . . . . . . . . . . . . . . . . . .Worker and Community Right to Know ------ 764 614. . . . . . . . . . . . . . . . . . . . . . . . . . . . . . . . . . . . . .Miscellaneous 4,302 6,131 6,137. . . . . . . . . . . . . . . . . . . . . . . . . . . . . . . . . . . . . . . . . . . . . . . . . . . . . . . . . .
Total Department of Health and Senior Services 272,927 300,235 300,401
Department of Human Services:Administration and Support Services ------ 772 772. . . . . . . . . . . . . . . . . . . . . . . . . . . . . . . . . . . . . . . .Alcohol Education Rehabilitation and Enforcement Fund 1,489 2,344 3,844. . . . . . . . . . . . . . . . . . . . . . . .Alcohol Treatment Fund Program 7,500 7,500 7,500. . . . . . . . . . . . . . . . . . . . . . . . . . . . . . . . . . . . . . . . . . .Catastrophic Illness in Children Relief Fund 7,909 1,256 1,290. . . . . . . . . . . . . . . . . . . . . . . . . . . . . . . . . .Child Support Incentive Funding 12,389 24,516 5,746. . . . . . . . . . . . . . . . . . . . . . . . . . . . . . . . . . . . . . . . . . .Children’s Trust Fund ------ 519 ------. . . . . . . . . . . . . . . . . . . . . . . . . . . . . . . . . . . . . . . . . . . . . . . . . . . .Client Copayments -- Developmental Disabilities 47,631 45,530 45,530. . . . . . . . . . . . . . . . . . . . . . . . . . . . . . .Drug Enforcement Demand Reduction Fund ------ 350 350. . . . . . . . . . . . . . . . . . . . . . . . . . . . . . . . . .Family Care -- Children 62,663 ------ ------. . . . . . . . . . . . . . . . . . . . . . . . . . . . . . . . . . . . . . . . . . . . . . . . . . .Governor’s Council on Alcoholism and Drug Abuse 18,085 17,500 17,400. . . . . . . . . . . . . . . . . . . . . . . . . . . .Improvement Methods for Skilled Nursing Care 50 ------ ------. . . . . . . . . . . . . . . . . . . . . . . . . . . . . . .Licensing Fees 264 ------ ------. . . . . . . . . . . . . . . . . . . . . . . . . . . . . . . . . . . . . . . . . . . . . . . . . . . . . . . . . .Management and Administrative Services ------ 725 725. . . . . . . . . . . . . . . . . . . . . . . . . . . . . . . . . . . .Mental Health Contract Fees 274 324 324. . . . . . . . . . . . . . . . . . . . . . . . . . . . . . . . . . . . . . . . . . . . . . .New Jersey Health Care Hospital Payments 654,764 548,888 545,233. . . . . . . . . . . . . . . . . . . . . . . . . . . . . . . . . . .New Jersey Ramps Project 33 ------ ------. . . . . . . . . . . . . . . . . . . . . . . . . . . . . . . . . . . . . . . . . . . . . . . .Olmstead Residential Services ------ 449 449. . . . . . . . . . . . . . . . . . . . . . . . . . . . . . . . . . . . . . . . . . . . .Partnership for a Drug Free New Jersey ------ 1,000 1,000. . . . . . . . . . . . . . . . . . . . . . . . . . . . . . . . . . . . . .Penalties Collected from Violators of Danielle’s Law 5 ------ ------. . . . . . . . . . . . . . . . . . . . . . . . . . . .Personal Needs Allowance ------ 600 600. . . . . . . . . . . . . . . . . . . . . . . . . . . . . . . . . . . . . . . . . . . . . . . .Racing Commission Funds for Compulsive Gambling Treatment 200 200 200. . . . . . . . . . . . . . . . . .SSA Reimbursement to Enhance Vocational Rehabilitation 757 500 500. . . . . . . . . . . . . . . . . . . . . . .Traumatic Brain Injury 3,871 ------ ------. . . . . . . . . . . . . . . . . . . . . . . . . . . . . . . . . . . . . . . . . . . . . . . . . . .Work First New Jersey Support Services 19,999 20,000 20,000. . . . . . . . . . . . . . . . . . . . . . . . . . . . . . . . . . . . .Miscellaneous 58 ------ ------. . . . . . . . . . . . . . . . . . . . . . . . . . . . . . . . . . . . . . . . . . . . . . . . . . . . . . . . . .
Total Department of Human Services 837,941 672,973 651,463
Department of Labor and Workforce Development:Adult Literacy Administration 1,998 ------ ------. . . . . . . . . . . . . . . . . . . . . . . . . . . . . . . . . . . . . . . . . . . . .Asbestos Notification Fees ------ 500 500. . . . . . . . . . . . . . . . . . . . . . . . . . . . . . . . . . . . . . . . . . . . . . . .Council on Gender Parity ------ 72 72. . . . . . . . . . . . . . . . . . . . . . . . . . . . . . . . . . . . . . . . . . . . . . . . .Division of Workers Compensation Uninsured Employers 1,911 2,616 2,690. . . . . . . . . . . . . . . . . . . . . . . .Enforcement of Workplace Standards -- Receipts ------ 5,757 6,293. . . . . . . . . . . . . . . . . . . . . . . . . . . . . . .General Administration and State and Local Government Operations ------ 1,300 1,300. . . . . . . . . . . . . . .New Jersey Builders’ Utilization for Labor Diversity ------ ------ 500. . . . . . . . . . . . . . . . . . . . . . . . . . . .Private Disability Insurance Plan ------ 1,280 1,524. . . . . . . . . . . . . . . . . . . . . . . . . . . . . . . . . . . . . . . . . . .Public Works Contractor Registration ------ 1,932 1,932. . . . . . . . . . . . . . . . . . . . . . . . . . . . . . . . . . . . . . . .Reengineering Study -- State Disability Insurance Plan ------ 1,000 1,000. . . . . . . . . . . . . . . . . . . . . . . . . .Reimbursement to Unemployment Insurance for Joint Tax Functions ------ 4,900 9,900. . . . . . . . . . . . . . .Special Compensation Fund 149,726 145,530 145,530. . . . . . . . . . . . . . . . . . . . . . . . . . . . . . . . . . . . . . . . . . . . . . .State Disability Insurance Plan ------ 4,100 6,942. . . . . . . . . . . . . . . . . . . . . . . . . . . . . . . . . . . . . . . . . . . . .Unemployment Insurance Program -- Collection Activities ------ 4,000 2,500. . . . . . . . . . . . . . . . . . . . . . .Urban Enterprise Zones -- Employer Rebate Awards 89 ------ ------. . . . . . . . . . . . . . . . . . . . . . . . . . . .Work First New Jersey Work Activities ------ 25,500 25,500. . . . . . . . . . . . . . . . . . . . . . . . . . . . . . . . . . . . . .Workers’ Compensation ------ 8,017 8,386. . . . . . . . . . . . . . . . . . . . . . . . . . . . . . . . . . . . . . . . . . . . . . . . . .Workforce Development Partnership -- Counselors ------ 412 412. . . . . . . . . . . . . . . . . . . . . . . . . . . . .Workforce Development Partnership Program ------ 1,742 1,742. . . . . . . . . . . . . . . . . . . . . . . . . . . . . . . . .
Appendix I 44

SCHEDULE 2OTHER REVENUES
(thousands of dollars)----------------------Fiscal Year Ending June 30----------------------
2008 2009 2010Actual Estimated Estimated
Workforce Literacy and Basic Skills Program ------ 276 276. . . . . . . . . . . . . . . . . . . . . . . . . . . . . . . . .Miscellaneous 699 ------ ------. . . . . . . . . . . . . . . . . . . . . . . . . . . . . . . . . . . . . . . . . . . . . . . . . . . . . . . . . .
Total Department of Labor and Workforce Development 154,423 208,934 216,999
Department of Law and Public Safety:Atlantic County Detention Center 2,189 2,399 2,377. . . . . . . . . . . . . . . . . . . . . . . . . . . . . . . . . . . . . . . . . . .Backstretch Benevolence 193 200 200. . . . . . . . . . . . . . . . . . . . . . . . . . . . . . . . . . . . . . . . . . . . . . . . .Body Armor Replacement Fund -- Administrative Costs 47 75 75. . . . . . . . . . . . . . . . . . . . . . . . .Charity Racing Day for the Developmentally Disabled 133 133 133. . . . . . . . . . . . . . . . . . . . . . . . . .Claims -- Victims of Crime ------ 9,281 9,281. . . . . . . . . . . . . . . . . . . . . . . . . . . . . . . . . . . . . . . . . . . . . . . .Commercial Vehicle Enforcement Program ------ 9,096 9,096. . . . . . . . . . . . . . . . . . . . . . . . . . . . . . . . . . .Commissions Award Program 2,314 2,500 2,500. . . . . . . . . . . . . . . . . . . . . . . . . . . . . . . . . . . . . . . . . . . . . .Consumer Affairs 317 350 330. . . . . . . . . . . . . . . . . . . . . . . . . . . . . . . . . . . . . . . . . . . . . . . . . . . . . . .Consumer Affairs Charitable Registrations Program ------ 1,065 1,065. . . . . . . . . . . . . . . . . . . . . . . . . . . .Consumer Affairs Legalized Games of Chance ------ 600 600. . . . . . . . . . . . . . . . . . . . . . . . . . . . . . . .Consumer Affairs Weights and Measures Program ------ 1,885 1,885. . . . . . . . . . . . . . . . . . . . . . . . . . . . . .Controlled Dangerous Substance Registration Program ------ 730 730. . . . . . . . . . . . . . . . . . . . . . . . . .Criminal Disposition and Revenue Collection Fund ------ 658 658. . . . . . . . . . . . . . . . . . . . . . . . . . . . .Criminal Justice Cost Recovery ------ 106 106. . . . . . . . . . . . . . . . . . . . . . . . . . . . . . . . . . . . . . . . . . . .Delaware River Joint Toll Bridge Commission 2,105 ------ ------. . . . . . . . . . . . . . . . . . . . . . . . . . . . . . . . .Department of Transportation -- State Police Construction Detail ------ 11,648 11,648. . . . . . . . . . . . . . . . . .Division of Consumer Affairs -- Appropriated Receipts ------ 8,820 6,305. . . . . . . . . . . . . . . . . . . . . . . . . .Drunk Driving Enforcement Fund -- MVC Reimbursement 96 150 150. . . . . . . . . . . . . . . . . . . . . . .Election Law Enforcement 13 140 140. . . . . . . . . . . . . . . . . . . . . . . . . . . . . . . . . . . . . . . . . . . . . . . .FBI Mitochondrial DNA Testing 1,107 923 923. . . . . . . . . . . . . . . . . . . . . . . . . . . . . . . . . . . . . . . . . . . .Fines Account -- Miscellaneous Settlements 725 100 100. . . . . . . . . . . . . . . . . . . . . . . . . . . . . . . . . . .Forfeiture Program 3,698 2,530 2,530. . . . . . . . . . . . . . . . . . . . . . . . . . . . . . . . . . . . . . . . . . . . . . . . . . . . . .Insurance Fraud Operations 27,981 29,771 29,771. . . . . . . . . . . . . . . . . . . . . . . . . . . . . . . . . . . . . . . . . . . . . . . .Investigative Unit 382 487 487. . . . . . . . . . . . . . . . . . . . . . . . . . . . . . . . . . . . . . . . . . . . . . . . . . . . . . .Juvenile Detention Alternatives -- Annie E. Casey Foundation 205 ------ 200. . . . . . . . . . . . . . . . . . . .Law Enforcement Officers Training and Equipment Fund 784 750 750. . . . . . . . . . . . . . . . . . . . . . . .Lobbying Annual Fees 361 350 350. . . . . . . . . . . . . . . . . . . . . . . . . . . . . . . . . . . . . . . . . . . . . . . . . . .Medical Examiner Services 8,541 9,983 10,482. . . . . . . . . . . . . . . . . . . . . . . . . . . . . . . . . . . . . . . . . . . . . . . .New Jersey Emergency Medical Service Helicopter Program ------ 6,057 6,057. . . . . . . . . . . . . . . . . . . . .New Jersey Turnpike Authority 29,704 33,748 33,748. . . . . . . . . . . . . . . . . . . . . . . . . . . . . . . . . . . . . . . . . . . .New Jersey Turnpike Authority (Parkway) 29,271 31,026 31,026. . . . . . . . . . . . . . . . . . . . . . . . . . . . . . . . . . . .Nicholson Foundation 19 ------ ------. . . . . . . . . . . . . . . . . . . . . . . . . . . . . . . . . . . . . . . . . . . . . . . . . . . .Noncriminal Records Checks ------ 15,647 15,647. . . . . . . . . . . . . . . . . . . . . . . . . . . . . . . . . . . . . . . . . . . . . .Northeast Hazardous Waste Project--Resource Conservation and Recovery Act 406 155 155. . . . . . .Pari--Mutuel Racing in Accordance with N.J.S.A. 5:5--37 354 416 416. . . . . . . . . . . . . . . . . . . . . . . .Pre--Race Blood Testing and Chemical Testing Program 3,069 3,750 3,750. . . . . . . . . . . . . . . . . . . . . . . . .Private Employment Agencies ------ 525 525. . . . . . . . . . . . . . . . . . . . . . . . . . . . . . . . . . . . . . . . . . . . .Protection of Civil Rights ------ 70 64. . . . . . . . . . . . . . . . . . . . . . . . . . . . . . . . . . . . . . . . . . . . . . . . .Public Health Law Social Distancing Project 27 ------ ------. . . . . . . . . . . . . . . . . . . . . . . . . . . . . . . . . .Racing Officials 1,026 1,005 1,005. . . . . . . . . . . . . . . . . . . . . . . . . . . . . . . . . . . . . . . . . . . . . . . . . . . . . . . . .Regulation of Alcoholic Beverages ------ 9,299 9,299. . . . . . . . . . . . . . . . . . . . . . . . . . . . . . . . . . . . . . . . . .Regulation of Racing Activities 3,230 2,989 2,989. . . . . . . . . . . . . . . . . . . . . . . . . . . . . . . . . . . . . . . . . . . .Retired Officers Handgun Permits ------ 253 253. . . . . . . . . . . . . . . . . . . . . . . . . . . . . . . . . . . . . . . . . .Safe and Secure Neighborhoods Program 8,230 7,100 7,100. . . . . . . . . . . . . . . . . . . . . . . . . . . . . . . . . . . . .Securities Enforcement Fund ------ 8,643 7,428. . . . . . . . . . . . . . . . . . . . . . . . . . . . . . . . . . . . . . . . . . . . . .Security Officer Registration Account 1,485 1,500 1,500. . . . . . . . . . . . . . . . . . . . . . . . . . . . . . . . . . . . . . .Sexual Assault Nurse Examiner Program 53 76 76. . . . . . . . . . . . . . . . . . . . . . . . . . . . . . . . . . . . .South Jersey Transportation Authority 6,812 7,220 7,220. . . . . . . . . . . . . . . . . . . . . . . . . . . . . . . . . . . . . . .State Athletic Control 1,049 500 500. . . . . . . . . . . . . . . . . . . . . . . . . . . . . . . . . . . . . . . . . . . . . . . . . . . .State Facilities Education Act (SFEA) 31,612 35,306 34,749. . . . . . . . . . . . . . . . . . . . . . . . . . . . . . . . . . . . . . .State Forensic Laboratory Fund Program 1,134 1,074 1,074. . . . . . . . . . . . . . . . . . . . . . . . . . . . . . . . . . . . .State Police Central Lab Operations ------ 1,034 1,034. . . . . . . . . . . . . . . . . . . . . . . . . . . . . . . . . . . . . . . . .State Police DNA Laboratory Enhancement 9,301 8,200 8,200. . . . . . . . . . . . . . . . . . . . . . . . . . . . . . . . . . .State Police Equine Lab Unit ------ 1,170 1,170. . . . . . . . . . . . . . . . . . . . . . . . . . . . . . . . . . . . . . . . . . . . . .State Police Operations ------ 45 45. . . . . . . . . . . . . . . . . . . . . . . . . . . . . . . . . . . . . . . . . . . . . . . . . . .State Police Purchase and Maintenance of Law Enforcement Helicopters ------ 14,000 19,225. . . . . . . . . . . .State Police Recruit Training ------ 7,000 ------. . . . . . . . . . . . . . . . . . . . . . . . . . . . . . . . . . . . . . . . . . . . . . .State Veterinarians New Jersey Racing Commission 864 1,001 1,001. . . . . . . . . . . . . . . . . . . . . . . . . . . .Steiger Fellow Fund 5 ------ ------. . . . . . . . . . . . . . . . . . . . . . . . . . . . . . . . . . . . . . . . . . . . . . . . . . . . .Victim and Witness Advocacy Fund ------ 1,350 1,350. . . . . . . . . . . . . . . . . . . . . . . . . . . . . . . . . . . . . . . . .Miscellaneous 2,848 3,278 3,350. . . . . . . . . . . . . . . . . . . . . . . . . . . . . . . . . . . . . . . . . . . . . . . . . . . . . . . . . .
Total Department of Law and Public Safety 181,690 298,167 292,828
Appendix I 45

SCHEDULE 2OTHER REVENUES
(thousands of dollars)----------------------Fiscal Year Ending June 30----------------------
2008 2009 2010Actual Estimated Estimated
Department of Military and Veterans’ Affairs:Burial Services ------ 550 500. . . . . . . . . . . . . . . . . . . . . . . . . . . . . . . . . . . . . . . . . . . . . . . . . . . . . . . . .Distance Learning Center 4 15 ------. . . . . . . . . . . . . . . . . . . . . . . . . . . . . . . . . . . . . . . . . . . . . . . . .Energy Program Receipts 31 75 75. . . . . . . . . . . . . . . . . . . . . . . . . . . . . . . . . . . . . . . . . . . . . . . . .New Jersey National Guard Support Services ------ 1,600 1,600. . . . . . . . . . . . . . . . . . . . . . . . . . . . . . . . . .PATH Security 714 950 ------. . . . . . . . . . . . . . . . . . . . . . . . . . . . . . . . . . . . . . . . . . . . . . . . . . . . . . . . . .POW/MIA Medal Receipts 3 2 2. . . . . . . . . . . . . . . . . . . . . . . . . . . . . . . . . . . . . . . . . . . . . . . .Transitional Housing ------ 590 590. . . . . . . . . . . . . . . . . . . . . . . . . . . . . . . . . . . . . . . . . . . . . . . . . . . . .World War II Memorial Dedications 229 85 91. . . . . . . . . . . . . . . . . . . . . . . . . . . . . . . . . . . . . . . . .Miscellaneous 254 60 65. . . . . . . . . . . . . . . . . . . . . . . . . . . . . . . . . . . . . . . . . . . . . . . . . . . . . . . . . .
Total Department of Military and Veterans’ Affairs 1,235 3,927 2,923
Department of the Public Advocate:New Home Owner’s Warranty 273 251 251. . . . . . . . . . . . . . . . . . . . . . . . . . . . . . . . . . . . . . . . . . . . .Rate Counsel -- Insurance 133 149 149. . . . . . . . . . . . . . . . . . . . . . . . . . . . . . . . . . . . . . . . . . . . . . . . .Residential Warranty Corporation 174 158 158. . . . . . . . . . . . . . . . . . . . . . . . . . . . . . . . . . . . . . . . . . .
Total Department of the Public Advocate 580 558 558
Department of State:Americorps -- Homeland Security Match 10 ------ ------. . . . . . . . . . . . . . . . . . . . . . . . . . . . . . . . . . . . .Extraordinary Programming 396 400 368. . . . . . . . . . . . . . . . . . . . . . . . . . . . . . . . . . . . . . . . . . . . . . .Governor’s School 238 ------ ------. . . . . . . . . . . . . . . . . . . . . . . . . . . . . . . . . . . . . . . . . . . . . . . . . . . . . . .Law Enforcement Officers Memorial Fund 352 325 325. . . . . . . . . . . . . . . . . . . . . . . . . . . . . . . . . . . .Leasing of Space on NJN Transmitter Towers 1,246 1,208 1,250. . . . . . . . . . . . . . . . . . . . . . . . . . . . . . . . .NJBEST Administration & Scholarships 470 569 984. . . . . . . . . . . . . . . . . . . . . . . . . . . . . . . . . . . . .NJN -- TV Food Network/Time Warner Capital Project 1,300 ------ 700. . . . . . . . . . . . . . . . . . . . . . . . . .New Jersey College Loans to Assist State Students (NJCLASS) 5,145 6,780 7,451. . . . . . . . . . . . . . . . . . .New Jersey Workforce Development Coalition Initiative 944 707 646. . . . . . . . . . . . . . . . . . . . . . . . .New Jersey World Trade Center Scholarship Program ------ 11 11. . . . . . . . . . . . . . . . . . . . . . . . . . .Primary Care Physician/Dentist Loan Redemption Program 2,000 ------ ------. . . . . . . . . . . . . . . . . . . . . .Public Broadcasting Services 9,289 9,568 9,017. . . . . . . . . . . . . . . . . . . . . . . . . . . . . . . . . . . . . . . . . . . . . .Records Management 1,300 1,300 1,300. . . . . . . . . . . . . . . . . . . . . . . . . . . . . . . . . . . . . . . . . . . . . . . . . . . .Rental of NJN Studio and Production Facilities 1,182 1,400 1,150. . . . . . . . . . . . . . . . . . . . . . . . . . . . . . . .Sale or Rental of NJN Productions 107 48 75. . . . . . . . . . . . . . . . . . . . . . . . . . . . . . . . . . . . . . . . . .Student Loan Expense Reimbursement Program for Obstetrician/Gynecologists 949 ------ ------. . . . . .Voter Verifed Paper Record Testing 139 ------ ------. . . . . . . . . . . . . . . . . . . . . . . . . . . . . . . . . . . . . . . . .War Memorial 1,329 1,227 1,195. . . . . . . . . . . . . . . . . . . . . . . . . . . . . . . . . . . . . . . . . . . . . . . . . . . . . . . . . .Miscellaneous 210 65 65. . . . . . . . . . . . . . . . . . . . . . . . . . . . . . . . . . . . . . . . . . . . . . . . . . . . . . . . . .
Total Department of State 26,606 23,608 24,537
Department of Transportation:Airport Safety Fund Administration ------ 400 400. . . . . . . . . . . . . . . . . . . . . . . . . . . . . . . . . . . . . . . . .Applications and Highway Permits ------ 1,310 1,310. . . . . . . . . . . . . . . . . . . . . . . . . . . . . . . . . . . . . . . . . .Commercial Vehicle Enforcement Program 12,166 ------ ------. . . . . . . . . . . . . . . . . . . . . . . . . . . . . . . . . . .Cost of ”Cause” Plates 291 ------ ------. . . . . . . . . . . . . . . . . . . . . . . . . . . . . . . . . . . . . . . . . . . . . . . . . . .County and Other Shared Projects 29,941 ------ ------. . . . . . . . . . . . . . . . . . . . . . . . . . . . . . . . . . . . . . . . . .Highway Safety Fund 2,038 2,000 2,000. . . . . . . . . . . . . . . . . . . . . . . . . . . . . . . . . . . . . . . . . . . . . . . . . . . .In--Terminal School Bus Inspection Program 1,304 1,300 1,300. . . . . . . . . . . . . . . . . . . . . . . . . . . . . . . . . .Logo Sign Program ------ 110 110. . . . . . . . . . . . . . . . . . . . . . . . . . . . . . . . . . . . . . . . . . . . . . . . . . . . . .Motor Vehicle Services 271,678 262,954 267,230. . . . . . . . . . . . . . . . . . . . . . . . . . . . . . . . . . . . . . . . . . . . . . . . . . .Motorbus Regulation 650 766 772. . . . . . . . . . . . . . . . . . . . . . . . . . . . . . . . . . . . . . . . . . . . . . . . . . . . .Motorcycle Safety Education Fund 485 310 456. . . . . . . . . . . . . . . . . . . . . . . . . . . . . . . . . . . . . . . . . .NJ Board of Pilot Commissioners 740 590 245. . . . . . . . . . . . . . . . . . . . . . . . . . . . . . . . . . . . . . . . . . .NJ Medical Service Helicopter Response Act 28,284 ------ ------. . . . . . . . . . . . . . . . . . . . . . . . . . . . . . . . . .Office of Maritime Resources 2,615 2,500 2,500. . . . . . . . . . . . . . . . . . . . . . . . . . . . . . . . . . . . . . . . . . . . . .Omnibus Safety Enforcement Fund 18 ------ ------. . . . . . . . . . . . . . . . . . . . . . . . . . . . . . . . . . . . . . . . .Outdoor Advertising Program ------ 640 640. . . . . . . . . . . . . . . . . . . . . . . . . . . . . . . . . . . . . . . . . . . . . .Placarded Railcar Program ------ 110 200. . . . . . . . . . . . . . . . . . . . . . . . . . . . . . . . . . . . . . . . . . . . . . . .Rental Receipts, Tenant Relocation Program ------ 360 360. . . . . . . . . . . . . . . . . . . . . . . . . . . . . . . . . .Security Responsibility 16,200 16,500 16,500. . . . . . . . . . . . . . . . . . . . . . . . . . . . . . . . . . . . . . . . . . . . . . . . . . .
Total Department of Transportation 366,410 289,850 294,023
Department of the Treasury:Annual Licensing Fee -- Office of Administrative Law Publications 851 680 680. . . . . . . . . . . . . . . .Atlantic City Electric Company Audit 79 ------ ------. . . . . . . . . . . . . . . . . . . . . . . . . . . . . . . . . . . . . . .CATV Universal Access Fund 289 ------ ------. . . . . . . . . . . . . . . . . . . . . . . . . . . . . . . . . . . . . . . . . . . . . .Capital City Redevelopment Corporation 185 301 301. . . . . . . . . . . . . . . . . . . . . . . . . . . . . . . . . . . . .Cigarette Tax Securitization 153,744 194,000 194,000. . . . . . . . . . . . . . . . . . . . . . . . . . . . . . . . . . . . . . . . . . . . . . .Clean Energy Program 741 1,300 1,300. . . . . . . . . . . . . . . . . . . . . . . . . . . . . . . . . . . . . . . . . . . . . . . . . . .
Appendix I 46

SCHEDULE 2OTHER REVENUES
(thousands of dollars)----------------------Fiscal Year Ending June 30----------------------
2008 2009 2010Actual Estimated Estimated
Commerce Commission Off--Shore Wind Study Nonprofit Contributions 70 ------ ------. . . . . . . . . . . .Contract Compliance and Equal Employment Opportunity in Public Contracts ------ 278 573. . . . . . .Division of Developmental Disabilities Community Placement and Services 36,333 36,300 36,300. . . . . . . . .Domestic Security 22,634 22,600 22,600. . . . . . . . . . . . . . . . . . . . . . . . . . . . . . . . . . . . . . . . . . . . . . . . . . . . . . .Drug Abuse Education Fund 807 600 600. . . . . . . . . . . . . . . . . . . . . . . . . . . . . . . . . . . . . . . . . . . . . . .Economic Recovery Fund 21,606 21,604 21,604. . . . . . . . . . . . . . . . . . . . . . . . . . . . . . . . . . . . . . . . . . . . . . . . .Energy Tax Receipts 788,492 788,492 788,492. . . . . . . . . . . . . . . . . . . . . . . . . . . . . . . . . . . . . . . . . . . . . . . . . . . . .Judicial Hearings Receipts 2,966 3,809 3,809. . . . . . . . . . . . . . . . . . . . . . . . . . . . . . . . . . . . . . . . . . . . . . . .Management Audit -- N.J. Natural Gas 197 ------ ------. . . . . . . . . . . . . . . . . . . . . . . . . . . . . . . . . . . . . . .Management Audit -- United Water 82 ------ ------. . . . . . . . . . . . . . . . . . . . . . . . . . . . . . . . . . . . . . . . . .Management Consulting Analysis Gas Utilities 1,090 ------ ------. . . . . . . . . . . . . . . . . . . . . . . . . . . . . . . .Management of DEP Properties ------ 515 515. . . . . . . . . . . . . . . . . . . . . . . . . . . . . . . . . . . . . . . . . . . .Management of State Investments 11,686 11,226 11,226. . . . . . . . . . . . . . . . . . . . . . . . . . . . . . . . . . . . . . . . . . .New Jersey Public Records Preservation 7,528 11,200 12,400. . . . . . . . . . . . . . . . . . . . . . . . . . . . . . . . . . . . .Nextel Rebanding 244 ------ ------. . . . . . . . . . . . . . . . . . . . . . . . . . . . . . . . . . . . . . . . . . . . . . . . . . . . . . .Office of Information Technology Indirect Cost Recoveries 4,150 4,850 5,000. . . . . . . . . . . . . . . . . . . . . .Office of Management and Budget 21,025 9,119 9,085. . . . . . . . . . . . . . . . . . . . . . . . . . . . . . . . . . . . . . . . . .Ombudsman 309 451 451. . . . . . . . . . . . . . . . . . . . . . . . . . . . . . . . . . . . . . . . . . . . . . . . . . . . . . . . . . .Other Capital Building Services 2,686 2,685 2,685. . . . . . . . . . . . . . . . . . . . . . . . . . . . . . . . . . . . . . . . . . . .Other Distributed Taxes 6,882 4,168 4,168. . . . . . . . . . . . . . . . . . . . . . . . . . . . . . . . . . . . . . . . . . . . . . . . . . .Pensions and Benefits 48,321 40,739 40,701. . . . . . . . . . . . . . . . . . . . . . . . . . . . . . . . . . . . . . . . . . . . . . . . . . . .Prequalification Fees ------ 130 130. . . . . . . . . . . . . . . . . . . . . . . . . . . . . . . . . . . . . . . . . . . . . . . . . . . . .Property Management and Construction -- Property Management Services 136 135 135. . . . . . . . . . .Public Finance Activities ------ 700 700. . . . . . . . . . . . . . . . . . . . . . . . . . . . . . . . . . . . . . . . . . . . . . . . . .Real Property Leasing Out Program ------ 265 265. . . . . . . . . . . . . . . . . . . . . . . . . . . . . . . . . . . . . . . . .Royalties -- Office of Administrative Law Publications 369 365 370. . . . . . . . . . . . . . . . . . . . . . . . . .Small Business Registration ------ 260 360. . . . . . . . . . . . . . . . . . . . . . . . . . . . . . . . . . . . . . . . . . . . . . .State Pension System Audit ------ 225 ------. . . . . . . . . . . . . . . . . . . . . . . . . . . . . . . . . . . . . . . . . . . . . . .State Technology Advancement Collaborative 87 ------ ------. . . . . . . . . . . . . . . . . . . . . . . . . . . . . . . . .Taxation Compliance and Enforcement Activities ------ 5,015 5,000. . . . . . . . . . . . . . . . . . . . . . . . . . . . . .Third Party Subrogation -- Property Damage ------ 850 850. . . . . . . . . . . . . . . . . . . . . . . . . . . . . . . . . .Unclaimed Property Trust Fund 6,176 6,920 6,920. . . . . . . . . . . . . . . . . . . . . . . . . . . . . . . . . . . . . . . . . . . .Urban Enterprise Zone (UEZ) Authority Administrative Expenses 4,034 1,801 1,797. . . . . . . . . . . . . . . . .Vendor Surcharge Collection -- Motor Vehicle Commission 11,000 11,000 11,000. . . . . . . . . . . . . . . . . . . . . . .Workforce Initiatives and Development ------ 2,200 2,200. . . . . . . . . . . . . . . . . . . . . . . . . . . . . . . . . . . . . .Miscellaneous 208 782 782. . . . . . . . . . . . . . . . . . . . . . . . . . . . . . . . . . . . . . . . . . . . . . . . . . . . . . . . . .
Total Department of the Treasury 1,155,007 1,185,565 1,186,999
Interdepartmental Accounts:Petroleum Overcharge Reimbursement Fund ------ 3,500 3,500. . . . . . . . . . . . . . . . . . . . . . . . . . . . . . . . . .Utilities and Other Services ------ 560 918. . . . . . . . . . . . . . . . . . . . . . . . . . . . . . . . . . . . . . . . . . . . . . . .
Total Interdepartmental Accounts ------ 4,060 4,418
The Judiciary:Atlantic Victim Impact 14 ------ ------. . . . . . . . . . . . . . . . . . . . . . . . . . . . . . . . . . . . . . . . . . . . . . . . . . .Automated Traffic System for Municipal Courts 27,844 23,000 23,000. . . . . . . . . . . . . . . . . . . . . . . . . . . . . . .Civil Courts 607 765 872. . . . . . . . . . . . . . . . . . . . . . . . . . . . . . . . . . . . . . . . . . . . . . . . . . . . . . . . . . . .Comprehensive Enforcement Program 3,198 2,900 3,100. . . . . . . . . . . . . . . . . . . . . . . . . . . . . . . . . . . . . . .Court Adult Probation System 592 500 500. . . . . . . . . . . . . . . . . . . . . . . . . . . . . . . . . . . . . . . . . . . . .Court Technology Improvement Fund 13,591 12,300 12,300. . . . . . . . . . . . . . . . . . . . . . . . . . . . . . . . . . . . . . .Electronic Access To Court Records 2,357 1,000 1,000. . . . . . . . . . . . . . . . . . . . . . . . . . . . . . . . . . . . . . . . .Family Courts 425 400 400. . . . . . . . . . . . . . . . . . . . . . . . . . . . . . . . . . . . . . . . . . . . . . . . . . . . . . . . . .Information Services 445 516 516. . . . . . . . . . . . . . . . . . . . . . . . . . . . . . . . . . . . . . . . . . . . . . . . . . . . .Iolta Teen Star Program 4 ------ ------. . . . . . . . . . . . . . . . . . . . . . . . . . . . . . . . . . . . . . . . . . . . . . . . . . .Juvenile Accountability Block Grant -- Union Night Watch 21 ------ ------. . . . . . . . . . . . . . . . . . . . . . .Mercer County State Incentive Program 43 ------ ------. . . . . . . . . . . . . . . . . . . . . . . . . . . . . . . . . . . . . .Phase Out Program Juvenile Justice Partnership 112 ------ ------. . . . . . . . . . . . . . . . . . . . . . . . . . . . . . . .Special Civil Part Certified Mailers 3,291 2,250 2,500. . . . . . . . . . . . . . . . . . . . . . . . . . . . . . . . . . . . . . . . . .State Bar Foundation Artwork Projects 8 ------ ------. . . . . . . . . . . . . . . . . . . . . . . . . . . . . . . . . . . . . . .Supreme Court 13,722 16,748 17,656. . . . . . . . . . . . . . . . . . . . . . . . . . . . . . . . . . . . . . . . . . . . . . . . . . . . . . . . . .Miscellaneous 620 15 15. . . . . . . . . . . . . . . . . . . . . . . . . . . . . . . . . . . . . . . . . . . . . . . . . . . . . . . . . .
Total Judiciary 66,894 60,394 61,859
Total Dedicated 3,291,836 3,318,879 3,307,316. . . . . . . . . . . . . . . . . . . . . . . . . . . . . . . . . . . . . . . . . . . . . . . . . . . . . . . . .
Appendix I 47

SCHEDULE 2OTHER REVENUES
(thousands of dollars)----------------------Fiscal Year Ending June 30----------------------
2008 2009 2010Actual Estimated Estimated
Federal:
Executive Branch----Department of Agriculture:
Agricultural Mediation Grant -- USDA 17 25 25. . . . . . . . . . . . . . . . . . . . . . . . . . . . . . . . . . . . . . .Aquaculture ------ ------ 50. . . . . . . . . . . . . . . . . . . . . . . . . . . . . . . . . . . . . . . . . . . . . . . . . . . . . . . . . . . .Asian Longhorned Beetle Monitoring 497 3,000 3,000. . . . . . . . . . . . . . . . . . . . . . . . . . . . . . . . . . . . . . . .Child Care 57,818 70,825 70,875. . . . . . . . . . . . . . . . . . . . . . . . . . . . . . . . . . . . . . . . . . . . . . . . . . . . . . . . . . . . .Child Nutrition -- School Breakfast 36,849 45,000 50,000. . . . . . . . . . . . . . . . . . . . . . . . . . . . . . . . . . . . . . . . . .Child Nutrition -- School Lunch 157,509 180,000 190,000. . . . . . . . . . . . . . . . . . . . . . . . . . . . . . . . . . . . . . . . . . . .Child Nutrition -- School Lunch Equipment -- Federal Economic Stimulus ------ 2,000 ------. . . . . . . . . . .Child Nutrition -- Special Milk 848 1,200 1,400. . . . . . . . . . . . . . . . . . . . . . . . . . . . . . . . . . . . . . . . . . . . .Child Nutrition -- Summer Programs 5,960 10,428 9,178. . . . . . . . . . . . . . . . . . . . . . . . . . . . . . . . . . . . . . . . .Child Nutrition Administration 3,595 4,670 4,970. . . . . . . . . . . . . . . . . . . . . . . . . . . . . . . . . . . . . . . . . . . . .Cooperative Gypsy Moth Suppression ------ 1,450 1,450. . . . . . . . . . . . . . . . . . . . . . . . . . . . . . . . . . . . . . .Farm Risk Management Education Program 253 272 272. . . . . . . . . . . . . . . . . . . . . . . . . . . . . . . . . . .Farmland Preservation 2,272 4,500 4,500. . . . . . . . . . . . . . . . . . . . . . . . . . . . . . . . . . . . . . . . . . . . . . . . . . . .Fish Inspection Service 105 160 160. . . . . . . . . . . . . . . . . . . . . . . . . . . . . . . . . . . . . . . . . . . . . . . . . . .Food Stamp -- The Emergency Food Assistance Program (TEFAP) 576 2,250 1,550. . . . . . . . . . . . . . . . .Fresh Fruit and Vegetable Program ------ ------ 2,000. . . . . . . . . . . . . . . . . . . . . . . . . . . . . . . . . . . . . . . . . .Indemnities -- Avian Influenza 519 575 490. . . . . . . . . . . . . . . . . . . . . . . . . . . . . . . . . . . . . . . . . . . . . .National Animal Identification Infrastructure 152 100 74. . . . . . . . . . . . . . . . . . . . . . . . . . . . . . . . . .South Jersey Rural Economic Development Corporation -- Ethanol 163 ------ ------. . . . . . . . . . . . . . . . .Specialty Crop Block Grant Program 117 152 ------. . . . . . . . . . . . . . . . . . . . . . . . . . . . . . . . . . . . . . . .TEFAP -- Federal Economic Stimulus ------ 2,200 ------. . . . . . . . . . . . . . . . . . . . . . . . . . . . . . . . . . . . . . . .TEFAP Administrative Funds -- Federal Economic Stimulus ------ 544 544. . . . . . . . . . . . . . . . . . . . . .Team Nutrition Training ------ 200 200. . . . . . . . . . . . . . . . . . . . . . . . . . . . . . . . . . . . . . . . . . . . . . . . . .Various Federal Programs and Accruals 7,726 1,551 1,369. . . . . . . . . . . . . . . . . . . . . . . . . . . . . . . . . . . . . .
Total Department of Agriculture 274,976 331,102 342,107
Department of Children and Families:Children’s Justice Act 112 458 458. . . . . . . . . . . . . . . . . . . . . . . . . . . . . . . . . . . . . . . . . . . . . . . . . . . .Restricted Federal Grants 9,106 8,795 10,645. . . . . . . . . . . . . . . . . . . . . . . . . . . . . . . . . . . . . . . . . . . . . . . . .Title IV--B Child Welfare Services 5,978 5,500 5,500. . . . . . . . . . . . . . . . . . . . . . . . . . . . . . . . . . . . . . . . . .Title IV--E Foster Care 109,660 97,703 105,958. . . . . . . . . . . . . . . . . . . . . . . . . . . . . . . . . . . . . . . . . . . . . . . . . . .Title IV--E Foster Care -- Federal Economic Stimulus ------ 4,044 5,392. . . . . . . . . . . . . . . . . . . . . . . . . . .Various Federal Programs and Accruals 3 500 500. . . . . . . . . . . . . . . . . . . . . . . . . . . . . . . . . . . . . .
Total Department of Children and Families 124,859 117,000 128,453
Department of Community Affairs:Community Services Block Grant 13,244 17,825 17,825. . . . . . . . . . . . . . . . . . . . . . . . . . . . . . . . . . . . . . . . . . .Community Services Block Grant -- Federal Economic Stimulus ------ 27,400 ------. . . . . . . . . . . . . . . . . . .Emergency Shelter Grants Program 2,532 1,650 1,650. . . . . . . . . . . . . . . . . . . . . . . . . . . . . . . . . . . . . . . . .Emergency Shelter Grants Program -- Federal Economic Stimulus ------ 10,221 ------. . . . . . . . . . . . . . . . .Fair Housing Initiatives Grant ------ 100 ------. . . . . . . . . . . . . . . . . . . . . . . . . . . . . . . . . . . . . . . . . . . . . .Lead--Based Paint Abatement in Low and Moderate Income Housing 589 ------ ------. . . . . . . . . . . . . . .Low Income Home Energy Assistance Program 107,409 188,113 188,113. . . . . . . . . . . . . . . . . . . . . . . . . . . . . . . .Moderate Rehabilitation Housing Assistance 7,349 11,679 12,213. . . . . . . . . . . . . . . . . . . . . . . . . . . . . . . . . .National Affordable Housing -- HOME Investment Partnerships 10,859 7,611 7,611. . . . . . . . . . . . . . . . . . .National Field--Generated Training, Technical Assistance and Demonstration ------ 125 ------. . . . . . . .National Fire Academy Training Program 42 28 28. . . . . . . . . . . . . . . . . . . . . . . . . . . . . . . . . . . .Section 8 Housing Voucher Program 188,263 292,600 198,582. . . . . . . . . . . . . . . . . . . . . . . . . . . . . . . . . . . . . . . . .Shelter Plus Care Program 1,818 6,961 4,965. . . . . . . . . . . . . . . . . . . . . . . . . . . . . . . . . . . . . . . . . . . . . . . . .Small Cities Block Grant Program 6,087 8,360 8,360. . . . . . . . . . . . . . . . . . . . . . . . . . . . . . . . . . . . . . . . . .Small Cities Block Grant Program -- Federal Economic Stimulus ------ 1,945 ------. . . . . . . . . . . . . . . . . .Transitional Housing -- Homeless 52 136 136. . . . . . . . . . . . . . . . . . . . . . . . . . . . . . . . . . . . . . . . . . .Weatherization Assistance Program 4,006 5,169 6,374. . . . . . . . . . . . . . . . . . . . . . . . . . . . . . . . . . . . . . . . .Weatherization Assistance Program -- Federal Economic Stimulus ------ 121,800 ------. . . . . . . . . . . . . . . . .Various Federal Programs and Accruals 21,835 ------ ------. . . . . . . . . . . . . . . . . . . . . . . . . . . . . . . . . . . . . .
Total Department of Community Affairs 364,085 701,723 445,857
Department of Corrections:Counterterrorism Prison Intelligence 4 400 ------. . . . . . . . . . . . . . . . . . . . . . . . . . . . . . . . . . . . . . . .Crime and Justice Research 49 ------ ------. . . . . . . . . . . . . . . . . . . . . . . . . . . . . . . . . . . . . . . . . . . . . . . .Federal Re--Entry Initiative ------ ------ 500. . . . . . . . . . . . . . . . . . . . . . . . . . . . . . . . . . . . . . . . . . . . . . . .Justice and Mental Health Collaboration Program -- DOJ ------ 200 200. . . . . . . . . . . . . . . . . . . . . . . . .National Institute of Justice Grant for Corrections Research--Escape Study ------ 383 300. . . . . . . . . . .National Institute of Justice Grant for Corrections Research--Megan’s Law Study 13 400 ------. . . . .Offender Workforce Development Specialist Training -- Federal Award ------ 25 25. . . . . . . . . . . . .Prison Rape Elimination Grant 127 ------ 300. . . . . . . . . . . . . . . . . . . . . . . . . . . . . . . . . . . . . . . . . . . . .
Appendix I 48

SCHEDULE 2OTHER REVENUES
(thousands of dollars)----------------------Fiscal Year Ending June 30----------------------
2008 2009 2010Actual Estimated Estimated
Prisoner Re--Entry Initiative Grant -- Atlantic County 367 ------ ------. . . . . . . . . . . . . . . . . . . . . . . . . . .Prisoner Re--Entry Initiative for 200 parolees returning to Trenton area ------ 135 200. . . . . . . . . . . . .Project In--Side 336 608 561. . . . . . . . . . . . . . . . . . . . . . . . . . . . . . . . . . . . . . . . . . . . . . . . . . . . . . . . .Promoting Responsible Fatherhood 149 407 407. . . . . . . . . . . . . . . . . . . . . . . . . . . . . . . . . . . . . . . . .Serious and Violent Offender Reentry Initiative 493 ------ ------. . . . . . . . . . . . . . . . . . . . . . . . . . . . . . . .Sex Offender Management Grant--Risk Assessment and Deterance 15 ------ ------. . . . . . . . . . . . . . . . .State Criminal Alien Assistance Program 6,457 6,598 6,304. . . . . . . . . . . . . . . . . . . . . . . . . . . . . . . . . . . . .Various Federal Programs and Accruals --1,277 60 ------. . . . . . . . . . . . . . . . . . . . . . . . . . . . . . . . . . . . . .
Total Department of Corrections 6,733 9,216 8,797
Department of Education:21st Century Schools 26,176 20,175 20,175. . . . . . . . . . . . . . . . . . . . . . . . . . . . . . . . . . . . . . . . . . . . . . . . . . . . .AIDS Prevention Education 231 700 700. . . . . . . . . . . . . . . . . . . . . . . . . . . . . . . . . . . . . . . . . . . . . . .Adult Basic Education -- Administration/Discretionary ------ 1,085 1,125. . . . . . . . . . . . . . . . . . . . . . . . . .Bilingual and Compensatory Education -- Homeless Children and Youth 1,174 1,321 1,300. . . . . . . . . . . .Bilingual and Compensatory Education -- Homeless Children and Youth -- Stimulus ------ ------ 436. . .Byrd Scholarship Program 1,154 1,135 1,135. . . . . . . . . . . . . . . . . . . . . . . . . . . . . . . . . . . . . . . . . . . . . . . .Character Education Partnership 595 725 725. . . . . . . . . . . . . . . . . . . . . . . . . . . . . . . . . . . . . . . . . . . .Drug--Free Schools and Communities -- Administration 1,142 1,390 1,390. . . . . . . . . . . . . . . . . . . . . . . . . .Drug--Free Schools and Communities -- Discretionary 6,764 5,560 5,560. . . . . . . . . . . . . . . . . . . . . . . . . . .Enhancing Education Through Technology 3,480 5,293 5,058. . . . . . . . . . . . . . . . . . . . . . . . . . . . . . . . . . .Enhancing Education Through Technology -- Federal Economic Stimulus ------ ------ 12,048. . . . . . . . . . .Even Start 2,701 1,250 1,250. . . . . . . . . . . . . . . . . . . . . . . . . . . . . . . . . . . . . . . . . . . . . . . . . . . . . . . . . . . . .General Formula Aid -- Federal Economic Stimulus ------ ------ 1,056,920. . . . . . . . . . . . . . . . . . . . . . . . . . . . .Head Start Collaboration ------ 175 175. . . . . . . . . . . . . . . . . . . . . . . . . . . . . . . . . . . . . . . . . . . . . . . . . .Improving America’s Schools Act -- Consolidated Administration 4,148 5,428 5,341. . . . . . . . . . . . . . . . .Individuals with Disabilities Education Act Basic State Grant 342,066 343,600 352,271. . . . . . . . . . . . . . . . . . . . .Individuals with Disabilities Education Act Basic State Grant -- Stimulus Funds ------ ------ 360,691. . . . . .Individuals with Disabilities Education Act Preschool Grants 11,696 11,198 11,191. . . . . . . . . . . . . . . . . . . . .Individuals with Disabilities Education Act Preschool Grants -- Stimulus Funds ------ ------ 11,805. . . . . . .Language Acquisition Discretionary Admin 17,336 18,600 18,600. . . . . . . . . . . . . . . . . . . . . . . . . . . . . . . . . . .Mathematics and Science Partnerships Grants 4,444 3,020 3,020. . . . . . . . . . . . . . . . . . . . . . . . . . . . . . . . .Migrant Education -- Administration/Discretionary 2,175 1,964 1,900. . . . . . . . . . . . . . . . . . . . . . . . . . . . .Public Charter Schools 1,855 3,960 3,960. . . . . . . . . . . . . . . . . . . . . . . . . . . . . . . . . . . . . . . . . . . . . . . . . . .School Improvement Grants ------ 9,585 9,490. . . . . . . . . . . . . . . . . . . . . . . . . . . . . . . . . . . . . . . . . . . . . . .School Improvements Grants -- Federal Economic Stimulus ------ ------ 61,155. . . . . . . . . . . . . . . . . . . . . .State Assessments 12,148 9,791 9,791. . . . . . . . . . . . . . . . . . . . . . . . . . . . . . . . . . . . . . . . . . . . . . . . . . . . . . .State Data Grants 302 ------ ------. . . . . . . . . . . . . . . . . . . . . . . . . . . . . . . . . . . . . . . . . . . . . . . . . . . . . . . .State Grants for Improving Teacher Quality 57,040 65,410 63,348. . . . . . . . . . . . . . . . . . . . . . . . . . . . . . . . . . .State Improvement Grant -- Administration 647 ------ ------. . . . . . . . . . . . . . . . . . . . . . . . . . . . . . . . . . .Step Up -- Teacher Recruitment 414 ------ ------. . . . . . . . . . . . . . . . . . . . . . . . . . . . . . . . . . . . . . . . . . . . .Title I -- Comprehensive School Reform 397 ------ ------. . . . . . . . . . . . . . . . . . . . . . . . . . . . . . . . . . . . . .Title I -- Grants to Local Educational Agencies 213,179 290,000 291,000. . . . . . . . . . . . . . . . . . . . . . . . . . . . . . . . .Title I -- Grants to Local Educational Agencies -- Federal Economic Stimulus ------ ------ 183,015. . . . . . . . .Title I -- Part D, Neglected and Delinquent 2,302 2,729 1,620. . . . . . . . . . . . . . . . . . . . . . . . . . . . . . . . . . . .Title I -- Reading First State Grant 19,948 6,750 7,008. . . . . . . . . . . . . . . . . . . . . . . . . . . . . . . . . . . . . . . . . . .Title V -- Innovative Program Strategies 2,469 ------ ------. . . . . . . . . . . . . . . . . . . . . . . . . . . . . . . . . . . . . .Vocational Education -- Basic Grants -- Administration 22,095 24,323 24,332. . . . . . . . . . . . . . . . . . . . . . . . . .Vocational Education Technical Preparation 1,528 2,263 2,263. . . . . . . . . . . . . . . . . . . . . . . . . . . . . . . . . . .Various Federal Programs and Accruals 38,253 1,114 1,075. . . . . . . . . . . . . . . . . . . . . . . . . . . . . . . . . . . . . .
Total Department of Education 797,859 838,544 2,530,873
Department of Environmental Protection:Air Pollution Maintenance Program 5,523 6,500 7,000. . . . . . . . . . . . . . . . . . . . . . . . . . . . . . . . . . . . . . . . .Artificial Reef Program -- PSE&G/NJPDES Permit Fees 829 925 925. . . . . . . . . . . . . . . . . . . . . . . . .Asian Longhorned Beetle Project 122 2,300 2,300. . . . . . . . . . . . . . . . . . . . . . . . . . . . . . . . . . . . . . . . . . .Assessing New Jersey’s Bays 45 ------ 200. . . . . . . . . . . . . . . . . . . . . . . . . . . . . . . . . . . . . . . . . . . . . .Assistance to Firefighters -- Wildfire and Arson Prevention ------ 200 200. . . . . . . . . . . . . . . . . . . . . . .Atlantic Coastal Cooperative Program 81 ------ ------. . . . . . . . . . . . . . . . . . . . . . . . . . . . . . . . . . . . . . .Atlantic Coastal Fisheries 292 300 300. . . . . . . . . . . . . . . . . . . . . . . . . . . . . . . . . . . . . . . . . . . . . . . . .Avian Influenza 133 110 150. . . . . . . . . . . . . . . . . . . . . . . . . . . . . . . . . . . . . . . . . . . . . . . . . . . . . . . . .Beach Monitoring and Notification 322 600 600. . . . . . . . . . . . . . . . . . . . . . . . . . . . . . . . . . . . . . . . . .Benthic Indicators for Nearshore Coastal Waters 47 400 400. . . . . . . . . . . . . . . . . . . . . . . . . . . . . . .BioWatch Monitoring 324 750 750. . . . . . . . . . . . . . . . . . . . . . . . . . . . . . . . . . . . . . . . . . . . . . . . . . . .Boat Access (Fish and Wildlife) 582 1,000 1,000. . . . . . . . . . . . . . . . . . . . . . . . . . . . . . . . . . . . . . . . . . . .Brownfields 826 2,000 2,000. . . . . . . . . . . . . . . . . . . . . . . . . . . . . . . . . . . . . . . . . . . . . . . . . . . . . . . . . . . .Brownfields -- Harrison Avenue Landfill 200 ------ ------. . . . . . . . . . . . . . . . . . . . . . . . . . . . . . . . . . . . .CO2 Sequestration ------ ------ 500. . . . . . . . . . . . . . . . . . . . . . . . . . . . . . . . . . . . . . . . . . . . . . . . . . . . . . .Chronic Wasting Disease 93 150 150. . . . . . . . . . . . . . . . . . . . . . . . . . . . . . . . . . . . . . . . . . . . . . . . . .Clean Vessels 459 1,000 1,000. . . . . . . . . . . . . . . . . . . . . . . . . . . . . . . . . . . . . . . . . . . . . . . . . . . . . . . . . . .
Appendix I 49

SCHEDULE 2OTHER REVENUES
(thousands of dollars)----------------------Fiscal Year Ending June 30----------------------
2008 2009 2010Actual Estimated Estimated
Clean Water State Revolving Fund ------ 28,000 28,000. . . . . . . . . . . . . . . . . . . . . . . . . . . . . . . . . . . . . . . . . .Clean Water State Revolving Fund -- Federal Economic Stimulus ------ 161,400 ------. . . . . . . . . . . . . . . . . .Coastal Estuarine Land Program ------ 4,000 4,000. . . . . . . . . . . . . . . . . . . . . . . . . . . . . . . . . . . . . . . . . . . .Coastal Zone Management Implementation 2,401 3,400 3,400. . . . . . . . . . . . . . . . . . . . . . . . . . . . . . . . . . .Community Assistance Program 230 250 250. . . . . . . . . . . . . . . . . . . . . . . . . . . . . . . . . . . . . . . . . . . .Consolidated Forest Management 359 1,080 1,080. . . . . . . . . . . . . . . . . . . . . . . . . . . . . . . . . . . . . . . . . . .Defensible Space 5 400 400. . . . . . . . . . . . . . . . . . . . . . . . . . . . . . . . . . . . . . . . . . . . . . . . . . . . . . . .Diesel Emission Reduction Act -- Federal Economic Stimulus ------ 1,700 ------. . . . . . . . . . . . . . . . . . . . .Drinking Water State Revolving Fund 3,293 22,200 22,500. . . . . . . . . . . . . . . . . . . . . . . . . . . . . . . . . . . . . . .Drinking Water State Revolving Fund -- Federal Economic Stimulus ------ 43,154 ------. . . . . . . . . . . . . . .Electronic Vessel Trip Reporting 45 170 170. . . . . . . . . . . . . . . . . . . . . . . . . . . . . . . . . . . . . . . . . . . .Endangered Species 61 85 85. . . . . . . . . . . . . . . . . . . . . . . . . . . . . . . . . . . . . . . . . . . . . . . . . . . . . .Endangered and Nongame Species Program State Wildlife Grants 2,120 1,065 1,065. . . . . . . . . . . . . . . . .Firewise in the Pines 27 200 200. . . . . . . . . . . . . . . . . . . . . . . . . . . . . . . . . . . . . . . . . . . . . . . . . . . . .Fish and Wildlife Action Plan ------ ------ 75. . . . . . . . . . . . . . . . . . . . . . . . . . . . . . . . . . . . . . . . . . . . . .Fish and Wildlife Health 106 150 150. . . . . . . . . . . . . . . . . . . . . . . . . . . . . . . . . . . . . . . . . . . . . . . . . .Fish and Wildlife Technical Guidance ------ ------ 100. . . . . . . . . . . . . . . . . . . . . . . . . . . . . . . . . . . . . . .Forest Legacy 26 5,040 5,040. . . . . . . . . . . . . . . . . . . . . . . . . . . . . . . . . . . . . . . . . . . . . . . . . . . . . . . . . .Forest Resource Management -- Cooperative Forest Fire Control 651 1,700 1,750. . . . . . . . . . . . . . . . . .Grassland Habitat Project ------ 200 200. . . . . . . . . . . . . . . . . . . . . . . . . . . . . . . . . . . . . . . . . . . . . . . . .Gypsy Moth Suppression 150 350 420. . . . . . . . . . . . . . . . . . . . . . . . . . . . . . . . . . . . . . . . . . . . . . . . .Hazardous Waste -- Resource Conservation Recovery Act 6,802 4,895 4,895. . . . . . . . . . . . . . . . . . . . . . . .Historic Preservation Survey and Planning 813 950 950. . . . . . . . . . . . . . . . . . . . . . . . . . . . . . . . . . . .Hunters’ and Anglers’ License Fund 3,826 6,680 6,780. . . . . . . . . . . . . . . . . . . . . . . . . . . . . . . . . . . . . . . . .Land and Water Conservation Fund 7,913 3,000 3,000. . . . . . . . . . . . . . . . . . . . . . . . . . . . . . . . . . . . . . . . .Leaking Underground Storage Tanks -- Federal Economic Stimulus ------ 4,968 ------. . . . . . . . . . . . . . . .Marine Fisheries Investigation and Management 875 1,365 1,365. . . . . . . . . . . . . . . . . . . . . . . . . . . . . . .Multimedia 905 750 750. . . . . . . . . . . . . . . . . . . . . . . . . . . . . . . . . . . . . . . . . . . . . . . . . . . . . . . . . . . .NJ Landowner Incentive 265 1,480 1,300. . . . . . . . . . . . . . . . . . . . . . . . . . . . . . . . . . . . . . . . . . . . . . . . . .National Coastal Wetlands Conservation 928 2,000 2,000. . . . . . . . . . . . . . . . . . . . . . . . . . . . . . . . . . . . .National Dam Safety Program (FEMA) 25 90 90. . . . . . . . . . . . . . . . . . . . . . . . . . . . . . . . . . . . . .National Geologic Mapping Program 112 200 200. . . . . . . . . . . . . . . . . . . . . . . . . . . . . . . . . . . . . . . .National Recreational Trails 1,534 1,900 1,900. . . . . . . . . . . . . . . . . . . . . . . . . . . . . . . . . . . . . . . . . . . . . . .New Jersey’s Landscape Project ------ ------ 200. . . . . . . . . . . . . . . . . . . . . . . . . . . . . . . . . . . . . . . . . . . .Nonpoint Source Implementation (319H) 2,939 4,000 4,000. . . . . . . . . . . . . . . . . . . . . . . . . . . . . . . . . . . . .Northeast Wildlife Teamwork Strategy ------ ------ 50. . . . . . . . . . . . . . . . . . . . . . . . . . . . . . . . . . . . . . .Offshore Beach Replenishment ------ 150 150. . . . . . . . . . . . . . . . . . . . . . . . . . . . . . . . . . . . . . . . . . . . .Particulate Monitoring Grant 1,373 1,000 1,000. . . . . . . . . . . . . . . . . . . . . . . . . . . . . . . . . . . . . . . . . . . . . . .Pesticide Technology 862 550 550. . . . . . . . . . . . . . . . . . . . . . . . . . . . . . . . . . . . . . . . . . . . . . . . . . . . .Pinelands Grant -- Acquisition ------ 1,000 1,000. . . . . . . . . . . . . . . . . . . . . . . . . . . . . . . . . . . . . . . . . . . . . .Preliminary Assessments/Site Inspections 899 1,500 1,900. . . . . . . . . . . . . . . . . . . . . . . . . . . . . . . . . . . .Radon Program 652 500 500. . . . . . . . . . . . . . . . . . . . . . . . . . . . . . . . . . . . . . . . . . . . . . . . . . . . . . . . .Rare Wildlife Strategy Implementation 24 1,500 1,500. . . . . . . . . . . . . . . . . . . . . . . . . . . . . . . . . . . . . . .Remedial Action Support Agency Assistance 1,160 ------ ------. . . . . . . . . . . . . . . . . . . . . . . . . . . . . . . . . .Remedial Planning Support Agency Assistance 2,717 ------ ------. . . . . . . . . . . . . . . . . . . . . . . . . . . . . . . .Shortnose Sturgeon Research 67 200 200. . . . . . . . . . . . . . . . . . . . . . . . . . . . . . . . . . . . . . . . . . . . . .Southern Pine Beetle 17 100 100. . . . . . . . . . . . . . . . . . . . . . . . . . . . . . . . . . . . . . . . . . . . . . . . . . . . .State Recreational Trails 100 8,725 7,475. . . . . . . . . . . . . . . . . . . . . . . . . . . . . . . . . . . . . . . . . . . . . . . . . .State Wetlands Conservation Plan 81 250 250. . . . . . . . . . . . . . . . . . . . . . . . . . . . . . . . . . . . . . . . . . .State Wildlife Grant Projects ------ 1,000 1,000. . . . . . . . . . . . . . . . . . . . . . . . . . . . . . . . . . . . . . . . . . . . . . .State and EPA Data Management Grant 180 2,300 2,300. . . . . . . . . . . . . . . . . . . . . . . . . . . . . . . . . . . . . .Superfund Grants 4,182 30,450 40,450. . . . . . . . . . . . . . . . . . . . . . . . . . . . . . . . . . . . . . . . . . . . . . . . . . . . . . . .Underground Storage Tanks 1,587 2,055 1,800. . . . . . . . . . . . . . . . . . . . . . . . . . . . . . . . . . . . . . . . . . . . . . .Urban Community Air Toxics Program 112 800 800. . . . . . . . . . . . . . . . . . . . . . . . . . . . . . . . . . . . . .Voluntary Cleanup Program 234 ------ ------. . . . . . . . . . . . . . . . . . . . . . . . . . . . . . . . . . . . . . . . . . . . . . .Voluntary Cleanup Site Specific 228 ------ ------. . . . . . . . . . . . . . . . . . . . . . . . . . . . . . . . . . . . . . . . . . . .Water Monitoring and Planning 603 550 550. . . . . . . . . . . . . . . . . . . . . . . . . . . . . . . . . . . . . . . . . . . .Water Monitoring and Planning -- Federal Economic Stimulus ------ 1,618 ------. . . . . . . . . . . . . . . . . . . .Water Pollution Control Program 5,214 4,025 4,275. . . . . . . . . . . . . . . . . . . . . . . . . . . . . . . . . . . . . . . . . . .Water Pollution S106 Enhancements ------ 250 250. . . . . . . . . . . . . . . . . . . . . . . . . . . . . . . . . . . . . . . .Wildland and Urban Interface II ------ 100 100. . . . . . . . . . . . . . . . . . . . . . . . . . . . . . . . . . . . . . . . . . . .Wildlife Habitat Incentives (WHIP) 107 150 150. . . . . . . . . . . . . . . . . . . . . . . . . . . . . . . . . . . . . . . . .Wildlife Management Area Planning 183 300 300. . . . . . . . . . . . . . . . . . . . . . . . . . . . . . . . . . . . . . . .Various Federal Programs and Accruals --14,428 911 1,795. . . . . . . . . . . . . . . . . . . . . . . . . . . . . . . . . . . . . .
Total Department of Environmental Protection 52,443 383,041 182,235
Appendix I 50

SCHEDULE 2OTHER REVENUES
(thousands of dollars)----------------------Fiscal Year Ending June 30----------------------
2008 2009 2010Actual Estimated Estimated
Department of Health and Senior Services:Abstinence Education -- Family Health Services (FHS) 97 ------ ------. . . . . . . . . . . . . . . . . . . . . . . . . .Adult Viral Hepatitis Prevention 19 200 200. . . . . . . . . . . . . . . . . . . . . . . . . . . . . . . . . . . . . . . . . . . .Aging & Disability Resource Center Grant 116 ------ ------. . . . . . . . . . . . . . . . . . . . . . . . . . . . . . . . . . . .Asthma Surveillance and Coalition Building 296 457 457. . . . . . . . . . . . . . . . . . . . . . . . . . . . . . . . . .Bioterrorism Hospital Emergency Preparedness 14,266 11,576 11,576. . . . . . . . . . . . . . . . . . . . . . . . . . . . . . . .Birth Defects Surveillance Program 155 250 250. . . . . . . . . . . . . . . . . . . . . . . . . . . . . . . . . . . . . . . . .Breastfeeding Peer Counseling 307 300 300. . . . . . . . . . . . . . . . . . . . . . . . . . . . . . . . . . . . . . . . . . . . .CDC Nutrition -- Physical Activity & Obesity (NPAO) ------ 923 923. . . . . . . . . . . . . . . . . . . . . . . . . .Childhood Lead Poisoning 1,048 1,400 1,400. . . . . . . . . . . . . . . . . . . . . . . . . . . . . . . . . . . . . . . . . . . . . . . .Chronic Disease Prevention and Health Promotion Programs -- Public Health 1,380 1,900 1,900. . . . . . . .Clinical Laboratory Improvement Amendments Program 495 490 490. . . . . . . . . . . . . . . . . . . . . . . .Comprehensive AIDS Resources Grant 46,226 49,550 49,550. . . . . . . . . . . . . . . . . . . . . . . . . . . . . . . . . . . . . .Core Injury Prevention and Control Program ------ 300 300. . . . . . . . . . . . . . . . . . . . . . . . . . . . . . . . . .Demonstration Program to Conduct Health Assessments 411 627 627. . . . . . . . . . . . . . . . . . . . . . . . .Early Hearing Detection and Intervention (EHDI) Tracking, Research 188 210 210. . . . . . . . . . . . . .Early Intervention Program (Part C) -- Federal Economic Stimulus ------ ------ 5,400. . . . . . . . . . . . . . . . .Early Intervention for Infants and Toddlers with Disabilities (Part H) 9,860 13,000 13,000. . . . . . . . . . . . . . .Elderly Nutrition (Meals on Wheels) -- Federal Economic Stimulus ------ ------ 1,097. . . . . . . . . . . . . . . .Eliminating Disparities in Perinatal Health 631 500 500. . . . . . . . . . . . . . . . . . . . . . . . . . . . . . . . . . . .Emergency Medical Services for Children (EMSC) Partnership Grants 34 214 214. . . . . . . . . . . . . .Emergency Preparedness For Bioterrorism 28,117 30,886 30,886. . . . . . . . . . . . . . . . . . . . . . . . . . . . . . . . . . . .Enhanced HIV/AIDS Surveillance--Perinatal 175 212 212. . . . . . . . . . . . . . . . . . . . . . . . . . . . . . . . . .Enhanced Title XIX -- Federal Economic Stimulus ------ 180,606 319,071. . . . . . . . . . . . . . . . . . . . . . . . . . . . . .Environmental Tools for Dementia Care 156 150 150. . . . . . . . . . . . . . . . . . . . . . . . . . . . . . . . . . . . . .Family Planning Program -- Title X 3,495 4,200 4,200. . . . . . . . . . . . . . . . . . . . . . . . . . . . . . . . . . . . . . . . . .Federal Lead Abatement Program 374 454 424. . . . . . . . . . . . . . . . . . . . . . . . . . . . . . . . . . . . . . . . . . .Food Emergency Response Network -- E. Coli in Ground Beef ------ 165 165. . . . . . . . . . . . . . . . . . . .Food Inspection 514 477 477. . . . . . . . . . . . . . . . . . . . . . . . . . . . . . . . . . . . . . . . . . . . . . . . . . . . . . . . .Fundamental & Expanded Occupational Health 205 674 674. . . . . . . . . . . . . . . . . . . . . . . . . . . . . . . .HIV/AIDS Events without Care in New Jersey 338 373 373. . . . . . . . . . . . . . . . . . . . . . . . . . . . . . . .HIV/AIDS Prevention and Education Grant 12,804 18,000 15,000. . . . . . . . . . . . . . . . . . . . . . . . . . . . . . . . . . .HIV/AIDS Surveillance Grant 3,648 3,175 3,175. . . . . . . . . . . . . . . . . . . . . . . . . . . . . . . . . . . . . . . . . . . . .Housing Opportunities For Persons With AIDS 1,620 2,150 2,150. . . . . . . . . . . . . . . . . . . . . . . . . . . . . . . .Housing Opportunities for Incarcerated Persons with AIDS 453 1,763 2,101. . . . . . . . . . . . . . . . . . . . . .Immunization Project 5,800 7,786 7,786. . . . . . . . . . . . . . . . . . . . . . . . . . . . . . . . . . . . . . . . . . . . . . . . . . . .Immunization Project -- Federal Economic Stimulus ------ ------ 2,871. . . . . . . . . . . . . . . . . . . . . . . . . . . .Lead Training and Certification Enforcement Program 145 82 82. . . . . . . . . . . . . . . . . . . . . . . . . .Maternal and Child Health (MCH) Early Childhood Comprehensive System 140 140 140. . . . . . . . .Maternal and Child Health Block Grant 11,608 12,663 13,000. . . . . . . . . . . . . . . . . . . . . . . . . . . . . . . . . . . . . .Medicare/Medicaid Inspections of Nursing Facilities 11,025 16,672 16,672. . . . . . . . . . . . . . . . . . . . . . . . . . . .Minority AIDS Demo ------ 67 67. . . . . . . . . . . . . . . . . . . . . . . . . . . . . . . . . . . . . . . . . . . . . . . . . . . .Morbidity and Risk Behavior Surveillance 419 500 500. . . . . . . . . . . . . . . . . . . . . . . . . . . . . . . . . . . .National Cancer Prevention and Control -- Public Health 4,527 7,271 7,271. . . . . . . . . . . . . . . . . . . . . . . . .National Family Caregiver Program 5,332 5,200 5,200. . . . . . . . . . . . . . . . . . . . . . . . . . . . . . . . . . . . . . . . .New Jersey’s Reducing Health Disparities Initiative 227 160 160. . . . . . . . . . . . . . . . . . . . . . . . . . . .Nurse Aide Certification Program ------ 1,000 1,000. . . . . . . . . . . . . . . . . . . . . . . . . . . . . . . . . . . . . . . . . . .Nursing Facilities Transition Grant ------ 600 600. . . . . . . . . . . . . . . . . . . . . . . . . . . . . . . . . . . . . . . . . .Older Americans Act -- Title III 33,464 34,236 34,236. . . . . . . . . . . . . . . . . . . . . . . . . . . . . . . . . . . . . . . . . . . . .Pediatric AIDS Health Care Demonstration Project 2,134 2,850 2,850. . . . . . . . . . . . . . . . . . . . . . . . . . . . .Pregnancy Risk Assessment Monitoring System 116 750 750. . . . . . . . . . . . . . . . . . . . . . . . . . . . . . .Preventative Health and Health Services Block Grant 2,419 4,351 4,351. . . . . . . . . . . . . . . . . . . . . . . . . . .Public Employees Occupational Safety and Health -- State Plan ------ 900 900. . . . . . . . . . . . . . . . . . .Rape Prevention and Education Program 1,397 1,616 1,366. . . . . . . . . . . . . . . . . . . . . . . . . . . . . . . . . . . . .Research on Ecology of Lyme Disease in US 234 295 295. . . . . . . . . . . . . . . . . . . . . . . . . . . . . . . . . .Senior Farmers Market Nutrition Program 609 1,000 1,000. . . . . . . . . . . . . . . . . . . . . . . . . . . . . . . . . . . .Supplemental Food -- Women, Infants and Children (WIC) Federal Economic Stimulus ------ ------ 6,000Supplemental Food Program -- Women, Infants, and Children (WIC) 119,156 135,000 135,000. . . . . . . . . . . . . . .Surveillance, Epidemiology and End Results (SEER) 619 1,319 1,319. . . . . . . . . . . . . . . . . . . . . . . . . . .Traumatic Brain Injury Surveillance ------ 105 105. . . . . . . . . . . . . . . . . . . . . . . . . . . . . . . . . . . . . . . . .Tuberculosis Control Program 4,830 6,095 6,095. . . . . . . . . . . . . . . . . . . . . . . . . . . . . . . . . . . . . . . . . . . . . .United States Department of Agriculture (USDA) Older Americans Act -- Title III 3,672 4,000 4,000. . . . .Universal Newborn Hearing Screening 204 250 250. . . . . . . . . . . . . . . . . . . . . . . . . . . . . . . . . . . . . . .Venereal Disease Project 2,952 3,882 3,882. . . . . . . . . . . . . . . . . . . . . . . . . . . . . . . . . . . . . . . . . . . . . . . . . .Vital Statistics Component 484 1,100 1,100. . . . . . . . . . . . . . . . . . . . . . . . . . . . . . . . . . . . . . . . . . . . . . . .West Nile Virus -- Laboratory ------ 200 200. . . . . . . . . . . . . . . . . . . . . . . . . . . . . . . . . . . . . . . . . . . . . .West Nile Virus -- Public Health 850 1,942 1,942. . . . . . . . . . . . . . . . . . . . . . . . . . . . . . . . . . . . . . . . . . . .Women, Infants, and Children (WIC) Farmer’s Market Nutrition Program 1,001 2,600 2,600. . . . . . . . . . .Various Federal Programs and Accruals 1,807 7,699 7,700. . . . . . . . . . . . . . . . . . . . . . . . . . . . . . . . . . . . . .
Total Department of Health and Senior Services 342,599 587,513 738,742
Appendix I 51

SCHEDULE 2OTHER REVENUES
(thousands of dollars)----------------------Fiscal Year Ending June 30----------------------
2008 2009 2010Actual Estimated Estimated
Department of Human Services:Access to Recovery 2,797 ------ ------. . . . . . . . . . . . . . . . . . . . . . . . . . . . . . . . . . . . . . . . . . . . . . . . . . . . . .Block Grant Mental Health Services 11,339 11,505 11,487. . . . . . . . . . . . . . . . . . . . . . . . . . . . . . . . . . . . . . . . .Child Care Block Grant 104,397 115,280 108,415. . . . . . . . . . . . . . . . . . . . . . . . . . . . . . . . . . . . . . . . . . . . . . . . . . .Child Care Federal Stimulus Funding ------ 12,410 17,100. . . . . . . . . . . . . . . . . . . . . . . . . . . . . . . . . . . . . . . .Child Support Enforcement Program 133,407 179,145 172,926. . . . . . . . . . . . . . . . . . . . . . . . . . . . . . . . . . . . . . . .Child Support Incentive Funding ------ ------ 15,456. . . . . . . . . . . . . . . . . . . . . . . . . . . . . . . . . . . . . . . . . . .Child Support Title IV--D -- Federal Economic Stimulus ------ 12,000 16,000. . . . . . . . . . . . . . . . . . . . . . . . .Developmental Disabilities Council 1,556 1,621 1,621. . . . . . . . . . . . . . . . . . . . . . . . . . . . . . . . . . . . . . . . .Enhanced Title XIX -- Federal Economic Stimulus ------ 419,394 740,929. . . . . . . . . . . . . . . . . . . . . . . . . . . . . .Food Stamp Administration -- Federal Economic Stimulus ------ 1,676 2,235. . . . . . . . . . . . . . . . . . . . . . .Food Stamp Program 90,622 91,598 103,156. . . . . . . . . . . . . . . . . . . . . . . . . . . . . . . . . . . . . . . . . . . . . . . . . . . . .Foster Grandparents Program 798 1,153 1,192. . . . . . . . . . . . . . . . . . . . . . . . . . . . . . . . . . . . . . . . . . . . . .Independent Living 1,320 1,069 1,034. . . . . . . . . . . . . . . . . . . . . . . . . . . . . . . . . . . . . . . . . . . . . . . . . . . . . .Independent Living -- Federal Economic Stimulus ------ ------ 39. . . . . . . . . . . . . . . . . . . . . . . . . . . . . .Projects for Assistance in Transition from Homelessness (PATH) 1,923 1,922 1,922. . . . . . . . . . . . . . . . . .Refugee Resettlement Program 4,706 5,615 3,780. . . . . . . . . . . . . . . . . . . . . . . . . . . . . . . . . . . . . . . . . . . . .Restraint and Seclusion Federal Grant 48 ------ ------. . . . . . . . . . . . . . . . . . . . . . . . . . . . . . . . . . . . . . .Services for Older Blind Individuals -- Federal Economic Stimulus ------ ------ 513. . . . . . . . . . . . . . . . .Social Services Block Grant 49,454 51,215 48,996. . . . . . . . . . . . . . . . . . . . . . . . . . . . . . . . . . . . . . . . . . . . . . .Strategic Prevention Framework 103 2,093 2,093. . . . . . . . . . . . . . . . . . . . . . . . . . . . . . . . . . . . . . . . . . . .Substance Abuse Block Grant 50,066 51,882 51,882. . . . . . . . . . . . . . . . . . . . . . . . . . . . . . . . . . . . . . . . . . . . . .Temporary Assistance to Needy Families Block Grant 417,814 445,135 455,501. . . . . . . . . . . . . . . . . . . . . . . . . . .Title XIX Child Residential 57,529 85,073 98,629. . . . . . . . . . . . . . . . . . . . . . . . . . . . . . . . . . . . . . . . . . . . . . . .Title XIX Community Care Waiver 273,342 311,314 315,171. . . . . . . . . . . . . . . . . . . . . . . . . . . . . . . . . . . . . . . . . .Title XIX ICF/MR 313,387 325,411 333,806. . . . . . . . . . . . . . . . . . . . . . . . . . . . . . . . . . . . . . . . . . . . . . . . . . . . . . .Title XIX Medical Assistance 3,541,113 3,694,845 3,973,641. . . . . . . . . . . . . . . . . . . . . . . . . . . . . . . . . . . . . . . . . . . . . .Title XX Urban Empowerment Zone 1,974 ------ ------. . . . . . . . . . . . . . . . . . . . . . . . . . . . . . . . . . . . . . . .Title XXI Children’s Health Insurance Program 309,390 342,370 535,286. . . . . . . . . . . . . . . . . . . . . . . . . . . . . . . .Vocational Rehabilitation -- Federal Economic Stimulus ------ ------ 946. . . . . . . . . . . . . . . . . . . . . . . . .Vocational Rehabilitation Act, Section 120 11,918 11,718 12,133. . . . . . . . . . . . . . . . . . . . . . . . . . . . . . . . . . . .Various Federal Programs and Accruals 134,210 5,073 5,263. . . . . . . . . . . . . . . . . . . . . . . . . . . . . . . . . . . . . .
Total Department of Human Services 5,513,213 6,180,517 7,031,152
Department of Labor and Workforce Development:Adult and Continuing Education -- Workforce Investment Act 16,147 20,071 20,071. . . . . . . . . . . . . . . . . . . . .Comprehensive Services for Independent Living 153 600 600. . . . . . . . . . . . . . . . . . . . . . . . . . . . . . .Current Employment Statistics 2,509 2,978 2,375. . . . . . . . . . . . . . . . . . . . . . . . . . . . . . . . . . . . . . . . . . . . .Disability Determination Services 51,197 54,100 56,025. . . . . . . . . . . . . . . . . . . . . . . . . . . . . . . . . . . . . . . . . . .Disabled Veterans’ Outreach Program 2,209 2,900 3,000. . . . . . . . . . . . . . . . . . . . . . . . . . . . . . . . . . . . . . .Employment Services 22,350 26,100 25,744. . . . . . . . . . . . . . . . . . . . . . . . . . . . . . . . . . . . . . . . . . . . . . . . . . . .Employment Services -- Federal Economic Stimulus ------ 10,663 ------. . . . . . . . . . . . . . . . . . . . . . . . . . . .Employment Services -- One--Stop Shopping 14 350 ------. . . . . . . . . . . . . . . . . . . . . . . . . . . . . . . . . .Employment Services Cost Reimbursable Grants -- Migrant Housing ------ 50 50. . . . . . . . . . . . . . .Employment Services Grants -- Alien Labor Certification 476 2,403 2,202. . . . . . . . . . . . . . . . . . . . . . . .Employment Services Reemployment Services ------ 1,100 ------. . . . . . . . . . . . . . . . . . . . . . . . . . . . . . . .Federal Public Employees Occupational Safety and Health Act 1,496 2,250 2,250. . . . . . . . . . . . . . . . . . . .High Growth Grants -- Federal Economic Stimulus ------ 15,000 ------. . . . . . . . . . . . . . . . . . . . . . . . . . . . .Independent Living -- Federal Economic Stimulus ------ 309 ------. . . . . . . . . . . . . . . . . . . . . . . . . . . . . .Local Veterans’ Employment Representatives 1,002 1,700 1,600. . . . . . . . . . . . . . . . . . . . . . . . . . . . . . . . .National Council on Aging -- Senior Community Services Employment Project 2,733 3,020 3,020. . . . . . .National Emergency Grant -- Federal Economic Stimulus ------ 4,000 ------. . . . . . . . . . . . . . . . . . . . . . . .Navigator Project 794 ------ ------. . . . . . . . . . . . . . . . . . . . . . . . . . . . . . . . . . . . . . . . . . . . . . . . . . . . . . . .Occupational Informational Coordinating Program ------ 175 ------. . . . . . . . . . . . . . . . . . . . . . . . . . . . .Occupational Safety Health Act -- On--Site Consultation 1,534 2,800 2,800. . . . . . . . . . . . . . . . . . . . . . . . .Occupational Safety and Health Administration Data Collection Survey ------ 74 ------. . . . . . . . . . . . .Old Age and Survivor Insurance Disability Determination Services ------ 1,000 1,000. . . . . . . . . . . . . . . .One Stop Labor Market Information 672 1,068 673. . . . . . . . . . . . . . . . . . . . . . . . . . . . . . . . . . . . . . . . .Redesigned Occupational Safety and Health (ROSH) 256 269 201. . . . . . . . . . . . . . . . . . . . . . . . . . .Rehabilitation of Supplemental Security Income Beneficiaries 1,887 2,000 2,000. . . . . . . . . . . . . . . . . . . .Senior Employment Program -- Federal Economic Stimulus ------ 3,420 ------. . . . . . . . . . . . . . . . . . . . . .Supported Employment 593 975 975. . . . . . . . . . . . . . . . . . . . . . . . . . . . . . . . . . . . . . . . . . . . . . . . . . .Technical Assistance Training ------ 1,700 1,700. . . . . . . . . . . . . . . . . . . . . . . . . . . . . . . . . . . . . . . . . . . . . .Technology Related Assistance Project 618 400 550. . . . . . . . . . . . . . . . . . . . . . . . . . . . . . . . . . . . . . .Trade Act -- Federal Economic Stimulus ------ 8,674 8,674. . . . . . . . . . . . . . . . . . . . . . . . . . . . . . . . . . . . . .Trade Adjustment Assistance Project 2,878 4,200 4,200. . . . . . . . . . . . . . . . . . . . . . . . . . . . . . . . . . . . . . . .Unemployment Insurance 112,058 151,607 151,640. . . . . . . . . . . . . . . . . . . . . . . . . . . . . . . . . . . . . . . . . . . . . . . . .Unemployment Insurance -- Federal Economic Stimulus ------ 14,773 ------. . . . . . . . . . . . . . . . . . . . . . . . .Vocational Rehabilitation -- Federal Economic Stimulus ------ 7,564 ------. . . . . . . . . . . . . . . . . . . . . . . . .Vocational Rehabilitation Act of 1973 48,734 48,825 50,325. . . . . . . . . . . . . . . . . . . . . . . . . . . . . . . . . . . . . . .
Appendix I 52

SCHEDULE 2OTHER REVENUES
(thousands of dollars)----------------------Fiscal Year Ending June 30----------------------
2008 2009 2010Actual Estimated Estimated
WIA -- WIRED Initiative 252 ------ ------. . . . . . . . . . . . . . . . . . . . . . . . . . . . . . . . . . . . . . . . . . . . . . . . . .Work Opportunity Tax Credit 723 750 750. . . . . . . . . . . . . . . . . . . . . . . . . . . . . . . . . . . . . . . . . . . . . .Workforce Investment Act 38,792 72,643 72,434. . . . . . . . . . . . . . . . . . . . . . . . . . . . . . . . . . . . . . . . . . . . . . . . .Workforce Investment Act -- Federal Economic Stimulus ------ 62,929 ------. . . . . . . . . . . . . . . . . . . . . . . .Workforce Investment Act Title IIID Discretionary Funding 407 4,000 4,000. . . . . . . . . . . . . . . . . . . . . .Workforce Investment Act-- Title IIC Youth Training 21,460 ------ ------. . . . . . . . . . . . . . . . . . . . . . . . . . . .Various Federal Programs and Accruals 23,240 280 190. . . . . . . . . . . . . . . . . . . . . . . . . . . . . . . . . . . . . .
Total Department of Labor and Workforce Development 355,184 537,720 419,049
Department of Law and Public Safety:Americorps ------ ------ 101. . . . . . . . . . . . . . . . . . . . . . . . . . . . . . . . . . . . . . . . . . . . . . . . . . . . . . . . . . . .Anti Trafficking Task Force 80 600 600. . . . . . . . . . . . . . . . . . . . . . . . . . . . . . . . . . . . . . . . . . . . . . .Anti--Gang Initiative 333 1,000 1,000. . . . . . . . . . . . . . . . . . . . . . . . . . . . . . . . . . . . . . . . . . . . . . . . . . . . .Buffer Zone Protection Program 1,978 1,000 1,000. . . . . . . . . . . . . . . . . . . . . . . . . . . . . . . . . . . . . . . . . . . .Bulletproof Vest Partnership 73 850 850. . . . . . . . . . . . . . . . . . . . . . . . . . . . . . . . . . . . . . . . . . . . . . .Byrne Discretionary Grant -- Statewide Response to Violent Crime Reduction ------ 750 750. . . . . . . .Child Passenger Protection Education 10 ------ ------. . . . . . . . . . . . . . . . . . . . . . . . . . . . . . . . . . . . . . . .Child Safety/Child Booster Seats 441 4,000 4,000. . . . . . . . . . . . . . . . . . . . . . . . . . . . . . . . . . . . . . . . . . .Citizen Corps Program 282 360 360. . . . . . . . . . . . . . . . . . . . . . . . . . . . . . . . . . . . . . . . . . . . . . . . . . .Convicted Offender In--House (DNA) 874 1,400 1,400. . . . . . . . . . . . . . . . . . . . . . . . . . . . . . . . . . . . . . .DNA Capacity Enhancement Program Formula Grant 457 614 614. . . . . . . . . . . . . . . . . . . . . . . . . . .Domestic Marijuana Eradication Suppression Program 80 82 82. . . . . . . . . . . . . . . . . . . . . . . . . .Domestic Preparedness Equipment 21,710 ------ ------. . . . . . . . . . . . . . . . . . . . . . . . . . . . . . . . . . . . . . . . . .Drunk Driver Prevention 1,981 7,972 7,972. . . . . . . . . . . . . . . . . . . . . . . . . . . . . . . . . . . . . . . . . . . . . . . . . .Edward Byrne Memorial Grant 2,840 ------ ------. . . . . . . . . . . . . . . . . . . . . . . . . . . . . . . . . . . . . . . . . . . . .Emergency Food and Shelter -- Federal Economic Stimulus ------ ------ 2,800. . . . . . . . . . . . . . . . . . . . . .Emergency Management Performance Grant -- Non Terrorism 1,229 7,500 7,500. . . . . . . . . . . . . . . . . . . .Enforcing Underage Drinking Laws 485 350 350. . . . . . . . . . . . . . . . . . . . . . . . . . . . . . . . . . . . . . . . .Equal Employment Opportunity Commission 389 400 400. . . . . . . . . . . . . . . . . . . . . . . . . . . . . . . . .Fatality Analysis Reporting System (FARS) ------ 230 230. . . . . . . . . . . . . . . . . . . . . . . . . . . . . . . . . . .Flood Disaster Assistance 17,165 ------ ------. . . . . . . . . . . . . . . . . . . . . . . . . . . . . . . . . . . . . . . . . . . . . . . . .Flood Mitigation Assistance 3,005 3,500 3,500. . . . . . . . . . . . . . . . . . . . . . . . . . . . . . . . . . . . . . . . . . . . . . .Flood Warning Systems Enhancement Project 84 ------ ------. . . . . . . . . . . . . . . . . . . . . . . . . . . . . . . . .Forensic Casework DNA Backlog Reduction 508 ------ ------. . . . . . . . . . . . . . . . . . . . . . . . . . . . . . . . . .Gang Prevention Coordination Assistance ------ 350 350. . . . . . . . . . . . . . . . . . . . . . . . . . . . . . . . . . . .Hazardous Materials Transportation 290 492 492. . . . . . . . . . . . . . . . . . . . . . . . . . . . . . . . . . . . . . . . .High Intensity Drug Trafficking Area (HIDTA) ------ 50 50. . . . . . . . . . . . . . . . . . . . . . . . . . . . . . . .High Risk Youth Offender Re--Entry Initiative ------ 1,000 ------. . . . . . . . . . . . . . . . . . . . . . . . . . . . . . . . .Highway Traffic Safety 5,162 8,915 8,915. . . . . . . . . . . . . . . . . . . . . . . . . . . . . . . . . . . . . . . . . . . . . . . . . . .Homeland Security Grant Program 18,633 25,670 28,194. . . . . . . . . . . . . . . . . . . . . . . . . . . . . . . . . . . . . . . . . .Incident Command 876 1,500 1,500. . . . . . . . . . . . . . . . . . . . . . . . . . . . . . . . . . . . . . . . . . . . . . . . . . . . . .Innovative Seat Belt Use 8 ------ ------. . . . . . . . . . . . . . . . . . . . . . . . . . . . . . . . . . . . . . . . . . . . . . . . . .Internet Crimes Against Children 301 700 700. . . . . . . . . . . . . . . . . . . . . . . . . . . . . . . . . . . . . . . . . . .Internet Crimes Against Children -- Federal Economic Stimulus ------ ------ 969. . . . . . . . . . . . . . . . . . .Justice Assistance Grant (JAG) 7,637 10,000 10,000. . . . . . . . . . . . . . . . . . . . . . . . . . . . . . . . . . . . . . . . . . . . .Justice Assistance Grant (JAG) -- Federal Economic Stimulus ------ ------ 29,800. . . . . . . . . . . . . . . . . . . . .Juvenile Accountability Incentive Block Grant (JAIBG) 2,620 1,230 1,078. . . . . . . . . . . . . . . . . . . . . . . . .Juvenile Justice Delinquency Prevention 1,550 2,333 1,484. . . . . . . . . . . . . . . . . . . . . . . . . . . . . . . . . . . . .Medicaid Fraud Unit 3,050 4,745 4,745. . . . . . . . . . . . . . . . . . . . . . . . . . . . . . . . . . . . . . . . . . . . . . . . . . . . .Metropolitan Medical Response System ------ 642 642. . . . . . . . . . . . . . . . . . . . . . . . . . . . . . . . . . . . . .Motorcycle Safety 131 1,140 1,140. . . . . . . . . . . . . . . . . . . . . . . . . . . . . . . . . . . . . . . . . . . . . . . . . . . . . . .National Criminal History Program -- Office of the Attorney General ------ 160 160. . . . . . . . . . . . . . .Northeast Hazardous Waste Project--Resource Conservation and Recovery Act 147 128 128. . . . . . .Occupant Protection Grant 814 4,500 4,500. . . . . . . . . . . . . . . . . . . . . . . . . . . . . . . . . . . . . . . . . . . . . . . .Paul Coverdell National Forensic Science Improvement 490 331 331. . . . . . . . . . . . . . . . . . . . . . . . .Port Security Grant Program -- Delaware Bay (Camden/Phila) 815 3,000 4,200. . . . . . . . . . . . . . . . . . . . .Port Security Grant Program -- New York/New Jersey 698 8,000 8,000. . . . . . . . . . . . . . . . . . . . . . . . . . .Pre--Disaster Mitigation Grant (Competitive) 435 3,000 3,000. . . . . . . . . . . . . . . . . . . . . . . . . . . . . . . . . .Prevent Operations of Motor Vehicles by Intoxicated Persons 46 ------ ------. . . . . . . . . . . . . . . . . . . . .Project Safe Neighborhoods 945 1,060 1,060. . . . . . . . . . . . . . . . . . . . . . . . . . . . . . . . . . . . . . . . . . . . . . .Public Safety Interoperability Communications Grant Program ------ 1,600 1,400. . . . . . . . . . . . . . . . . . . .Racial Profiling Prevention ------ 3,000 1,000. . . . . . . . . . . . . . . . . . . . . . . . . . . . . . . . . . . . . . . . . . . . . . . .Radiological Dispersal Device Protective Measures Program 1,373 ------ ------. . . . . . . . . . . . . . . . . . . . .Recreational Boating Safety 1,881 3,000 3,000. . . . . . . . . . . . . . . . . . . . . . . . . . . . . . . . . . . . . . . . . . . . . . .Regional Catastrophic Preparedness Grant ------ 2,000 2,000. . . . . . . . . . . . . . . . . . . . . . . . . . . . . . . . . . . .Repetitive Flood Claim Program -- FEMA 1,796 ------ ------. . . . . . . . . . . . . . . . . . . . . . . . . . . . . . . . . . . .Residential Treatment for Substance Abuse 284 1,000 1,000. . . . . . . . . . . . . . . . . . . . . . . . . . . . . . . . . . .Safety Belt Performance Grants 2,213 10,492 10,492. . . . . . . . . . . . . . . . . . . . . . . . . . . . . . . . . . . . . . . . . . . .Safety Incentive Grants 34 ------ ------. . . . . . . . . . . . . . . . . . . . . . . . . . . . . . . . . . . . . . . . . . . . . . . . . . .State Traffic Safety Information System 658 5,500 5,500. . . . . . . . . . . . . . . . . . . . . . . . . . . . . . . . . . . . . .
Appendix I 53

SCHEDULE 2OTHER REVENUES
(thousands of dollars)----------------------Fiscal Year Ending June 30----------------------
2008 2009 2010Actual Estimated Estimated
State Victim Assistance Academy Initiative ------ 100 100. . . . . . . . . . . . . . . . . . . . . . . . . . . . . . . . . . .Title V Funding 224 1,500 50. . . . . . . . . . . . . . . . . . . . . . . . . . . . . . . . . . . . . . . . . . . . . . . . . . . . . . . . .UASI Nonprofit Security Grant Program (NSGP) ------ 1,100 835. . . . . . . . . . . . . . . . . . . . . . . . . . . . . .Urban Area Security Initiative 19,895 38,000 36,000. . . . . . . . . . . . . . . . . . . . . . . . . . . . . . . . . . . . . . . . . . . . . .Victim Assistance Grants 12,199 12,000 12,000. . . . . . . . . . . . . . . . . . . . . . . . . . . . . . . . . . . . . . . . . . . . . . . . .Victim Assistance Grants -- Federal Economic Stimulus ------ ------ 1,074. . . . . . . . . . . . . . . . . . . . . . . . .Victim Compensation Award ------ 6,000 2,500. . . . . . . . . . . . . . . . . . . . . . . . . . . . . . . . . . . . . . . . . . . . . . .Victim Compensation Award -- Federal Economic Stimulus ------ ------ 1,411. . . . . . . . . . . . . . . . . . . . . .Violence Against Women Act--Criminal Justice 3,066 4,000 4,000. . . . . . . . . . . . . . . . . . . . . . . . . . . . . . . .Violence Against Women Act--Criminal Justice -- Federal Economic Stimulus ------ ------ 6,200. . . . . . . .Warren Grove Fire -- 2007 746 ------ ------. . . . . . . . . . . . . . . . . . . . . . . . . . . . . . . . . . . . . . . . . . . . . . . . .Various Federal Programs and Accruals --18,658 494 494. . . . . . . . . . . . . . . . . . . . . . . . . . . . . . . . . . . . . .
Total Department of Law and Public Safety 124,363 199,340 234,003
Department of Military and Veterans’ Affairs:Administrative Services Activities 88 60 60. . . . . . . . . . . . . . . . . . . . . . . . . . . . . . . . . . . . . . . . . .Antiterrorism Program Manager 106 110 100. . . . . . . . . . . . . . . . . . . . . . . . . . . . . . . . . . . . . . . . . . . .Armory Renovations and Improvements 2,070 3,900 4,000. . . . . . . . . . . . . . . . . . . . . . . . . . . . . . . . . . . . . .Army Facilities Service Contracts 2,423 2,695 2,877. . . . . . . . . . . . . . . . . . . . . . . . . . . . . . . . . . . . . . . . . . .Army National Guard Electronic Security System 72 300 300. . . . . . . . . . . . . . . . . . . . . . . . . . . . . .Army National Guard Statewide Security Agreement 488 550 600. . . . . . . . . . . . . . . . . . . . . . . . . . .Army National Guard Sustainable Range Program 185 150 150. . . . . . . . . . . . . . . . . . . . . . . . . . . . . .Army Training and Technology Lab 740 920 1,130. . . . . . . . . . . . . . . . . . . . . . . . . . . . . . . . . . . . . . . . .Atlantic City Air Base -- Service Contracts 2,875 3,159 3,373. . . . . . . . . . . . . . . . . . . . . . . . . . . . . . . . . . . .Atlantic City Environmental 37 116 90. . . . . . . . . . . . . . . . . . . . . . . . . . . . . . . . . . . . . . . . . . . . . . .Atlantic City Operations and Maintenance 102 130 150. . . . . . . . . . . . . . . . . . . . . . . . . . . . . . . . . . . .Atlantic City Sustainment, Restoration and Modernization 777 580 650. . . . . . . . . . . . . . . . . . . . . . .Brigadier General Doyle Memorial Cemetery Building Project ------ 7,500 8,700. . . . . . . . . . . . . . . . . . . .Combined Logistics Facility 5,070 ------ ------. . . . . . . . . . . . . . . . . . . . . . . . . . . . . . . . . . . . . . . . . . . . . . .Coyle Field Atlantic City 23 26 27. . . . . . . . . . . . . . . . . . . . . . . . . . . . . . . . . . . . . . . . . . . . . . . . .Dining Facility Operations 157 150 150. . . . . . . . . . . . . . . . . . . . . . . . . . . . . . . . . . . . . . . . . . . . . . . .Facilities Support Contract 5,536 6,625 7,078. . . . . . . . . . . . . . . . . . . . . . . . . . . . . . . . . . . . . . . . . . . . . . . .Federal Distance Learning Program 76 150 160. . . . . . . . . . . . . . . . . . . . . . . . . . . . . . . . . . . . . . . . .Fire Fighter/Crash Rescue Service Cooperative Funding Agreement 2,428 1,686 1,878. . . . . . . . . . . . . . . .Hazardous Waste Environmental Protection Program 532 800 800. . . . . . . . . . . . . . . . . . . . . . . . . . . .McGuire Air Force Base -- Service Contracts 2,917 2,438 3,315. . . . . . . . . . . . . . . . . . . . . . . . . . . . . . . . . .McGuire Air Force Base Environmental 49 70 90. . . . . . . . . . . . . . . . . . . . . . . . . . . . . . . . . . . . . .McGuire Operations and Maintenance 62 105 110. . . . . . . . . . . . . . . . . . . . . . . . . . . . . . . . . . . . . . .Medicare Part A Receipts for Resident Care and Operational Costs 6,269 6,300 6,300. . . . . . . . . . . . . . . . .National Guard Communications Agreement. 407 900 950. . . . . . . . . . . . . . . . . . . . . . . . . . . . . . . . .Natural and Cultural Resources Management 2 5 5. . . . . . . . . . . . . . . . . . . . . . . . . . . . . . . . . .New Jersey National Guard Challenge Youth Program 2,232 3,250 3,100. . . . . . . . . . . . . . . . . . . . . . . . . .Training and Equipment -- Pool Sites 444 450 500. . . . . . . . . . . . . . . . . . . . . . . . . . . . . . . . . . . . . . . .Transitional Housing ------ 360 360. . . . . . . . . . . . . . . . . . . . . . . . . . . . . . . . . . . . . . . . . . . . . . . . . . . . .Veterans’ Education Monitoring ------ 690 595. . . . . . . . . . . . . . . . . . . . . . . . . . . . . . . . . . . . . . . . . . . .Warren Grove Sustainment Restoration & Modernization 4 6 7. . . . . . . . . . . . . . . . . . . . . . . .Warren Grove/Coyle Field 41 65 70. . . . . . . . . . . . . . . . . . . . . . . . . . . . . . . . . . . . . . . . . . . . . . . .Various Federal Programs and Accruals 723 70 66. . . . . . . . . . . . . . . . . . . . . . . . . . . . . . . . . . . . . .
Total Department of Military and Veterans’ Affairs 36,935 44,316 47,741
Department of the Public Advocate:Guardianship Program ------ 223 223. . . . . . . . . . . . . . . . . . . . . . . . . . . . . . . . . . . . . . . . . . . . . . . . . . . .
Department of State:American Indian Programs ------ 150 150. . . . . . . . . . . . . . . . . . . . . . . . . . . . . . . . . . . . . . . . . . . . . . . .Americorps Grants 1,785 4,680 3,980. . . . . . . . . . . . . . . . . . . . . . . . . . . . . . . . . . . . . . . . . . . . . . . . . . . . . .College Access Challenge Grant Program ------ 274 1,920. . . . . . . . . . . . . . . . . . . . . . . . . . . . . . . . . . . .Election Assistance for Persons with Disabilities ------ 315 315. . . . . . . . . . . . . . . . . . . . . . . . . . . . . . .Gaining Early Awareness and Readiness for Undergraduate Programs (GEAR UP) 4,901 3,500 3,500. . . .Institute of Museum Services -- General Support Grant ------ 125 ------. . . . . . . . . . . . . . . . . . . . . . . . . .Leveraging Educational Assistance Partnership 1,839 1,803 1,803. . . . . . . . . . . . . . . . . . . . . . . . . . . . . . . .National Endowment for the Arts Partnership ------ 891 895. . . . . . . . . . . . . . . . . . . . . . . . . . . . . . . . .National Health Service Corps -- Student Loan Repayment Program 175 ------ ------. . . . . . . . . . . . . . . .National Historical Publications and Records Commission Grants ------ 57 ------. . . . . . . . . . . . . . . . .National Telecommunications Information Agency 725 600 600. . . . . . . . . . . . . . . . . . . . . . . . . . . . .Public Telecommunications Facilities Program -- WNJB/WNJS Transmitter Upgrade 249 ------ ------. .Save America’s Treasures Grant 75 ------ ------. . . . . . . . . . . . . . . . . . . . . . . . . . . . . . . . . . . . . . . . . . . .Student Loan Administrative Cost Deduction and Allowance 18,238 18,360 19,270. . . . . . . . . . . . . . . . . . . . .Tuition Assistance Grants -- Federal Economic Stimulus ------ ------ 34,080. . . . . . . . . . . . . . . . . . . . . . . . .Various Federal Programs and Accruals --401 ------ ------. . . . . . . . . . . . . . . . . . . . . . . . . . . . . . . . . . . . . .
Appendix I 54

SCHEDULE 2OTHER REVENUES
(thousands of dollars)----------------------Fiscal Year Ending June 30----------------------
2008 2009 2010Actual Estimated Estimated
Total Department of State 27,586 30,755 66,513
Department of Transportation:Airport Fund ------ 2,000 1,500. . . . . . . . . . . . . . . . . . . . . . . . . . . . . . . . . . . . . . . . . . . . . . . . . . . . . . . . . . .Boating Safety (New Jersey Maritime Program) ------ 1,600 1,600. . . . . . . . . . . . . . . . . . . . . . . . . . . . . . . .Commercial Drivers’ License Information System Modernization ------ 300 300. . . . . . . . . . . . . . . . . .Commercial Drivers’ License Program ------ 1,445 1,445. . . . . . . . . . . . . . . . . . . . . . . . . . . . . . . . . . . . . . .Commercial Vehicle Information Systems Network ------ 2,000 1,000. . . . . . . . . . . . . . . . . . . . . . . . . . . . .Federal Rail Administration ------ 491 950. . . . . . . . . . . . . . . . . . . . . . . . . . . . . . . . . . . . . . . . . . . . . . .Highway Planning and Research 13,144 18,600 18,600. . . . . . . . . . . . . . . . . . . . . . . . . . . . . . . . . . . . . . . . . . . .Metropolitan Planning Funds 16,088 12,200 12,200. . . . . . . . . . . . . . . . . . . . . . . . . . . . . . . . . . . . . . . . . . . . . .Motor Carrier Safety Assistance Program 4,695 14,910 15,410. . . . . . . . . . . . . . . . . . . . . . . . . . . . . . . . . . . . .NJ Transportation Planning Assistance ------ 5,100 4,600. . . . . . . . . . . . . . . . . . . . . . . . . . . . . . . . . . . . . . .New Jersey Maritime Program ------ 1,600 1,600. . . . . . . . . . . . . . . . . . . . . . . . . . . . . . . . . . . . . . . . . . . . .Odometer Fraud Grant ------ 38 38. . . . . . . . . . . . . . . . . . . . . . . . . . . . . . . . . . . . . . . . . . . . . . . . . . . .Performance & Registration Information Systems Management ------ 500 500. . . . . . . . . . . . . . . . . . .Real ID Demonstration Grant ------ 1,600 1,600. . . . . . . . . . . . . . . . . . . . . . . . . . . . . . . . . . . . . . . . . . . . . .Supportive Services Highway Construction Training Program ------ 500 500. . . . . . . . . . . . . . . . . . . .
Total Department of Transportation 33,927 62,884 61,843
Department of the Treasury:Clean Energy Fund -- Federal Economic Stimulus ------ 30,000 59,900. . . . . . . . . . . . . . . . . . . . . . . . . . . . . .Diamond Shamrock Oil Overcharge Settlement ------ 717 717. . . . . . . . . . . . . . . . . . . . . . . . . . . . . . . .Division of Gas Expansion 402 600 600. . . . . . . . . . . . . . . . . . . . . . . . . . . . . . . . . . . . . . . . . . . . . . . .NJ Partnership for the National Map 4 ------ ------. . . . . . . . . . . . . . . . . . . . . . . . . . . . . . . . . . . . . . . . .Office of the Medicaid Inspector General ------ 2,297 2,297. . . . . . . . . . . . . . . . . . . . . . . . . . . . . . . . . . . . .State Energy Conservation -- Federal Economic Stimulus ------ 6,000 12,000. . . . . . . . . . . . . . . . . . . . . . . .State Energy Conservation Program 2,693 2,675 2,675. . . . . . . . . . . . . . . . . . . . . . . . . . . . . . . . . . . . . . . . .Wind Powering America -- Wind Working Group 12 ------ ------. . . . . . . . . . . . . . . . . . . . . . . . . . . . . . .Various Federal Programs and Accruals --292 200 200. . . . . . . . . . . . . . . . . . . . . . . . . . . . . . . . . . . . . .
Total Department of the Treasury 2,819 42,489 78,389
The Judiciary:Drug Court Grant ------ 2,200 ------. . . . . . . . . . . . . . . . . . . . . . . . . . . . . . . . . . . . . . . . . . . . . . . . . . . . . . . .Family Safe Havens Grant ------ 400 ------. . . . . . . . . . . . . . . . . . . . . . . . . . . . . . . . . . . . . . . . . . . . . . . . .Juvenile Drug Court Grant 72 ------ ------. . . . . . . . . . . . . . . . . . . . . . . . . . . . . . . . . . . . . . . . . . . . . . . .State Justice Training Grant 20 ------ ------. . . . . . . . . . . . . . . . . . . . . . . . . . . . . . . . . . . . . . . . . . . . . . .Various Federal Programs and Accruals 1,096 2,535 1,325. . . . . . . . . . . . . . . . . . . . . . . . . . . . . . . . . . . . . .
Total Judiciary 1,188 5,135 1,325
Total Federal Funds 8,058,769 10,071,518 12,317,302. . . . . . . . . . . . . . . . . . . . . . . . . . . . . . . . . . . . . . . . . . . . . . . . . . . . .
Revolving:
Department of Community Affairs:Administration and Support Services 498 650 650. . . . . . . . . . . . . . . . . . . . . . . . . . . . . . . . . . . . . . . .Housing Services 206 495 ------. . . . . . . . . . . . . . . . . . . . . . . . . . . . . . . . . . . . . . . . . . . . . . . . . . . . . . . .Liquid Petroleum Gas Education and Safety Board 121 315 250. . . . . . . . . . . . . . . . . . . . . . . . . . . . .Uniform Construction Code 9,454 9,375 11,700. . . . . . . . . . . . . . . . . . . . . . . . . . . . . . . . . . . . . . . . . . . . . . .Various Revolving Funds 71 ------ ------. . . . . . . . . . . . . . . . . . . . . . . . . . . . . . . . . . . . . . . . . . . . . . . . .
Total Department of Community Affairs 10,350 10,835 12,600
Department of Corrections:Culinary Arts Vocational Program 103 135 135. . . . . . . . . . . . . . . . . . . . . . . . . . . . . . . . . . . . . . . . . .Farm Operations 12,250 11,130 11,130. . . . . . . . . . . . . . . . . . . . . . . . . . . . . . . . . . . . . . . . . . . . . . . . . . . . . . . .Institutional Care and Treatment 484 500 520. . . . . . . . . . . . . . . . . . . . . . . . . . . . . . . . . . . . . . . . . . . .State Use 19,291 18,750 18,750. . . . . . . . . . . . . . . . . . . . . . . . . . . . . . . . . . . . . . . . . . . . . . . . . . . . . . . . . . . . . .
Total Department of Corrections 32,128 30,515 30,535
Department of Education:Administration and Support Services 1,682 1,720 1,720. . . . . . . . . . . . . . . . . . . . . . . . . . . . . . . . . . . . . . . .General Education Development 331 350 350. . . . . . . . . . . . . . . . . . . . . . . . . . . . . . . . . . . . . . . . . . . .Professional Development and Licensure 405 ------ ------. . . . . . . . . . . . . . . . . . . . . . . . . . . . . . . . . . . . .
Total Department of Education 2,418 2,070 2,070
Appendix I 55

SCHEDULE 2OTHER REVENUES
(thousands of dollars)----------------------Fiscal Year Ending June 30----------------------
2008 2009 2010Actual Estimated Estimated
Department of Environmental Protection:Administration and Support Services 257 127 160. . . . . . . . . . . . . . . . . . . . . . . . . . . . . . . . . . . . . . . .Pesticide Control 285 300 300. . . . . . . . . . . . . . . . . . . . . . . . . . . . . . . . . . . . . . . . . . . . . . . . . . . . . . . .Publicly--Funded Site Remediation 153 ------ ------. . . . . . . . . . . . . . . . . . . . . . . . . . . . . . . . . . . . . . . . . .
Total Department of Environmental Protection 695 427 460
Department of Health and Senior Services:Administration and Support Services 6,761 6,500 6,500. . . . . . . . . . . . . . . . . . . . . . . . . . . . . . . . . . . . . . . .Laboratory Services 9,405 10,125 11,125. . . . . . . . . . . . . . . . . . . . . . . . . . . . . . . . . . . . . . . . . . . . . . . . . . . . . .
Total Department of Health and Senior Services 16,166 16,625 17,625
Department of Human Services:Administration and Support Services 1,099 903 903. . . . . . . . . . . . . . . . . . . . . . . . . . . . . . . . . . . . . . . .Income Maintenance Management 6,229 5,525 5,525. . . . . . . . . . . . . . . . . . . . . . . . . . . . . . . . . . . . . . . . . .
Total Department of Human Services 7,328 6,428 6,428
Department of Labor and Workforce Development:Administration and Support Services 905 ------ ------. . . . . . . . . . . . . . . . . . . . . . . . . . . . . . . . . . . . . . . .Planning and Analysis 20 ------ ------. . . . . . . . . . . . . . . . . . . . . . . . . . . . . . . . . . . . . . . . . . . . . . . . . . . .
Total Department of Labor and Workforce Development 925 ------ ------
Department of Law and Public Safety:Criminal Justice 125 275 275. . . . . . . . . . . . . . . . . . . . . . . . . . . . . . . . . . . . . . . . . . . . . . . . . . . . . . . . .State Police Operations 1 ------ ------. . . . . . . . . . . . . . . . . . . . . . . . . . . . . . . . . . . . . . . . . . . . . . . . . . .
Total Department of Law and Public Safety 126 275 275
Department of State:Museum Services 19 ------ ------. . . . . . . . . . . . . . . . . . . . . . . . . . . . . . . . . . . . . . . . . . . . . . . . . . . . . . .Records Management 642 465 450. . . . . . . . . . . . . . . . . . . . . . . . . . . . . . . . . . . . . . . . . . . . . . . . . . . .
Total Department of State 661 465 450
Department of Transportation:Administration and Support Services 330 ------ ------. . . . . . . . . . . . . . . . . . . . . . . . . . . . . . . . . . . . . . . .
Department of the Treasury:Adjudication of Administrative Appeals 892 895 895. . . . . . . . . . . . . . . . . . . . . . . . . . . . . . . . . . . . . .Automotive Services 30,809 25,957 25,957. . . . . . . . . . . . . . . . . . . . . . . . . . . . . . . . . . . . . . . . . . . . . . . . . . . . .Capitol Post Office 1,902 1,648 1,648. . . . . . . . . . . . . . . . . . . . . . . . . . . . . . . . . . . . . . . . . . . . . . . . . . . . . .Escrow -- Construction Management Services 1,373 ------ ------. . . . . . . . . . . . . . . . . . . . . . . . . . . . . . . . .Printing Services 2,330 2,324 2,324. . . . . . . . . . . . . . . . . . . . . . . . . . . . . . . . . . . . . . . . . . . . . . . . . . . . . . . .Property Management and Construction -- Construction Management Services 2,301 4,425 4,425. . . . . . .Public Information Services 1,001 1,001 1,001. . . . . . . . . . . . . . . . . . . . . . . . . . . . . . . . . . . . . . . . . . . . . . .Purchasing and Inventory Management 53,692 50,920 50,920. . . . . . . . . . . . . . . . . . . . . . . . . . . . . . . . . . . . . .
Total Department of the Treasury 94,300 87,170 87,170
Total Revolving 165,427 154,810 157,613. . . . . . . . . . . . . . . . . . . . . . . . . . . . . . . . . . . . . . . . . . . . . . . . . . . . . . . . .
Total Other Revenues General Fund 11,516,032 13,545,207 15,782,231. . . . . . . . . . . . . . . . . . . . . . . . . . . . . . . . . . . . . . . .
SPECIAL TRANSPORTATION FUND
General:Transportation Trust Fund -- Federal 756,691 1,108,329 1,122,592. . . . . . . . . . . . . . . . . . . . . . . . . . . . . . . . . . . . . . . . .Transportation Trust Fund -- Federal Economic Stimulus ------ 800,000 ------. . . . . . . . . . . . . . . . . . . . . . . . .Transportation Trust Fund -- Local Highway Funds 126,189 224,241 208,151. . . . . . . . . . . . . . . . . . . . . . . . . . . . .Transportation Trust Fund -- Public Transportation 597,149 685,000 692,000. . . . . . . . . . . . . . . . . . . . . . . . . . . . . .Transportation Trust Fund -- State Highway Funds 706,064 690,759 699,849. . . . . . . . . . . . . . . . . . . . . . . . . . . . . .
Total Special Transportation Fund 2,186,093 3,508,329 2,722,592. . . . . . . . . . . . . . . . . . . . . . . . . . . . . . . . . . . . . . . . . .
TOTAL OTHER REVENUES 13,702,125 17,053,536 18,504,823. . . . . . . . . . . . . . . . . . . . . . . . . . . . . . . . . . . . . . . . . . . . .
Appendix I 56

SCHEDULE 3EXPENDITURES BUDGETED
(thousands of dollars)----------------------Fiscal Year Ending June 30----------------------
2008 2009 2010Actual Estimated Estimated
GENERAL FUND
Legislative Branch
Senate 11,382 11,459 11,459. . . . . . . . . . . . . . . . . . . . . . . . . . . . . . . . . . . . . . . . . . . . . . . . . . . . . . . . . . . . . . . . . . . .General Assembly 18,589 17,902 17,902. . . . . . . . . . . . . . . . . . . . . . . . . . . . . . . . . . . . . . . . . . . . . . . . . . . . . . . . . .Office of Legislative Services 31,779 29,787 28,958. . . . . . . . . . . . . . . . . . . . . . . . . . . . . . . . . . . . . . . . . . . . . . . . .Legislative Commissions 6,056 5,595 5,595. . . . . . . . . . . . . . . . . . . . . . . . . . . . . . . . . . . . . . . . . . . . . . . . . . . . .State Capitol Joint Management Commission 9,587 9,901 9,901. . . . . . . . . . . . . . . . . . . . . . . . . . . . . . . . . . . . .Clean Ocean and Shore Trust Committee 80 ------ ------. . . . . . . . . . . . . . . . . . . . . . . . . . . . . . . . . . . . . . . . .
77,473 74,644 73,815
Executive Branch
Chief Executive 5,125 5,268 4,684. . . . . . . . . . . . . . . . . . . . . . . . . . . . . . . . . . . . . . . . . . . . . . . . . . . . . . . . . . . .Department of Agriculture 30,248 22,463 24,629. . . . . . . . . . . . . . . . . . . . . . . . . . . . . . . . . . . . . . . . . . . . . . . . . . . .Department of Banking and Insurance 68,640 71,441 67,548. . . . . . . . . . . . . . . . . . . . . . . . . . . . . . . . . . . . . . . . . . .Department of Children and Families 1,046,864 1,089,292 1,092,294. . . . . . . . . . . . . . . . . . . . . . . . . . . . . . . . . . . . . . . . . . . .Department of Community Affairs 189,433 303,443 290,215. . . . . . . . . . . . . . . . . . . . . . . . . . . . . . . . . . . . . . . . . . . . . .Department of Corrections 1,153,786 1,196,087 1,189,378. . . . . . . . . . . . . . . . . . . . . . . . . . . . . . . . . . . . . . . . . . . . . . . . . . . .Department of Education 736,606 1,067,797 810,365. . . . . . . . . . . . . . . . . . . . . . . . . . . . . . . . . . . . . . . . . . . . . . . . . . . . .Department of Environmental Protection 461,885 424,178 360,092. . . . . . . . . . . . . . . . . . . . . . . . . . . . . . . . . . . . . . . . .Department of Health and Senior Services 1,425,834 1,399,699 1,055,087. . . . . . . . . . . . . . . . . . . . . . . . . . . . . . . . . . . . . . . .Department of Human Services 4,804,172 4,827,779 4,461,908. . . . . . . . . . . . . . . . . . . . . . . . . . . . . . . . . . . . . . . . . . . . . . . .Department of Labor and Workforce Development 467,547 303,690 144,833. . . . . . . . . . . . . . . . . . . . . . . . . . . . . . . . .Department of Law and Public Safety 647,921 558,368 539,213. . . . . . . . . . . . . . . . . . . . . . . . . . . . . . . . . . . . . . . . . . .Department of Military and Veterans’ Affairs 101,861 94,725 91,292. . . . . . . . . . . . . . . . . . . . . . . . . . . . . . . . . . . . .Department of the Public Advocate 17,981 17,130 16,834. . . . . . . . . . . . . . . . . . . . . . . . . . . . . . . . . . . . . . . . . . . . .Department of State 1,332,770 1,283,674 1,258,396. . . . . . . . . . . . . . . . . . . . . . . . . . . . . . . . . . . . . . . . . . . . . . . . . . . . . . . . .Department of Transportation 1,299,358 1,353,814 1,252,964. . . . . . . . . . . . . . . . . . . . . . . . . . . . . . . . . . . . . . . . . . . . . . . . . .Department of the Treasury 1,450,158 1,369,047 1,139,680. . . . . . . . . . . . . . . . . . . . . . . . . . . . . . . . . . . . . . . . . . . . . . . . . . .Miscellaneous Commissions 1,452 1,456 1,456. . . . . . . . . . . . . . . . . . . . . . . . . . . . . . . . . . . . . . . . . . . . . . . . . .
15,241,641 15,389,351 13,800,868
Interdepartmental Accts
Inter--Departmental Services 704,412 705,871 654,742. . . . . . . . . . . . . . . . . . . . . . . . . . . . . . . . . . . . . . . . . . . . . . . . . .Employee Benefits 2,560,723 2,546,545 2,257,552. . . . . . . . . . . . . . . . . . . . . . . . . . . . . . . . . . . . . . . . . . . . . . . . . . . . . . . . . .Other Interdepartmental Accounts 57,373 16,675 27,675. . . . . . . . . . . . . . . . . . . . . . . . . . . . . . . . . . . . . . . . . . . . . .Salary Increases and Other Benefits 10,784 19,333 10,500. . . . . . . . . . . . . . . . . . . . . . . . . . . . . . . . . . . . . . . . . . . . .
3,333,292 3,288,424 2,950,469
Judicial Branch
The Judiciary 605,482 641,007 648,385. . . . . . . . . . . . . . . . . . . . . . . . . . . . . . . . . . . . . . . . . . . . . . . . . . . . . . . . . . . . . .
605,482 641,007 648,385
Total General Fund 19,257,888 19,393,426 17,473,537. . . . . . . . . . . . . . . . . . . . . . . . . . . . . . . . . . . . . . . . . . . . . . . . . . . . . . .
CASINO CONTROL FUND -- DIRECT STATE SERVICES
Department of Law and Public Safety 43,491 45,999 43,999. . . . . . . . . . . . . . . . . . . . . . . . . . . . . . . . . . . . . . . . . . .Department of the Treasury 28,065 29,440 26,572. . . . . . . . . . . . . . . . . . . . . . . . . . . . . . . . . . . . . . . . . . . . . . . . . . .
Total Casino Control Fund -- Direct State Services 71,556 75,439 70,571. . . . . . . . . . . . . . . . . . . . . . . . . . . . . . .
CASINO REVENUE FUND
Department of Health and Senior Services 276,265 202,425 188,791. . . . . . . . . . . . . . . . . . . . . . . . . . . . . . . . . . . . . . . .Department of Human Services 112,842 130,457 130,457. . . . . . . . . . . . . . . . . . . . . . . . . . . . . . . . . . . . . . . . . . . . . . . .Department of Labor and Workforce Development 2,440 2,440 2,196. . . . . . . . . . . . . . . . . . . . . . . . . . . . . . . . .Department of Law and Public Safety 92 92 92. . . . . . . . . . . . . . . . . . . . . . . . . . . . . . . . . . . . . . . . . . .Department of Transportation 36,928 33,018 30,233. . . . . . . . . . . . . . . . . . . . . . . . . . . . . . . . . . . . . . . . . . . . . . . . . .
Total Casino Revenue Fund 428,567 368,432 351,769. . . . . . . . . . . . . . . . . . . . . . . . . . . . . . . . . . . . . . . . . . . . . . . . .
Appendix I 57

SCHEDULE 3EXPENDITURES BUDGETED
(thousands of dollars)----------------------Fiscal Year Ending June 30----------------------
2008 2009 2010Actual Estimated Estimated
GUBERNATORIAL ELECTIONS FUND -- GRANTS--IN--AID
Department of Law and Public Safety ------ 5,080 7,880. . . . . . . . . . . . . . . . . . . . . . . . . . . . . . . . . . . . . . . . . . .
PROPERTY TAX RELIEF FUND
Department of Community Affairs 1,010,701 847,493 819,688. . . . . . . . . . . . . . . . . . . . . . . . . . . . . . . . . . . . . . . . . . . . . .Department of Education 10,224,381 10,502,541 9,603,326. . . . . . . . . . . . . . . . . . . . . . . . . . . . . . . . . . . . . . . . . . . . . . . . . . . . .Department of Environmental Protection 9,828 10,000 10,000. . . . . . . . . . . . . . . . . . . . . . . . . . . . . . . . . . . . . . . . .Department of Human Services 148,044 ------ ------. . . . . . . . . . . . . . . . . . . . . . . . . . . . . . . . . . . . . . . . . . . . . . . .Department of the Treasury 2,460,983 2,041,906 1,503,986. . . . . . . . . . . . . . . . . . . . . . . . . . . . . . . . . . . . . . . . . . . . . . . . . . .
Total Property Tax Relief Fund 13,853,937 13,401,940 11,937,000. . . . . . . . . . . . . . . . . . . . . . . . . . . . . . . . . . . . . . . . . . . . . . .
GRAND TOTAL EXPENDITURES BUDGETED 33,611,948 33,244,317 29,840,757. . . . . . . . . . . . . . . . . . . . . . . . . . . . . . .
Appendix I 58

SCHEDULE 4EXPENDITURES NOT BUDGETED
(thousands of dollars)
----------------------Fiscal Year Ending June 30----------------------2008 2009 2010
Actual Estimated EstimatedGENERAL FUNDS
Dedicated Funds
Chief Executive 608 900 750. . . . . . . . . . . . . . . . . . . . . . . . . . . . . . . . . . . . . . . . . . . . . . . . . . . . . . . . . . . .Department of Agriculture 10,129 11,121 10,960. . . . . . . . . . . . . . . . . . . . . . . . . . . . . . . . . . . . . . . . . . . . . . . . . . . .Department of Banking and Insurance 4,759 832 496. . . . . . . . . . . . . . . . . . . . . . . . . . . . . . . . . . . . . . . . . . .Department of Children and Families 57,559 57,824 53,650. . . . . . . . . . . . . . . . . . . . . . . . . . . . . . . . . . . . . . . . . . . .Department of Community Affairs 146,178 81,100 82,700. . . . . . . . . . . . . . . . . . . . . . . . . . . . . . . . . . . . . . . . . . . . . .Department of Corrections 29,930 25,014 24,387. . . . . . . . . . . . . . . . . . . . . . . . . . . . . . . . . . . . . . . . . . . . . . . . . . . .Department of Education 13,500 21,080 16,151. . . . . . . . . . . . . . . . . . . . . . . . . . . . . . . . . . . . . . . . . . . . . . . . . . . . .Department of Environmental Protection 33,161 72,737 81,214. . . . . . . . . . . . . . . . . . . . . . . . . . . . . . . . . . . . . . . . .Department of Health and Senior Services 264,391 300,235 300,401. . . . . . . . . . . . . . . . . . . . . . . . . . . . . . . . . . . . . . . .Department of Human Services 827,869 672,973 651,463. . . . . . . . . . . . . . . . . . . . . . . . . . . . . . . . . . . . . . . . . . . . . . . .Department of Labor and Workforce Development 168,795 208,934 216,999. . . . . . . . . . . . . . . . . . . . . . . . . . . . . . . . .Department of Law and Public Safety 226,692 298,167 292,828. . . . . . . . . . . . . . . . . . . . . . . . . . . . . . . . . . . . . . . . . . .Department of Military and Veterans’ Affairs 857 3,927 2,923. . . . . . . . . . . . . . . . . . . . . . . . . . . . . . . . . . . . .Department of the Public Advocate 462 558 558. . . . . . . . . . . . . . . . . . . . . . . . . . . . . . . . . . . . . . . . . . . . .Department of State 37,009 23,608 24,537. . . . . . . . . . . . . . . . . . . . . . . . . . . . . . . . . . . . . . . . . . . . . . . . . . . . . . . . .Department of Transportation 341,131 289,850 294,023. . . . . . . . . . . . . . . . . . . . . . . . . . . . . . . . . . . . . . . . . . . . . . . . . .Department of the Treasury 1,198,560 1,185,565 1,186,999. . . . . . . . . . . . . . . . . . . . . . . . . . . . . . . . . . . . . . . . . . . . . . . . . . .Interdepartmental Accounts 45 4,060 4,418. . . . . . . . . . . . . . . . . . . . . . . . . . . . . . . . . . . . . . . . . . . . . . . . . . .The Judiciary 57,063 60,394 61,859. . . . . . . . . . . . . . . . . . . . . . . . . . . . . . . . . . . . . . . . . . . . . . . . . . . . . . . . . . . . . .
Total Dedicated Funds 3,418,698 3,318,879 3,307,316. . . . . . . . . . . . . . . . . . . . . . . . . . . . . . . . . . . . . . . . . . . . . . . . . . . . .
Federal Funds
Legislature 2 ------ ------. . . . . . . . . . . . . . . . . . . . . . . . . . . . . . . . . . . . . . . . . . . . . . . . . . . . . . . . . . . . . . . .Department of Agriculture 274,538 331,024 342,029. . . . . . . . . . . . . . . . . . . . . . . . . . . . . . . . . . . . . . . . . . . . . . . . . . . .Department of Children and Families 365,537 397,783 434,445. . . . . . . . . . . . . . . . . . . . . . . . . . . . . . . . . . . . . . . . . . . .Department of Community Affairs 369,831 705,592 449,784. . . . . . . . . . . . . . . . . . . . . . . . . . . . . . . . . . . . . . . . . . . . . .Department of Corrections 8,648 11,272 10,914. . . . . . . . . . . . . . . . . . . . . . . . . . . . . . . . . . . . . . . . . . . . . . . . . . . .Department of Education 784,458 832,253 2,526,268. . . . . . . . . . . . . . . . . . . . . . . . . . . . . . . . . . . . . . . . . . . . . . . . . . . . .Department of Environmental Protection 48,303 383,263 182,458. . . . . . . . . . . . . . . . . . . . . . . . . . . . . . . . . . . . . . . . .Department of Health and Senior Services 1,556,271 1,841,795 2,089,996. . . . . . . . . . . . . . . . . . . . . . . . . . . . . . . . . . . . . . . .Department of Human Services 3,960,402 4,519,014 5,242,265. . . . . . . . . . . . . . . . . . . . . . . . . . . . . . . . . . . . . . . . . . . . . . . .Department of Labor and Workforce Development 384,319 565,725 446,754. . . . . . . . . . . . . . . . . . . . . . . . . . . . . . . . .Department of Law and Public Safety 122,285 204,994 239,329. . . . . . . . . . . . . . . . . . . . . . . . . . . . . . . . . . . . . . . . . . .Department of Military and Veterans’ Affairs 65,583 44,316 47,741. . . . . . . . . . . . . . . . . . . . . . . . . . . . . . . . . . . . .Department of the Public Advocate 1,132 1,650 1,650. . . . . . . . . . . . . . . . . . . . . . . . . . . . . . . . . . . . . . . . . . . . .Department of State 37,883 31,252 67,010. . . . . . . . . . . . . . . . . . . . . . . . . . . . . . . . . . . . . . . . . . . . . . . . . . . . . . . . .Department of Transportation 25,603 59,104 58,063. . . . . . . . . . . . . . . . . . . . . . . . . . . . . . . . . . . . . . . . . . . . . . . . . .Department of the Treasury 2,522 43,717 79,617. . . . . . . . . . . . . . . . . . . . . . . . . . . . . . . . . . . . . . . . . . . . . . . . . . .The Judiciary 86,801 98,764 98,979. . . . . . . . . . . . . . . . . . . . . . . . . . . . . . . . . . . . . . . . . . . . . . . . . . . . . . . . . . . . . .
Total Federal Funds 8,094,118 10,071,518 12,317,302. . . . . . . . . . . . . . . . . . . . . . . . . . . . . . . . . . . . . . . . . . . . . . . . . . . . . . .
Revolving Funds
Legislature 2 ------ ------. . . . . . . . . . . . . . . . . . . . . . . . . . . . . . . . . . . . . . . . . . . . . . . . . . . . . . . . . . . . . . . .Department of Community Affairs 13,744 10,835 12,600. . . . . . . . . . . . . . . . . . . . . . . . . . . . . . . . . . . . . . . . . . . . . .Department of Corrections 32,399 30,515 30,535. . . . . . . . . . . . . . . . . . . . . . . . . . . . . . . . . . . . . . . . . . . . . . . . . . . .Department of Education 2,425 2,070 2,070. . . . . . . . . . . . . . . . . . . . . . . . . . . . . . . . . . . . . . . . . . . . . . . . . . . . .Department of Environmental Protection 774 427 460. . . . . . . . . . . . . . . . . . . . . . . . . . . . . . . . . . . . . . . . .Department of Health and Senior Services 17,357 16,625 17,625. . . . . . . . . . . . . . . . . . . . . . . . . . . . . . . . . . . . . . . .Department of Human Services 6,359 6,428 6,428. . . . . . . . . . . . . . . . . . . . . . . . . . . . . . . . . . . . . . . . . . . . . . . .Department of Labor and Workforce Development 1,450 ------ ------. . . . . . . . . . . . . . . . . . . . . . . . . . . . . . . . .Department of Law and Public Safety 2 275 275. . . . . . . . . . . . . . . . . . . . . . . . . . . . . . . . . . . . . . . . . . .Department of State 617 465 450. . . . . . . . . . . . . . . . . . . . . . . . . . . . . . . . . . . . . . . . . . . . . . . . . . . . . . . . .Department of Transportation 260 ------ ------. . . . . . . . . . . . . . . . . . . . . . . . . . . . . . . . . . . . . . . . . . . . . . . . . .Department of the Treasury 109,110 87,170 87,170. . . . . . . . . . . . . . . . . . . . . . . . . . . . . . . . . . . . . . . . . . . . . . . . . . .
Total Revolving Funds 184,499 154,810 157,613. . . . . . . . . . . . . . . . . . . . . . . . . . . . . . . . . . . . . . . . . . . . . . . . . . . . .
Total Expenditures General Fund 11,697,315 13,545,207 15,782,231. . . . . . . . . . . . . . . . . . . . . . . . . . . . . . . . . . . . . . . . . . . .
SPECIAL TRANSPORTATION TRUST FUNDGeneral 2,246,594 3,508,329 2,722,592. . . . . . . . . . . . . . . . . . . . . . . . . . . . . . . . . . . . . . . . . . . . . . . . . . . . . . . . . . . . . . . . . . .
GRAND TOTAL EXPENDITURES NOT BUDGETED 13,943,909 17,053,536 18,504,823. . . . . . . . . . . . . . . . . . . . . . . . . . . . . .
Appendix I 59
APPENDIX II: CURRENT YEAR ACTIONS TO KEEP NEW JERSEY’S BUDGET IN BALANCE—THE FISCAL 2009 PROBLEM AND SOLUTIONS
More than one year ago, while the Fiscal 2009 Budget was first being developed, the Corzine Administration recognized weaknesses in the nation’s economy, and prudently built a budget around assumptions that New Jersey’s revenue stream would feel the effects of this slowdown. Unlike many other state governments that increased spending and created new programs, New Jersey took an austere approach and enacted a budget for Fiscal 2009 that contained the largest year-to-year spending reduction in State history. The State also created a $650 million reserve to help New Jersey reduce debt service, which is one of the recurring expenses at the core of the Budget’s structural imbalance. After the first quarter of the new fiscal year, the national economy slipped quickly, and deeply, into recession. While revenues mirrored conservative projections over much of this quarter, major tax collections soon began missing targets, and then virtually every revenue source to the Budget underperformed. Six months into the new fiscal year, as economic fundamentals showed signs of collapse, New Jersey measured a current year shortfall of about $2.0 billion, including $1.7 million in revenue and more than $275 million in new required spending. In order to address the constitutional obligation for a balanced budget, the Corzine Administration addressed the shortfall by undertaking a forensic, line-by-line review of all budgetary spending, combing through fiscal accounts of every size, government-wide to halt spending and cut appropriations in the current year. By early January, this scrubbing of the Budget yielded $812 million in reductions, which was unprecedented for a mid-year budget adjustment. These reductions cut deeply into government operations, and included a wage freeze for managerial and rank-and-file employees. Still, the spending cuts and restraints covered a little more than one-third of the FY 2009 problem. The remainder of the shortfall was closed with the use of $275 million of State surplus, $365 million from the Long -Term Debt Reduction Fund, $300 million in anticipated funds from the federal stimulus and the use of $208 million in funds made available by a painstaking and aggressive close-out of the FY 2008 Budget. With the economy slipping deeper into recession, monthly revenue collections continued a downward spiral, necessitating a revision of the current year shortfall in February. With Gross Income, Sales and Corporation Business Taxes all falling below estimates and significantly under collections recorded over the same periods one year ago, the current year shortfall was revised to $3.4 billion. These collection figures were recorded in the materially significant holiday period, and traditionally are used as a baseline for the next fiscal year budget. Thus, the eroding fiscal status of the Budget required deeper current year reductions and solutions, and cast the die for the Fiscal 2010 spending plan. An additional $500 million of spending solutions were developed, including savings from a mandatory State employee furlough for two days in May and June. Rebalancing also was predicated on an added infusion of federal stimulus resources, redirection of available balances in a limited number of dedicated funds and the enactment of a tax amnesty program.
Appendix II 1

Fiscal Year 2009 Problem $3.27 Billion(In Billions)
$29.97
$33.24
$28.0$29.0$30.0$31.0$32.0$33.0$34.0
Resources Adjusted Appropriations
Due to the recession’s negative impact on revenues, FY 2009 adjusted appropriations exceeded available resources by 11%.
Appendix II 2

Added AddedJan 2nd Feb 17 Mar 10 Total
Revenue Shortfall 1,683,000$ 1,146,189$ 66,117$ 2,895,306$ Added Spending Needs 276,308 42,282 (92,744) 225,846$ Payment to UI Fund - 270,000 (120,000) 150,000
Total 1,959,308$ 1,458,471$ (146,627)$ 3,271,152$
Summary of Problems(In Thousands)
Revenue shortfall accounts for nearly 90% of the $3.3 billion shortfall in FY 2009.
Appendix II 3

History of FY 2009 Revenues(In Billions)
$32.6 $32.5 $32.3 $32.4$32.0
$31.0$30.7
$29.5 $29.5
$27.5
$28.0
$28.5
$29.0
$29.5
$30.0
$30.5
$31.0
$31.5
$32.0
$32.5
$33.0
FY
08 A
ctua
l
FY
09 F
eb O
rigi
nal
Est
imat
e
FY
09 M
ay A
djus
tmen
t
FY
09 A
ppro
pria
tion
s A
ct
FY
09 G
ov's
Sti
mul
us S
peec
h
FY
09 N
ovem
ber
Est
imat
e
FY
09 J
an E
stim
ate
FY
09 F
eb E
stim
ate
FY
09 M
arch
Est
imat
e
Appendix II 4

FY 2009 Revenues(In Millions)
FY2009FY2008 AdjustedCAFR Revenues ** $ %
Change to CAFR
Income 12,605$ 11,249$ (1,356)$ (10.8)
Sales 8,395 7,925 (470) (5.6)
Corporate 2,993 2,350 (643) (21.5)
Other* 8,591 8,456 (135) (1.6)
Total 32 584$ 29 980$ (2 604)$ (8 0)Total 32,584$ 29,980$ (2,604)$ (8.0)
* All Sales Tax and Corporation Business Taxes on Energy are included in Other.
**FY 2009 includes solutions.
CAFR - Comprehensive Annual Financial Report
Appendix II 5

FY 2009 Revenues(In Millions)
FY2009Approp. FY2009
Act Adjusted ChangeRevenues Revenues** $ %
Income 12,700$ 11,249$ (1,451)$ (11.4)
Sales 8,578 7,925 (653) (7.6)
Corporate 2,670 2,350 (320) (12.0)
Other* 8,420 8,456 36 0.4
Total 32,368$ 29,980$ (2,388)$ (7.4)
* All Sales Tax and Corporation Business Taxes on Energy are included in Other.
**FY 2009 includes solutions.
Appendix II 6
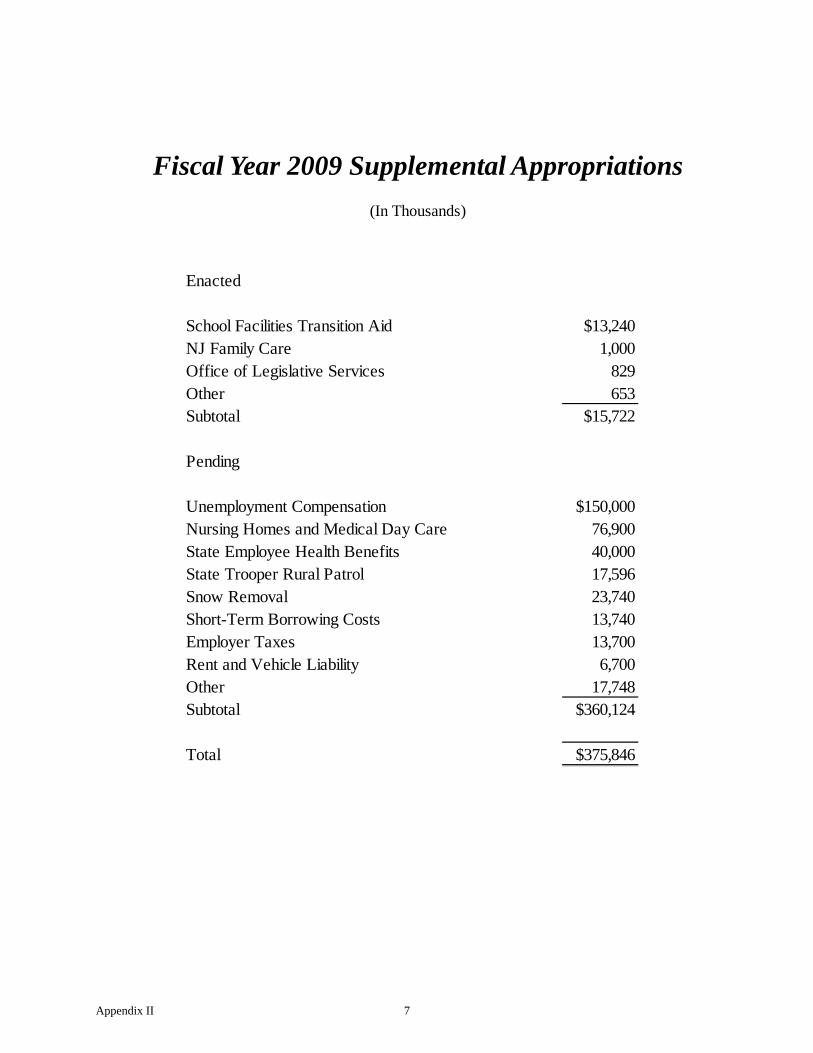
Fiscal Year 2009 Supplemental Appropriations(In Thousands)
Enacted
School Facilities Transition Aid $13,240NJ Family Care 1,000Office of Legislative Services 829Other 653Subtotal $15,722
Pending
Unemployment Compensation $150,000Nursing Homes and Medical Day Care 76,900State Employee Health Benefits 40,000State Trooper Rural Patrol 17,596Snow Removal 23,740Short-Term Borrowing Costs 13,740Employer Taxes 13,700Rent and Vehicle Liability 6,700Other 17,748Subtotal $360,124
Total $375,846
Appendix II 7

Added AddedJan 2nd Feb 17 Mar 10 Total
Budget Cuts 812,199$ 472,943$ 475,112$ 1,760,254$ Transfer from Long Term Obligation and
Capital Expenditure Fund to Property Tax Relief Fund 365,000 - - 365,000$
FY 08 Added Surplus 207,578 - - 207,578$ Federal Medicaid (a) 300,000 300,000 (66,990) 533,010$ Additional Federal Stimulus - 250,000 - 250,000$ Balances Redirected from Trust Funds - 156,876 - 156,876$ Tax Amnesty - 100,000 - 100,000$
Total 1,684,777$ 1,279,819$ 408,122$ 3,372,718$
(a) In March, $66,990 of the Federal Medicaid funds were used to offset costs in the Department of Human Services.
Summary of Actions(In Thousands)
Approximately half of the $3.4 billion in solutions needed to balance the current year budget were derived from restraints on spending.
Appendix II 8

FY 09 Budget History
(In Billions)
$33.5
$35.7
$33.0 $32.9$31.6
$30.9
$28.0$29.0$30.0$31.0$32.0$33.0$34.0$35.0$36.0$37.0
FY2008 Original Approp.
January 2008 Projected Baseline Spending
Governor's Budget
Appropriations Act
February 2009 March 2009
Appendix II 9

Approp. Spending $ %
Chief Executive 5,268$ 5,268$ -$ - Agriculture 22,463 18,267 (4,196) (18.7)Banking and Insurance 71,441 71,441 - -
Children and Families(a)
1,089,292 1,089,226 (66) - Community Affairs 1,150,936 1,069,421 (81,515) (7.1)Corrections 1,196,087 1,168,309 (27,778) (2.3)Education 11,570,338 10,928,372 (641,966) (5.5)Environmental Protection 434,178 410,960 (23,218) (5.3)
Health and Senior Services(a)
1,602,124 1,479,598 (122,526) (7.6)
Human Services (a)
4,958,236 4,359,330 (598,906) (12.1)
Labor & Workforce Development (b) 306,130 304,618 (1,512) (0.5)Law and Public Safety 609,539 593,122 (16,417) (2.7)Military and Veterans' Affairs 94,725 92,334 (2,391) (2.5)Public Advocate 17,130 14,454 (2,676) (15.6)State 1,283,674 1,260,638 (23,036) (1.8)Transportation 1,386,832 1,357,646 (29,186) (2.1)
Treasury (b)
3,440,393 3,179,252 (261,141) (7.6)Miscellaneous Commissions 1,456 1,456 - -
Subtotal Executive Branch 29,240,242$ 27,403,712$ (1,836,530)$ (6.3)
Interdepartmental 3,288,424$ 2,834,440$ (453,984)$ (13.8)
Legislature 74,644$ 73,144$ (1,500)$ (2.0)Judiciary 641,007 639,757 (1,250) (0.2)
Total 33,244,317$ 30,951,053$ (2,293,264)$ (6.9)
(a) Includes $533 million in savings from FMAP-federal stimulus in FY 2009
(b) FY 2009 includes appropriations shifted from Department of Personnel
FY 2009 Adjusted
Change
FY 2009 Spending Comparison(In Thousands)
Appendix II 10

FY2009 Major Spending Reductions*
Original FY2009 Appropriations Act ($600 million net total) • $600 Largest Net Changes: Homestead Rebates, Salary Increases, Family Care
January 2, 2009 ($812 million total) • $116 Pension Contribution Adjustment • 94 Human Services (Contract Closeouts, Recoveries, Other) • 75 Pension Deferral Plan for Localities – School Aid • 56 Health (Community Centers, Early Intervention, Other) • 47 State Rental Assistance - Adjusted Spending • 45 Direct Property Tax Relief - Revised Need • 39 Teachers' Health Benefits – Lower Need for Retirees • 32 Business Employment Incentive Program – Revised Need • 27 Salary Benefits
February 17, 2009 ($473 million total) • $168 Pension Contribution Adjustment • 48 Economic Development – Adjusted Need (BEIP, Main Street) • 41 Salary Benefits (Mandatory Furlough, Balances) • 32 PAAD/Senior Gold – Adjusted Spending • 26 Charity Care – Eliminate Forward Funding • 22 Local Aid (County Solid Waste, Highlands – Adjusted Need)
March 10, 2009 ($475 million total) • $500 Pension Contribution Adjustment • ( 25) Other Adjustments
*Chart excludes federal stimulus, dedicated funds, and revenue initiatives
Appendix II 11

Budget Relief from Federal Stimulus Bill(In Thousands)
SFY09 SFY10 Total
Enhanced Medicaid Funding - Children & Families 13,585$ 24,000$ 37,585$ Enhanced Medicaid Funding - Health 180,606 319,071 499,677 Enhanced Medicaid Funding - Disability Services 25,926 45,803 71,729 Enhanced Medicaid Funding - Medicaid 379,883 671,126 1,051,009 Sub-Total 600,000$ 1,060,000$ 1,660,000$ DHSS - Early Intervention - 5,400 5,400 Fiscal Stabilization 250,000 1,091,000 1,341,000 Title IV-E--Foster Care 4,044 5,392 9,436 Federal Preventive Maintenance - 59,100 59,100
Total 854,044$ 2,220,892$ 3,074,936$
Appendix II 12

FY09 SUMMARY OF ALL REDUCTIONS (Amounts in Thousands) Amount
LEGISLATURE STATE COMMISSION OF INVESTIGATION Expenses of the Commission ($1,500)
State Commission of Investigation Subtotal ($1,500)
Legislature Subtotal ($1,500)
AGRICULTURE School Breakfast Program -Adjusted Spending Projection ($3,303) Conservation Assistance Program ($200) Stormwater Discharge Permit Fees ($131) Nursery Inspection Program ($87) Suspension of the Jersey Fresh Advertising Grant Program ($50) Beneficial Insect Laboratory ($47) Conservation Cost Share Program ($46) Shift of State Positions to Federal Programs ($38) Cancel Contract Work and Shift to Existing State Employee ($24) Soybean Integrated Pest Management ($8) Renovations to the Phillip Alampi Insect Laboratory ($7) Various Equipment Accounts ($5)
Department Subtotal ($3,946)
Agriculture Subtotal ($3,946)
CHILDREN AND FAMILIES Ewing Treatment Ctr Improvements ($66)
Department Subtotal ($66)
Children and Families Subtotal ($66)
COMMUNITY AFFAIRS State Rental Assistance Program -Adjusted Spending Projection ($47,000) Special Municipal Aid and Extraordinary Aid - Pension Deferral Savings ($15,000) Lead Hazard Control Assistance Fund - Adjusted Spending Projection ($6,000) Sharing Available Resources Efficiently (SHARE) Grant Program ($5,200) Consolidation Fund - Offset Rural Patrol Costs ($5,000) Smart Future Planning Grants - Stop Awarding FY09 Grants ($1,885) Downtown Business Improvement Loan Fund ($711) Domestic Violence Training Cost Reimbursement - No Grant Awards for FY09 ($250) Reduced Cigarette Ignition Propensity Program ($196) Contract Closeout ($175) Historic Trust ($68) Regional Efficiency Aid Program ($30)
Department Subtotal ($81,515)
Community Affairs Subtotal ($81,515)
CORRECTIONS FY09 Salary Savings from Non Hiring ($10,888) Civilly Committed Sexual Offender Facility Surplus ($5,835) Integrated Information Systems Development ($2,500) Capital Projects - Savings ($1,674) State Facilities Education Act (SFEA) ($1,300) Corrections Computerized Collection Fund ($687) Work Release Fund ($258) Equipment Account Savings ($30) Integrated Information Systems Development Contract Closeout ($16) State Match for Federal Grants ($10) Contract Closeout ($3)
Department Subtotal ($23,201) PAROLE BOARD FY09 Salary Savings From Non-Hiring ($1,849) Institutional Parole Officer Reassignment ($560) Stages to Enhance Parolee Success (STEPS) Program Efficiencies ($400) Gang Suppression - Savings ($181) Materials & Supplies Account Savings ($112) Residential Assessment Center (RAC) Electronic Monitoring - Savings ($75)
Appendix II 13

FY09 SUMMARY OF ALL REDUCTIONS (Amounts in Thousands) Amount
Parole Board Subtotal ($3,177)
Corrections Subtotal ($26,378)
EDUCATION Pension Deferral Plan Savings ($75,000) School Construction Debt Service - Adjusted Spending Projection ($7,445) School District Deficit Relief Savings ($7,436) Integration Assistance Aid ($3,000) Charter School Aid - Adjusted Spending Projection ($1,995) Governor's Literacy Program ($700) District and School Improvement Savings ($516) Professional Development & Licensure ($317) GED Program ($310) Katzenbach School Renovation ($300) NJ After 3 Savings ($250) School Facilities Contract Closeout ($233) Materials and Supplies Spending Freeze Savings ($230) Regional Schools Sprinkler System Capital ($130) Professional Development & Licensure ($92) Private School Tuition Reimbursements ($76) Holocaust Commission Savings ($72) National Teaching Standards Board Certification Savings ($64) Nonpublic Aid ($44) Community Relations Committee of the United Jewish Federation of Metrowest Savings ($30) Internal Auditing Aid Savings ($25) Italian-American Heritage Commission Savings ($25) School District Bridge Loans Savings ($23) Equipment Accounts ($20) Adolescent Literacy ($11) State Board of Education Expenses - Reduced Spending ($10) Miscellaneous Awards ($7) Capital Improvement - Reduced Spending ($2)
Department Subtotal ($98,363) TEACHERS PENSIONS/SOCIAL SEC. Lower Than Expected Costs For Retiree Health Benefits ($47,342)
Teachers Pensions/Social Sec. Subtotal ($47,342)
Education Subtotal ($145,705)
ENVIRONMENTAL PROTECTION Adjust Corporate Business Tax Appropriations for New Revenue Projections ($13,216) Clean Water Enforcement Act Funds ($1,452) Fringe Benefit Offset - Charge Corporate Business Tax Funded Programs and Shore ($1,304) Protection Funds for Associated Fringe Benefit Costs
Flood Control & Information Technology Infrastructure Capital ($1,057) Reduce General Fund Subsidy to Hunters and Anglers Fund ($1,000) Shift Prior Year Capital Projects to Corporate Business Tax Dedication Funding ($1,000) Vehicle Purchases ($755) Environmental Infrastructure Program Administration ($700) Regional Greenhouse Gas Initiative ($640) NJ Pollution Elimination System (NJPDES) Fees ($500) Landscape Irrigation Contractor Certification ($366) State Recycling Fund ($358) Shellfish Management ($350) Payments In Lieu of Taxes (PILOT) - Savings ($281) Mosquito Control Commission ($261) Geological Survey Maps & Publications ($195) Various Dedicated Accounts ($190) Fort Mott Ferry Lease Agreement ($88) Land Use Map Sales ($82) Various Capital Accounts Savings ($66) Various Equipment Accounts ($61)
Department Subtotal ($23,922) HIGHLANDS WATER PROTECTION AND PLANNING COUNCIL Highlands Council - Adjusted Spending Projection ($100)
Appendix II 14

FY09 SUMMARY OF ALL REDUCTIONS (Amounts in Thousands) Amount
Highlands Water Protection and Planning Council ($100) Subtotal
Environmental Protection Subtotal ($24,022)
HEALTH & SENIOR SERVICES PAAD/Senior Gold Adjusted Spending Projection ($32,100) Eliminate Forward Funding of Charity Care ($25,500) Early Intervention Program - Savings ($18,000) Community Health Centers ($14,700) Brain Injury Research Adjusted Spending Projection ($7,000) Cancer Research - Savings ($7,000) Horizon Third Party Liability Recoveries ($6,110) Hospital Asset Transformation Program ($3,698) End Future Year Funding Within Contracts ($2,404) Various Contract Closeouts ($1,547) AIDS Drug Distribution Program ($1,200) Community Health Centers ($500) Spending Freeze Lapses ($413) Health Care Facilities Improvement Fund ($400) Audit Escrow Account ($360) Tourette Syndrome Association of NJ ($250) Equipment ($232) Anti-Smoking Programs ($130) NJ KidCare Outreach ($112) Capital Construction ($89) Third Party Provider - Savings ($67) Court Settlement ($14)
Department Subtotal ($121,826)
Health & Senior Services Subtotal ($121,826)
HUMAN SERVICES ADDICTION SERVICES Needle Exchange Treatment - Savings ($9,402)
Addiction Services Subtotal ($9,402) COMMISSION FOR THE BLIND AND VISUALLY IMPAIRED Discontinue Camp Marcella Lease ($29) Contract Closeout ($3)
Commission for the Blind and Visually Impaired ($32) Subtotal CENTRAL OFFICE Claims Reserve Surpluses ($10,182)
Central Office Subtotal ($10,182) DEVELOPMENTAL DISABILITIES Prior Year Community Provider Contract Recoveries ($17,000) Community Services Waiting List Adjusted Spending Projection ($8,092) Additional Federal Revenue from New Community Services Waiver ($6,000)
Developmental Disabilities Subtotal ($31,092) DISABILITY SERVICES Traumatic Brain Injury Fund Adjusted Spending Projection ($2,179)
Disability Services Subtotal ($2,179) MEDICAID Special Education Medicaid Initiative (SEMI) Federal Revenue ($4,036)
Medicaid Subtotal ($4,036) MENTAL HEALTH SERVICES Suspension of Forward Funding for Next Year's Grants ($4,500) Use of Federal Block Grant Funding to Offset State Community Care Appropriations ($2,700) Community Provider Savings ($1,300) Contract Close Out ($2)
Mental Health Services Subtotal ($8,502)
Human Services Subtotal ($65,425)
LABOR AND WORKFORCE DEVELOPMENT Administrative Cost Recovery Account - Savings ($800) Reduce Funding for Vocational Rehabilitation Placement Incentive Program ($438)
Appendix II 15

FY09 SUMMARY OF ALL REDUCTIONS (Amounts in Thousands) Amount
Reduce State Administration Costs ($254) Contract Close Out ($17) Reduce Workplace Standards Capital Improvements ($3)
Department Subtotal ($1,512)
Labor and Workforce Development Subtotal ($1,512)
LAW & PUBLIC SAFETY Line of Credit Adjustment ($3,225) Bureau of Securities ($2,500) Capital Projects - Savings ($1,202) Office of the Attorney General ($1,000) Law Enforcement Officers Training and Equipment ($882) Nuclear Facilities Security Detail ($800) Division of Civil Rights ($750) Contract Closeout ($677) Emergency Medical Services Helicopter Response Program ($422) Computer Aided Dispatch Capital Project ($404) State Police Equipment ($150) Criminal Disposition Commission ($100) Sentencing Commission ($99) Division of Criminal Justice Materials and Supplies ($20)
Department Subtotal ($12,231) ELECTION LAW ENFORCEMENT Election Law Enforcement Commission - Savings ($882)
Election Law Enforcement Subtotal ($882) STATE ETHICS COMMISSION State Ethics Commission - Savings ($230)
State Ethics Commission Subtotal ($230) OFFICE OF HOMELAND SECURITY AND PREPAREDNESS Homeland Security Grants ($1,573)
Office of Homeland Security and Preparedness ($1,573) Subtotal JUVENILE JUSTICE COMMISSION Capital Projects - Savings ($452) Third Party Provider - Savings ($288) Miscellaneous Accounts ($11)
Juvenile Justice Commission Subtotal ($751)
Law & Public Safety Subtotal ($15,667)
MILITARY & VETERANS AFFAIRS Nuclear Facilities Security Detail Savings ($1,465) Paramus Multi-Purpose Room Project Cancelled due to No Federal Grant ($627) Contract Closeout ($165) Infrastructure Projects ($67) Energy Program Receipts ($50) Jersey City Armory Project Completed ($15) Infrastructure Projects and Replacement Facility ($1) Retention of US Military Infrastructure ($1)
Department Subtotal ($2,391)
Military & Veterans Affairs Subtotal ($2,391)
PERSONNEL Contract Close Out ($89)
Department Subtotal ($89)
Personnel Subtotal ($89)
PUBLIC ADVOCATE OFFICE OF CHILD ADVOCATE Miscellaneous Accounts ($1,112) Child Advocate ($54) Contract Closeout ($3)
Office of Child Advocate Subtotal ($1,169) OFFICE OF PUBLIC ADVOCATE Miscellaneous Accounts ($1,408)
Appendix II 16

FY09 SUMMARY OF ALL REDUCTIONS (Amounts in Thousands) Amount
Contract Closeouts ($99)
Office of Public Advocate Subtotal ($1,507)
Public Advocate Subtotal ($2,676)
STATE COMMISSION ON HIGHER EDUCATION Higher Education for Special Needs Students - Savings ($356) Education of Language Minority Students - Savings ($84) Materials and Supplies - Savings ($7)
Commission on Higher Education Subtotal ($447) Voter Verified Paper Audit Trail - Shift to Pilot Program ($19,000) Presidential Primary - Savings ($126) Dept of State Equipment Accounts - Savings ($65) Materials and Supplies - Savings ($42) Department of State Miscellaneous Accounts ($38) Personal Responsibility - Savings ($26) Contract Closeout ($25)
Department Subtotal ($19,322)
HIGHER ED STUDENT ASSISTANCE AUTH. Salaries and Wages - Shift to Non-State Sources ($75) Contract Closeout ($7) Maintenance and Fixed Charges - Shift to Non-State Sources ($3)
Higher Ed Student Assistance Auth. Subtotal ($85) THE STATE LIBRARY OF NEW JERSEY New Jersey Knowledge Initiative - Savings ($390) Public Library Project Fund - Debt Service Savings ($10)
The State Library of New Jersey Subtotal ($400) NJ INSTITUTE OF TECHNOLOGY NJIT Out-of-State Tuition Adjustment ($752)
NJ Institute of Technology Subtotal ($752) PUBLIC BROADCAST AUTHORITY Contract Closeout ($86)
Public Broadcast Authority Subtotal ($86)
State Subtotal ($21,092)
TRANSPORTATION NJ Turnpike/Parkway Feeder Roads Maintenance Cost Savings ($4,000) Maritime Industry Fund ($1,000) Maritime Pilot Commission ($500) Equipment Purchase Efficiencies ($247) Suspension of Ridesharing Program ($240) Administrative Overhead ($185) Contract Closeout ($109) Excess Rental Receipts ($50)
Department Subtotal ($6,331) MOTOR VEHICLE COMMISSION Motor Vehicle Commission ($10,000) License Plate Administrative Fees ($1,655) Motorcycle Safety Education Fund ($1,200)
Motor Vehicle Commission Subtotal ($12,855) NJ TRANSIT Reduced Fuel Costs for NJ Transit ($10,000)
NJ Transit Subtotal ($10,000)
Transportation Subtotal ($29,186)
TREASURY BOARD OF PUBLIC UTILITIES Capital Projects ($1)
Board of Public Utilities Subtotal ($1) TREASURY - CASINO CONTROL FUND Casino Control Commission - Operational Efficiencies ($1,718)
Treasury - Casino Control Fund Subtotal ($1,718)
Appendix II 17

FY09 SUMMARY OF ALL REDUCTIONS (Amounts in Thousands) Amount
HIGHER ED - COUNTY COLLEGES County College Operating Aid - Offset by Supplemental Workforce Fund ($2,000) Lower Than Expected Costs For Retiree Health Benefits ($1,042)
Higher Ed - County Colleges Subtotal ($3,042) COMMERCE & ECONOMIC DEVELOPMENT Business Employment Incentive Program (BEIP) - Adjusted Spending Projection ($55,000) Small Business Development Centers Savings ($250)
Commerce & Economic Development Subtotal ($55,250) Facility Costs - Contract Closeout ($3,090) Fair and Clean Election Fund ($2,985) Governor's Council on Alcoholism and Drug Abuse ($2,000) Drug Abuse Education Fund ($1,612) Motor Vehicle Surcharge Collections ($1,002) Central Motor Pool ($920) James J. Howard Marine Sciences Laboratory ($750) Distribution Center ($610) Wage Garnishment Administrative Fees ($500) Contract Compliance - Savings ($278) Employee Housing Maintenance ($250) Federal Liaison - Savings ($250) Real Property Leasing Out - Savings ($167) Public Records Preservation ($154) Division of Revenue - Savings ($125) Management of DEP Properties - Savings ($100) Office of Public Communications ($100) Department of Treasury - Contract Closeout ($68) Capital Projects in Treasury - Contract Closeout ($51) State Cafeteria ($50) Suspension of Service and Retirement Awards ($45) Division of Taxation - Reduction in Security Guard Services ($42) Various Equipment Accounts ($8) Central Motor Pool - Uniform Savings ($2)
Department Subtotal ($15,159) TREASURY-DIRECT PROPERTY RELIEF Homestead Property Tax Rebates for Homeowners - Adjusted Spending Projection ($35,000) Senior and Disabled Citizens' Property Tax Freeze - Adjusted Spending Projection ($5,000) Reimbursement to Municipalities for Senior Citizens', Disabled Citizens', and Veterans' Tax ($3,329) Deductions - Adjusted Spending Projection
Treasury-Direct Property Relief Subtotal ($43,329) MISCELLANEOUS HIGHER ED. New Jersey Stem Cell Research Institute ($13,749) New Jersey Marine Sciences Consortium - Savings ($86) Higher Education Capital Facilities - Debt Service Savings ($33)
Miscellaneous Higher Ed. Subtotal ($13,868)
TREASURY-MUNICIPAL & COUNTY AID County Solid Waste Debt Service Assistance - Adjusted Spending Projection ($18,000) Highlands Property Tax Stabilization Aid - Adjusted Spending Projection ($8,000)
Treasury-Municipal & County Aid Subtotal ($26,000) OFFICE OF ADMINISTRATIVE LAW Office of Administrative Law ($191)
Office of Administrative Law Subtotal ($191) OFFICE OF INSPECTOR GENERAL Office of the Medicaid Inspector General ($1,500) Office of the Inspector General - Salary Savings from Attrition ($93) Office of the Inspector General - Equipment Savings ($40) Office of the Inspector General - Suspension of Subscriptions ($24) Office of the Inspector General - Increased Third Party Reimbursements ($21)
Office of Inspector General Subtotal ($1,678) OFFICE OF INFORMATION TECHNOLOGY Enhanced 911 Grants - Defer Funding for Current Grant Cycle ($12,425) Quality Assurance Oversight - Delayed Startup ($2,000) Critical Facility Preservation - Delayed Startup ($1,850)
Appendix II 18

FY09 SUMMARY OF ALL REDUCTIONS (Amounts in Thousands) Amount
Data Center Consolidation - Delayed Startup ($1,546) General Operations ($1,000) Enhanced 911 Grants Savings ($673) IT Online State Portal Web Site - Reduce Expansion ($409) Geographic Information Systems ($379) Contract Closeout ($180) Statewide 911 Emergency Telecommunication System Savings ($172) Email Systems Consolidation ($66) Office of Emergency Telecommunication Services Savings ($50) OIT Availability and Recovery Site ($41) Professional Services Savings ($30) Enhanced 911 Grants ($25) Cover Vehicle Costs with Alternative Resources ($20) Printing Supplies Savings ($10) Cover Equipment Purchases with Alternative Resources ($9) Miscellaneous Information Technology Initiatives ($8)
Office of Information Technology Subtotal ($20,893) OFFICE OF STATE COMPTROLLER Office of the State Comptroller - Savings ($1,500)
Office of State Comptroller Subtotal ($1,500) SCIENCE AND TECHNOLOGY Stem Cell Research Grants Savings ($20,700) Commission on Science and Technology Grants - Reduce FY09 Programs ($12,480)
Science and Technology Subtotal ($33,180)
Treasury Subtotal ($215,809)
INTER-DEPARTMENTAL Uncommitted Capital Balances in Various State Accounts ($12,112) Line of Credit Account ($1,540) Statewide Security Projects ($750)
Department Subtotal ($14,402) EMPLOYEE BENEFITS Pensions at $500 Million ($783,780) Unemployment Insurance - State Employees - Adjusted Spending Projection ($6,000) Alternate Benefit Program - Adjusted Spending Projection ($3,683) Pension Adjustment Program - Adjusted Spending Projection ($156) Volunteer Emergency Survivors Pension - Adjusted Spending Projection ($15)
Employee Benefits Subtotal ($793,634) OTHER INTER-DEPARTMENTAL ACCOUNTS Miscellaneous Accounts ($84,107) Adjust Corporate Business Tax for New Projection ($17,268) New Jersey Sports and Exposition Authority - Debt Service Savings ($5,447) Advertising and Promotion Statewide ($3,144) Interest on Interfund Borrowing ($900) Governor's Contingency Fund ($850) Military Leave Benefits ($380)
Other Inter-departmental Accounts Subtotal ($112,096) RENTALS AND UTILITIES UMDNJ Self Insurance Reserve Fund - Adjusted Spending Projection ($8,000) Interdepartmental Fuel & Utilities - Reduced Expenditures ($4,000) Property Occupancy Costs - Contract Closeout ($81)
Rentals and Utilities Subtotal ($12,081) SALARY & OTHER BENEFITS (ADJUSTMTS) Salary Savings from Furlough and Other Employee Actions ($25,000) Suspension of Managers' Salary Increases ($15,700) Senior Public Colleges and Universities Salary Program ($9,621) Salary Program Balances ($8,000) Reduction in Funding for Judiciary ($5,540) Wage Freeze - Executive Branch Employees ($4,000) Salary Freeze for Administrative Law Judges ($125)
Salary & Other Benefits (Adjustmts) Subtotal ($67,986)
Inter-departmental Subtotal ($1,000,199)
Appendix II 19

FY09 SUMMARY OF ALL REDUCTIONS (Amounts in Thousands) Amount
JUDICIARY Additional FY09 Judiciary Efficiencies ($1,250)
Department Subtotal ($1,250)
Judiciary Subtotal ($1,250)
TOTAL ($1,760,254)
Appendix II 20