governor mary fallin, - oklahoma turnpike authority 2nd qtr bhr.pdfyear-to-date revenue fund...
TRANSCRIPT
Prepared by the Controller Division
Governor Mary Fallin,
Member Ex-Officio Albert C. Kelly, Jr.,
Chairman David A. Burrage,
Vice-Chairman G. Carl Gibson, Secretary & Treasurer
Kenneth Adams, Member
Kevin Hern, Member
Gene Love, Member
Gary Ridley, Secretary of Transportation
Oklahoma Turnpike
Authority Report to Bondholders Second Quarter 2012
Gary Ridley, Director and Secretary of Transportation
3500 Martin Luther King Ave.• P.O. Box 11357•Oklahoma City, OK 73136-0357 • 405/425-3600 • Fax: 405/427-8246 • www.pikepass.com
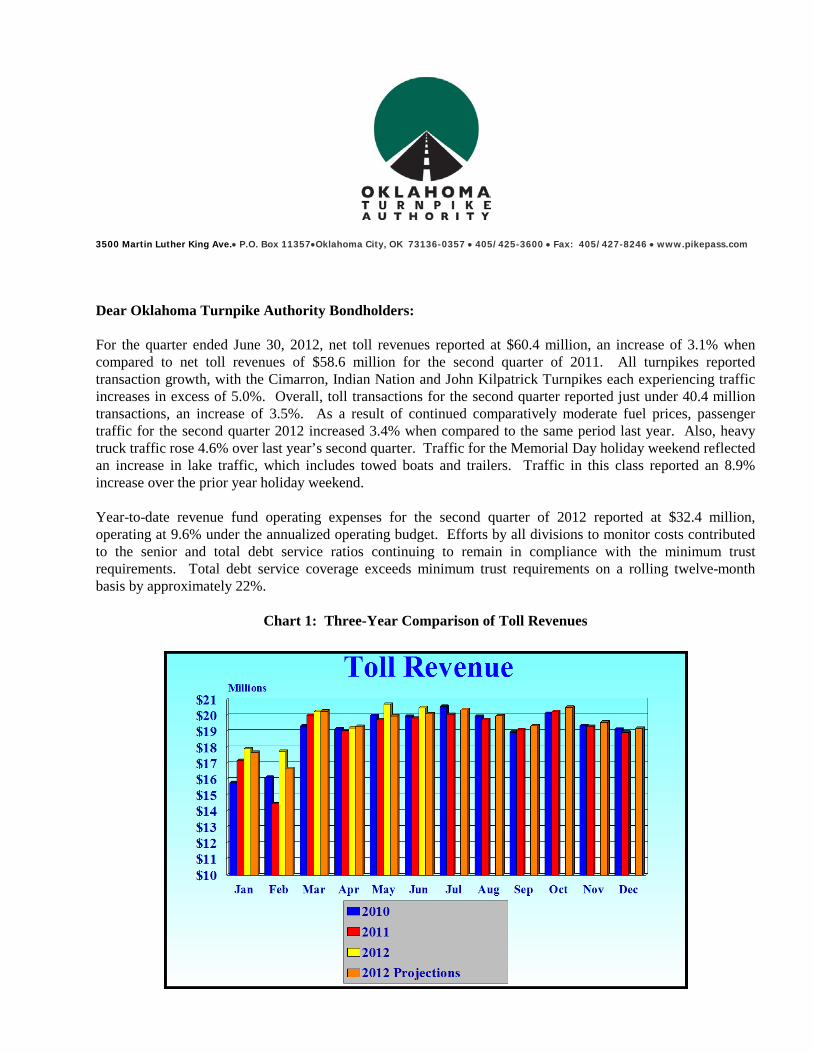
Dear Oklahoma Turnpike Authority Bondholders: For the quarter ended June 30, 2012, net toll revenues reported at $60.4 million, an increase of 3.1% when compared to net toll revenues of $58.6 million for the second quarter of 2011. All turnpikes reported transaction growth, with the Cimarron, Indian Nation and John Kilpatrick Turnpikes each experiencing traffic increases in excess of 5.0%. Overall, toll transactions for the second quarter reported just under 40.4 million transactions, an increase of 3.5%. As a result of continued comparatively moderate fuel prices, passenger traffic for the second quarter 2012 increased 3.4% when compared to the same period last year. Also, heavy truck traffic rose 4.6% over last year’s second quarter. Traffic for the Memorial Day holiday weekend reflected an increase in lake traffic, which includes towed boats and trailers. Traffic in this class reported an 8.9% increase over the prior year holiday weekend. Year-to-date revenue fund operating expenses for the second quarter of 2012 reported at $32.4 million, operating at 9.6% under the annualized operating budget. Efforts by all divisions to monitor costs contributed to the senior and total debt service ratios continuing to remain in compliance with the minimum trust requirements. Total debt service coverage exceeds minimum trust requirements on a rolling twelve-month basis by approximately 22%.
Chart 1: Three-Year Comparison of Toll Revenues

Report to Bondholders - Quarter ending June 30, 2012 - Page II
Chart 2: 2012 Operating Expenses – Budget vs. Actual Revenue Fund Only (cumulative)
$0
$10,000,000
$20,000,000
$30,000,000
$40,000,000
$50,000,000
$60,000,000
$70,000,000
$80,000,000
Jan Feb Mar Apr May Jun Jul Aug Sep Oct Nov Dec
Budget Actual
Chart 3: Operating Expenses by Division-All Funds For the Six Months Ended June 30, 2012
$1,074,931
$17,767,784
$1,658,899$6,862,613
$2,148,244
$10,751,002
General Administration
2.7% Toll & PIKEPASSOperations
44.1%
Other4.1%
Highway Patrol17.1%
Information Technology
5.3%
Engineering& Maintenance
26.7%
Second Quarter Highlights: • During the second quarter, the Engineering Division awarded several new construction contracts for
projects budgeted in the five-year capital plan, including the construction of a new maintenance building on the Turner Turnpike. In addition, construction work for the six-lane expansion projects started on the Creek and John Kilpatrick Turnpikes. Design work began on an emergency bridge project on the H. E. Bailey Turnpike. The Engineering Division continues to work with other divisions and the Consulting Engineer to indentify the needs of the Authority and develop the current five-year capital plan.
• Throughout the second quarter, the Maintenance Division, supplementing labor through supervised inmates
and contractors, completed various System repairs. With combined efforts, approximately 982,000 linear feet of joints and cracks were sealed and approximately 285,000 square yards of drainage repairs were completed. In addition, the Maintenance Division performed brush and weed control and maintained approximately 10,000 acres of vegetation management.
• During April, the Controller Division staff finalized the preparation of the 2011 Comprehensive Annual
Financial Report (CAFR) and distributed the report in compliance with the trust-required deadlines. Controller Division staff performed all design work for the 2011 CAFR in-house, providing a significant cost savings to OTA. This 2011 CAFR was submitted to the Government Finance Officers Association of the United States and Canada (GFOA) to apply for the Certificate of Achievement Award for Excellence in Financial Reporting. During June, the Controller Division management staff attended the annual conference of the GFOA. The GFOA conference offers the most current education and information on the latest issues and financial reporting requirements affecting state and local governments.
• As of June 30, 2012, the total number of active PIKEPASS tags increased to 1.3 million or 12.6% over the number of active PIKEPASS tags at June 30, 2011. Current active sticker tags total nearly 1.1 million and represent approximately 80% of total active tags on the System. The OTA’s third party service provider, TransCore Houston, continues to coordinate the replacement effort of existing tags with sticker tags. In the second quarter, TransCore Houston issued over 69,000 sticker tags. Total active PIKEPASS accounts totaled over 582,000 at June 30, 2012, an increase of 4.7% when compared to the prior year. PIKEPASS patrons continued to take advantage of the PIKEPASS volume discount program with approximately $946,000 in discounts issued to frequent patrons of the System during the second quarter of 2012.

Report to Bondholders - Quarter ending June 30, 2012 - Page III • The Toll Division staff, in conjunction with the Engineering Division, completed the work necessary to
relocate the toll collection equipment to accommodate the widening projects on the Creek and John Kilpatrick Turnpikes. In addition, the installation of toll collection equipment at the new Aspen interchange on the Creek Turnpike was completed, and the interchange was opened to traffic. A new tollbooth was installed on the Cherokee Turnpike. The infinity lane controller system of the electronic toll collection lanes continues on schedule, with completion projected in September.
• The OHP troopers continued their efforts to achieve safe patron travel through several enforcement programs. In the second quarter of 2012, OHP troopers made over 33,000 violator contacts and assisted over 4,200 motorists.
Respectfully, Albert C. Kelly, Jr. Chairman of the Authority Gary Ridley Director and Secretary of Transportation
Report to Bondholders - Quarter ending June 30, 2012 - Page IV
OKLAHOMA TURNPIKE AUTHORITYTABLE OF CONTENTS
June 30, 2012
Schedule Page
Statements of Net Assets 1
Schedule of Deposits and Withdrawals 2
Statements of Revenues, Expenses and Changes in Net Assets 3
Statement of Revenues - Total All Turnpikes 4
Statement of Revenues - Turner Turnpike 5
Statement of Revenues - Will Rogers Turnpike 6
Statement of Revenues - H. E. Bailey Turnpike 7
Statement of Revenues - Muskogee Turnpike 8
Statement of Revenues - Indian Nation Turnpike 9
Statement of Revenues - Cimarron Turnpike 10
Statement of Revenues - John Kilpatrick Turnpike 11
Statement of Revenues - Cherokee Turnpike 12
Statement of Revenues - Chickasaw Turnpike 13
Statement of Revenues - Creek Turnpike 14
Schedule of Cash, Cash Equivalents and Investments 15
Schedule of Bonds Issued, Retired, Defeased and Outstanding 18
Schedule of Sales of Surplus Property 18
Prepared by the Controller Division
Report to Bondholders - Quarter ending June 30, 2012 - Page 1
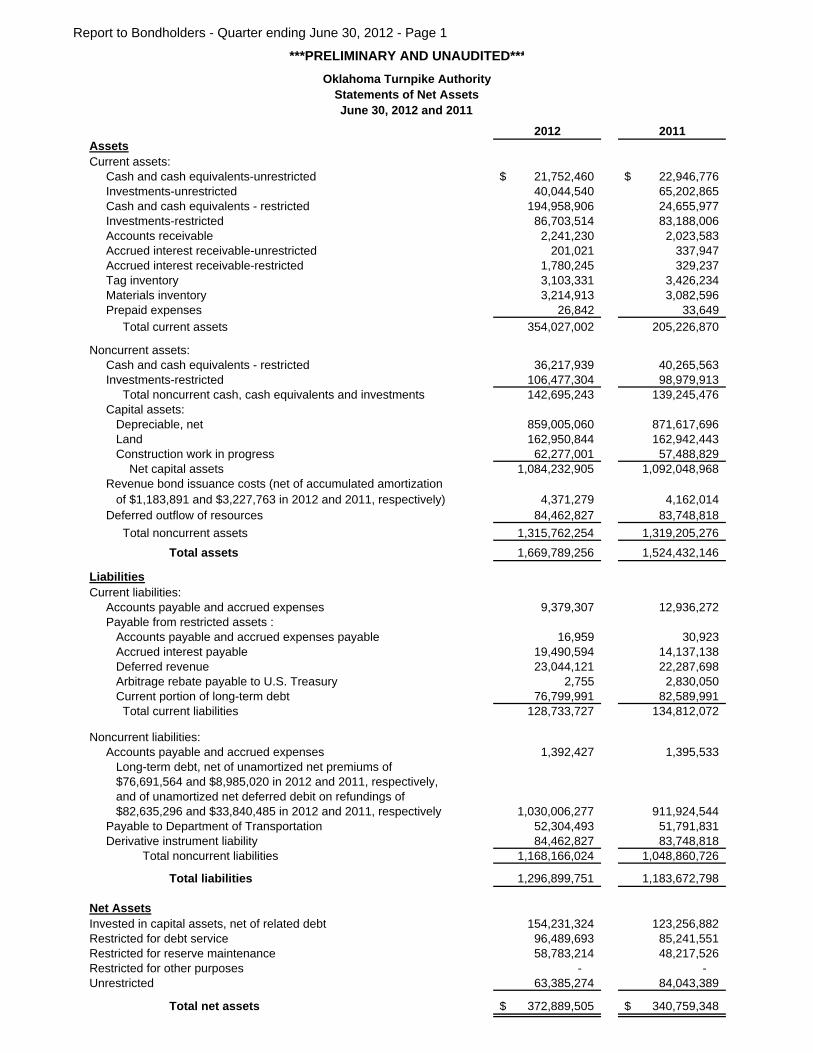
***PRELIMINARY AND UNAUDITED***Oklahoma Turnpike Authority
Statements of Net AssetsJune 30, 2012 and 2011
2012 2011AssetsCurrent assets: Cash and cash equivalents-unrestricted 21,752,460$ 22,946,776$ Investments-unrestricted 40,044,540 65,202,865 Cash and cash equivalents - restricted 194,958,906 24,655,977 Investments-restricted 86,703,514 83,188,006 Accounts receivable 2,241,230 2,023,583 Accrued interest receivable-unrestricted 201,021 337,947 Accrued interest receivable-restricted 1,780,245 329,237 Tag inventory 3,103,331 3,426,234 Materials inventory 3,214,913 3,082,596 Prepaid expenses 26,842 33,649 Total current assets 354,027,002 205,226,870
Noncurrent assets: Cash and cash equivalents - restricted 36,217,939 40,265,563 Investments-restricted 106,477,304 98,979,913 Total noncurrent cash, cash equivalents and investments 142,695,243 139,245,476 Capital assets: Depreciable, net 859,005,060 871,617,696 Land 162,950,844 162,942,443 Construction work in progress 62,277,001 57,488,829 Net capital assets 1,084,232,905 1,092,048,968 Revenue bond issuance costs (net of accumulated amortization of $1,183,891 and $3,227,763 in 2012 and 2011, respectively) 4,371,279 4,162,014 Deferred outflow of resources 84,462,827 83,748,818 Total noncurrent assets 1,315,762,254 1,319,205,276 Total assets 1,669,789,256 1,524,432,146
LiabilitiesCurrent liabilities: Accounts payable and accrued expenses 9,379,307 12,936,272 Payable from restricted assets : Accounts payable and accrued expenses payable 16,959 30,923 Accrued interest payable 19,490,594 14,137,138 Deferred revenue 23,044,121 22,287,698 Arbitrage rebate payable to U.S. Treasury 2,755 2,830,050 Current portion of long-term debt 76,799,991 82,589,991 Total current liabilities 128,733,727 134,812,072
Noncurrent liabilities: Accounts payable and accrued expenses 1,392,427 1,395,533 Long-term debt, net of unamortized net premiums of $76,691,564 and $8,985,020 in 2012 and 2011, respectively, and of unamortized net deferred debit on refundings of $82,635,296 and $33,840,485 in 2012 and 2011, respectively 1,030,006,277 911,924,544 Payable to Department of Transportation 52,304,493 51,791,831 Derivative instrument liability 84,462,827 83,748,818 Total noncurrent liabilities 1,168,166,024 1,048,860,726 Total liabilities 1,296,899,751 1,183,672,798
Net AssetsInvested in capital assets, net of related debt 154,231,324 123,256,882Restricted for debt service 96,489,693 85,241,551Restricted for reserve maintenance 58,783,214 48,217,526Restricted for other purposes - - Unrestricted 63,385,274 84,043,389
Total net assets 372,889,505$ 340,759,348$
Report to Bondholders - Quarter ending June 30, 2012 - Page 2
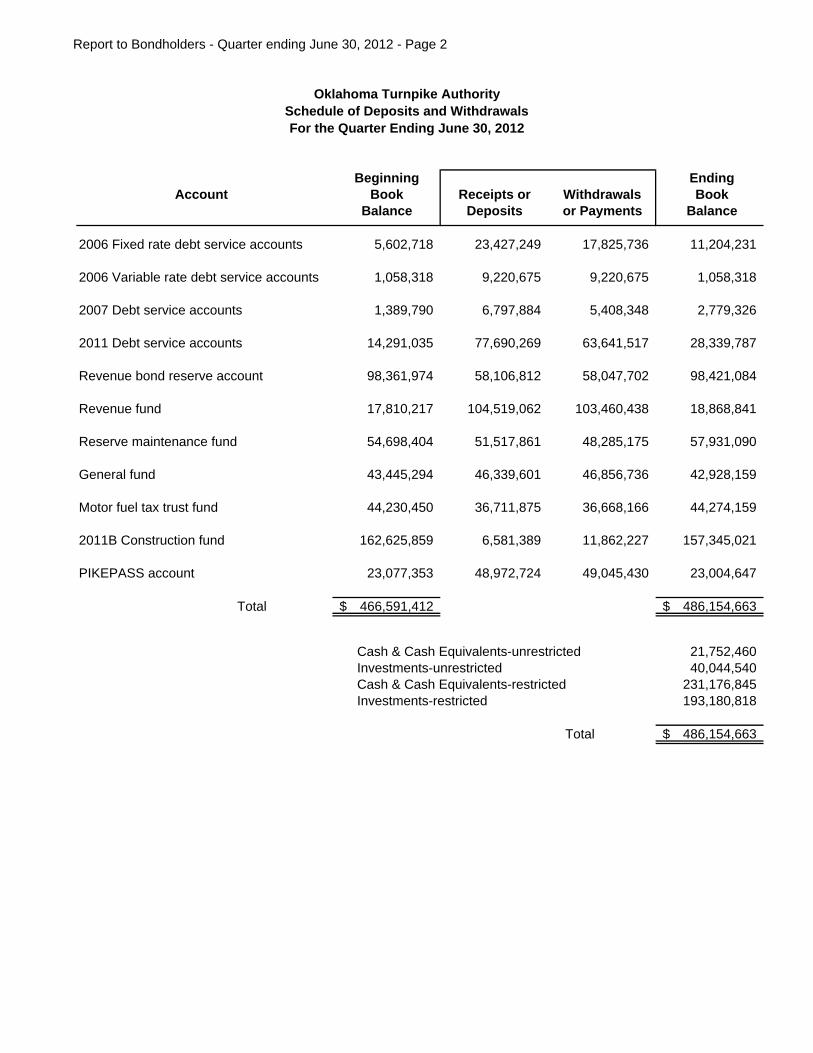
Oklahoma Turnpike AuthoritySchedule of Deposits and WithdrawalsFor the Quarter Ending June 30, 2012
Beginning EndingAccount Book Receipts or Withdrawals Book
Balance Deposits or Payments Balance
2006 Fixed rate debt service accounts 5,602,718 23,427,249 17,825,736 11,204,231
2006 Variable rate debt service accounts 1,058,318 9,220,675 9,220,675 1,058,318
2007 Debt service accounts 1,389,790 6,797,884 5,408,348 2,779,326
2011 Debt service accounts 14,291,035 77,690,269 63,641,517 28,339,787
Revenue bond reserve account 98,361,974 58,106,812 58,047,702 98,421,084
Revenue fund 17,810,217 104,519,062 103,460,438 18,868,841
Reserve maintenance fund 54,698,404 51,517,861 48,285,175 57,931,090
General fund 43,445,294 46,339,601 46,856,736 42,928,159
Motor fuel tax trust fund 44,230,450 36,711,875 36,668,166 44,274,159
2011B Construction fund 162,625,859 6,581,389 11,862,227 157,345,021
PIKEPASS account 23,077,353 48,972,724 49,045,430 23,004,647
Total 466,591,412$ 486,154,663$
Cash & Cash Equivalents-unrestricted 21,752,460 Investments-unrestricted 40,044,540 Cash & Cash Equivalents-restricted 231,176,845 Investments-restricted 193,180,818
Total 486,154,663$
Report to Bondholders - Quarter ending June 30, 2012 - Page 3
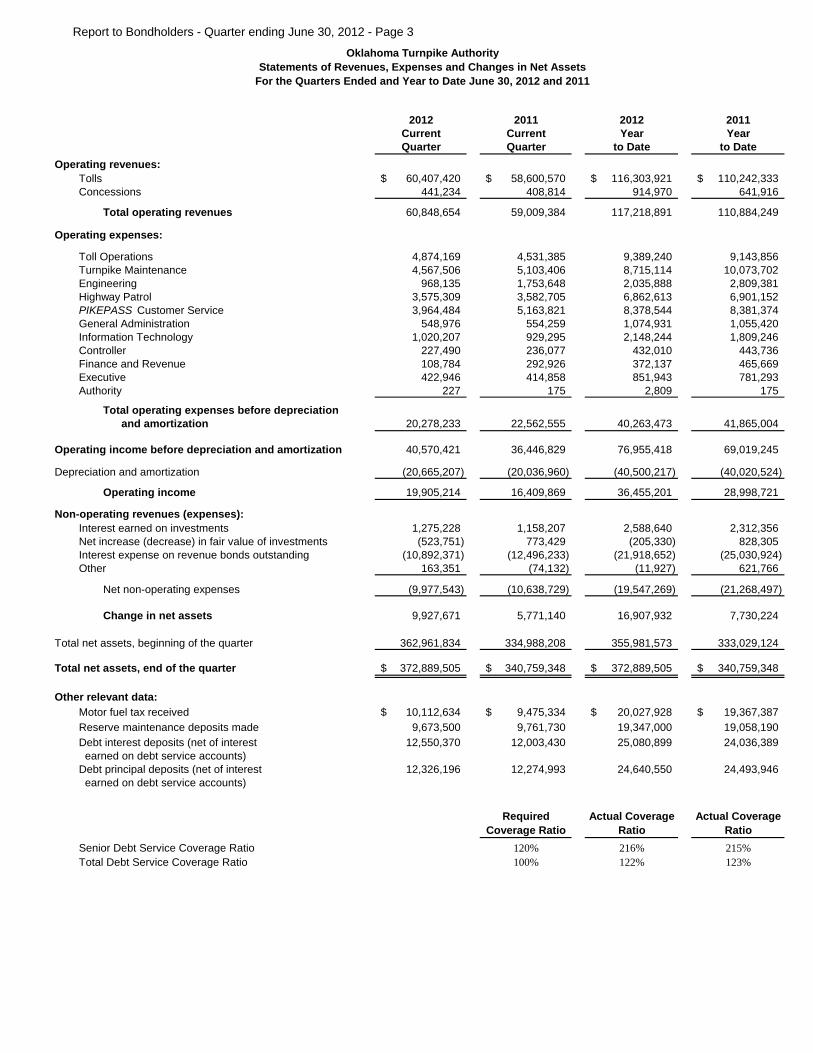
Oklahoma Turnpike AuthorityStatements of Revenues, Expenses and Changes in Net Assets
For the Quarters Ended and Year to Date June 30, 2012 and 2011
2012 2011 2012 2011Current Current Year YearQuarter Quarter to Date to Date
Operating revenues: Tolls 60,407,420$ 58,600,570$ 116,303,921$ 110,242,333$ Concessions 441,234 408,814 914,970 641,916
Total operating revenues 60,848,654 59,009,384 117,218,891 110,884,249
Operating expenses:
Toll Operations 4,874,169 4,531,385 9,389,240 9,143,856 Turnpike Maintenance 4,567,506 5,103,406 8,715,114 10,073,702 Engineering 968,135 1,753,648 2,035,888 2,809,381 Highway Patrol 3,575,309 3,582,705 6,862,613 6,901,152 PIKEPASS Customer Service 3,964,484 5,163,821 8,378,544 8,381,374 General Administration 548,976 554,259 1,074,931 1,055,420 Information Technology 1,020,207 929,295 2,148,244 1,809,246 Controller 227,490 236,077 432,010 443,736 Finance and Revenue 108,784 292,926 372,137 465,669 Executive 422,946 414,858 851,943 781,293 Authority 227 175 2,809 175
Total operating expenses before depreciation and amortization 20,278,233 22,562,555 40,263,473 41,865,004
Operating income before depreciation and amortization 40,570,421 36,446,829 76,955,418 69,019,245
Depreciation and amortization (20,665,207) (20,036,960) (40,500,217) (40,020,524)
Operating income 19,905,214 16,409,869 36,455,201 28,998,721
Non-operating revenues (expenses): Interest earned on investments 1,275,228 1,158,207 2,588,640 2,312,356 Net increase (decrease) in fair value of investments (523,751) 773,429 (205,330) 828,305 Interest expense on revenue bonds outstanding (10,892,371) (12,496,233) (21,918,652) (25,030,924) Other 163,351 (74,132) (11,927) 621,766
Net non-operating expenses (9,977,543) (10,638,729) (19,547,269) (21,268,497)
Change in net assets 9,927,671 5,771,140 16,907,932 7,730,224
Total net assets, beginning of the quarter 362,961,834 334,988,208 355,981,573 333,029,124
Total net assets, end of the quarter 372,889,505$ 340,759,348$ 372,889,505$ 340,759,348$
Other relevant data: Motor fuel tax received 10,112,634$ 9,475,334$ 20,027,928$ 19,367,387$ Reserve maintenance deposits made 9,673,500 9,761,730 19,347,000 19,058,190 Debt interest deposits (net of interest 12,550,370 12,003,430 25,080,899 24,036,389 earned on debt service accounts) Debt principal deposits (net of interest 12,326,196 12,274,993 24,640,550 24,493,946 earned on debt service accounts)
Required Coverage Ratio
Actual Coverage Ratio
Actual Coverage Ratio
Senior Debt Service Coverage Ratio 120% 216% 215% Total Debt Service Coverage Ratio 100% 122% 123%
Report to Bondholders - Quarter ending June 30, 2012 - Page 4
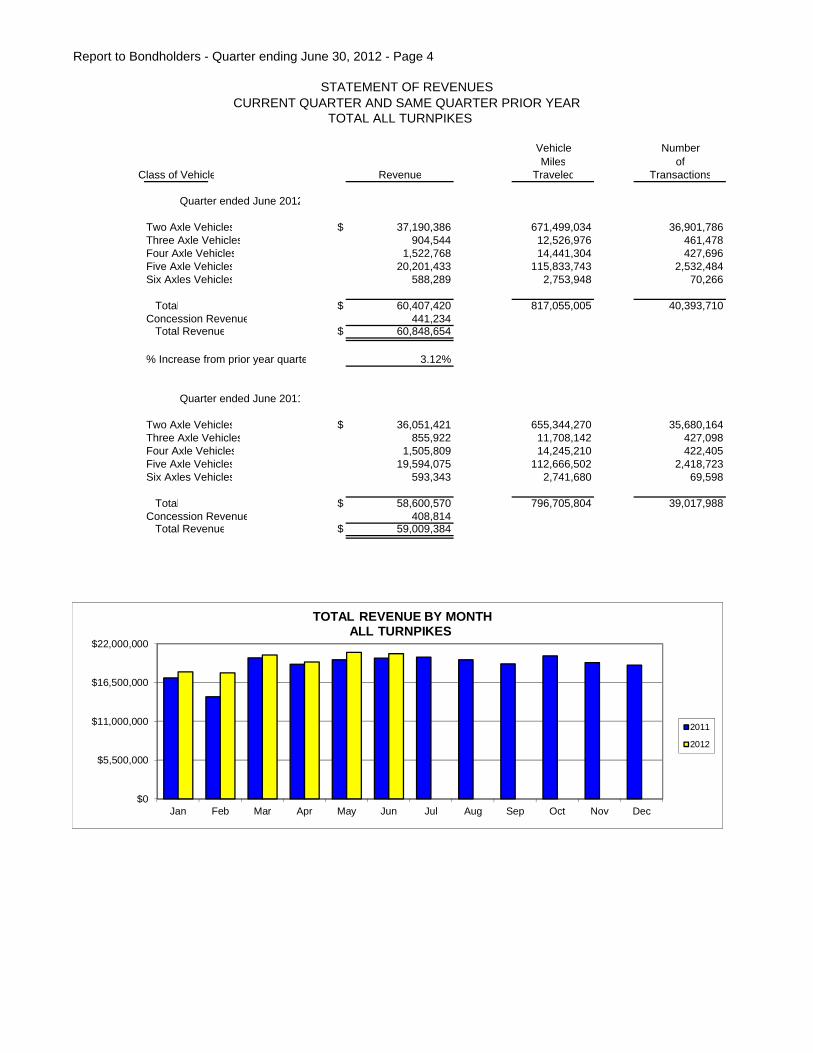
STATEMENT OF REVENUES CURRENT QUARTER AND SAME QUARTER PRIOR YEAR
TOTAL ALL TURNPIKES
Vehicle NumberMiles of
Class of Vehicle Revenue Traveled Transactions
Quarter ended June 2012
Two Axle Vehicles $ 37,190,386 671,499,034 36,901,786Three Axle Vehicles 904,544 12,526,976 461,478Four Axle Vehicles 1,522,768 14,441,304 427,696Five Axle Vehicles 20,201,433 115,833,743 2,532,484Six Axles Vehicles 588,289 2,753,948 70,266
Total $ 60,407,420 817,055,005 40,393,710Concession Revenue 441,234 Total Revenue $ 60,848,654
% Increase from prior year quarte 3.12%
Quarter ended June 2011
Two Axle Vehicles $ 36,051,421 655,344,270 35,680,164Three Axle Vehicles 855,922 11,708,142 427,098Four Axle Vehicles 1,505,809 14,245,210 422,405Five Axle Vehicles 19,594,075 112,666,502 2,418,723Six Axles Vehicles 593,343 2,741,680 69,598
Total $ 58,600,570 796,705,804 39,017,988Concession Revenue 408,814 Total Revenue $ 59,009,384
$0
$5,500,000
$11,000,000
$16,500,000
$22,000,000
Jan Feb Mar Apr May Jun Jul Aug Sep Oct Nov Dec
TOTAL REVENUE BY MONTHALL TURNPIKES
2011
2012

Report to Bondholders - Quarter ending June 30, 2012 - Page 5
STATEMENT OF REVENUES CURRENT QUARTER AND SAME QUARTER PRIOR YEAR
TURNER TURNPIKE
Vehicle NumberMiles of
Class of Vehicle Revenue Traveled Transactions
Quarter ended June 2012
Two Axle Vehicles $ 7,353,413 171,862,742 3,634,946Three Axle Vehicles 228,575 3,320,606 55,893Four Axle Vehicles 415,588 3,968,150 58,293Five Axle Vehicles 6,498,471 35,928,852 472,237Six Axles Vehicles 197,697 922,630 12,206
Total $ 14,693,744 216,002,980 4,233,575Concession Revenue 78,808 Total Revenue $ 14,772,552
% Increase from prior year quarte 2.59%
Quarter ended June 2011
Two Axle Vehicles $ 7,117,986 167,648,802 3,439,149Three Axle Vehicles 221,665 3,173,046 52,118Four Axle Vehicles 406,723 3,903,938 56,939Five Axle Vehicles 6,369,756 35,225,699 459,391Six Axles Vehicles 211,925 981,762 13,257
Total $ 14,328,055 210,933,247 4,020,854Concession Revenue 72,224 Total Revenue $ 14,400,279
$0
$1,375,000
$2,750,000
$4,125,000
$5,500,000
Jan Feb Mar Apr May Jun Jul Aug Sep Oct Nov Dec
TOTAL REVENUE BY MONTHTURNER TURNPIKE
2011
2012
Report to Bondholders - Quarter ending June 30, 2012 - Page 6
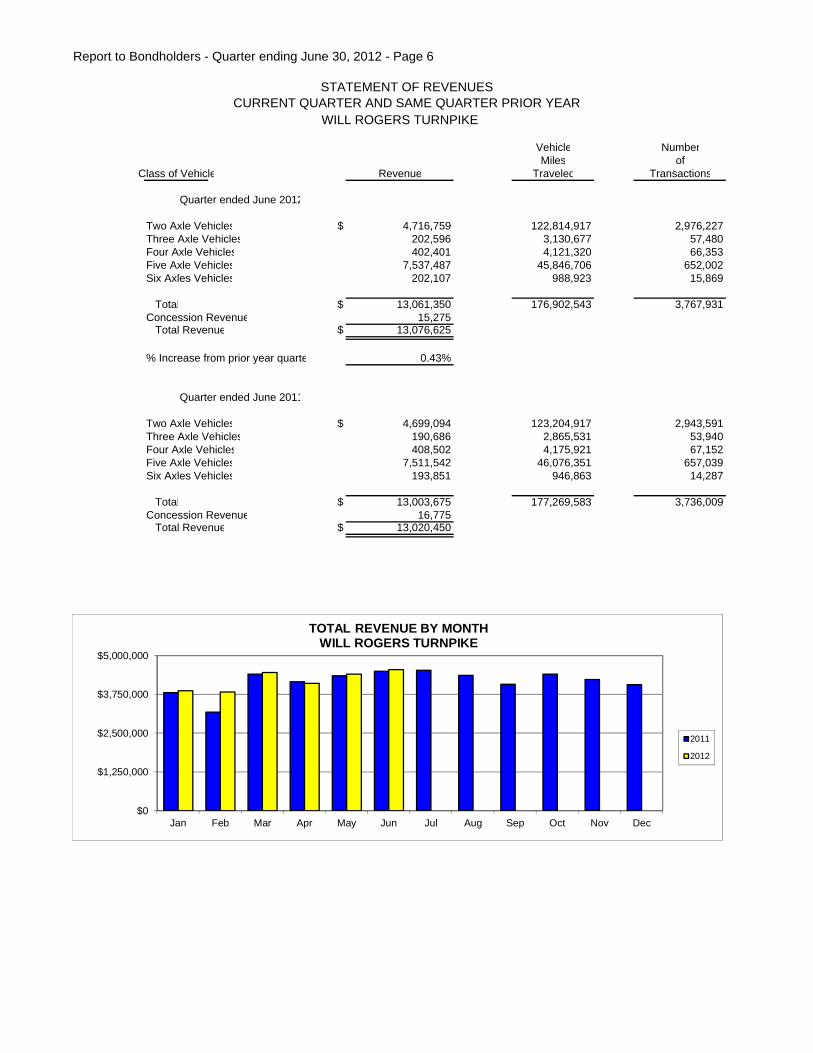
STATEMENT OF REVENUES CURRENT QUARTER AND SAME QUARTER PRIOR YEAR
WILL ROGERS TURNPIKE
Vehicle NumberMiles of
Class of Vehicle Revenue Traveled Transactions
Quarter ended June 2012
Two Axle Vehicles $ 4,716,759 122,814,917 2,976,227Three Axle Vehicles 202,596 3,130,677 57,480Four Axle Vehicles 402,401 4,121,320 66,353Five Axle Vehicles 7,537,487 45,846,706 652,002Six Axles Vehicles 202,107 988,923 15,869
Total $ 13,061,350 176,902,543 3,767,931Concession Revenue 15,275 Total Revenue $ 13,076,625
% Increase from prior year quarte 0.43%
Quarter ended June 2011
Two Axle Vehicles $ 4,699,094 123,204,917 2,943,591Three Axle Vehicles 190,686 2,865,531 53,940Four Axle Vehicles 408,502 4,175,921 67,152Five Axle Vehicles 7,511,542 46,076,351 657,039Six Axles Vehicles 193,851 946,863 14,287
Total $ 13,003,675 177,269,583 3,736,009Concession Revenue 16,775 Total Revenue $ 13,020,450
$0
$1,250,000
$2,500,000
$3,750,000
$5,000,000
Jan Feb Mar Apr May Jun Jul Aug Sep Oct Nov Dec
TOTAL REVENUE BY MONTHWILL ROGERS TURNPIKE
2011
2012

Report to Bondholders - Quarter ending June 30, 2012 - Page 7
STATEMENT OF REVENUES CURRENT QUARTER AND SAME QUARTER PRIOR YEAR
H. E. BAILEY TURNPIKE
Vehicle NumberMiles of
Class of Vehicle Revenue Traveled Transactions
Quarter ended June 2012
Two Axle Vehicles $ 4,570,616 88,510,348 4,159,122Three Axle Vehicles 94,296 1,345,306 54,888Four Axle Vehicles 163,019 1,572,558 64,123Five Axle Vehicles 1,187,320 7,720,413 293,192Six Axles Vehicles 39,076 213,416 9,493
Total $ 6,054,327 99,362,041 4,580,818Concession Revenue 71,875 Total Revenue $ 6,126,202
% Increase from prior year quarte 4.29%
Quarter ended June 2011
Two Axle Vehicles $ 4,434,183 86,002,751 4,038,152Three Axle Vehicles 90,486 1,296,354 54,782Four Axle Vehicles 152,653 1,492,161 60,221Five Axle Vehicles 1,093,729 7,123,362 269,688Six Axles Vehicles 33,474 185,497 7,890
Total $ 5,804,525 96,100,125 4,430,733Concession Revenue 69,546 Total Revenue $ 5,874,071
$0
$600,000
$1,200,000
$1,800,000
$2,400,000
Jan Feb Mar Apr May Jun Jul Aug Sep Oct Nov Dec
TOTAL REVENUES BY MONTHH.E. BAILEY TURNPIKE
2011
2012

Report to Bondholders - Quarter ending June 30, 2012 - Page 8
STATEMENT OF REVENUES CURRENT QUARTER AND SAME QUARTER PRIOR YEAR
MUSKOGEE TURNPIKE
Vehicle NumberMiles of
Class of Vehicle Revenue Traveled Transactions
Quarter ended June 2012
Two Axle Vehicles $ 3,106,386 62,061,007 2,519,232Three Axle Vehicles 59,720 801,017 32,813Four Axle Vehicles 94,733 914,184 37,911Five Axle Vehicles 952,580 5,723,619 225,897Six Axles Vehicles 22,344 117,098 5,210
Total $ 4,235,763 69,616,925 2,821,063Concession Revenue 41,786 Total Revenue $ 4,277,549
% Increase from prior year quarte 3.93%
Quarter ended June 2011
Two Axle Vehicles $ 2,966,561 59,451,281 2,402,443Three Axle Vehicles 62,886 842,125 34,734Four Axle Vehicles 96,921 930,083 39,575Five Axle Vehicles 920,997 5,541,573 217,633Six Axles Vehicles 28,665 153,676 6,409
Total $ 4,076,030 66,918,738 2,700,794Concession Revenue 39,929 Total Revenue $ 4,115,959
$0
$400,000
$800,000
$1,200,000
$1,600,000
Jan Feb Mar Apr May Jun Jul Aug Sep Oct Nov Dec
TOTAL REVENUE BY MONTHMUSKOGEE TURNPIKE
2011
2012

Report to Bondholders - Quarter ending June 30, 2012 - Page 9
STATEMENT OF REVENUES CURRENT QUARTER AND SAME QUARTER PRIOR YEAR
INDIAN NATION TURNPIKE
Vehicle NumberMiles of
Class of Vehicle Revenue Traveled Transactions
Quarter ended June 2012
Two Axle Vehicles $ 2,005,051 41,588,561 1,281,367Three Axle Vehicles 62,984 1,086,856 34,348Four Axle Vehicles 152,961 1,596,990 50,643Five Axle Vehicles 1,417,811 8,698,627 261,631Six Axles Vehicles 32,551 166,822 4,959
Total $ 3,671,358 53,137,856 1,632,948Concession Revenue 60,012 Total Revenue $ 3,731,370
% Increase from prior year quarte 7.62%
Quarter ended June 2011
Two Axle Vehicles $ 1,913,065 39,694,012 1,248,523Three Axle Vehicles 60,200 1,043,033 32,993Four Axle Vehicles 153,635 1,617,427 52,225Five Axle Vehicles 1,258,003 7,733,630 235,106Six Axles Vehicles 29,454 151,552 4,573
Total $ 3,414,357 50,239,654 1,573,420Concession Revenue 52,793 Total Revenue $ 3,467,150
$0
$400,000
$800,000
$1,200,000
$1,600,000
Jan Feb Mar Apr May Jun Jul Aug Sep Oct Nov Dec
TOTAL REVENUE BY MONTHINDIAN NATION TURNPIKE
2011
2012

Report to Bondholders - Quarter ending June 30, 2012 - Page 10
STATEMENT OF REVENUES CURRENT QUARTER AND SAME QUARTER PRIOR YEAR
CIMARRON TURNPIKE
Vehicle NumberMiles of
Class of Vehicle Revenue Traveled Transactions
Quarter ended June 2012
Two Axle Vehicles $ 1,554,910 32,853,945 1,530,159Three Axle Vehicles 52,493 868,431 36,916Four Axle Vehicles 97,296 1,017,476 41,361Five Axle Vehicles 1,061,610 5,933,770 223,321Six Axles Vehicles 32,120 150,233 6,198
Total $ 2,798,429 40,823,855 1,837,955Concession Revenue 158,478 Total Revenue $ 2,956,907
% Increase from prior year quarte 10.25%
Quarter ended June 2011
Two Axle Vehicles $ 1,469,340 30,741,256 1,456,565Three Axle Vehicles 41,580 650,261 27,963Four Axle Vehicles 86,108 836,931 34,676Five Axle Vehicles 921,244 5,010,343 189,205Six Axles Vehicles 21,274 95,571 3,955
Total $ 2,539,546 37,334,362 1,712,364Concession Revenue 142,547 Total Revenue $ 2,682,093
$0
$250,000
$500,000
$750,000
$1,000,000
$1,250,000
Jan Feb Mar Apr May Jun Jul Aug Sep Oct Nov Dec
TOTAL REVENUE BY MONTHCIMARRON TURNPIKE
2011
2012

Report to Bondholders - Quarter ending June 30, 2012 - Page 11
STATEMENT OF REVENUES CURRENT QUARTER AND SAME QUARTER PRIOR YEAR
JOHN KILPATRICK TURNPIKE
Vehicle NumberMiles of
Class of Vehicle Revenue Traveled Transactions
Quarter ended June 2012
Two Axle Vehicles $ 6,627,077 64,729,377 9,860,075Three Axle Vehicles 74,609 571,528 68,311Four Axle Vehicles 77,412 436,138 46,773Five Axle Vehicles 495,183 1,688,529 130,016Six Axles Vehicles 31,722 89,596 7,595
Total $ 7,306,003 67,515,168 10,112,770Concession Revenue 0 Total Revenue $ 7,306,003
% Increase from prior year quarte 5.14%
Quarter ended June 2011
Two Axle Vehicles $ 6,329,024 62,324,424 9,438,907Three Axle Vehicles 64,019 497,321 57,591Four Axle Vehicles 79,032 448,363 47,143Five Axle Vehicles 439,945 1,511,353 111,912Six Axles Vehicles 36,752 94,205 9,009
Total $ 6,948,772 64,875,666 9,664,562Concession Revenue 0 Total Revenue $ 6,948,772
$0
$600,000
$1,200,000
$1,800,000
$2,400,000
$3,000,000
Jan Feb Mar Apr May Jun Jul Aug Sep Oct Nov Dec
TOTAL REVENUE BY MONTHJOHN KILPATRICK TURNPIKE
2011
2012

Report to Bondholders - Quarter ending June 30, 2012 - Page 12
STATEMENT OF REVENUES CURRENT QUARTER AND SAME QUARTER PRIOR YEAR
CHEROKEE TURNPIKE
Vehicle NumberMiles of
Class of Vehicle Revenue Traveled Transactions
Quarter ended June 2012
Two Axle Vehicles $ 1,293,973 18,668,914 928,535Three Axle Vehicles 33,386 324,153 16,175Four Axle Vehicles 54,373 361,984 13,062Five Axle Vehicles 572,563 2,291,707 77,237Six Axles Vehicles 8,980 30,619 1,262
Total $ 1,963,275 21,677,377 1,036,271Concession Revenue 15,000 Total Revenue $ 1,978,275
% Increase from prior year quarte 2.62%
Quarter ended June 2011
Two Axle Vehicles $ 1,243,722 18,015,644 889,996Three Axle Vehicles 34,909 341,431 16,505Four Axle Vehicles 54,070 364,874 13,291Five Axle Vehicles 570,576 2,300,031 77,560Six Axles Vehicles 9,550 33,155 1,322
Total $ 1,912,827 21,055,135 998,674Concession Revenue 15,000 Total Revenue $ 1,927,827
$0
$200,000
$400,000
$600,000
$800,000
Jan Feb Mar Apr May Jun Jul Aug Sep Oct Nov Dec
TOTAL REVENUE BY MONTHCHEROKEE TURNPIKE
2011
2012

Report to Bondholders - Quarter ending June 30, 2012 - Page 13
STATEMENT OF REVENUES CURRENT QUARTER AND SAME QUARTER PRIOR YEAR
CHICKASAW TURNPIKE
Vehicle NumberMiles of
Class of Vehicle Revenue Traveled Transactions
Quarter ended June 2012
Two Axle Vehicles $ 109,510 3,210,972 187,886Three Axle Vehicles 23,194 499,764 29,243Four Axle Vehicles 4,846 52,330 3,062Five Axle Vehicles 37,686 335,715 19,644Six Axles Vehicles 1,353 11,434 669
Total $ 176,589 4,110,215 240,504Concession Revenue 0 Total Revenue $ 176,589
% Increase from prior year quarte 2.52%
Quarter ended June 2011
Two Axle Vehicles $ 108,508 3,213,826 188,053Three Axle Vehicles 20,022 436,632 25,549Four Axle Vehicles 4,831 53,201 3,113Five Axle Vehicles 37,360 332,282 19,443Six Axles Vehicles 1,529 12,937 757
Total $ 172,250 4,048,878 236,915Concession Revenue 0 Total Revenue $ 172,250
$0
$17,500
$35,000
$52,500
$70,000
Jan Feb Mar Apr May Jun Jul Aug Sep Oct Nov Dec
TOTAL REVENUE BY MONTHCHICKASAW TURNPIKE
2011
2012

Report to Bondholders - Quarter ending June 30, 2012 - Page 14
STATEMENT OF REVENUES CURRENT QUARTER AND SAME QUARTER PRIOR YEAR
CREEK TURNPIKE
Vehicle NumberMiles of
Class of Vehicle Revenue Traveled Transactions
Quarter ended June 2012
Two Axle Vehicles $ 5,852,691 65,198,251 9,824,237Three Axle Vehicles 72,691 578,638 75,411Four Axle Vehicles 60,139 400,174 46,115Five Axle Vehicles 440,722 1,665,805 177,307Six Axles Vehicles 20,339 63,177 6,805
Total $ 6,446,582 67,906,045 10,129,875Concession Revenue 0 Total Revenue $ 6,446,582
% Increase from prior year quarte 0.72%
Quarter ended June 2011
Two Axle Vehicles $ 5,769,938 65,047,357 9,634,785Three Axle Vehicles 69,469 562,408 70,923Four Axle Vehicles 63,334 422,311 48,070Five Axle Vehicles 470,923 1,811,878 181,746Six Axles Vehicles 26,869 86,462 8,139
Total $ 6,400,533 67,930,416 9,943,663Concession Revenue 0 Total Revenue $ 6,400,533
$0
$600,000
$1,200,000
$1,800,000
$2,400,000
Jan Feb Mar Apr May Jun Jul Aug Sep Oct Nov Dec
TOTAL REVENUE BY MONTHCREEK TURNPIKE
2011
2012
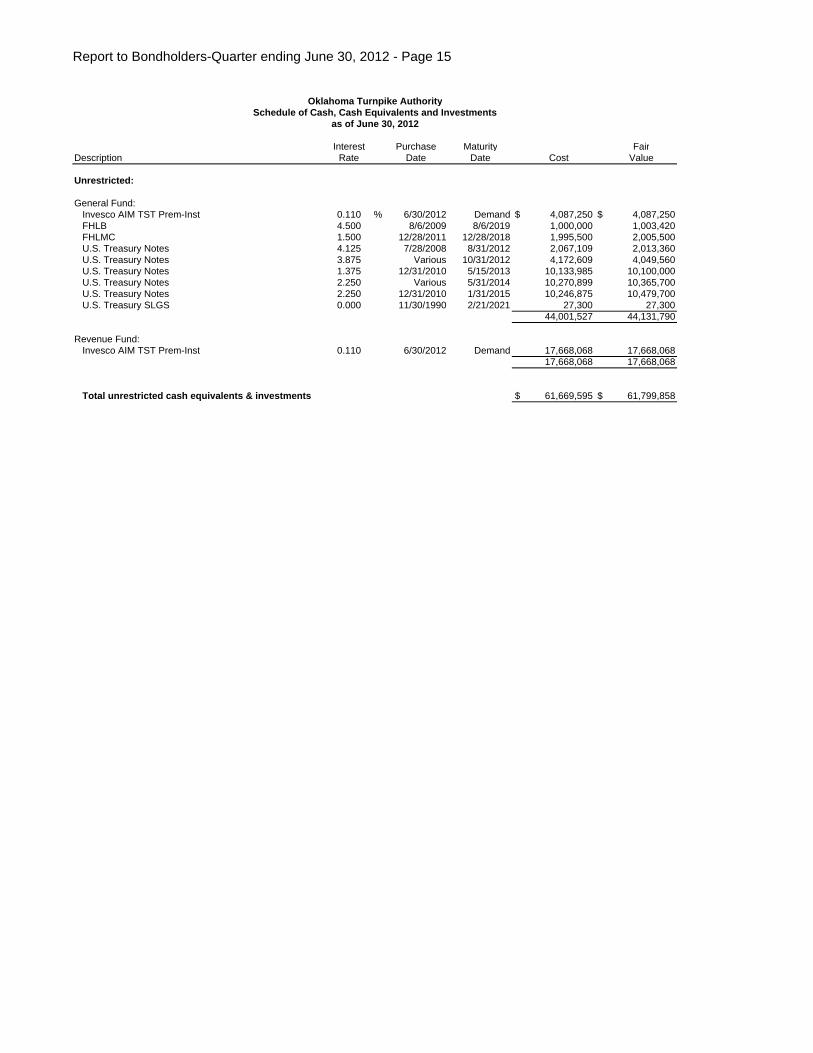
Report to Bondholders-Quarter ending June 30, 2012 - Page 15
Oklahoma Turnpike AuthoritySchedule of Cash, Cash Equivalents and Investments
as of June 30, 2012
Interest Purchase Maturity FairDescription Rate Date Date Cost Value
Unrestricted:
General Fund:Invesco AIM TST Prem-Inst 0.110 % 6/30/2012 Demand $ 4,087,250 $ 4,087,250FHLB 4.500 8/6/2009 8/6/2019 1,000,000 1,003,420FHLMC 1.500 12/28/2011 12/28/2018 1,995,500 2,005,500U.S. Treasury Notes 4.125 7/28/2008 8/31/2012 2,067,109 2,013,360U.S. Treasury Notes 3.875 Various 10/31/2012 4,172,609 4,049,560U.S. Treasury Notes 1.375 12/31/2010 5/15/2013 10,133,985 10,100,000U.S. Treasury Notes 2.250 Various 5/31/2014 10,270,899 10,365,700U.S. Treasury Notes 2.250 12/31/2010 1/31/2015 10,246,875 10,479,700U.S. Treasury SLGS 0.000 11/30/1990 2/21/2021 27,300 27,300
44,001,527 44,131,790
Revenue Fund:Invesco AIM TST Prem-Inst 0.110 6/30/2012 Demand 17,668,068 17,668,068
17,668,068 17,668,068
Total unrestricted cash equivalents & investments $ 61,669,595 $ 61,799,858
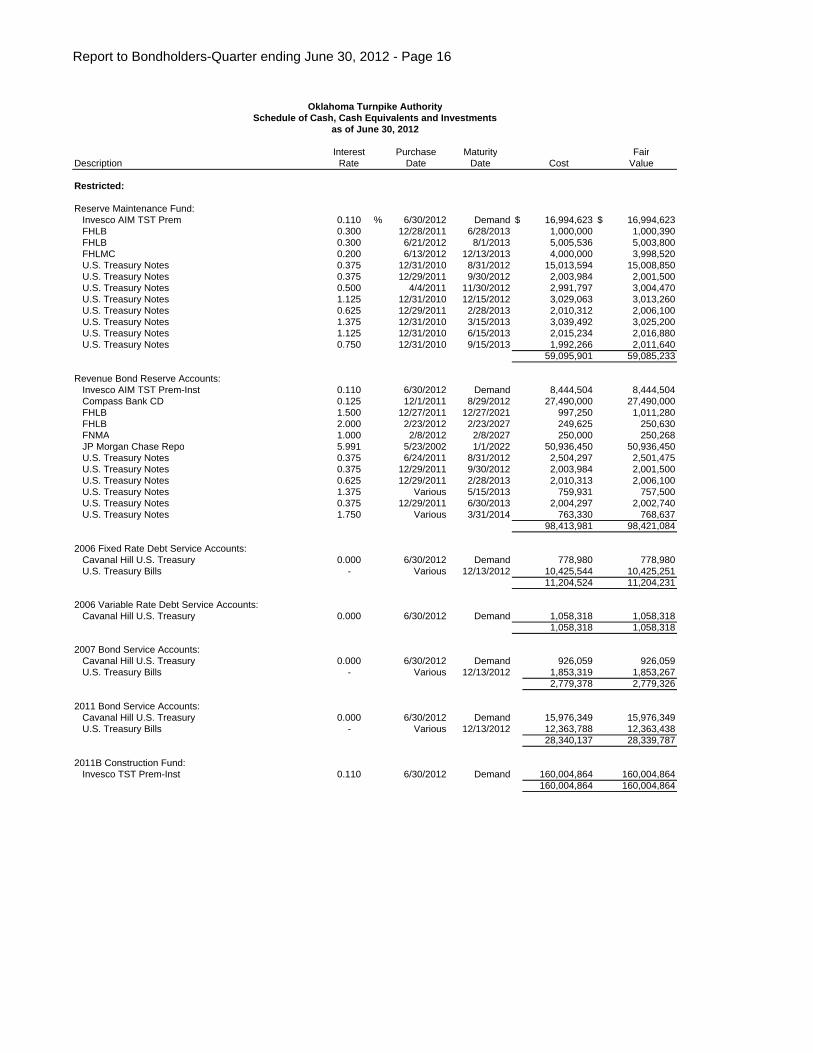
Report to Bondholders-Quarter ending June 30, 2012 - Page 16
Oklahoma Turnpike AuthoritySchedule of Cash, Cash Equivalents and Investments
as of June 30, 2012
Interest Purchase Maturity FairDescription Rate Date Date Cost Value
Restricted:
Reserve Maintenance Fund:Invesco AIM TST Prem 0.110 % 6/30/2012 Demand $ 16,994,623 $ 16,994,623FHLB 0.300 12/28/2011 6/28/2013 1,000,000 1,000,390FHLB 0.300 6/21/2012 8/1/2013 5,005,536 5,003,800FHLMC 0.200 6/13/2012 12/13/2013 4,000,000 3,998,520U.S. Treasury Notes 0.375 12/31/2010 8/31/2012 15,013,594 15,008,850U.S. Treasury Notes 0.375 12/29/2011 9/30/2012 2,003,984 2,001,500U.S. Treasury Notes 0.500 4/4/2011 11/30/2012 2,991,797 3,004,470U.S. Treasury Notes 1.125 12/31/2010 12/15/2012 3,029,063 3,013,260U.S. Treasury Notes 0.625 12/29/2011 2/28/2013 2,010,312 2,006,100U.S. Treasury Notes 1.375 12/31/2010 3/15/2013 3,039,492 3,025,200U.S. Treasury Notes 1.125 12/31/2010 6/15/2013 2,015,234 2,016,880U.S. Treasury Notes 0.750 12/31/2010 9/15/2013 1,992,266 2,011,640
59,095,901 59,085,233
Revenue Bond Reserve Accounts:Invesco AIM TST Prem-Inst 0.110 6/30/2012 Demand 8,444,504 8,444,504Compass Bank CD 0.125 12/1/2011 8/29/2012 27,490,000 27,490,000FHLB 1.500 12/27/2011 12/27/2021 997,250 1,011,280FHLB 2.000 2/23/2012 2/23/2027 249,625 250,630FNMA 1.000 2/8/2012 2/8/2027 250,000 250,268JP Morgan Chase Repo 5.991 5/23/2002 1/1/2022 50,936,450 50,936,450U.S. Treasury Notes 0.375 6/24/2011 8/31/2012 2,504,297 2,501,475U.S. Treasury Notes 0.375 12/29/2011 9/30/2012 2,003,984 2,001,500U.S. Treasury Notes 0.625 12/29/2011 2/28/2013 2,010,313 2,006,100U.S. Treasury Notes 1.375 Various 5/15/2013 759,931 757,500U.S. Treasury Notes 0.375 12/29/2011 6/30/2013 2,004,297 2,002,740U.S. Treasury Notes 1.750 Various 3/31/2014 763,330 768,637
98,413,981 98,421,084
2006 Fixed Rate Debt Service Accounts:Cavanal Hill U.S. Treasury 0.000 6/30/2012 Demand 778,980 778,980U.S. Treasury Bills - Various 12/13/2012 10,425,544 10,425,251
11,204,524 11,204,231
2006 Variable Rate Debt Service Accounts:Cavanal Hill U.S. Treasury 0.000 6/30/2012 Demand 1,058,318 1,058,318
1,058,318 1,058,318
2007 Bond Service Accounts:Cavanal Hill U.S. Treasury 0.000 6/30/2012 Demand 926,059 926,059U.S. Treasury Bills - Various 12/13/2012 1,853,319 1,853,267
2,779,378 2,779,326
2011 Bond Service Accounts:Cavanal Hill U.S. Treasury 0.000 6/30/2012 Demand 15,976,349 15,976,349U.S. Treasury Bills - Various 12/13/2012 12,363,788 12,363,438
28,340,137 28,339,787
2011B Construction Fund:Invesco TST Prem-Inst 0.110 6/30/2012 Demand 160,004,864 160,004,864
160,004,864 160,004,864

Report to Bondholders-Quarter ending June 30, 2012 - Page 17
Oklahoma Turnpike AuthoritySchedule of Cash, Cash Equivalents and Investments
as of June 30, 2012
Interest Purchase Maturity FairDescription Rate Date Date Cost ValueTurnpike Trust Fund:
Cavanal Hill U.S. Treasury 0.010 % 6/30/2012 Demand $ 283,435 $ 283,435U.S. Treasury Notes 4.125 7/28/2008 8/31/2012 2,067,109 2,013,360U.S. Treasury Notes 0.375 6/24/2011 8/31/2012 3,004,102 3,001,770U.S. Treasury Notes 0.375 12/29/2011 9/30/2012 2,003,984 2,001,500U.S. Treasury Notes 1.375 3/18/2010 10/15/2012 5,017,383 5,018,400U.S. Treasury Notes 0.500 4/4/2011 11/30/2012 3,995,039 4,005,960U.S. Treasury Notes 0.625 12/29/2011 2/28/2013 3,014,570 3,009,150U.S. Treasury Notes 1.375 Various 3/15/2013 6,082,500 6,050,400U.S. Treasury Notes 0.375 12/29/2011 6/30/2013 2,004,297 2,002,740U.S. Treasury Notes 0.500 4/9/2012 10/15/2013 4,011,563 4,011,560U.S. Treasury Notes 0.250 3/6/2012 2/28/2014 1,998,750 1,998,280U.S. Treasury Notes 1.875 Various 4/30/2014 5,100,625 5,141,450U.S. Treasury Notes 2.250 2/16/2011 5/31/2014 3,071,602 3,109,710U.S. Treasury Notes 0.500 6/27/2012 8/15/2014 300,996 301,056U.S. Treasury Notes 1.250 6/27/2012 10/31/2015 1,025,039 1,025,080U.S. Treasury Notes 1.000 6/27/2012 8/31/2016 304,781 304,758U.S. Treasury Notes 0.625 6/27/2012 5/31/2017 995,508 995,550
44,281,283 44,274,159
Prepaid PIKEPASS Fund:BOK Short-Term Cash Fund I 0.020 6/30/2012 Demand 239,471 239,471FHLB 4.500 8/6/2009 8/6/2019 1,000,000 1,003,420FHLB 2.500 4/5/2012 4/26/2024 1,000,000 1,004,540FHLB 2.000 9/16/2011 9/16/2026 98,950 100,129FHLB 2.000 2/23/2012 2/23/2027 249,625 250,630FHLMC 2.000 8/1/2011 7/29/2021 199,500 202,438FNMA 3.000 9/23/2011 8/24/2026 698,740 699,650FNMA 2.000 9/30/2011 9/30/2026 798,800 800,000FNMA 1.750 10/12/2011 10/9/2026 699,300 700,077FNMA 2.000 12/28/2011 12/28/2026 1,000,000 1,002,690FNMA 1.000 2/8/2012 2/8/2027 250,000 250,267FNMA 1.000 3/22/2012 3/22/2027 500,000 500,850FNMA 2.000 3/22/2012 3/22/2027 500,000 503,360FNMA 1.000 6/14/2012 6/24/2027 1,000,000 1,000,350FNMA 1.000 6/21/2012 6/21/2027 99,900 99,585FNMA 2.000 6/28/2012 6/28/2027 997,500 994,490U.S. Treasury Notes 4.125 7/28/2008 8/31/2012 775,166 755,010U.S. Treasury Notes 0.375 6/24/2011 8/31/2012 500,859 500,295U.S. Treasury Notes 1.125 12/31/2010 12/15/2012 201,938 200,884U.S. Treasury Notes 1.125 12/31/2010 6/15/2013 704,988 705,908U.S. Treasury Notes 1.750 12/31/2010 3/31/2014 509,434 512,425Vanguard 500 Index Trust (open-end mutual fund) - Various Demand 4,016,421 4,413,286Ishares MSCI Emerging Mkts (closed-end equity fund) - 12/31/2010 6/15/2013 149,904 133,059Ishares Morgan Stanley Capitol Internationa Europe Asia Far East Index (closed-end equity fund) - 12/31/2010 3/31/2014 559,810 524,580Ishares RSSLL MIDCAP Index (closed-end equity fund) - Various Demand 193,462 184,380Ishares Russell 2000 Index (closed-end equity fund) - 9/29/2010 Demand 181,357 238,680Ishares S&P MIDCAP 400 (closed-end equity fund) - Various Demand 270,420 282,510Ishares S&P Smallcap 600 (closed-end equity fund) - 10/22/2007 Demand 288,310 402,985S&P 500 Depository Receipts (closed-end equity fund) - Various Demand 1,674,804 1,905,470The First Na ME CD 2.700 2/23/2010 2/23/2015 99,000 99,000
19,457,659 20,210,419
Total restricted cash equivalents & investments 424,636,045 425,377,421
Cash balance (unrestricted & restricted) - (1,022,616)
Total Cash, Cash Equivalents and Investments $ 486,305,640 $ 486,154,663
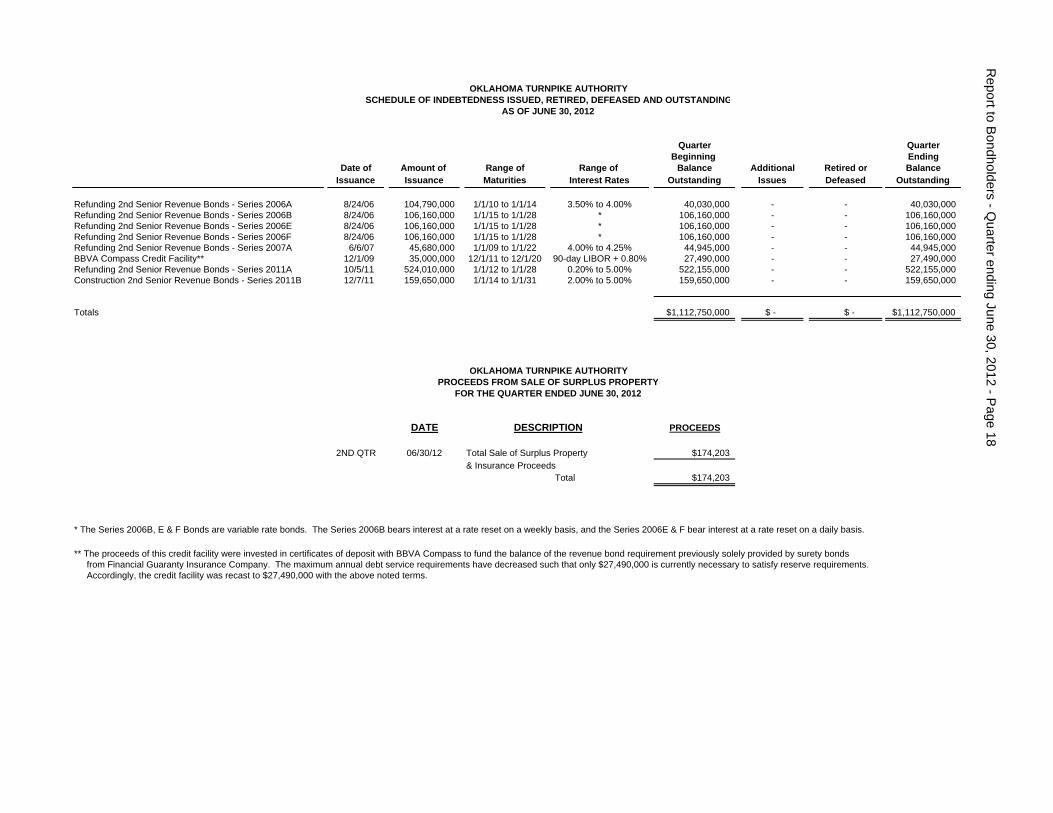
OKLAHOMA TURNPIKE AUTHORITYSCHEDULE OF INDEBTEDNESS ISSUED, RETIRED, DEFEASED AND OUTSTANDING
AS OF JUNE 30, 2012
Quarter QuarterBeginning Ending
Date of Amount of Range of Range of Balance Additional Retired or BalanceIssuance Issuance Maturities Interest Rates Outstanding Issues Defeased Outstanding
Refunding 2nd Senior Revenue Bonds - Series 2006A 8/24/06 104,790,000 1/1/10 to 1/1/14 3.50% to 4.00% 40,030,000 - - 40,030,000 Refunding 2nd Senior Revenue Bonds - Series 2006B 8/24/06 106,160,000 1/1/15 to 1/1/28 * 106,160,000 - - 106,160,000 Refunding 2nd Senior Revenue Bonds - Series 2006E 8/24/06 106,160,000 1/1/15 to 1/1/28 * 106,160,000 - - 106,160,000 Refunding 2nd Senior Revenue Bonds - Series 2006F 8/24/06 106,160,000 1/1/15 to 1/1/28 * 106,160,000 - - 106,160,000 Refunding 2nd Senior Revenue Bonds - Series 2007A 6/6/07 45,680,000 1/1/09 to 1/1/22 4.00% to 4.25% 44,945,000 - - 44,945,000 BBVA Compass Credit Facility** 12/1/09 35,000,000 12/1/11 to 12/1/20 90-day LIBOR + 0.80% 27,490,000 - - 27,490,000 Refunding 2nd Senior Revenue Bonds - Series 2011A 10/5/11 524,010,000 1/1/12 to 1/1/28 0.20% to 5.00% 522,155,000 - - 522,155,000 Construction 2nd Senior Revenue Bonds - Series 2011B 12/7/11 159,650,000 1/1/14 to 1/1/31 2.00% to 5.00% 159,650,000 - - 159,650,000
Totals $1,112,750,000 $ - $ - $1,112,750,000
OKLAHOMA TURNPIKE AUTHORITYPROCEEDS FROM SALE OF SURPLUS PROPERTY
FOR THE QUARTER ENDED JUNE 30, 2012
DATE DESCRIPTION PROCEEDS
2ND QTR 06/30/12 Total Sale of Surplus Property $174,203& Insurance Proceeds
Total $174,203
* The Series 2006B, E & F Bonds are variable rate bonds. The Series 2006B bears interest at a rate reset on a weekly basis, and the Series 2006E & F bear interest at a rate reset on a daily basis.
** The proceeds of this credit facility were invested in certificates of deposit with BBVA Compass to fund the balance of the revenue bond requirement previously solely provided by surety bonds from Financial Guaranty Insurance Company. The maximum annual debt service requirements have decreased such that only $27,490,000 is currently necessary to satisfy reserve requirements. Accordingly, the credit facility was recast to $27,490,000 with the above noted terms.
Report to B
ondholders -Quarter ending June 30, 2012 -P
age 18