gowanus canal fs tests are started more than 2 weeks after collection, it is desirable to conduct...
TRANSCRIPT
Gowanus Canal FS
EPA Meeting
April 26, 2012
2
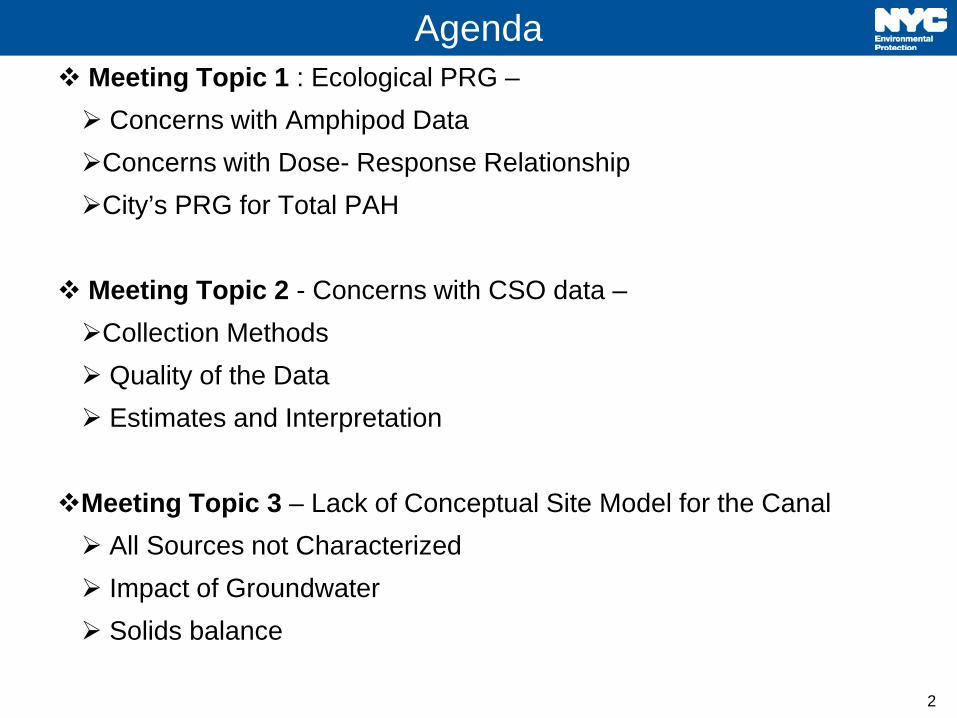
Agenda Meeting Topic 1 : Ecological PRG – Concerns with Amphipod Data Concerns with Dose- Response Relationship City’s PRG for Total PAH
Meeting Topic 2 - Concerns with CSO data – Collection Methods Quality of the Data Estimates and Interpretation
Meeting Topic 3 – Lack of Conceptual Site Model for the Canal All Sources not Characterized Impact of Groundwater Solids balance

3
Topic 1: Concerns with EPA Ecological PRG

4
Open Uncertainties Regarding Amphipod Testing
Exceeding Recommended Holding Times?
EPA’s Leptocheirus Guidance (2001) recommends two weeks holding times and always less than 8 weeks to minimize test variability and effects on toxicity (in ether direction)
EPA ARCs states “Recommended sediment holding time ranges from less than two (ASTM 1993) to less than 8 weeks (USEPA-USACOE 1993). If whole-sediment toxicity tests are started more than 2 weeks after collection, it is desirable to conduct additional characterizations of sediment to evaluate possible effects of storage on sediment.”
Were final tests re-run on the same test sediments as used in the first two failed tests, on new samples, or on an archived subsample?
EPA Leptocheirus Guidance recommends minimal disturbance of test sediments
‒ Unclear how samples were sub-sampled three times without significant disturbance of samples
Assessment and Remediation of Contaminated Sediments (ARCS) Program, Assessment Guidance Document Chapter 6, US Environmental Protection Agency. 1994. ARCS Assessment Guidance Document. EPA 905-B94-002. Chicago, Ill.: Great Lakes National Program Office. EPA 600/R-01/020, March 2001, Method for Assessing the Chronic Toxicity of Marine and Estuarine Sediment-associated Contaminants with the Amphipod Leptocheirus plumulosus, Office of Research and Development, Western Ecology Division, U.S. Environmental Protection Agency

5
Open Uncertainties Regarding Amphipod Testing
Was sample exhausted?
If sample was exhausted, how were experimental samples held between restarts of the Lepthcherius test?
How were sediments held between attempts?
EPA does not address the potential changes in the sediment during the unspecified periods between trials;
The EPA laboratory report does not address or explain the revised testing – the reference to these re-trials occurs only in a footnote to the text.

6
Station 326
Reason for Exclusion Comment Closest to canal with highest likelihood of canal influences
(1) Station 326 had the lowest concentration of total PAHs (1.8 ppm) of all the references stations indicating little influence from canal.
Highest frequency of metal criteria exceedances and only reference area station to exceed SELs for chromium, lead, and silver
(1) Station 326 did not exceed the SEL for Chromium (2) Station 326 slightly exceeded the SEL for Lead
based on an estimated value (3) Frequencies of exceeding LELs are (10/11 at 326;
6/11 at 328; 9/11 at 329; 7/11 at 330 and 333)
NYC recommends retaining station 326 as a reference station because it does not appear to be under the influence of the canal (very lowest measured PAH concentrations) and contributes to the range of reference conditions inherent in a reference envelope approach.

7
Range of PRGs Based on Leptocheirus Tests
Value (ppm)
Source Endpoint Basis
39 EPA Survival NOAEC from Graphical Method
39 NYC Survival Maximum Concentration at Site Station(s) Within Reference Envelope Survival
24.5 NYC Survival Average Concentration of Non-Toxic Site Stations (if station 326 is retained as a reference station)
7.8 EPA Growth NOEAC from Graphical Method
39 NYC Growth Statistical Comparison of Site Sample Toxicity (station 303) to Toxicity at EPA NOAEC Sample (station 328)
39 NYC Growth Maximum Concentration at Site Station(s) Within Reference Envelope Survival
26.7 NYC Growth Average Concentration of Non-Toxic Site Stations (if station 326 is retained as a reference station)
7.8 EPA Repro. NOAEC from Graphical Method 33.9 NYC Repro. Statistical Comparison of Site Sample Toxicity (station
321) to Toxicity at EPA NOAEC Sample (station 328)
25.4 NYC Repro. Average Concentration of Non-Toxic Site Stations (if station 326 is retained as a reference station)

8
EPA Comment Regarding PRG at Reynolds Metal
Reynolds Metal PRG of 10 ppm total PAH was “based on ingestion of fish by local residents and represent sediment contaminant concentrations which would be associated with carcinogenic risks on the order of 10[-4]”
EPA/ROD/R02-93/201, 1993, EPA Superfund Record of Decision: REYNOLDS METALS CO EPA ID: NYD002245967 OU 01, MASSENA, NY, 09/27/1993

9
PRG of 7.8 is Outside Range at Other Sites The Gowanus Canal PRG (EPA Estimate) for Total PAHs is 2 to 18 Times Lower Than Those Developed at Other Sites Nation-Wide:
PRGs From Various Sites Nation-Wide Applied to Gowanus Canal (assuming 6.4% TOC in Gowanus Canal based on Table 1.1 Summary of Sediment Physical Characteristics Gowanus Canal Feasibility Study) Site Site-Specific
PRG Total PAH ppm
Basis of PRG Development PRG Applied to Gowanus Canal Conditions (ppm)
Basis of Application
Gowanus Canal – NYC Estimate
85 25 to 39
(1) Based on Nereis Toxicity (2) Based on Leptocheirus Toxicity
85 25 to 39
Mean concentration among non-toxic samples
Gowanus Canal EPA Estimate
7.8 (1) Leptocheirus Toxicity 7.8 See critique of method in prior slides
Buffalo River 16 (1) Ten Day Benthic Toxicity Tests (2) Benthic Invertebrate Equilibrium Partitioning Model (3) Target Lipid Model for Invertebrates (3) Chronic Invertebrate Toxicity Testing
16 Provided as Bulk Sediment Concentration
Steven’s Point, WI 22.8 (1) Adopted Probable Effects Levels for Invertebrates from MacDonald et al. 2000.
22.8 Provided as Bulk Sediment Concentration
Grand Calumet River, Lake Michigan
30.8 (1) 28 Day Benthic Toxicity Tests (2) Regression Analysis (3) Comparison to Threshold Values for protection of benthic organisms and Effect Levels From Literature (to demonstrate validity of site specific calculations)
24.3 Extrapolated from Calumet Site PRG of 3.8 ppm @ 1% TOC and adjusted for Gowanus Canal TOC
Indiana Harbor, Lake Michigan
45.8 (1) 28 Day Benthic Toxicity Tests (2) Regression Analysis (3) Comparison to Threshold Values for protection of benthic organisms and Effect Levels From Literature (to demonstrate validity of site specific calculations)
36.5
Extrapolated from Indiana Harbor Site PRG of 5.7 ppm @ 1% TOC and adjusted for Gowanus Canal TOC
Elizabeth River, VA 45 (1) Regional Benthic Toxicity Studies (2) Application Of An Exposure Model To Site Specific Sediment Data, (3)Comparison Between Onsite And Background Sediment [PAH]
45 Provided as Bulk Sediment Concentration
Duwamish 79 Human Health Effects 79 Provided as Bulk Sediment Concentration
Ashland Northern States Power
9.5 (1) Benthic Toxicity Testing (2) Comparison to Benthic effects benchmarks
146
Extrapolated from Ashland PRG of 9.5 ppm @ 0.415% TOC and adjusted for Gowanus Canal TOC
11
Topic 2: Concerns with CSO Data

12
CSO Data Collection EPA’s Sampling Program for CSOs consisted of the following:
COPC measurements on CSO solids from pipes. (These data were not used by EPA although the samples are a direct measure of CSO solids)
COPC measurements on CSO effluent during wet weather event
Includes limited composite measurements.
For PAHs, only whole water analysis was conducted. Separate phases were not analyzed yet EPA’s estimate of the solids phase concentration is the basis for its remedy selection for CSOs.
Highly variable nature of CSO TSS concentrations lead to very uncertain estimates of contaminant concentrations on CSO solids.

13
Duplicate results collected by EPA for CSOs show inconsistent agreement.
There are differences in the absolute values as well as the PAH signature among duplicates
CSO Datasets have a High Degree of Uncertainty – Poor Agreement with Duplicates
Analyte
Actual Concethe ntration (ug/L) Percentage of Total PAH Concentration
RH-033 Duplicate
RH-033 OH-007
Duplicate OH-007
RH-033 Duplicate
RH-033 OH-007
Duplicate OH-007
2-Methylnaphthalene 2.1 0.2 0.26 12% 10% 10%
Acenaphthene 1.1 1.7 0.21 0.19 100% 10% 10% 7%
Acenaphthylene
Anthracene 0.16 0.15 1% 6%
Benzo(a)Anthracene 0.19 0.096 0.15 1% 5% 6%
Benzo(a)Pyrene
Benzo(b)Fluoranthene 0.39 0.21 0.29 2% 10% 11%
Benzo(g,h,i)Perylene 0.42 2%
Benzo(k)Fluoranthene 0.066 0.15 0.25 7% 10%
Chrysene 0.13 0.12 0.19 1% 6% 7%
Dibenz(a,h)Anthracene 0.11 0.16 0% 5% 6%
Fluoranthene 0.44 2%
Fluorene 0.33 0.14 0.21 2% 7% 8%
Indeno(1,2,3-c,d)Pyrene 0.39 2%
Naphthalene 10 0.23 0.35 57% 11% 14%
Phenanthrene 0.89 0.27 0.35 5% 13% 14%
Pyrene 0.41 0.3 2% 15%
Total PAH 1.1 17.616 2.036 2.55 176% RPD 22% RPD

14
CSO Datasets have a High Degree of Uncertainty – Poor Agreement among Duplicates
CSO Weather
Event Sample
Type Aluminum (ug/L) Iron (ug/L) Lead (ug/L)
Magnesium (ug/L)
RH-033 WWE 1 N 331 2220 21.6 5790
RH-033_Dup WWE 1 FD 1620 J 8800 103 75000 U
OH-007 WWE 3 N 200 U 1180 J 56.4 2910 J
OH-007_Dup WWE 3 FD 137 J 858 J 50.6 2680 J

15
Composite samples were not collected by EPA to characterize the CSOs.
Sampling for CSOs needs to account for first flush and a composite sample for the “rest of the storm”. From some results, it appears that the captured sample is “first flush”.
TSS results show high variability for different wet weather events. Average Relative Percent Difference of 100 %.
For some CSOs (RH-035, RH-037) the dry weather TSS is significantly less than the Wet Weather TSS result.
Anticipated Dry weather TSS results are ~ 120 mg/L. RH-038 has TSS of 467 mg/L ( 4 times the anticipated value).
For duplicate analytical results, duplicate TSS values were not reported (measured?)
Duplicates do not appear to be collected for TSS data.
TSS result was not reported by EPA for RH-034 Wet Weather Event 3.
10
100
1000
TSS
(mg/
L)
TSS for Wet and Dry Weather Events
WW1
WW2
WW3
Dry
0%
20%
40%
60%
80%
100%
120%
140%
160%
180%
Rel
ativ
e Pe
rcen
t Diff
eren
ce fo
r TSS
TSS Variability among Wet Weather Events
CSO Datasets have a High Degree of Uncertainty – Wide variability in the TSS Results
16
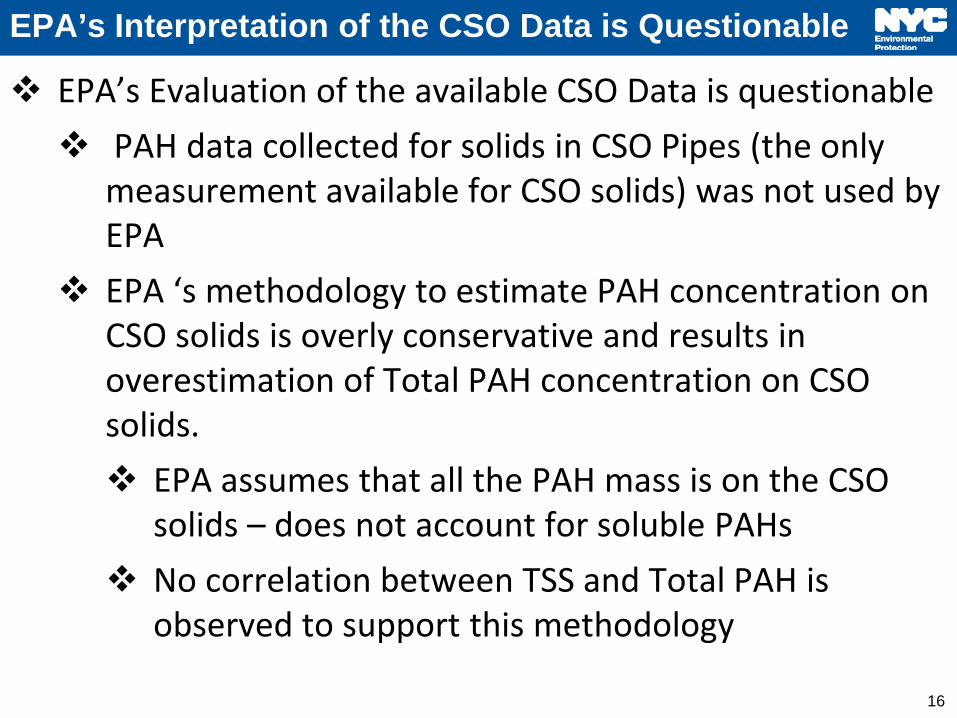
EPA’s Evaluation of the available CSO Data is questionable
PAH data collected for solids in CSO Pipes (the only measurement available for CSO solids) was not used by EPA
EPA ‘s methodology to estimate PAH concentration on CSO solids is overly conservative and results in overestimation of Total PAH concentration on CSO solids.
EPA assumes that all the PAH mass is on the CSO solids – does not account for soluble PAHs
No correlation between TSS and Total PAH is observed to support this methodology
EPA’s Interpretation of the CSO Data is Questionable
17
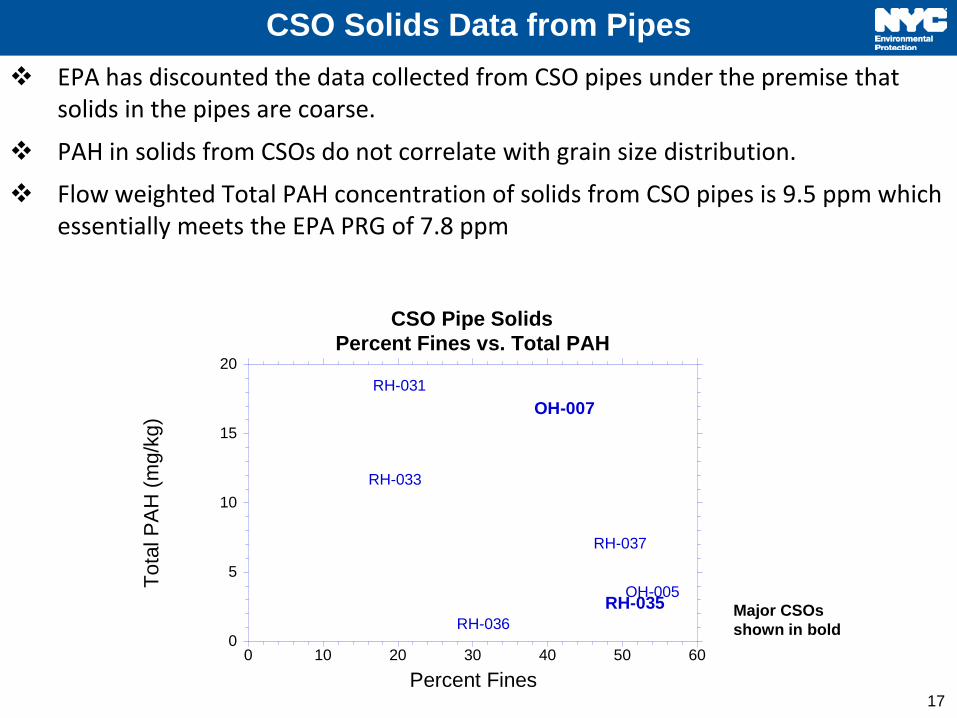
EPA has discounted the data collected from CSO pipes under the premise that solids in the pipes are coarse.
PAH in solids from CSOs do not correlate with grain size distribution.
Flow weighted Total PAH concentration of solids from CSO pipes is 9.5 ppm which essentially meets the EPA PRG of 7.8 ppm
CSO Solids Data from Pipes
0
5
10
15
20
0 10 20 30 40 50 60
CSO Pipe SolidsPercent Fines vs. Total PAH
RH-033
RH-031
RH-036
OH-007
RH-037
RH-035OH-005Tota
l PA
H (m
g/kg
)
Percent Fines
Major CSOs shown in bold

18
LMW PAHs, which are soluble in water, account for more 60% of the TPAH Concentration in CSO Effluent.
2-methyl Naphthalene and Naphthalene on an average account for 49% of the LMW PAH concentration and 35 % of the TPAH concentration.
CSO Wet Weather Data – LMW / Total PAH Ratio
On average, more than half of the Total PAH concentration is dissolved making EPA’s estimates of the solid phase biased high.

19
There is no correlation between TSS and Total PAH.
CSO Wet Weather Data – TSS vs. TPAH
This further discounts EPA’s theory that all PAH mass is on the solids.
TSS (mg/L)
Expanded Scale

20 20
From Gasperi et al., 2011Total Concentration (ug/L)
Rings Parameters Min Max Mean N Min Max Mean2 Naphthalene* 0.09 0.22 0.13 4 0% 80% 52% 69%3 Acenaphthalene 0.01 0.03 0.02 4 69% 70% 70% 70%3 Acenaphthene 0.00 0.01 0.00 4 0% 0% 0%3 Anthracene* 0.01 0.04 0.02 4 0% 23% 11% 22%3 Fluorene 0.01 0.04 0.03 4 0% 100% 52% 69%3 Phenanthrene 0.07 0.24 0.16 4 15% 41% 30% 30%4 Benzo(a)anthracene 0.05 0.17 0.13 4 0% 0% 0%4 Chrysene 0.08 0.27 0.19 4 0% 0% 0%4 Fluoranthene 0.13 0.37 0.28 4 2% 15% 7.5% 7.5%4 Pyrene 0.14 0.41 0.29 4 2% 12% 6.5% 6.5%5 Benzo(a)pyrene* 0.06 0.20 0.13 4 0% 8% 2.9% 5.5%5 Benzo(b)fluoranthene* 0.10 0.37 0.23 4 0% 0% 0%5 Benzo(b)fluoranthene* 0.04 0.13 0.08 4 0% 0% 0%6 Benzo(ghi)perylene* 0.07 0.26 0.14 4 0% 9% 2.3% 9.1%6 Indeno(cd)pyrene* 0.07 0.25 0.14 4 0% 12% 3% 12%
Total PAHs 0.96 2.67 1.97 4 2% 19% 11.8% 11.8%Fraction Naphthalene 3% 12% 8% 4
From Huang and Foster, 2006Total PAHs 1.50 12.50 ? 3% 32%
Fraction Naphthalene+C1 3.8% 4.6%
EPA DataCSOs Excluding Impacted CSOs
Total PAHs 1.7 3.7 2.6Fraction Naphthalene+C1 10% 60% 26%
Impacted CSOsTotal PAHs 1.0 34.0 10.7
Fraction Naphthalene+C1 36% 93% 64%
PAHs in CSOs, Paris, France
PAHs in Stream Flow receiving SWOs, Washington, DC
Gowanus Canal CSOs
Fraction Dissolved Mean(meas'd
PAH Partitioning Behavior is Unresolved

21
City estimated the TPAH concentration on solids from CSOs as follows:
Assumed Equilibrium Partitioning.
Partitioning coefficients from Agency for Toxic Substances and Disease Registry (ATSDR) were used.
Non-detected results with an RL of 1 ug/L were excluded.
On average, EPA estimate is 4.5 times that of City’s Estimate
Median is 2 times greater
City’s Estimates of TPAH Concentration on Solids from CSOs
1
10
100
1000
1 10 100 1000
USE
PA E
stim
ate
- mg/
kg
Partitioning-based Estimate - mg/kg (NYC DEP)

22
Comparison of City and EPA Estimates from CSO Wet Weather Data
0.1
1
10
100
0.1 1 10 100
USE
PA E
stim
ate
- mg/
kg
Partitioning-based Estimate - mg/kg (NYC DEP)
2-Methylnaphthalene
0.1
1
10
100
0.1 1 10 100
USE
PA E
stim
ate
- mg/
kg
Equilibrium-based Estimate - mg/kg (NYC DEP)
Benzo(a)Pyrene
0.0001
0.001
0.01
0.1
1
10
0.0001 0.001 0.01 0.1 1 10
USE
PA E
stim
ate
- mg/
kg
Partitioning-based Estimate - mg/kg (NYC DEP)
Acenaphthylene
0.1
1
10
100
0.1 1 10 100
USE
PA E
stim
ate
- mg/
kg
Equilibrium-based Estimate - mg/kg (NYC DEP)
Benzo(b)Fluoranthene

23
Summary – Total PAH
Approach Ecological PRG TPAH (mg/kg)
Assumptions Sample Type
TPAH Concentration on CSO Solids (mg/kg)
Min Max Flow weighted
Average
EPA 7.8
1) All PAHs on Solids Wet Weather
Samples 4 330 50
NYC-DEP 85 1) Does not include non-detects with RL of 1 ug/L
2) Equilibrium partitioning
Sediment in CSO Pipes
1.1 18.3 9.5
Wet Weather Samples
2 88 28
24
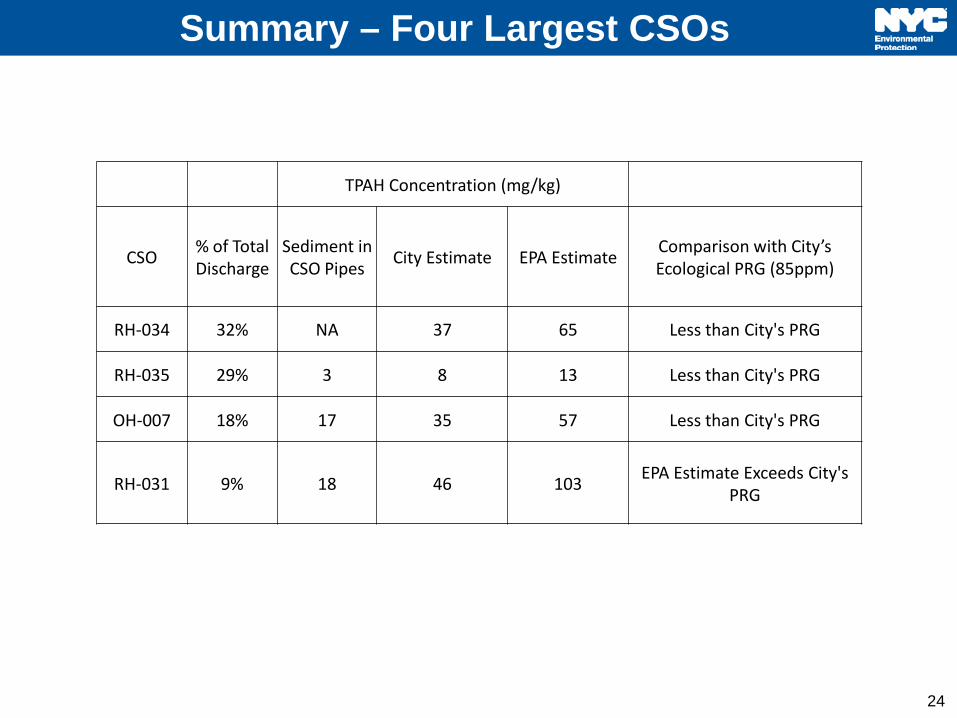
Summary – Four Largest CSOs
TPAH Concentration (mg/kg)
CSO % of Total Discharge
Sediment in CSO Pipes
City Estimate EPA Estimate Comparison with City’s Ecological PRG (85ppm)
RH-034 32% NA 37 65 Less than City's PRG
RH-035 29% 3 8 13 Less than City's PRG
OH-007 18% 17 35 57 Less than City's PRG
RH-031 9% 18 46 103 EPA Estimate Exceeds City's
PRG

25
Topic 3: CSM Issues for the Site

26
Lack of CSM for the Site EPA has not developed a conceptual site model (CSM) for the site. All the Sources in the site have not been characterized:
Extent of the NAPL and its impact on CSOs and Canal is not well understood
CSOs have not been sufficiently characterized. Current datasets do not provide a thorough characterization
~200 unpermitted outfalls have not been evaluated
Impact of groundwater on the Canal is not accounted
Harbor Exchange is unaccounted for

27
CSM Issues
Direct evidence for NAPL impacts on CSO discharges
Evidence for Solids Contributions
Bathymetry
Metals Balance
PAH sources not fully identified
PAH balances
CSO vs Surface Sediments
Individual compound basis
Groundwater Transport

28
Possible Impact of NAPL on the Canal and CSOs
TPAH (ug/L) - NY City CSOs from CARP
CSOs near Fulton Site
Impact of NAPL on the Canal has not been evaluated completely. Of the three MGP sites only one site has been characterized by DEC Effluent data from CSOs indicates that there is a potential impact of MGP sites on CSOs.

29 For the potentially impacted CSOs, the sum of 2-Methylnaphthalene and Naphthalene,
concentration is more that 10 ug/L and accounts for 69% or more of the Total PAH Concentration
CSOs – Owls Head CSOs – Red Hook Mean Concentration Percentage of Total PAH Concentration
Fulton Site
Possible Impact of MGP Sites on CSOs

30
CSO Pipes at Fulton Site
Boundaries of MGP Site Potentially Impacted CSO

31
Solids Balance in the Canal EPA does not account for solids mixing in the Canal.
EPA has used the bathymetry data to characterize the deposition patterns in the Canal.
Based on the observed patterns EPA asserts that CSOs are responsible for all the solids that settle in the Canal especially at the head end.
EPA does not account for solids entering the Canal from the harbor.
CSO discharges occur roughly 75 times per year
Remainder of the year, water column solids originate from resuspension or the harbor
The gross amount of solids entering the Canal from the Harbor is an order of magnitude higher than the amount of solids from CSOs.
Entity Flow (MG/Yr) TSS (mg/L) Mass (kg/yr)
CSO 377 70 100,000
Tidal 40,795 10 1,500,000

32
Results of Bathymetric Comparison
CSO Solids cannot account for more than approximately 20% of solids that settle in the Canal!!!
Change in Elevation from June 2003 to January 2010 (6.6 years)
Acres Deposition Erosion Net
(Deposition - Erosion)
CSO Discharge
(MGY) TSS (mg/L)
%Solids from CSOs vs. Net Deposition
Whole Study Area
Volume (cy)
28
31,000 20,000 11,000 377 136
20% Rate (cy/yr) 5,000 3,000 2,000
Mass (kg/yr)* 2,900,000 1,900,000 1,000,000 195,000
Head End to Carrol Street Volume (cy)
3 6,000 500 5,500
125 136 13% Rate (cy/yr) 900 100 800
Mass (kg/yr)* 550,000 60,000 490,000 65,000 Head End to 4th Street Turning Basin
Volume (cy) 5
9,500 1,000 8,500 194 136
14% Rate (cy/yr) 1,400 200 1,200 Mass (kg/yr)* 855,000 120,000 735,000 100,000

33
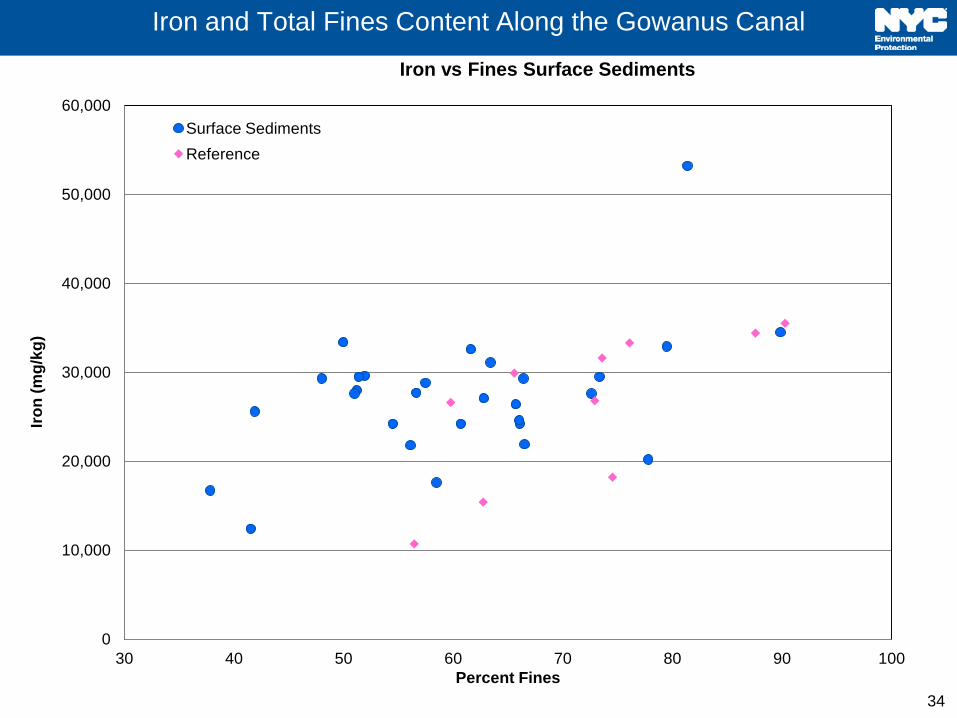
Iron and Total Fines Content Along the Gowanus Canal
0
10000
20000
30000
40000
50000
60000
0 0.2 0.4 0.6 0.8 1 1.2 1.4 1.6
Iron
(mg/
kg)
Distance from the Gowanus Bay (miles)
Iron Concentration along the Gowanus Canal
Canal Sediments Reference
0.00
10.00
20.00
30.00
40.00
50.00
60.00
70.00
80.00
90.00
100.00
0 0.2 0.4 0.6 0.8 1 1.2 1.4 1.6
% F
ines
Distance from the Gowanus Bay (miles)
Total % Fines along the Gowanus Canal
Canal Sediments
34
Iron and Total Fines Content Along the Gowanus Canal
0
10,000
20,000
30,000
40,000
50,000
60,000
30 40 50 60 70 80 90 100
Iron
(mg/
kg)
Percent Fines
Iron vs Fines Surface Sediments
Surface Sediments Reference
35
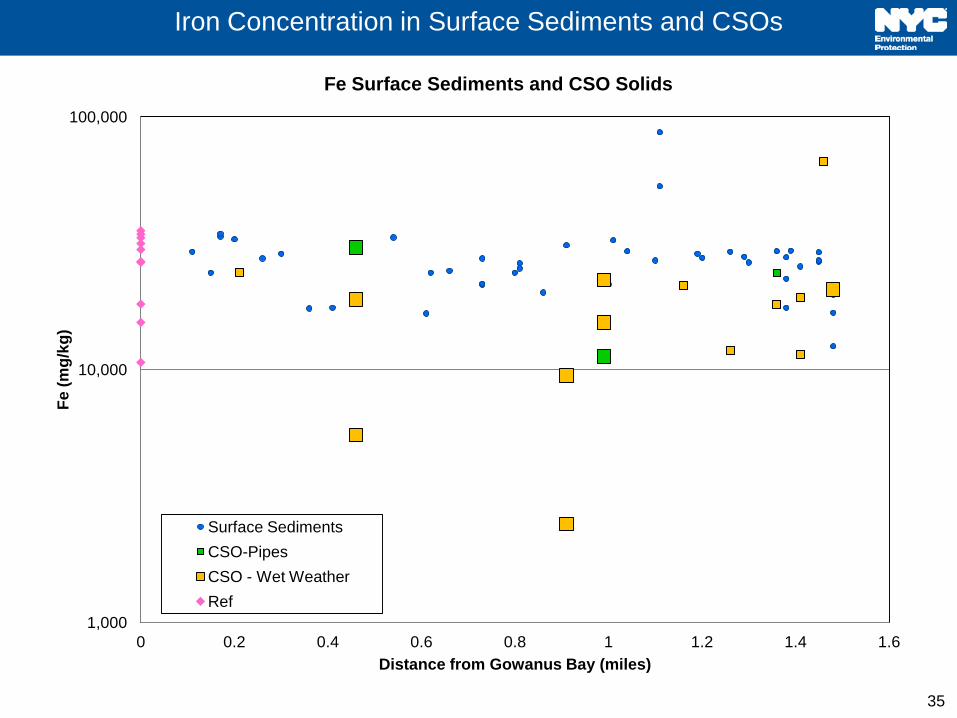
Iron Concentration in Surface Sediments and CSOs
1,000
10,000
100,000
0 0.2 0.4 0.6 0.8 1 1.2 1.4 1.6
Fe (m
g/kg
)
Distance from Gowanus Bay (miles)
Fe Surface Sediments and CSO Solids
Surface Sediments CSO-Pipes CSO - Wet Weather Ref

36
Aluminum in Surface Sediments vs. CSO Wet Weather Solids
100
1,000
10,000
100,000
0 0.2 0.4 0.6 0.8 1 1.2 1.4 1.6
Al (
mg/
kg)
Distance from Gowanus Bay (miles)
Al Surface Sediments and CSO Solids
Surface Sediments CSO-Pipes CSO - Wet Weather Ref

37
Pb/Fe Ratio in Surface Sediments vs. CSO Wet Weather Solids
0.001
0.01
0.1
0 0.2 0.4 0.6 0.8 1 1.2 1.4 1.6
Pb/F
e
Distance from Gowanus Bay (miles)
Pb/Fe Surface Sediments and CSO Solids
Surface Sediments
CSO-Pipes
CSO - Wet Weather
Ref

38
Cu/Fe Ratio in Surface Sediments vs. CSO Wet Weather Solids
0.001
0.01
0.1
1
0 0.2 0.4 0.6 0.8 1 1.2 1.4 1.6
Cu/
Fe
Distance from Gowanus Bay (miles)
Cu/Fe Surface Sediments and CSO Solids
Surface Sediments
CSO-Pipes
CSO - Wet Weather
Ref
39
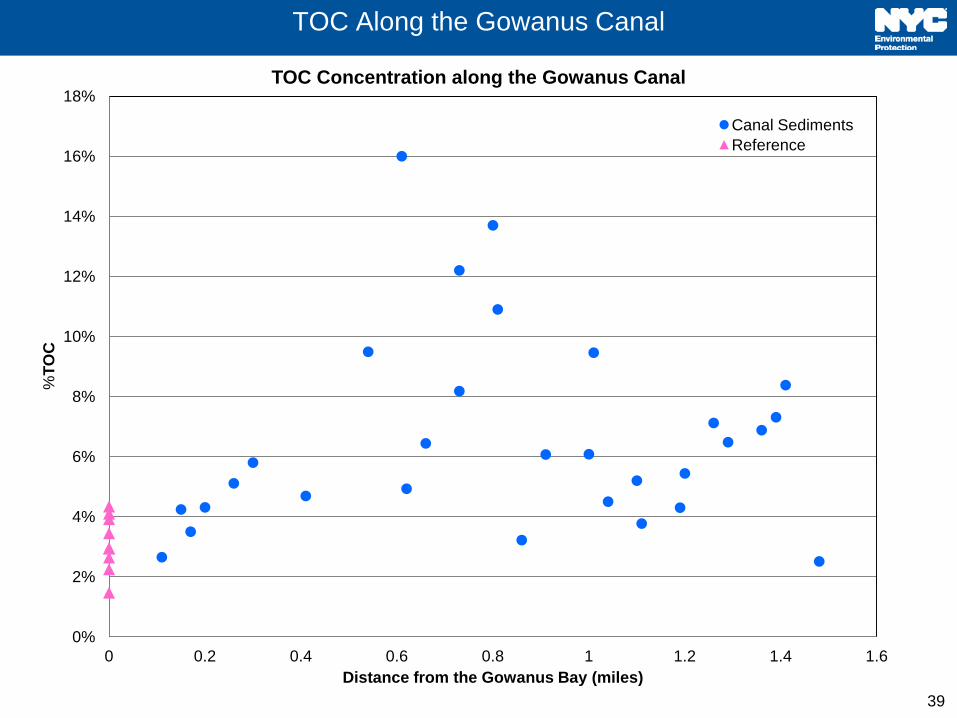
TOC Along the Gowanus Canal
0%
2%
4%
6%
8%
10%
12%
14%
16%
18%
0 0.2 0.4 0.6 0.8 1 1.2 1.4 1.6
%TO
C
Distance from the Gowanus Bay (miles)
TOC Concentration along the Gowanus Canal
Canal Sediments Reference

40
Solids Contribution: Chemical Mass balance for Pb & Al Preliminary Analysis for Solids Contribution:
Used a chemical mass balance approach
Two-end members for solids (CSO and Harbor)
Two chemicals – Pb & Al.
Results showed CSO on average contribute ~ 30 percent of solids.
Given the uncertainties, this is consistent with bathymetry observations, i.e., the harbor is the main source of solids
Further statistical analysis is being conducted to determine uncertainty in estimate.

41
Total PAHs in Surface Sediments vs. CSO Wet Weather Solids
1
10
100
1000
10000
0 0.2 0.4 0.6 0.8 1 1.2 1.4 1.6
Tota
l PAH
(mg/
kg)
Distance from Gowanus Bay (miles)
Total PAHs in Surface Sediments and CSO Wet Weather Solids
Reference
Surface Sediments
EPA PRG TPAH
NYCDEP Estimate of PRG CSO - Pipe Sediments
CSO - City Estimates
CSO - EPA Estimates

42
B(a)A in Surface Sediments vs. CSO Wet Weather Solids
0.01
0.1
1
10
100
1000
0 0.2 0.4 0.6 0.8 1 1.2 1.4 1.6
Ben
zo(a
)Ant
hrac
ene
(mg/
kg)
Distance from Gowanus Bay (miles)
Benzo(a)Anthracene in Surface Sediments and CSO Wet Weather Solids
Reference
Surface Sediments
CSO - Pipe Sediments
CSO - City Estimates
Non-Detect
CSO - EPA Estimates

43
B(a)P in Surface Sediments vs. CSO Wet Weather Solids
0.01
0.1
1
10
100
1000
0 0.2 0.4 0.6 0.8 1 1.2 1.4 1.6
Ben
zo(a
)Ant
hrac
ene
(mg/
kg)
Distance from Gowanus Bay (miles)
Benzo(a)Pyrene in Surface Sediments and CSO Wet Weather Solids
Reference
Surface Sediments
CSO - Pipe Sediments
CSO - City Estimates
Non-Detect
CSO - EPA Estimates

44
B(b)F in Surface Sediments vs. CSO Wet Weather Solids
0.01
0.1
1
10
100
1000
0 0.2 0.4 0.6 0.8 1 1.2 1.4 1.6
Ben
zo(b
)Flu
oran
then
e (m
g/kg
)
Distance from Gowanus Bay (miles)
Benzo(b)Fluoranthene in Surface Sediments and CSO Wet Weather Solids
Reference
Surface Sediments
CSO - Pipe Sediments
CSO - City Estimates
Non-Detect
CSO - EPA Estimates
45
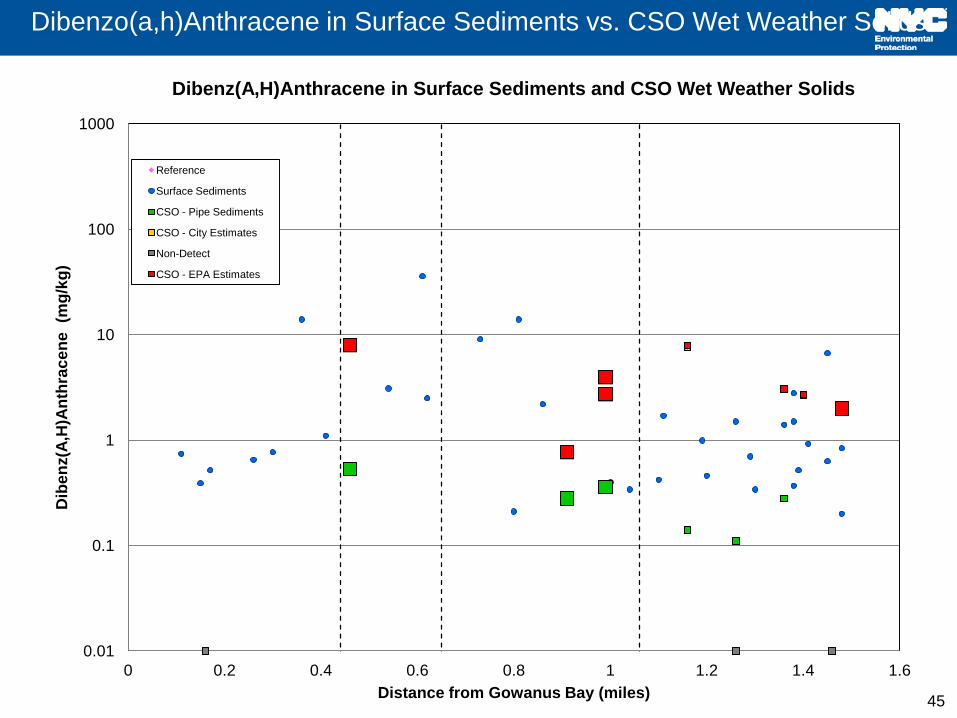
Dibenzo(a,h)Anthracene in Surface Sediments vs. CSO Wet Weather Solids
0.01
0.1
1
10
100
1000
0 0.2 0.4 0.6 0.8 1 1.2 1.4 1.6
Dib
enz(
A,H
)Ant
hrac
ene
(mg/
kg)
Distance from Gowanus Bay (miles)
Dibenz(A,H)Anthracene in Surface Sediments and CSO Wet Weather Solids
Reference
Surface Sediments
CSO - Pipe Sediments
CSO - City Estimates
Non-Detect
CSO - EPA Estimates

46
Acenaphthalene in Surface Sediments vs. CSO Wet Weather Solids
0.01
0.1
1
10
100
1000
10000
0 0.2 0.4 0.6 0.8 1 1.2 1.4 1.6
Acen
apht
hyle
ne (m
g/kg
)
Distance from Gowanus Bay (miles)
Acenaphthylene in Surface Sediments and CSO Wet Weather Solids
Reference
Surface Sediments
CSO - Pipe Sediments
CSO - City Estimates
Non-Detect
CSO - EPA Estimates

47
Naphthalene in Surface Sediments vs. CSO Wet Weather Solids
0.01
0.1
1
10
100
1000
10000
0 0.2 0.4 0.6 0.8 1 1.2 1.4 1.6
Nap
htha
lene
(mg/
kg)
Distance from Gowanus Bay (miles)
Naphthalene in Surface Sediments and CSO Wet Weather Solids
Reference
Surface Sediments
CSO - Pipe Sediments
CSO - City Estimates
Non-Detect

48
Impact of Groundwater on the Canal City’s Groundwater Flow Model Development indicates:
Based on site information and USGS publications
Agrees well with USGS head and flow data
The calibrated discharge to Gowanus Canal is about 2.1 ft3/sec (USGS pre-development estimate is 2.5 ft3/sec).
Model indicates about 75% of the flow to Gowanus Canal is through the sediment and 25% of flow is through the banks.
EPA has not accounted for the groundwater impact on the Canal for metals and PAHs.

49
Groundwater Loads to the Canal - PAHs
Analyte
Mean Concentration From Sampled
GW (ug/l)
Estimated Annual Load
from GW (Kg/yr)
Estimated Mean GW
Concentration* (ug/L)
Potential Annual Loads
from GW* (Kg/yr)
Mean CSO Aqueous
Concentration (ug/L)
CSO Loads (kg/yr)
CSO Loads (kg/yr) after CSO Order
Upgrades 34% Reduction in
CSO Discharge
Acenaphthene 946 1,750 0.67 0.96 0.63
Acenaphthylene 1,020 1,900 0.2 0.28 0.18
Anthracene 156 300 0.2 0.29 0.19
Benzo(a)anthracene 1.47 2.84 5.1 10 0.25 0.36 0.24
Benzo(a)pyrene 1.34 2.60 1.2 2*(1.2**) 0.25 0.36 0.24
Benzo(b)fluoranthene 0.82 1.60 0.7 1 0.35 0.5 0.33
Benzo(g,h,i)perylene 0.60 1.16 0.4 1 0.39 0.55 0.36
Benzo(k)fluoranthene 0.58 1.13 0.2 0.4 0.23 0.33 0.22
Chrysene 3 6 0.26 0.37 0.24
Dibenz(a,h)anthracene 0.14 0.27 9 17 0.24 0.34 0.22
Fluoranthene 34 65 0.34 0.48 0.32
Fluorene 429 800 0.29 0.41 0.27
Indeno(1,2,3-cd)pyrene 0.55 1.06 0.44 1 0.35 0.5 0.33
Naphthalene 1335 2590
26,925 50,500*
(7,500**) 4 5.7
3.8
Phenanthrene 33.4 64.7 412 770* (110**) 0.48 0.69 0.46
Pyrene 53 100 0.38 0.55 0.36
* - Based on effective solubility of NAPL ** - Based on results of SEAM3D groundwater contaminant fate and transport model

50
Conclusions Eco PRG: Data are not robust enough to support a remedial decision
CSO data are not adequate to characterize their impact on the Canal
PAH partitioning behavior is highly uncertain
CSM fails to account for sediment deposition and mixing throughout the Canal
Data provides strong evidence for a significant contribution of harbor solids
CSM does not take groundwater into account
Surface sediment and CSO data indicate the occurrence of ongoing sources of B(a)P, Napthalene and other PAHs significantly greater than CSO contributions
Remedy does not prevent recontamination from groundwater discharges/ upwelling during cap construction and over the long term
Deep dredging impacts on DO are not considered.
Runs counter to the Eco PRG for protection of benthics
City proposes to fill data gaps

51
Proposed SOW for Data Collection CSO characterization
‒ Dissolved and Solids Phase measurements of COPCs
‒ TSS
Eco toxicity testing
Impacts of MGP sites on CSOs due to Fulton MGP Site
• CCTV Investigation
• Sampling up and down gradient of MGP Sites
Solids balance in the Canal
• Radionuclide sampling in surface sediments of the Canal and Harbor
• Radionuclide sampling in TSS from the CSOs, Canal, and Harbor
• TSS in the Canal water column
• TSS in the Harbor
Chemical Balance in the Canal
• COPC sampling in recently deposited surface sediments of the Canal and Harbor
• COPC sampling water column for Canal and Harbor
NYCDEP is prepared to assist EPA to collect data on an expedited basis
52
Questions?