gp2020 healthy people 2020 - home | usrds
TRANSCRIPT

page167
healthy people 2020
Someone told me long agoThere’s a calm before the stormI know; It’s been comin’ for some time.When it’s over so they sayIt’ll rain a sunny dayI know,Shinin’ down like water.
John Fogerty, “Have You Ever Seen the Rain?”
hp2020

2011 USRDS ANNUAL DATA REPORT
volumetwoesrd
page168
healthy people 2020INTRODUCTION
HP
INTRODUCTION
One of the major goals of the HP2020 program is to
“reduce new cases of chronic kidney disease (CKD) and
its complications, disability, death, and economic costs.”
The development and progression of CKD, which results
in reduced quality of life, is a major health concern. The
HP2020 CKD objectives are designed to further reduce the
long-term burden of kidney disease, improve the quality
of life among those with the condition, and eliminate
disparities — racial or otherwise — within the healthcare
system. To accomplish these goals, the HP2020 program
developed 14 objectives related to CKD, along with tar-
gets designed to evaluate the program’s success. We pro-
vide data for ten of these objectives, plus information on
microalbumin testing in non-CKD patients diagnosed with
diabetes. Because we use the Medicare 5 percent data to
evaluate objectives related to CKD patients not on dialysis,
results are limited to those age 65 and older.
In 2009, 11.5 percent of hospital patients with acute
kidney injury had a follow-up renal evaluation six months
post-discharge, a slight increase from the 10.5 percent
seen in 2008, but below the objective’s modest goal of
12.4 percent.
Patients with diabetes are at increased risk of CKD.
HP2020 has set a goal that 37 percent of persons with
diagnosed diabetes obtain an annual urinary microal-
bumin measurement. The percentage of elderly patients
with diabetes receiving this measurement rose from 12.3 in
2000 to 37.3 in 2009, just over the suggested HP2020 target,
but less than would be expected from clinical guidelines.
Serum creatinine and microalbumin are important
laboratory markers for monitoring the presence and pro-
gression of CKD, and lipid tests are important for assessing
cardiovascular risk in this population. In 2009, 28.2 percent
of patients received these recommended medical evalua-
tions, an increase from 26.7 percent in 2008, and just below
the minimal recommended HP2020 target of 28.4 percent.
Patients with either Type 1 or Type 2 diabetes and CKD
require more comprehensive laboratory monitoring. The
hemoglobin A1c test is used to assess blood glucose con-
trol over prolonged periods of time in patients with diabe-
tes, while diabetic retinopathy can be detected through
regular eye examinations. One in four elderly diabetic
patients receives A1c and eye testing along with serum
creatinine, lipid, and microalbumin tests, almost meeting
the HP2020 target of 25.4 percent, but a level certainly in
need of further improvement.
Use of angiotensin-converting enzyme (ACE) inhibi-
tors or angiotensin II receptor blockers (ARBs) is a recom-
mended medical treatment to slow the progression of CKD
in patients with diabetes and CKD. In 2008, 73.2 percent of
fee-for-service beneficiaries age 65 and older and enrolled
in Medicare Part D received these medications, well above
the now outdated HP2020 target of 60 percent.
A major HP2020 health objective is targeted at reducing
new cases of ESRD, a disease which greatly affects an indi-
vidual’s quality of life, and is an enormous burden on the
healthcare system, accounting for approximately 6 percent
($29 billion) of total Medicare costs. In 2009, the rate of new
The Healthy People program, now in its third decade, was established to improve the health of all Americans through
the development and evaluation of national health objectives. HP2020, launched on December 2, 2010, is the next step
in the continuum of care, with its foundation based on the success of the four previous HP initiatives.
170 recommended care among patients with AKI, diabetes, & CKD
172 ACEI/ARB treatment
173 ESRD incidence
174 kidney failure due to diabetes
175 nephrologist care
176 vascular access
178 transplantation
180 mortality

page169
ESRD cases stood at 355 per million population, 11. 5 per-
cent above the new HP2020 target of 318.5, but showing
relatively little improvement over the past ten years.
Patients with diabetes are at increased risk of ESRD. The
rate of kidney failure due to diabetes fell from 2006 to
2008, but remained similar in 2009, at 154 per million pop-
ulation — 10.6 percent above the HP2020 target of 139.2.
In past ADRs the USRDS raised concerns that late
referral to a nephrologist prior to ESRD, or the lack of such
referral, may contribute to higher morbidity and mortal-
ity in the first year of treatment. HP2020 has set a target
referral rate of 29.8 percent — a conservative goal that
should be updated. Rates have increased since 2005, from
25.6 percent to 28.4 percent in 2009.
We have reported on the high use of catheters at the
first outpatient hemodialysis session, and on the associ-
ated risks. Among patients who have seen a nephrologist
for more than a year, fewer than half use a catheter; they
also have the greatest likelihood at initiation of having an
arteriovenous (AV) fistula or maturing internal access. In an
effort to improve vascular access for hemodialysis patients,
HP2020 has developed objectives designed to increase
the use of AV fistulas. In 2007, 49.6 percent of prevalent
hemodialysis patients had an AV fistula as their primary
vascular access, just under the 50.6 percent HP2020 target.
The proportion of prevalent patients using a catheter as
the only mode of vascular access stood at 27.7 percent in
2007, slightly above the target of 26.1 percent. And in 2009,
32 percent of incident hemodialysis patients used an AV fis-
tula or had a maturing fistula for their primary mode of vas-
cular access, still below the HP2020 target of 34.5 percent.
ESRD patients who receive a kidney transplant have
lower mortality and hospitalization rates than those on
dialysis. First-year all-cause mortality rates in hemodialy-
sis patients, for example, are four times higher than rates
among transplant patients. HP2020 has set a goal of 18.8
percent of dialysis patients younger than 70 being wait-
listed and/or receiving a deceased donor kidney transplant
within one year of ESRD initiation. In 2008, 19.7 percent of
patients met this criterion. Additional goals call for 19.7
percent of patients with treated chronic kidney failure to
receive a transplant with three years of registration on the
waiting list (the number was 16.7 for 2006 patients), and
for increasing the number who receive a transplant at the
start of ESRD; of 2009 incident patients younger than 70,
only 3.2 percent received a preemptive transplant.
Expanded HP2020 objectives call for reductions in total
death rates for persons on dialysis, reduced death rates in
the first three months of renal replacement therapy, and
a reduced cardiovascular death rate in dialysis and trans-
plant patients. The most impressive gain toward achieving
an HP2020 objective is the continued decline in cardiovas-
cular mortality rates in prevalent dialysis patients, from
121.5 per 1,000 patient years at risk in 1999 to 82.6 in 2009,
just slightly above the HP2020 goal of 81.3. There have also
been positive developments in reducing the death rate in
dialysis patients in the first three months after initiation of
therapy, from 382.6 in 2001 to 353.7 in 2009; this remains far,
however, from the target of 319.9.
Additional information on the HP2020 program objec-
tives can be found at www.healthypeople.gov.
Many HP2020 targets were set 2–3 years before release of the goals, & may need to be updated.

2000 2001 2002 2003 2004 2005 2006 2007 2008 2009All 12.3 15.4 18.4 21.4 25.8 28.7 31.3 33.6 35.6 37.3American Indian or Alaska Native only 8.5 11.5 12.0 12.9 15.4 19.3 19.7 21.0 21.0 24.1Asian only 13.1 16.9 20.8 24.2 29.0 30.7 33.9 35.3 37.5 39.9Black or African American only 10.2 13.3 15.8 18.9 23.8 26.7 29.5 31.9 33.7 35.7White only 12.6 15.7 18.7 21.8 26.0 28.9 31.4 33.7 35.8 37.4Hispanic or Latino 11.8 15.4 18.0 20.7 25.9 29.8 31.4 33.6 35.6 38.1Male 12.8 16.1 19.1 22.1 26.7 29.6 32.2 34.6 36.6 38.2Female 11.9 15.0 17.9 20.9 25.1 28.1 30.6 32.7 34.8 36.665-74 14.5 18.2 21.4 24.8 29.5 32.6 35.2 37.7 40.0 41.975-84 10.9 13.7 16.7 19.6 23.8 26.8 29.6 31.8 33.7 35.385+ 5.5 7.2 9.0 10.9 13.9 16.1 18.1 20.5 22.2 23.5
2000 2001 2002 2003 2004 2005 2006 2007 2008 2009All 2.1 2.5 3.3 4.5 8.4 9.0 10.4 11.2 10.5 11.5American Indian or Alaska Native only 5.9 0.0 0.0 3.3 14.3 5.2 11.3 12.3 13.7 9.5Asian only 4.8 3.2 2.4 4.0 7.3 12.3 20.7 14.2 11.5 17.5Black or African American only 2.3 3.1 2.6 4.2 8.1 9.9 9.4 11.1 10.4 11.8White only 2.0 2.4 3.3 4.5 8.4 8.7 10.4 11.2 10.3 11.2Hispanic or Latino 2.5 1.6 7.3 7.7 13.2 13.0 10.1 11.2 15.0 13.6Male 1.7 2.2 2.9 4.4 8.0 8.2 9.7 10.1 9.4 10.5Female 2.5 2.9 3.7 4.7 8.9 9.9 11.3 12.5 11.7 12.565-74 2.8 4.0 4.4 6.4 11.8 12.9 14.8 16.0 14.6 16.075-84 2.0 2.1 3.4 4.4 8.6 8.6 10.4 11.3 10.8 11.585+ 1.0 0.7 1.2 2.1 3.1 4.4 5.0 5.0 5.0 6.2
2011 USRDS ANNUAL DATA REPORT
volumetwoesrd
page170
healthy people 2020RECOMMENDED CARE AMONG PATIENTS WITH AKI, DIABETES, & CKD
In 2000, just 2.1 percent of patients age 65 and older who were hospitalized for acute kidney injury had a follow-up renal evaluation during the following six months. By 2009 this had increased to 11.5 percent, close to the Healthy Peo-ple 2020 goal of 12.4 percent.
The lowest rate of follow-up evalu-ation occurs in the oldest patients, with just 6.2 percent of those age 85
and older receiving such care, com-pared to 16 percent of those age 65–74. By race and ethnicity, rates range from 9.5 percent among American Indians/Alaskan Natives to 17.5 percent in the Asian population. » Table HP2020 CKD-3; see page 378 for analytical methods. Medi-care patients age 65 & older (5 percent Medicare sample) with a hospitalized AKI event in given year.
In the diabetic population age 65 and older, the percentage of patients receiving an annual urinary microalbu-min measurement has increased from 12.3 in 2000 to 37.3 in 2009, just over the HP2020 target of 37 percent.
Rates fall with age, from 42 percent among those age 65–74 to 24 percent among those 85 and older. By race and ethnicity, rates range from 24 percent among American Indians/Alaskan
Natives to nearly 40 percent in the Asian population. Testing may, however, be under-reported in Native Ameri-cans, as the Indian Health Service does not report claims through the Medi-care system.
Rates vary little by gender, at 38 percent for men and 37 percent for women in 2009. » Table HP2020 D-12; see page 378 for analytical methods. Medicare patients with diabetes, age 65 & older.
HP2020 CKD-3Increase the proportion of hospital patients who incurred acute kidney injury who have follow-up renal evaluation in six months post discharge
TARGET: 12.4%
HP2020 D-12Increase the proportion of persons with diagnosed diabetes who obtain an annual urinary microalbumin measurement
TARGET: 37.0%

vol 2esrd
2000 2001 2002 2003 2004 2005 2006 2007 2008 2009All 6.0 7.3 9.1 10.6 19.8 22.1 23.4 25.7 26.7 28.2American Indian or Alaska Native only 5.7 7.8 5.5 6.6 13.8 19.4 15.6 16.9 16.7 18.6Asian only 8.3 8.4 14.3 14.3 27.5 27.9 32.6 35.4 34.1 37.7Black or African American only 5.3 6.6 8.7 10.0 20.8 22.8 24.4 26.7 27.9 30.2White only 5.9 7.1 8.8 10.4 19.3 21.6 22.9 25.1 26.3 27.4Hispanic or Latino 11.5 13.1 17.3 17.7 26.8 30.4 31.1 33.1 32.2 36.2Male 6.3 7.5 9.3 11.3 21.1 23.4 24.5 27.1 28.4 29.6Female 5.8 7.0 8.9 10.0 18.6 20.9 22.4 24.4 25.3 26.865-74 8.3 10.3 12.6 14.2 26.1 29.1 31.4 33.9 35.1 36.775-84 5.5 6.2 8.0 9.8 18.5 20.8 22.6 24.9 26.2 27.885+ 1.7 2.3 3.1 4.0 8.2 10.0 10.1 12.1 13.1 14.1
2000 2001 2002 2003 2004 2005 2006 2007 2008 2009All 7.4 9.0 10.4 12.1 18.4 20.0 21.1 23.0 23.7 25.2American Indian or Alaska Native only 5.1 6.5 2.4 5.0 5.6 15.9 12.1 10.2 10.6 11.1Asian only 7.4 8.3 12.3 13.0 25.2 21.8 26.1 26.8 25.2 27.0Black or African American only 5.6 6.7 7.2 9.9 16.3 17.9 18.8 19.8 21.2 22.5White only 7.8 9.4 11.0 12.5 18.6 20.3 21.4 23.4 24.1 25.7Hispanic or Latino 8.8 10.4 11.8 11.8 20.5 20.4 19.8 22.3 21.9 24.8Male 7.9 9.3 10.6 12.4 18.8 20.3 21.4 23.5 23.7 25.6Female 7.1 8.7 10.3 11.8 18.0 19.7 20.9 22.5 23.6 24.865-74 9.0 10.9 12.3 14.3 22.0 23.4 24.6 26.6 27.2 28.675-84 7.0 8.1 9.9 11.7 16.9 18.9 20.7 22.6 23.3 25.385+ 2.4 4.0 4.2 4.9 9.5 11.6 11.3 13.0 14.2 15.5 HP
CHAPTER
page171
In the Medicare CKD population age 65 and older, 28.2 percent received serum creatinine, lipid, and micro-albumin testing in 2009 — a con-siderable increase from the level of 6 percent in 2000, and nearly reaching the Healthy People 2020 goal of 28.4 percent. Testing rates by race range from 19 percent among American Indians/Alaskan Natives to 38 percent among Asians. Rates vary little by gender, and by age are lowest among the oldest patients, at 14 percent.
In the diabetic CKD population age 65 and older, 25.2 percent of patients in 2009 received serum creatinine,
microalbumin, glycosylated hemo-globin (A1c), and lipid testing, as well as an eye examination; this also nearly reaches the HP2020 goal, set at 28.4 percent. The reported percentage of patients receiving comprehensive diabetic testing is lowest among Ameri-can Indians/Alaskan Natives, at just 11 percent (care provided by the Indian Health Service, however, is not reported to Medicare), and highest among Asians, at 27 percent. Rates again vary little by gender, and decrease by age. » Tables HP2020 CKD-4; see page 378 for analytical methods. Medicare patients age 65 & older with CKD (4.1–2) & diabetes (4.2).
HP2020 CKD-4Increase the proportion of persons with diabetes and chronic kidney disease who receive recommended medical evaluations
HP2020 CKD-4.1 TARGET: 28.4%Increase the proportion of persons with chronic kidney disease who receive medical evaluation with serum creatinine, lipids, and microalbumin
HP2020 CKD-4.2 TARGET: 25.4%Increase the proportion of persons with type 1 or type 2 diabetes and chronic kidney disease who receive medical evaluation with serum creatinine, microalbumin, HbA1c, lipids, and eye examinations

2006 2007 2008All 71.9 73.4 73.2American Indian or Alaska Native only 75.9 77.4 77.2Asian only 70.2 72.2 72.1Black or African American only 64.7 65.4 65.3White only 74.0 75.5 74.8Hispanic or Latino 68.6 70.3 70.9Male 64.5 71.8 78.9Female 77.9 79.6 80.265-74 75.5 76.6 74.175-84 70.3 72.2 72.485+ 79.4 77.4 76.9
2011 USRDS ANNUAL DATA REPORT
volumetwoesrd
page172
healthy people 2020ACEI/ARB TREATMENT | ESRD INCIDENCE
In 2008, 73 percent of patients age 65 and older with diabetes and CKD received recommended medical treat-ment with angiotensin-converting enzyme inhibitors (ACEIs) or angioten-sin II receptor blockers (ARBs), consid-erably higher than the Healthy People 2020 target of 60 percent.
Whites are more likely to receive this treatment than blacks/African Americans, at 75 and 65 percent, while
77, 72, and 71 percent, respectively, of American Indians/Alaska Natives, Asians, and Hispanics/Latinos received these medications. Use varies little by gender, at 79–80 percent. And by age, 74, 72, and 77 percent, respectively, of patients age 65–74, 75–84, and 85 and older received ACEIs/ARBs in 2008. » Table HP2020 CKD-5; see page 378 for analytical meth-ods. Fee-for-service beneficiaries enrolled in Medicare Part D, age 65 & older.
HP2020 CKD-5Increase the proportion of persons with diabetes and chronic kidney disease who receive recommended medical treatment with angiotensin-converting enzyme inhibitors or angiotensin ii receptor blockers
TARGET: 60.0%
vol 2esrd
2000 2001 2002 2003 2004 2005 2006 2007 2008 2009All 342 348 348 350 351 354 362 355 351 355 American Indian or Alaskan Native only 1,466 639 610 567 582 568 491 509 521 512 Asian only 323 295 290 282 266 318 336 337 336 344 Native Hawaiian or other Pacific Islander only 3,090 3,095 3,155 3,172 3,294 2,608 2,557 2,155 1,951 2,188 Black or African American only 1,009 1,039 1,050 1,055 1,023 1,035 1,048 1,027 1,015 1,015 White only 256 269 270 271 277 280 291 285 283 288 2 or more races 119 144 149 157 144 Hispanic or Latino 647 558 566 573 559 543 546 530 524 516 Not Hispanic or Latino 332 344 345 347 350 352 358 352 349 355 Black or African American only, not Hisp/Latino 1,025 1,059 1,070 1,076 1,042 1,055 1,068 1,050 1,038 1,040 White only, not Hispanic or Latino 239 249 249 249 255 257 263 257 254 259 Male 412 421 427 428 437 443 455 447 445 452 Female 288 291 288 291 285 286 291 284 280 282 0-19 14 14 14 14 15 14 14 15 15 15 20-44 120 118 117 117 119 125 128 127 127 131 45-64 611 621 609 614 613 614 630 613 609 610 65-74 1,406 1,452 1,444 1,436 1,437 1,423 1,451 1,422 1,392 1,407 75+ 1,574 1,611 1,706 1,718 1,719 1,758 1,768 1,758 1,743 1,762
HPCHAPTER
page173
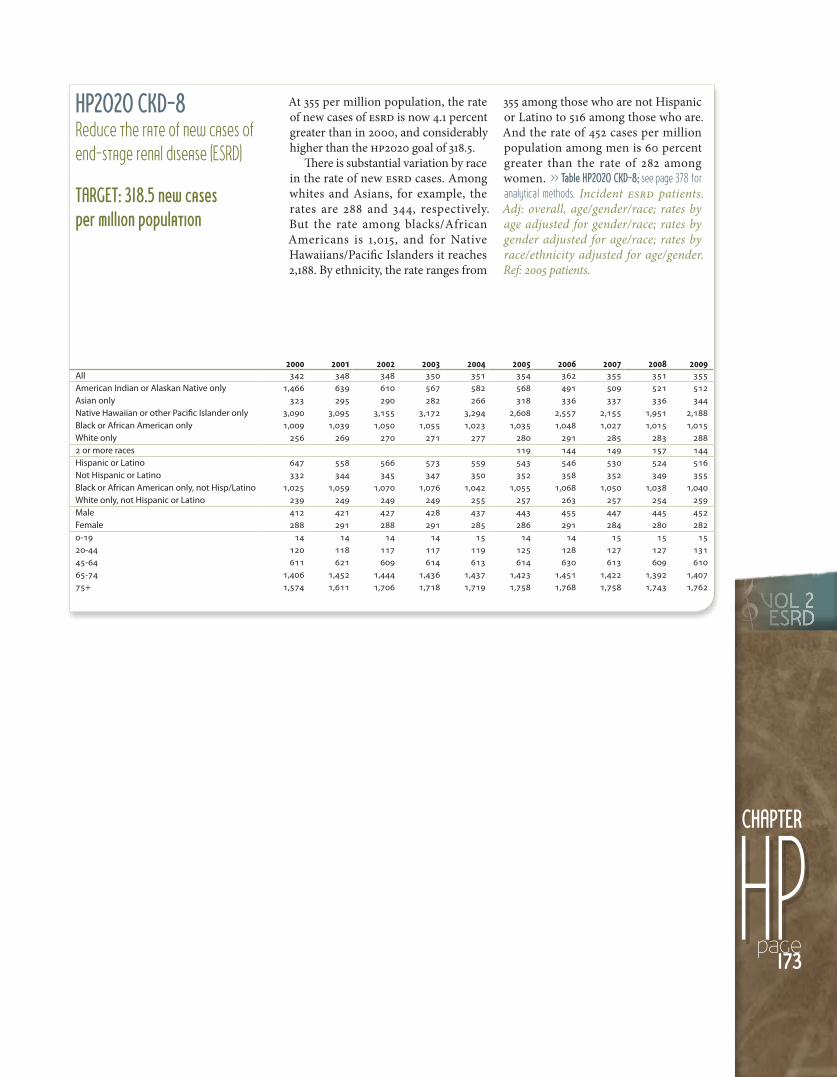
At 355 per million population, the rate of new cases of ESRD is now 4.1 percent greater than in 2000, and considerably higher than the HP2020 goal of 318.5.
There is substantial variation by race in the rate of new ESRD cases. Among whites and Asians, for example, the rates are 288 and 344, respectively. But the rate among blacks/African Americans is 1,015, and for Native Hawaiians/Pacific Islanders it reaches 2,188. By ethnicity, the rate ranges from
355 among those who are not Hispanic or Latino to 516 among those who are. And the rate of 452 cases per million population among men is 60 percent greater than the rate of 282 among women. » Table HP2020 CKD-8; see page 378 for analytical methods. Incident ESRD patients. Adj: overall, age/gender/race; rates by age adjusted for gender/race; rates by gender adjusted for age/race; rates by race/ethnicity adjusted for age/gender. Ref: 2005 patients.
HP2020 CKD-8Reduce the rate of new cases of end-stage renal disease (ESRD)
TARGET: 318.5 new cases per million population

2000 2001 2002 2003 2004 2005 2006 2007 2008 2009All 154 157 155 155 156 156 160 155 153 154 American Indian or Alaskan Native only 837 471 444 424 430 394 341 357 369 369 Asian only 149 137 129 126 119 147 165 160 166 166 Native Hawaiian or other Pacific Islander only 1,866 1,943 1,745 1,780 1,980 1,503 1,541 1,325 1,171 1,363 Black or African American only 447 472 469 463 451 454 461 441 437 435 White only 114 120 119 120 122 123 128 125 123 124 2 or more races 58 74 79 77 74 Hispanic or Latino 396 352 355 359 352 335 335 326 325 316 Not Hispanic or Latino 143 149 146 146 148 148 151 146 144 145 Black or African American only, not Hisp/Latino 453 480 477 471 459 461 468 449 446 445 White only, not Hispanic or Latino 100 104 102 102 104 105 107 104 101 102 Male 168 174 175 176 182 183 189 185 184 187 Female 142 143 138 138 135 134 137 131 128 128 0-19 0.19 * 0.17 * * 0.16 0.21 0.16 0.19 0.4720-44 37 36 35 36 37 38 42 41 41 44 45-64 338 344 333 331 328 328 332 318 317 314 65-74 726 752 737 738 735 724 739 715 692 692 75+ 505 528 557 556 575 581 598 597 587 592
2007 2008 2009All 2,648 2,518 2,423American Indian or Alaska Native only 2,867 3,350 3,504Asian only 2,202 2,330 2,635Black or African American only 4,519 4,368 4,264White only 2,280 2,138 2,0402 or more races 745 677 404Hispanic or Latino 3,388 3,237 2,995Not Hispanic or Latino 2,532 2,402 2,328Black or African American only, not Hisp/Latino 4,720 4,547 4,476White only, not Hispanic or Latino 2,048 1,900 1,819Male 2,948 2,766 2,633Female 2,366 2,276 2,2070-17 * 72 20718-44 1,628 1,559 1,52245-64 2,513 2,384 2,31865+ 3,210 3,051 2,915
2011 USRDS ANNUAL DATA REPORT
volumetwoesrd
page174
healthy people 2020KIDNEY FAILURE DUE TO DIABETES | NEPHROLOGIST CARE
The rate of kidney failure due to diabe-tes has varied little in the last decade, with a range of 153–160 cases per mil-lion population; the rate of 154 seen in 2009 was the same as that occurring in 2000. The HP2020 goal of 139.2 is met only by whites, by women, and by patients younger than 44.
The highest rate of diabetic ESRD occurs among Native Hawaiians/Pacific Islanders, at 1,363; the rate among blacks/African Americans reaches
435. In 2009, the adjusted rate of kid-ney failure due to diabetes among dia-betic patients was 2,423 per million population, 8.5 percent lower than in 2007 but still above the HP2020 target of 2,374. » Tables HP2020 CKD-9; see page 378 for analytical methods. Incident ESRD patients. Adj: age/gender/race; ref: 2005. NHIS 2006–2010 used to estimate diabetes prevalence; SUDDAN used for national estimates (9.2). *Values for cells with ten or fewer patients are suppressed.
HP2020 CKD-9Reduce kidney failure due to diabetes
HP2020 CKD-9.1 TARGET: 139.2 per million populationReduce kidney failure due to diabetes
HP2020 CKD-9.2 TARGET: 2,374.1 per million populationReduce kidney failure due to diabetes among persons with diabetes
vol 2esrd
2005 2006 2007 2008 2009All 25.6 26.3 27.2 28.4 28.4American Indian or Alaskan Native only 25.1 27.2 25.8 27.8 26.8Asian only 25.5 23.8 26.2 27.4 28.8Native Hawaiian or other Pacific Islander only 23.0 24.8 23.6 22.1 23.8Black or African American only 22.0 23.1 24.0 24.6 24.9White only 27.1 27.8 28.6 30.1 29.92 or more races 23.3 22.3 24.3 29.0 27.4Hispanic or Latino 19.3 20.6 20.5 21.5 21.8Not Hispanic or Latino 16.5 27.2 28.2 29.5 29.4Black or African American only, not Hisp/Latino 22.1 23.1 24.1 24.6 24.9White only, not Hispanic or Latino 28.7 29.4 30.4 32.1 31.9Male 26.0 26.4 27.2 28.2 28.1Female 25.1 26.2 27.1 28.6 28.70-19 39.2 34.3 33.6 37.7 37.620-44 23.0 22.6 23.1 23.9 23.345-64 25.5 26.0 26.5 27.1 27.265-74 27.0 28.3 28.7 30.4 30.675+ 25.2 26.6 28.4 30.3 30.3
HPCHAPTER
page175
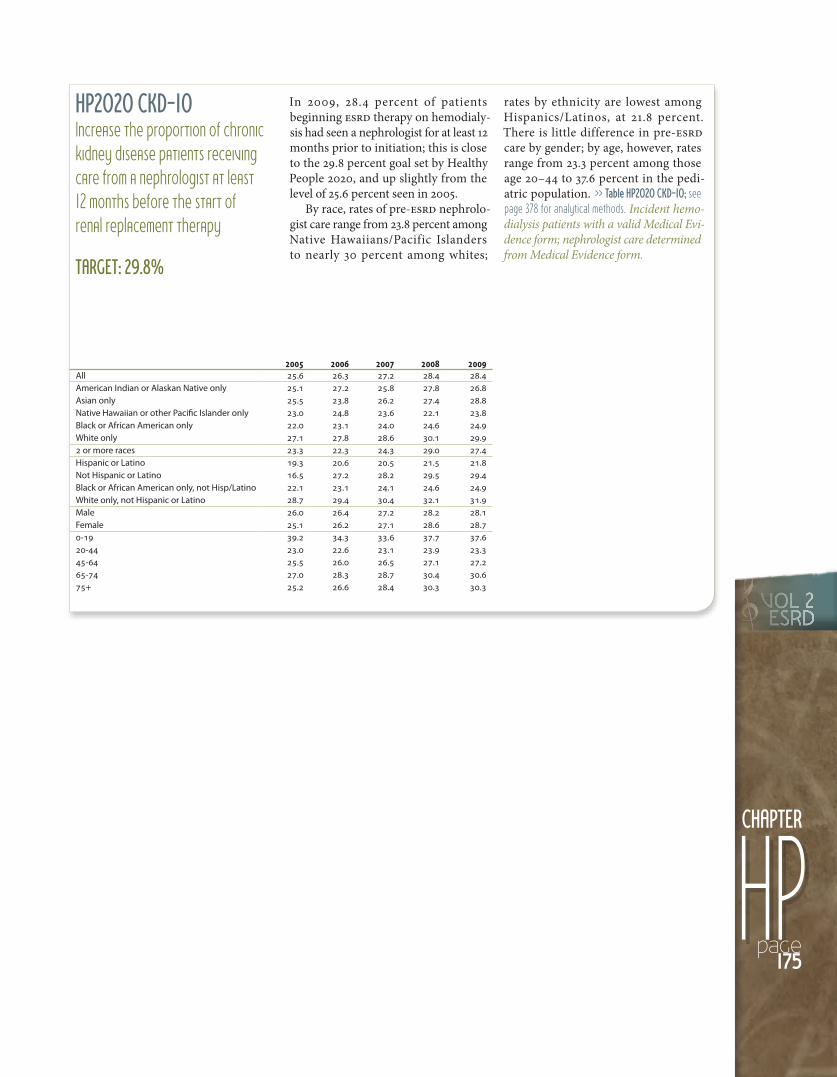
In 2009, 28.4 percent of patients beginning ESRD therapy on hemodialy-sis had seen a nephrologist for at least 12 months prior to initiation; this is close to the 29.8 percent goal set by Healthy People 2020, and up slightly from the level of 25.6 percent seen in 2005.
By race, rates of pre-ESRD nephrolo-gist care range from 23.8 percent among Native Hawaiians/Pacific Islanders to nearly 30 percent among whites;
rates by ethnicity are lowest among Hispanics/Latinos, at 21.8 percent. There is little difference in pre-ESRD care by gender; by age, however, rates range from 23.3 percent among those age 20–44 to 37.6 percent in the pedi-atric population. » Table HP2020 CKD-10; see page 378 for analytical methods. Incident hemo-dialysis patients with a valid Medical Evi-dence form; nephrologist care determined from Medical Evidence form.
HP2020 CKD-10Increase the proportion of chronic kidney disease patients receiving care from a nephrologist at least 12 months before the start of renal replacement therapy
TARGET: 29.8%
Prevalent year 1998 1999 2000 2001 2002 2003 2004 2005 2006 2007All 27.1 27.9 29.9 31.6 33.1 36.6 39.4 44.2 46.0 49.6American Indian or Alaskan Native only 39.0 37.7 38.2 45.3 41.0 54.3 44.3 55.3 57.7 56.6Asian only 32.8 30.6 33.3 35.3 35.6 48.9 44.4 47.9 55.9 57.4Native Hawaiian or other Pacific Islander only dnc dnc dnc dnc dnc dnc dnc dnc dnc dncBlack or African American only 22.4 22.9 25.9 26.7 28.4 29.6 35.2 38.0 40.0 42.4White only 29.5 30.0 32.0 34.1 35.6 39.4 41.6 47.5 48.6 53.22 or more races dnc dnc dnc dnc dnc dnc dnc dnc dnc dncHispanic or Latino 28.5 30.4 32.1 33.5 38.8 39.5 42.6 51.6 51.9 53.0Not Hispanic or Latino 26.9 27.7 29.8 31.4 32.2 36.2 39.1 43.0 45.0 49.0Black or African American only, not Hisp/Latino 22.3 23.2 25.8 26.8 28.3 29.6 35.2 37.8 39.7 42.3White only, not Hispanic or Latino 30.0 30.5 32.5 34.2 34.7 39.3 41.2 46.2 47.6 53.1Male 36.0 36.4 39.6 41.7 42.6 45.6 49.1 52.9 54.1 57.4Female 17.0 18.2 19.4 20.4 21.9 26.4 29.4 33.8 35.5 39.90-1718-44 35.6 36.1 40.8 41.0 41.7 46.8 49.8 52.2 53.2 54.845-64 29.2 29.1 31.2 33.8 35.5 37.2 39.6 45.1 46.9 50.765-74 23.0 23.5 25.9 27.3 28.3 33.8 36.3 42.2 43.6 46.675+ 20.9 23.9 24.0 25.3 27.7 31.4 35.7 39.9 42.2 47.2
2011 USRDS ANNUAL DATA REPORT
volumetwoesrd
page176
healthy people 2020VASCULAR ACCESS
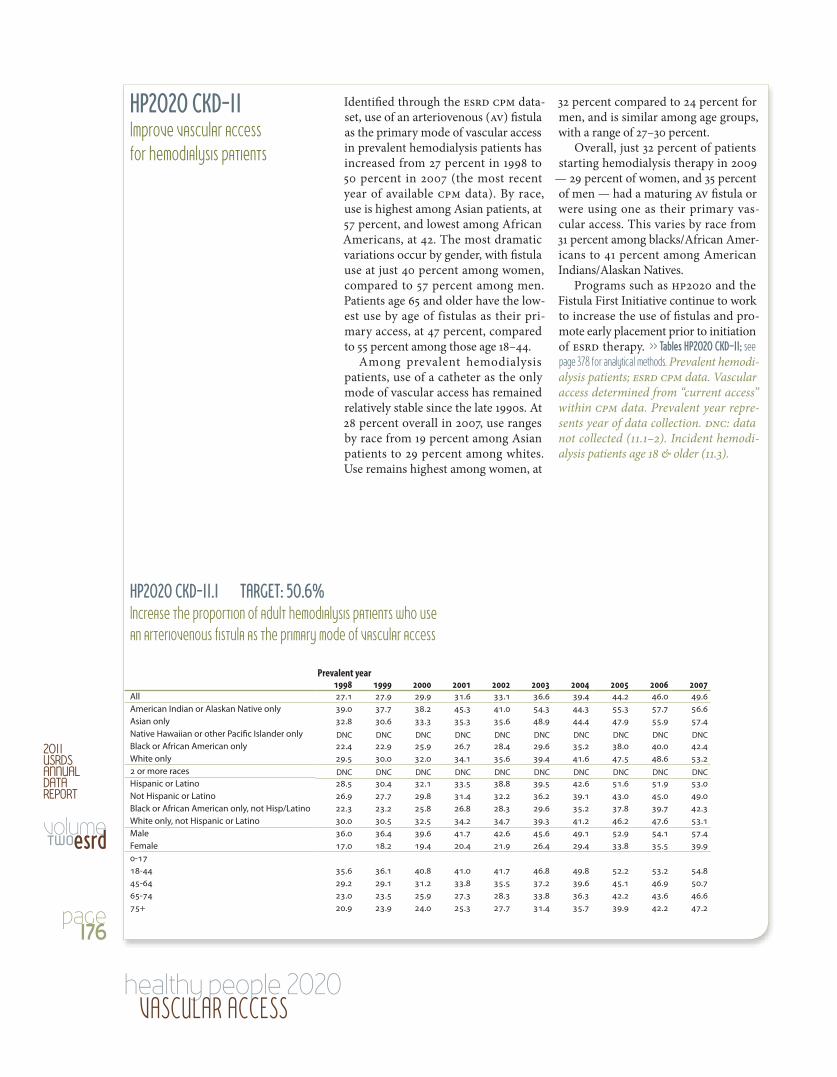
Identified through the ESRD CPM data-set, use of an arteriovenous (AV) fistula as the primary mode of vascular access in prevalent hemodialysis patients has increased from 27 percent in 1998 to 50 percent in 2007 (the most recent year of available CPM data). By race, use is highest among Asian patients, at 57 percent, and lowest among African Americans, at 42. The most dramatic variations occur by gender, with fistula use at just 40 percent among women, compared to 57 percent among men. Patients age 65 and older have the low-est use by age of fistulas as their pri-mary access, at 47 percent, compared to 55 percent among those age 18–44.
Among prevalent hemodialysis patients, use of a catheter as the only mode of vascular access has remained relatively stable since the late 1990s. At 28 percent overall in 2007, use ranges by race from 19 percent among Asian patients to 29 percent among whites. Use remains highest among women, at
32 percent compared to 24 percent for men, and is similar among age groups, with a range of 27–30 percent.
Overall, just 32 percent of patients starting hemodialysis therapy in 2009
— 29 percent of women, and 35 percent of men — had a maturing AV fistula or were using one as their primary vas-cular access. This varies by race from 31 percent among blacks/African Amer-icans to 41 percent among American Indians/Alaskan Natives.
Programs such as HP2020 and the Fistula First Initiative continue to work to increase the use of fistulas and pro-mote early placement prior to initiation of ESRD therapy. » Tables HP2020 CKD–11; see page 378 for analytical methods. Prevalent hemodi-alysis patients; ESRD CPM data. Vascular access determined from “current access” within CPM data. Prevalent year repre-sents year of data collection. DNC: data not collected (11.1–2). Incident hemodi-alysis patients age 18 & older (11.3).
HP2020 CKD-11Improve vascular access for hemodialysis patients
HP2020 CKD-11.1 TARGET: 50.6%Increase the proportion of adult hemodialysis patients who use an arteriovenous fistula as the primary mode of vascular access

vol 2esrd
Prevalent year 1998 1999 2000 2001 2002 2003 2004 2005 2006 2007All 19.5 23.3 24.5 25.3 26.8 26.8 27.5 27.8 29.0 27.7American Indian or Alaskan Native only 15.9 15.6 20.1 21.7 17.4 17.1 22.8 22.4 18.8 23.7Asian only 12.5 15.0 16.8 17.8 21.6 15.8 19.9 23.2 20.1 19.0Native Hawaiian or other Pacific Islander only dnc dnc dnc dnc dnc dnc dnc dnc dnc dncBlack or African American only 17.5 22.1 21.8 23.3 25.3 26.5 26.0 25.9 28.5 27.3White only 21.4 24.7 26.9 27.4 28.3 28.1 29.2 29.5 30.3 28.72 or more races dnc dnc dnc dnc dnc dnc dnc dnc dnc dncHispanic or Latino 16.7 20.7 22.1 21.3 22.6 23.6 23.7 23.7 23.4 24.7Not Hispanic or Latino 19.9 23.4 24.6 25.8 27.4 27.2 28.0 28.5 29.9 28.2Black or African American only, not Hisp/Latino 17.5 21.5 21.8 23.4 25.4 26.2 25.9 25.6 28.8 27.3White only, not Hispanic or Latino 22.6 25.7 27.7 28.8 29.6 29.6 30.5 31.3 32.3 30.0Male 17.5 20.7 20.5 21.6 23.7 23.8 23.8 24.2 25.3 24.4Female 21.7 26.1 28.8 29.5 30.5 30.3 31.7 32.0 33.7 31.70-1718-44 18.7 24.2 24.3 24.1 26.4 24.0 26.1 26.0 27.6 27.045-64 17.5 21.6 21.9 23.6 24.4 25.6 26.1 26.7 27.2 26.965-74 18.1 22.1 25.5 24.9 27.4 25.9 27.4 26.9 29.0 27.175+ 26.1 27.1 28.2 30.0 30.7 32.1 30.8 31.7 33.0 30.2
Incident year 2005 2006 2007 2008 2009All 30.9 31.7 31.4 31.0 32.0American Indian or Alaska Native only 36.2 39.0 37.6 41.2 40.9Asian only 35.8 37.3 34.8 35.5 35.2Native Hawaiian or Other Pacific Islander only 40.1 34.9 35.3 32.7 32.3Black or African American only 28.2 29.2 29.6 29.0 30.5White only 31.7 32.4 31.9 31.4 32.42 or more races 25.4 36.6 32.8 29.6 36.6Hispanic or Latino 30.6 31.3 29.3 29.1 30.4Not Hispanic or Latino 30.9 31.8 31.7 31.3 32.3Black or African American only, not Hisp/Latino 28.2 29.1 29.6 29.0 30.4White only, not Hispanic or Latino 31.9 32.8 32.6 32.1 33.0Male 34.8 34.9 34.6 33.7 34.6Female 26.1 27.7 27.3 27.4 28.60-1718-44 28.9 29.0 27.7 27.2 28.845-64 32.9 33.0 32.4 32.2 33.065-74 31.6 33.4 33.9 32.8 34.275+ 28.3 29.5 29.4 29.2 30.2 HP
CHAPTER
page177
HP2020 CKD-11.2 TARGET: 26.1%Decrease the proportion of adult hemodialysis patients who use catheters as the only mode of vascular access
HP2020 CKD-11.3 TARGET: 34.5%Increase the proportion of adult hemodialysis patients who use arteriovenous fistulas or have a maturing fistula as the primary mode of vascular access at the start of renal replacement therapy

1991 1992 1993 1994 1995 1996 1997 1998 1999 2000 2001 2002 2003 2004 2005 2006 2007 2008All 16.0 16.1 15.8 15.6 16.1 15.5 15.2 15.2 15.1 14.5 14.1 14.4 14.5 15.2 15.7 16.8 16.8 16.9Am. Indian/Al. Native only 12.0 11.0 9.4 13.4 14.5 9.7 10.5 10.2 9.0 12.4 9.1 10.1 9.5 10.2 10.9 10.3 11.4 10.6Asian only 23.4 22.8 23.5 23.5 23.3 25.8 26.0 24.4 27.0 26.9 29.5 28.6 28.4 32.1 28.1 30.9 30.5 31.5Native Hawaiian/other Pac. Is. only 75.0 62.5 14.3 28.6 12.2 21.0 16.3 19.0 18.5 18.7 19.5 21.9 22.2 20.0 18.2 17.5 17.4 17.0Black/Af. Am. only 10.2 10.6 10.6 11.0 11.5 11.1 10.3 10.4 10.7 10.8 10.2 10.7 10.5 11.7 12.1 13.1 13.4 13.4White only 19.1 19.2 18.9 18.1 19.1 18.2 18.3 18.1 17.5 16.3 15.9 16.2 16.5 16.7 17.5 18.4 18.3 18.22 or more races 12.4 18.5 14.0 23.8Hispanic or Latino 11.5 12.0 12.9 12.5 12.2 12.8 13.4 13.8 13.8 15.0 16.7 16.6 16.8Not Hispanic or Latino 15.8 16.1 15.9 15.7 16.5 16.1 15.7 15.5 15.5 14.9 14.4 14.6 14.6 15.5 15.9 16.8 16.9 16.9Black/Af. Am. only, not Hisp/Latino 10.1 10.5 10.5 10.9 11.3 11.0 10.3 10.4 10.7 10.9 10.2 10.7 10.5 11.7 12.0 13.0 13.3 13.4White only, not Hispanic/Latino 19.2 19.8 19.5 18.8 20.2 19.5 19.4 19.0 18.6 17.2 16.6 16.7 17.0 17.3 18.2 18.9 18.9 18.6Male 18.1 18.0 18.0 17.4 18.2 17.5 17.0 16.7 16.6 15.8 15.0 15.7 15.7 16.5 16.8 17.9 17.8 17.7Female 13.6 13.8 13.3 13.4 13.7 13.3 13.1 13.4 13.2 12.9 13.1 12.8 13.0 13.6 14.3 15.3 15.6 15.80-19 49.6 48.1 47.5 48.7 48.7 43.9 48.0 46.3 47.4 40.1 41.5 42.6 47.3 44.3 48.6 50.0 50.1 48.920-44 32.4 31.7 30.6 29.7 29.5 29.1 27.9 27.3 26.7 25.3 24.5 24.1 23.4 24.6 24.3 25.6 24.9 25.245-64 11.8 12.5 12.8 12.9 13.5 13.2 13.5 13.6 13.5 13.4 13.0 13.2 13.5 14.0 14.5 15.5 15.8 15.665-<70 2.0 2.2 2.8 2.9 3.9 3.5 3.7 4.3 4.6 4.7 5.1 5.9 6.2 7.4 8.0 9.0 9.2 10.0
2011 USRDS ANNUAL DATA REPORT
volumetwoesrd
page178
healthy people 2020TRANSPLANTATION
In 2008, the proportion of dialysis patients wait-listed and/or receiving a deceased donor kidney transplant within one year of end-stage renal dis-ease start was 16.9 percent — slightly below the HP2020 target of 18.8 percent.
The target is currently met only among Asians, individuals of two or more races, and those age 0–19 and 20–44. Those furthest from the tar-get include American Indian/Alaskan Natives and individuals age 65 to less than 70. » Table HP2020 CKD-12; see page 379 for analytical methods. Incident ESRD patients younger than 70.
HP2020 CKD-12Increase the proportion of dialysis patients wait-listed and/or receiving a deceased donor kidney transplant within one year of end-stage renal disease start (among patients under 70 years of age )
TARGET: 18.8% of dialysis patients

vol 2esrd
1991 1992 1993 1994 1995 1996 1997 1998 1999 2000 2001 2002 2003 2004 2005 2006All 24.5 24.1 22.9 21.6 21.7 20.7 20.2 20.0 19.5 19.1 18.4 18.4 17.8 17.9 17.3 16.7Am. Indian/Al. Native only 19.7 15.7 13.5 16.4 15.4 10.9 10.6 11.8 9.9 15.8 8.6 11.5 8.8 9.3 8.9 10.1Asian only 29.2 26.5 24.6 21.9 25.0 23.8 22.1 19.7 18.9 19.9 19.5 21.7 22.2 20.6 18.3 18.6Native Hawaiian/other Pac. Is. only 83.3 62.5 35.2 50.0 11.9 16.2 14.6 13.8 15.6 9.0 14.7 14.4 13.5 13.8 10.4 10.9Black/Af. Am. only 13.2 13.8 12.5 12.0 12.0 11.2 9.8 9.9 9.7 9.9 9.0 9.7 9.3 10.1 9.7 9.1White only 30.9 30.4 29.7 27.7 28.3 27.4 27.4 27.0 26.3 25.2 24.4 23.8 23.2 22.7 22.1 21.22 or more races 16.5 16.1Hispanic or Latino 15.9 17.0 16.9 15.1 15.3 14.9 14.6 14.6 13.9 13.9 13.7Not Hispanic or Latino 24.1 24.0 23.0 21.7 22.0 21.4 20.6 20.4 20.2 19.8 19.0 19.0 18.4 18.7 17.9 17.3Black/Af. Am. only, not Hisp/Latino 13.1 13.6 12.4 11.8 11.8 11.2 9.7 9.9 9.6 9.9 9.0 9.7 9.3 10.1 9.6 9.0White only, not Hispanic/Latino 31.2 31.3 30.8 28.8 29.8 29.6 29.3 28.9 28.8 27.6 26.8 26.4 25.7 25.3 24.6 23.9Male 27.7 27.2 26.3 24.1 24.3 23.2 22.1 21.9 21.1 20.6 19.8 20.0 19.4 19.3 18.7 18.1Female 20.6 20.5 19.0 18.8 18.6 17.7 17.8 17.6 17.4 17.3 16.6 16.3 15.8 16.1 15.5 14.90-19 72.3 69.1 69.9 69.6 69.2 68.9 70.4 68.1 70.2 67.7 67.8 68.0 69.8 67.9 68.3 63.620-44 43.6 41.8 40.5 37.9 36.4 35.3 34.4 33.5 32.2 31.0 29.8 29.4 27.9 28.1 26.3 25.645-64 17.2 17.9 17.0 16.4 16.9 16.0 16.0 16.2 15.7 15.9 15.3 15.1 14.9 14.9 14.7 14.265-<70 3.3 3.6 4.0 4.0 4.6 4.5 4.9 5.3 6.0 6.2 6.4 7.4 7.7 8.0 7.7 8.3
1992 1993 1994 1995 1996 1997 1998 1999 2000 2001 2002 2003 2004 2005 2006 2007 2008 2009All 2.5 2.3 2.2 2.5 2.5 2.4 2.4 2.6 2.8 2.9 3.0 2.8 3.1 3.2 3.4 3.4 3.3 3.2Am. Indian/Al. Native only 1.4 0.6 0.7 2.5 1.0 0.7 1.1 0.7 0.8 0.9 0.9 1.5 0.7 0.9 1.4 1.1 1.1 1.6Asian only 1.9 1.0 1.6 1.8 2.2 1.6 1.8 1.5 2.8 2.3 3.0 2.7 2.5 2.7 2.6 2.9 3.1 2.7Native Hawaiian/other Pac. Is. only . . . 0.3 0.7 0.5 0.2 0.9 0.8 1.1 1.6 0.8 0.9 0.9 1.5 2.1 3.0 2.3Black/Af. Am. only 0.7 0.6 0.8 0.9 0.7 0.5 0.5 0.7 0.7 0.7 0.8 0.8 0.8 0.9 0.9 1.0 1.0 1.0White only 3.6 3.4 3.1 3.5 3.8 3.7 3.7 4.0 4.3 4.4 4.5 4.2 4.5 4.7 4.8 4.9 4.7 4.42 or more races 2.5 2.6 1.3 2.3 3.0Hispanic or Latino 1.1 1.1 1.2 1.2 1.2 1.2 1.4 1.3 1.4 1.3 1.8 1.7 1.8 1.8Not Hispanic or Latino 2.5 2.4 2.2 2.7 2.7 2.6 2.6 2.9 3.1 3.2 3.3 3.1 3.4 3.5 3.7 3.8 3.6 3.5Black/Af. Am. only, not Hisp/Latino 0.7 0.6 0.7 0.8 0.7 0.5 0.5 0.7 0.7 0.7 0.8 0.8 0.8 0.9 0.9 1.0 1.0 1.0White only, not Hispanic/Latino 3.7 3.7 3.3 4.0 4.2 4.2 4.2 4.6 4.9 5.1 5.3 5.0 5.3 5.6 5.8 5.9 5.7 5.3Male 2.6 2.5 2.2 2.6 2.8 2.6 2.5 2.8 2.9 3.0 3.1 2.9 3.1 3.2 3.5 3.5 3.2 3.2Female 2.4 2.1 2.1 2.4 2.1 2.2 2.3 2.4 2.7 2.8 3.0 2.8 3.1 3.2 3.2 3.3 3.4 3.20-19 14.0 14.4 13.7 16.1 16.2 16.5 13.7 16.4 16.0 16.5 15.2 14.0 13.8 16.1 15.0 14.8 14.4 16.320-44 5.0 4.4 4.4 4.6 4.6 4.4 4.7 4.8 5.2 5.1 5.2 4.5 5.0 4.6 5.1 5.0 4.7 4.645-64 1.5 1.4 1.4 1.6 1.7 1.7 1.7 1.9 2.2 2.3 2.5 2.5 2.7 2.9 3.0 3.2 3.0 2.865-<70 0.2 0.2 0.2 0.3 0.3 0.4 0.4 0.5 0.6 0.7 0.8 1.0 1.1 1.4 1.6 1.5 1.7 1.7 HP
CHAPTER
page179
The goal of Objective 13.1 is to have 19.7 percent of incident ESRD patients younger than 70 transplanted within three years of initiation; as of 2006, just 16.7 percent of patients meet this goal. Rates are lowest among blacks/African Americans, American Indians/Alaskan Natives, and Native Hawaiians/other Pacific Islanders, at 9.1–10.9 percent.
After remaining at 68–70 percent through the 1990s and mid-2000s, the percentage of pediatric ESRD patients transplanted fell to 64 in 2006. The pro-portion of patients receiving a preemp-tive transplant was 3.2 percent in 2006. » Tables HP2020 CKD-13; see page 379 for analytical methods. Incident ESRD patients younger than 70.
HP2020 CKD-13Increase the proportion of patients with treated chronic kidney failure who receive a transplant (among patients under 70 years of age )
HP2020 CKD-13.1 TARGET: 19.7%Increase the proportion of patients receiving a kidney transplant within three years of end-stage renal disease
HP2020 CKD-13.2Increase the proportion of patients who receive a preemptive transplant at the start of esrd

1998 1999 2000 2001 2002 2003 2004 2005 2006 2007 2008 2009All 231.7 237.8 232.7 234.6 232.6 231.5 227.4 223.6 219.6 211.4 204.5 199.5American Indian or Alaskan Native only 188.8 196.7 206.1 206.4 195.6 190.5 183.0 181.4 172.5 165.2 169.4 172.5Asian only 181.1 187.9 171.3 173.3 162.6 175.4 166.9 170.5 160.6 156.3 144.2 145.5Native Hawaiian or other Pacific Islander only 173.0 160.8 169.2 162.3 178.1 169.7 166.7 154.8 164.9 162.6 149.3 156.1Black or African American only 177.4 186.9 181.1 186.6 182.6 182.8 182.2 178.8 173.5 167.0 160.8 156.6White only 280.4 284.3 279.4 279.5 279.0 275.7 268.6 264.8 260.5 250.0 241.4 234.72 or more races 354.2 254.4 191.2 192.0 185.1Hispanic or Latino 193.3 192.9 185.6 186.6 185.0 184.5 178.1 173.9 166.0 155.9 150.6 149.2Not Hispanic or Latino 236.7 243.9 239.5 241.9 240.1 239.2 235.6 232.2 229.1 221.6 214.7 209.3Black or African American only, not Hisp/Latino 177.4 186.8 181.3 186.7 182.7 182.9 182.0 178.7 173.4 167.2 160.7 156.8White only, not Hispanic or Latino 296.4 302.9 300.6 301.7 301.9 299.8 293.7 290.8 289.0 279.9 272.9 265.8Male 227.0 231.4 226.7 228.2 225.8 226.7 223.5 219.6 215.7 208.4 202.4 199.1Female 236.8 244.8 239.3 241.8 240.4 237.2 231.8 228.3 224.3 215.0 207.0 200.00-19 39.6 48.8 41.7 49.4 38.9 54.6 44.0 35.5 43.0 37.4 35.6 31.320-44 92.1 94.1 89.8 90.4 92.9 90.1 86.7 84.7 82.1 78.3 73.8 72.245-64 175.7 180.5 174.7 177.1 172.8 174.2 170.5 163.7 162.9 154.9 148.5 145.265-74 296.0 298.4 293.1 290.0 285.8 281.3 275.2 271.1 260.4 249.9 244.9 240.275+ 429.0 439.0 427.0 427.8 422.9 414.3 408.7 408.6 402.4 393.8 381.9 369.3
2011 USRDS ANNUAL DATA REPORT
volumetwoesrd
page180
healthy people 2020MORTALITY
Since 1998, the overall death rate among prevalent patients on dialysis has fallen 14 percent, from 232 deaths per 1,000 patient years to just under 200 in 2009 — approaching the HP2020 target of 190.8. By race, the rate ranges from 146 among Asians to 235 among whites; by ethnicity, it is 149 among Hispanics and Latinos and 209 among those not in either group. The mortal-ity rate has fallen for all groups since 1998; for Hispanics and Latinos, and for those age 0–44, the rate has declined more than 20 percent.
The rate of mortality in the first three months of ESRD has fallen from its peak of 388 in 2003, but, at 354 in 2009, remains a distance from the HP2020 target of 319.9 deaths per 1,000 patient years at risk. The highest rate by race occurs among whites, at 412 compared to 158 among American Indians/Alaskan Natives, and 207–212 among Asians and Native Hawaiians/Pacific Islanders.
At 82.6 deaths per 1,000 patient years in 2009, the rate of cardiovas-cular mortality among dialysis patients is close to the HP2020 goal of 81.3. The
rate has fallen 31 percent overall since 1998, and 35 percent for whites and for patients age 65 and older. By race, the rate is highest, once again, among whites, at 95 compared to 67–70 among blacks/African Americans, American Indians/Alaskan Natives, and Asians.
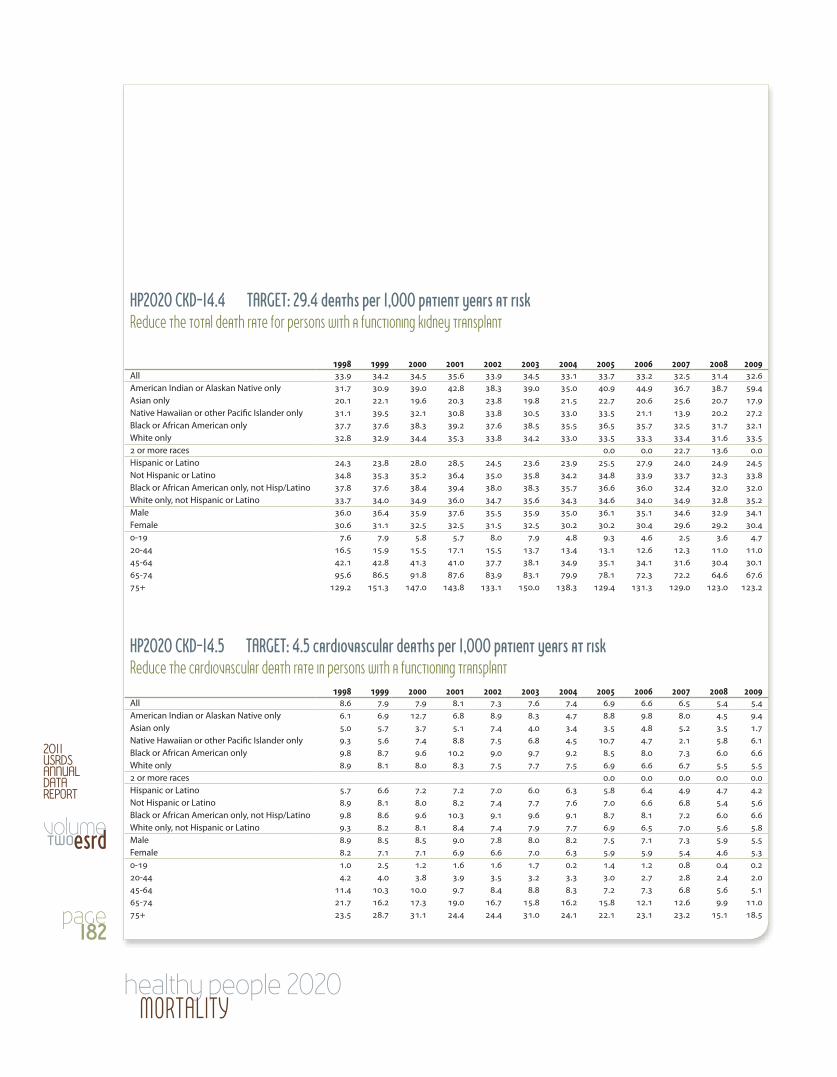
For patients with a functioning transplant, the overall rate of mortality in 2009 rose slightly from the previous year, to 32.6 deaths per 1,000 patient years — a bit above the HP2020 goal of 29.4. By race, mortality ranges from 17.9 among Asians to 59.4 among American Indians/Alaskan Natives.
The rate of cardiovascular mortality among transplant patients has fallen 37 percent since 1998, but, at 5.4 deaths per 1,000 patient years, still remains above the HP2020 target of 4.5. The rate is just 1.7 among Asian patients, but 9.4 among American Indians/Alaskan Natives. » Tables HP2020 CKD-14; see page 379 for analytical methods. Period prevalent dialysis patients; unadjusted (14.1, 14.3). Inci-dent dialysis patients; unadjusted (14.2). Period prevalent transplant patients; unadjusted (14.4–5).
HP2020 CKD-14Reduce deaths in persons with end-stage renal disease
HP2020 CKD-14.1 TARGET: 190.8 deaths per 1,000 patient yearsReduce the total death rate for persons on dialysis

vol 2esrd
1998 1999 2000 2001 2002 2003 2004 2005 2006 2007 2008 2009All 367.4 377.3 377.3 382.6 382.6 388.3 383.9 378.8 372.5 365.3 361.6 353.7American Indian or Alaskan Native only 170.9 224.8 299.9 185.0 145.9 203.4 212.0 205.7 158.4 172.0 233.1 158.0Asian only 282.2 251.8 194.3 233.8 229.0 230.2 226.5 256.3 216.6 237.9 198.0 211.8Native Hawaiian or other Pacific Islander only 231.2 216.7 173.2 204.9 180.9 185.1 185.2 172.1 219.9 179.7 161.6 207.2Black or African American only 252.7 257.8 272.7 273.3 265.0 278.6 274.0 272.5 264.6 253.8 251.0 247.1White only 431.1 441.2 442.7 445.7 450.7 453.9 445.8 434.8 429.6 424.6 420.7 412.02 or more races 419.6 303.6 289.3 329.7 178.8Hispanic or Latino 265.6 258.5 273.5 277.7 250.2 269.3 255.4 259.2 232.0 237.7 225.7 215.4Not Hispanic or Latino 380.6 393.7 393.8 397.5 402.4 406.8 404.0 397.5 395.1 386.4 384.7 377.3Black or African American only, not Hisp/Latino 253.0 257.4 271.5 273.6 264.6 278.4 274.4 271.5 264.6 254.2 250.3 246.3White only, not Hispanic or Latino 459.5 475.7 475.5 479.3 492.0 493.4 488.2 476.7 479.9 473.4 475.1 466.9Male 373.7 375.0 372.1 382.7 376.4 387.0 383.9 375.1 368.1 366.3 362.4 357.8Female 360.3 380.0 383.3 382.6 390.0 389.9 383.9 383.5 378.0 364.1 360.7 348.30-19 44.7 80.0 54.3 70.5 43.0 63.5 75.4 92.9 73.3 52.1 46.1 74.520-44 107.6 107.0 104.8 102.2 106.4 105.4 106.8 104.8 100.3 95.4 102.4 103.945-64 215.0 218.8 212.7 219.5 211.3 219.5 213.7 216.7 208.5 200.6 207.6 207.265-74 424.3 426.8 434.7 432.8 428.7 423.6 424.2 417.8 408.2 407.9 406.3 391.475+ 736.2 746.4 734.5 739.2 734.8 753.2 745.4 725.4 730.4 720.4 693.7 679.6
1998 1999 2000 2001 2002 2003 2004 2005 2006 2007 2008 2009All 119.4 121.5 116.2 117.9 114.7 112.4 107.5 100.8 95.3 90.0 85.4 82.6American Indian or Alaskan Native only 99.9 103.3 104.8 103.9 91.5 88.8 83.3 77.6 72.6 69.1 60.5 68.1Asian only 101.0 109.8 96.4 97.3 88.4 96.5 85.7 88.3 72.4 70.9 68.0 69.6Native Hawaiian or other Pacific Islander only 95.6 97.0 107.1 100.0 108.5 102.6 90.6 77.0 90.8 82.0 73.9 84.1Black or African American only 89.4 93.1 87.7 90.4 88.8 86.8 85.1 81.0 77.5 72.4 69.6 67.2White only 146.6 147.6 141.0 142.3 138.4 134.9 127.6 118.8 111.2 105.1 98.5 95.02 or more races 109.0 88.7 84.1 81.8 73.8Hispanic or Latino 99.5 97.6 94.5 97.3 93.2 90.1 85.8 81.6 75.4 70.1 67.1 67.5Not Hispanic or Latino 122.0 124.7 119.4 121.1 118.1 116.0 111.1 104.1 98.8 93.7 88.8 85.6Black or African American only, not Hisp/Latino 89.6 93.1 87.7 90.5 88.6 86.8 85.0 80.9 77.5 72.5 69.6 67.2White only, not Hispanic or Latino 154.5 156.9 151.0 153.0 149.2 146.5 138.9 129.2 121.8 116.3 109.5 104.9Male 118.5 120.1 114.7 117.1 113.9 112.5 108.2 101.4 96.2 90.9 87.1 84.9Female 120.3 123.0 117.9 118.9 115.5 112.3 106.7 100.1 94.1 88.9 83.2 79.90-19 15.3 17.1 12.9 20.1 12.2 13.4 16.4 16.6 16.4 11.5 11.2 12.020-44 41.9 39.8 39.5 40.5 41.7 39.9 38.8 37.5 35.7 33.0 31.3 31.245-64 91.4 93.9 88.5 89.3 86.3 84.6 81.3 75.6 73.4 68.6 65.4 63.765-74 155.7 156.7 148.8 149.8 143.0 139.2 133.1 123.5 114.8 108.1 104.5 101.275+ 220.6 223.5 213.2 214.1 207.3 201.6 190.4 179.8 166.9 160.6 149.4 142.5 HP
CHAPTER
page181
HP2020 CKD-14.2 TARGET: 319.9 deaths per 1,000 patient years at riskReduce the death rate in dialysis patients within the first three months of initiation of renal replacement therapy
HP2020 CKD-14.3 TARGET: 81.3 deaths per 1,000 patient years at riskReduce the cardiovascular death rate for persons on dialysis
1998 1999 2000 2001 2002 2003 2004 2005 2006 2007 2008 2009All 33.9 34.2 34.5 35.6 33.9 34.5 33.1 33.7 33.2 32.5 31.4 32.6American Indian or Alaskan Native only 31.7 30.9 39.0 42.8 38.3 39.0 35.0 40.9 44.9 36.7 38.7 59.4Asian only 20.1 22.1 19.6 20.3 23.8 19.8 21.5 22.7 20.6 25.6 20.7 17.9Native Hawaiian or other Pacific Islander only 31.1 39.5 32.1 30.8 33.8 30.5 33.0 33.5 21.1 13.9 20.2 27.2Black or African American only 37.7 37.6 38.3 39.2 37.6 38.5 35.5 36.5 35.7 32.5 31.7 32.1White only 32.8 32.9 34.4 35.3 33.8 34.2 33.0 33.5 33.3 33.4 31.6 33.52 or more races 0.0 0.0 22.7 13.6 0.0Hispanic or Latino 24.3 23.8 28.0 28.5 24.5 23.6 23.9 25.5 27.9 24.0 24.9 24.5Not Hispanic or Latino 34.8 35.3 35.2 36.4 35.0 35.8 34.2 34.8 33.9 33.7 32.3 33.8Black or African American only, not Hisp/Latino 37.8 37.6 38.4 39.4 38.0 38.3 35.7 36.6 36.0 32.4 32.0 32.0White only, not Hispanic or Latino 33.7 34.0 34.9 36.0 34.7 35.6 34.3 34.6 34.0 34.9 32.8 35.2Male 36.0 36.4 35.9 37.6 35.5 35.9 35.0 36.1 35.1 34.6 32.9 34.1Female 30.6 31.1 32.5 32.5 31.5 32.5 30.2 30.2 30.4 29.6 29.2 30.40-19 7.6 7.9 5.8 5.7 8.0 7.9 4.8 9.3 4.6 2.5 3.6 4.720-44 16.5 15.9 15.5 17.1 15.5 13.7 13.4 13.1 12.6 12.3 11.0 11.045-64 42.1 42.8 41.3 41.0 37.7 38.1 34.9 35.1 34.1 31.6 30.4 30.165-74 95.6 86.5 91.8 87.6 83.9 83.1 79.9 78.1 72.3 72.2 64.6 67.675+ 129.2 151.3 147.0 143.8 133.1 150.0 138.3 129.4 131.3 129.0 123.0 123.2
1998 1999 2000 2001 2002 2003 2004 2005 2006 2007 2008 2009All 8.6 7.9 7.9 8.1 7.3 7.6 7.4 6.9 6.6 6.5 5.4 5.4American Indian or Alaskan Native only 6.1 6.9 12.7 6.8 8.9 8.3 4.7 8.8 9.8 8.0 4.5 9.4Asian only 5.0 5.7 3.7 5.1 7.4 4.0 3.4 3.5 4.8 5.2 3.5 1.7Native Hawaiian or other Pacific Islander only 9.3 5.6 7.4 8.8 7.5 6.8 4.5 10.7 4.7 2.1 5.8 6.1Black or African American only 9.8 8.7 9.6 10.2 9.0 9.7 9.2 8.5 8.0 7.3 6.0 6.6White only 8.9 8.1 8.0 8.3 7.5 7.7 7.5 6.9 6.6 6.7 5.5 5.52 or more races 0.0 0.0 0.0 0.0 0.0Hispanic or Latino 5.7 6.6 7.2 7.2 7.0 6.0 6.3 5.8 6.4 4.9 4.7 4.2Not Hispanic or Latino 8.9 8.1 8.0 8.2 7.4 7.7 7.6 7.0 6.6 6.8 5.4 5.6Black or African American only, not Hisp/Latino 9.8 8.6 9.6 10.3 9.1 9.6 9.1 8.7 8.1 7.2 6.0 6.6White only, not Hispanic or Latino 9.3 8.2 8.1 8.4 7.4 7.9 7.7 6.9 6.5 7.0 5.6 5.8Male 8.9 8.5 8.5 9.0 7.8 8.0 8.2 7.5 7.1 7.3 5.9 5.5Female 8.2 7.1 7.1 6.9 6.6 7.0 6.3 5.9 5.9 5.4 4.6 5.30-19 1.0 2.5 1.2 1.6 1.6 1.7 0.2 1.4 1.2 0.8 0.4 0.220-44 4.2 4.0 3.8 3.9 3.5 3.2 3.3 3.0 2.7 2.8 2.4 2.045-64 11.4 10.3 10.0 9.7 8.4 8.8 8.3 7.2 7.3 6.8 5.6 5.165-74 21.7 16.2 17.3 19.0 16.7 15.8 16.2 15.8 12.1 12.6 9.9 11.075+ 23.5 28.7 31.1 24.4 24.4 31.0 24.1 22.1 23.1 23.2 15.1 18.5
2011 USRDS ANNUAL DATA REPORT
volumetwoesrd
page182
healthy people 2020MORTALITY
HP2020 CKD-14.4 TARGET: 29.4 deaths per 1,000 patient years at riskReduce the total death rate for persons with a functioning kidney transplant
HP2020 CKD-14.5 TARGET: 4.5 cardiovascular deaths per 1,000 patient years at riskReduce the cardiovascular death rate in persons with a functioning transplant