gpe 2020 country-level prospective evaluations...annex table 1 - stakeholder mapping for nigeria ......
TRANSCRIPT

GPE 2020 Country-Level Prospective Evaluations
FIRST ANNUAL REPORT: NIGERIA (APRIL 2019)
Prepared by Fergal Turner, Mo Adefeso-Olateju and Rachel Outhred


NIGERIA FIRST ANNUAL REPORT i
© UNIVERSALIA
Disclaimer The views expressed in this report are those of the evaluators. They do not represent those of GPE or of any of the individuals and organizations referred to in the report.
‘Itad’ and the tri-color triangles icon are a registered trademark of ITAD Limited.
Acknowledgments
The evaluation team hereby wishes to express its gratitude to all stakeholders who have been involved in and supported this prospective evaluation, in particular the federal and state ministries of education, the federal and state project coordinators, the Secretariat (especially the country lead for Nigeria), and all institutions and individuals consulted during the evaluation process.


NIGERIA FIRST ANNUAL REPORT iii
© UNIVERSALIA
Contents
EXECUTIVE SUMMARY ......................................................................................................................... 9
A) Overview ......................................................................................................................................... 9 B) Purpose and objectives ................................................................................................................... 9 C) Intended audience .......................................................................................................................... 9 D) Methodology .................................................................................................................................. 9 E) GPE engagement .......................................................................................................................... 10 F) Key findings ................................................................................................................................... 10 G) Conclusions, based on lessons learned ........................................................................................ 14 H) Recommendations ........................................................................................................................ 14
1 INTRODUCTION .............................................................................................................................. 16
1.1 Background ................................................................................................................................... 16 1.1.1 Overview of Nigeria ......................................................................................................... 16 1.1.2 GPE in Nigeria .................................................................................................................. 20 1.1.3 Evaluation background .................................................................................................... 25 1.1.4 Methodology and tools ................................................................................................... 25 1.1.5 About this annual report ................................................................................................. 26
1.2 Country-specific ToC ..................................................................................................................... 27 1.2.1 Objective ......................................................................................................................... 27 1.2.2 Development of country-adapted ToC ..................................................................... 27 1.2.3 Assembling the contribution story ............................................................................ 30
2 ASSESSMENT OF GPE CONTRIBUTIONS TO EDUCATION SECTOR PLANNING AND POLICY IMPLEMENTATION, FINANCING AND SECTOR DIALOG/ MONITORING IN NIGERIA ........................ 34
2.1 Situation analysis at Year 1 ........................................................................................................... 34 2.1.1 Education sector planning .......................................................................................... 34 2.1.2 Mutual accountability through sector dialog and monitoring ............................. 39 2.1.3 Education sector financing ......................................................................................... 44 2.1.4 ESP implementation .................................................................................................... 50 2.1.5 Alternative explanations and unintended/unplanned effects .............................. 55
2.2 Progress toward a stronger education system ..................................................................... 59 2.2.1 Teachers ......................................................................................................................... 59 2.2.2 LASs ................................................................................................................................. 61

iv NIGERIA ANNUAL REPORT YEAR ONE
© UNIVERSALIA
2.2.3 EMISs .............................................................................................................................. 62 2.3 Progress toward stronger learning outcomes and equity .................................................. 63 2.4 Plausibility of the ToC at Year 1 .............................................................................................. 66 2.5 Available evidence at Year 1 .................................................................................................... 69
3 EVALUATION FOCUS .................................................................................................................. 72
3.1 Focus themes .............................................................................................................................. 72 3.2 Gaps to fill ................................................................................................................................... 72 3.3 Risks to address ......................................................................................................................... 73 3.4 Key steps ..................................................................................................................................... 73 3.5 Workplan ..................................................................................................................................... 73
4 CONCLUSIONS AND RECOMMENDATIONS .................................................................................. 75
4.1 Conclusions ................................................................................................................................. 75 4.2 Recommendations ..................................................................................................................... 75
ANNEXES ........................................................................................................................................... 77
Annex A Background to the GPE country-level evaluation and stakeholder mapping ..... 77 Background ................................................................................................................................. 77 Stakeholder mapping ................................................................................................................ 78
Annex B Nigeria GPE program details and timeline ............................................................... 80 Annex C Evaluation tools ............................................................................................................ 83
i . GPE Results Framework ........................................................................................... 84 i i . Evaluat ion matrix ...................................................................................................... 94 i i i . GPE ToC ....................................................................................................................... 105 iv. Generic country-level ToC .................................................................................... 106
Annex D People consulted ........................................................................................................ 107 Annex E Interview guides ......................................................................................................... 110
i. Approach to interviews ............................................................................................. 110 ii. Focus group discussions ............................................................................................ 111
Annex F Additional budget data for 2015/16.............................................................................. 112 Annex G NALABE 2011 mathematics and English data ............................................................... 113 Annex H GPIs ................................................................................................................................ 114 Annex I Risks to the evaluation, quality assurance and ethics ......................................... 115
i . Risks to the evaluat ion .......................................................................................... 115 i i . Qual ity assurance .................................................................................................... 117 i i i . Ethics ........................................................................................................................... 117
BIBLIOGRAPHY ................................................................................................................................ 119

NIGERIA FIRST ANNUAL REPORT v
© UNIVERSALIA
Figures Figure 1 - Timeline of the education sector and national events in Nigeria ................................................ 23 Figure 2 - Comparison of state budget allocations and release rates for 2015 and 2016 (Naira millions)
..................................................................................................... Error! Bookmark not defined. Figure 3 - Literacy and numeracy scores from ESSPIN assessment 2012–2016 .......................................... 64 Annex Figure 1 - Prospective evaluations – Stages of the evaluation ......................................................... 83

vi NIGERIA ANNUAL REPORT YEAR ONE
© UNIVERSALIA
Tables Table 1 - Summary of GPE funding to Nigeria as at November 2018 in US$ ............................................... 20 Table 2 - GPE financing for components 1 and 2 as a percentage of UBE Conditional Grants by
participating state for four years ............................................................................................. 22 Table 3 - Explanatory mechanisms, critical underlying assumptions and contribution claims for Nigeria . 31 Table 4 - Initial (2013) assessment of state education sector plans ............................................................ 34 Table 5 - ESP priorities in the five GPE states, grouped by overarching theme ........................................... 36 Table 6 - Comparison of UBE funding and GPE ESPIG divisions (NIPEP components 1 and 2) for five
NIPEP states (2016–2019) ....................................................................................................... 48 Table 7 - ESP implementation by priority area in each state in 2016 .......................................................... 51 Table 8 - NIPEP contributions to ESP implementation in the five states (project components 1, 2 and 3) 53 Table 9 - Summary of progress towards NIPEP outcomes ........................................................................... 55 Table 10 - Other DP contributions to ESP priorities by state ....................................................................... 56 Table 11 - Teacher status in the five states .................................................................................................. 60 Table 12 - Primary/JSS pupil–classroom ratios ............................................................................................ 60 Table 13 - Primary/JSS pupil–toilet ratios .................................................................................................... 61 Table 14 - Status of AESPRs, EMISs and standardized test administration, by NIPEP states ....................... 62 Table 15 - Annual census data from Kano State .......................................................................................... 65 Table 16 - Summary of findings against assumptions at Year 1 ................................................................... 66 Table 17 - Assessment of plausibility of contribution claims regarding GPE’s support in Nigeria ............... 68 Table 18 - Data availability and gaps for Year 1 ........................................................................................... 69 Table 19 - Activities and key dates ............................................................................................................... 74 Annex Table 1 - Stakeholder mapping for Nigeria ....................................................................................... 78 Annex Table 2 - GPE 2016–2020 Results Framework .................................................................................. 84 Annex Table 3 - Evaluation matrix................................................................................................................ 94 Annex Table 4 - Key anticipated risks and limitations, and proposed mitigation mechanisms ................. 115 Annex Table 5 - Quality Assurance ............................................................................................................. 117

NIGERIA FIRST ANNUAL REPORT vii
© UNIVERSALIA
Abbreviations and Acronyms AESPR Annual Education Sector Performance Review ASC Annual Schools Census BESDA Basic Education Service Delivery for All CEQ Country Evaluation Question CSACEFA Civil Society Coalition on Education for All CSEF Civil Society Education Fund CSO Civil Society Organization DCP Developing Country Partner DFID U.K. Department for International Development DP Development Partner EGRA Early Grade Reading Assessment EMIS Education Management Information System ESP Education Sector Plan ESPDG Education sector plan development grant ESPIG Education sector program implementation grant ESSPIN Education Sector Support Program in Nigeria FMoE Federal Ministry of Education FPSU Federal Project Support Unit GER Gross Enrollment Ratio GNI Gross national income GPE Global Partnership for Education GPI Gender Parity Index IBRD International Bank for Reconstruction and Development IDPG International Development Partners Group IQTE Integrated Qur’anic Training and Education ISR Implementation status and results report ITRP Independent Technical Review Panel JS1 Junior Secondary 1 JSR Joint Sector Review JSS Junior Secondary School LAS Learning assessment system LEG Local Education Group LGEA Local Government Education Authority M&E Monitoring and Evaluation MDAs Ministries, Departments and Agencies MLA Monitoring Learning Achievement MTSS Medium-Term Sector Strategy NALABE National Assessment of Learning Achievement in Basic Education

viii NIGERIA ANNUAL REPORT YEAR ONE
© UNIVERSALIA
NBS National Bureau of Statistics NCE National Council on Education NEI Northern Education Initiative NER Net Enrollment Rate NIPEP Nigeria Partnership for Education Project ODA Overseas Development Assistance OECD DAC Organisation for Economic Co-operation and Development Development Assistance
Committee P1 Primary 1 PAD Project Appraisal Document SBMC School-Based Management Committee SDGs Sustainable Development Goals SIP Social Investment Program SIPs School Improvement Plans SPSC State Project Steering Committee SMoE State Ministry of Education SUBEB State Universal Basic Education Board ToC Theory of Change UBE Universal Basic Education UBE-IF UBE Intervention Fund UBEC Universal Basic Education Commission UIS UNESCO Institute of Statistics UNESCO United Nations Educational Scientific Cultural Organization UNICEF United Nations Children’s Fund USAID United States Agency for International Development US$ US Dollar

NIGERIA FIRST ANNUAL REPORT 9
© UNIVERSALIA
Executive Summary A) Overview
1. This is the first of two annual reports to be submitted during the three-year prospective evaluation of the Global Partnership for Education (GPE) in Nigeria – one of eight country prospective evaluations that will be complemented by a total of 22 summative country evaluations, to be carried out between 2018 and 2020. It follows a baseline report on Nigeria that was submitted in May 2018, and reproduces some of the material that was included in that report. In addition, it also presents the findings of the first prospective evaluation mission to the country, which took place in April 2018, and offers some initial, tentative conclusions on the basis of the limited data collection, monitoring and assessment undertaken to date.
B) Purpose and objectives
2. The purpose of the prospective evaluations is to assess whether GPE’s inputs and influence are orienting education sector planning, implementation and monitoring toward the intermediary outcomes outlined in its theory of change (ToC). The prospective evaluations are forward-looking, and explore what happens while it happens. They closely observe initial decisions, document the perspectives of decision-makers and focus on the activities and involvement of key stakeholders early in the period under review in order to understand whether progress is being made and whether, and to what extent, GPE is making a contribution. 3. The objective of the prospective evaluations is to assess the relevance, efficiency and effectiveness of GPE’s inputs at the country level, as well as the validity of GPE’s ToC in light of the GPE Strategic Plan 2016–2020. The prospective evaluations seek to establish if and how GPE inputs and activities contribute to outcomes and potential impact at country level. They are designed to assess GPE’s progress on its goals and objectives.
C) Intended audience
4. The primary intended users of the country-level evaluations are members of GPE. This encompasses the Secretariat, senior management and members of the Country Support Team – as well as developing country partner (DCP) governments and other members of Local Education Groups (LEGs) in the sampled countries. Other users include the wider education community at global and country levels.
D) Methodology
5. The methodology for the prospective evaluations is a theory-based contribution analysis approach, and the guiding framework is provided in an evaluation matrix and a country-level ToC, developed according to GPE’s existing overall ToC. The evaluation methodology envisages a seven-stage process. The first four stages focus on establishing a solid baseline for each country and the subsequent three stages constitute iterative annual country-level reporting. In the case of Nigeria, the

10 NIGERIA ANNUAL REPORT YEAR ONE
© UNIVERSALIA
evaluation will focus on the five states to which GPE is providing support: Jigawa, Kaduna, Kano, Katsina and Sokoto.
6. Data have been collected through desk review of available documentation and datasets, supplemented by interviews conducted with key informants during the first country mission.
E) GPE engagement
7. Nigeria has been a GPE partner since 2012. In 2013, it was the recipient of an education sector plan development grant (ESPDG) (US$249,900) and a program development grant (US$480,000). A program implementation grant (US$100.7 million) was approved in 2014. As Nigeria is a federal state, with each state having autonomy to develop its own education sector plan (ESP), GPE funding was allocated specifically to five states in the North West: Jigawa, Kaduna, Kano, Katsina and Sokoto. This funding was used to fund the Nigeria Partnership for Education Project (NIPEP), which focuses on i) promoting school effectiveness and improved learning outcomes; ii) increasing access to basic education for out-of-school girls; and iii) strengthening planning and management systems, including learning assessment and capacity development. The funding period began in 2015 and is due to close in 2019.
8. GPE also provides a wide range of non-financial inputs, primarily through the work of the Secretariat, the grant agent and the coordinating agency, and from GPE’s global-level engagement (e.g. technical assistance, advocacy, knowledge exchange, quality standards and funding requirements). These non-financial elements also form part of the support that is being evaluated during the prospective evaluation undertaken in Nigeria, although it was challenging to find evidence of these contributions.
F) Key findings
9. Planning. Nigeria, as a federal state, has no national ESP. Instead, ESP development is done at the state level, with support from the federal government. The decision to support five states meant that the GPE ESPIG was contributing to five separate ESPs. 10. The results of the initial appraisal1 in 2013 showed the state-level education plans were inadequate. After consideration, the GPE requested the Nigerian federal government resubmit the ESPIG application in 2014 after revising some of the state-level documents. Strengthening of the five state-level three-year operational plans was supported by the ESPDG. The initial appraisal recommended that the three-year operational plans should be improved upon without altering the original 10-year plans, which in effect has made them the core planning documents for the five states. None of the states are planning to design new 10-year plans and will instead focus on recurring three-year plans. The data supplied for indicator 16 of the GPE results framework is based on the appraisal of the original ESPs, in which two were considered to have met the requisite five out of seven quality standards, but none were marked as endorsed. 11. The August 2014 re-appraisal of the five state-level three-year operational plans found the documents were better organized than the previous versions, but many of the weaknesses identified in the original appraisal remained. The appraisers suggested that insufficient time had been allowed for thorough revision and editing of the plans. Nevertheless, the overall recommendation was that despite the weaknesses remaining, the states should be ‘given the benefit of the doubt’ and the plans should be judged as satisfactory. These five three-year Medium-Term Sector Strategies (MTSSs) were
1 There was one appraisal that appraised the five plans separately and compared them.

NIGERIA FIRST ANNUAL REPORT 11
© UNIVERSALIA
endorsed on the basis that insufficient time had been given to fully address the issues that had been raised by the initial appraisal (particularly the weaknesses in budget tracking and monitoring strategies) and that GPE funding would help improve planning for the future. 12. While there is significant variance in language between the five 2015–2017 state-level MTSSs, there is a common set of priorities for the period: improving the quality and relevance of basic, secondary and tertiary education; expanding basic education coverage, especially for disadvantaged groups; providing appropriate non-formal learning opportunities, particularly for illiterate and hard-to-reach children and youth; and strengthening government’s capacity to manage, plan and monitor the delivery of education services more effectively and efficiently. The 2015–2017 state-level three-year MTSSs have subsequently been revised to cover the current 2018–2020 period. As there has been no movement to develop new 10-year plans, these three-year plans should no longer be considered purely operational plans, but are now the key planning documents for the five states. Key informants confirmed that the suggestions made in the re-appraisal of the state-level MTSSs for strengthening the planning process were not acted upon. The quality of these new plans has not been appraised.
13. Monitoring and inclusive sector monitoring. Most basic education funding is transferred to the state level from the federal government, and policy is also set at this level. This means that sector dialogue needs to happen at both federal and state levels. Development partners engaged significantly in 2013 and 2014 in the federal-level LEG during development of the ESPIG application. This LEG ceased to operate once ESPIG implementation started in 2016 and its function was not carried over into another body. The federal-level LEG was reconstituted in 2018, with a focus on development of the new ESPIG. Although the appraisal of the state ESPs carried out with ESPDG funding recommended that the GPE appraisal task forces should have formed the basis for state-level LEGs, this transition never happened. To date there has been no work to organize LEGs at the state level. While the U.K. Department for International Development (DFID) is currently the coordinating agency in Nigeria, the United States Agency for International Development (USAID) filled this role until 2018, for much of the period covered by NIPEP and this evaluation.
14. At the state level, the annual education sector performance review (AESPR) process has been strengthened in three states and introduced in the remaining two. The quality and robustness of analysis in these annual reviews is limited by significant data gaps. The AESPRs are reports that have been produced by external contractors, and while they have been developed with some consultation from state-level stakeholders they are not equivalent to joint sector reviews (JSRs), in that they are not intended to facilitate dialogue or mutual accountability. There is currently no JSR system in place at the state or federal level.
15. The NIPEP mid-term review shows that other than support for the AESPRs, little progress has been made by the project against other intended support to strengthening the availability and use of evidence. NIPEP support is intended to facilitate the strengthening of education management information systems (EMISs), and to introduce a learning assessment system (LAS), and while there is some progress being made on EMIS development, it is not clear how this evidence is being used in policymaking, planning or sector accountability. At the time of evaluation, the development of the LAS was nascent but had not yet begun. While responsibility for monitoring learning achievement (MLA) lies with the Federal Ministry of Education (FMoE), little is done at the state level, and it is yet to be seen how the work at the state level can be sustained in the long term, without working to institutionalize change in the FMoE.
16. There is little evidence of state-level ESPs and annual reviews, or of their implementation being used to develop mutual accountability and frame dialogue between state-level officials and education officials at the federal level, or development partners with ongoing education investments in the individual states. This is partly because of the decision to develop the LEG and the NIPEP steering committee at the federal level, with no tangible input from GPE (through the coordinating agency or the Secretariat) on developing LEGs or JSRs at the state level.

12 NIGERIA ANNUAL REPORT YEAR ONE
© UNIVERSALIA
17. Financing. Public funding for education comes from four main sources: (a) federal statutory allocations to federal, state and local governments; (b) state and local governments’ internally generated funds; (c) funding from the Universal Basic Education Commission (UBEC) and other federal earmarked transfers for education; and (d) development partners’ funds.
18. The lack of standardized budget information across these sources means that it is practically impossible to assess the effectiveness of financial resources allocation in basic education. It is clear that the federal statutory allocations are by far the largest source of funding (national figures from 2013 stated over 95%, while this is a decent estimate, it misses large portions of funding from other parastatals and local government authorities, and so shouldn’t be taken as a final figure), underscoring the vulnerability of states and local governments to federally redistributed revenues. GPE ESPIG funding is probably less that 4 percent of basic education funding in any of the five states, and so is seen as modest. In 2016, Nigeria received US$2.50 billion2 in overseas development assistance (ODA), which is 0.63 percent of Nigeria’s gross national income (GNI), with the major donors being the World Bank, United States, United Kingdom, Global Fund, the European Union and Gavi, in descending order. Between 2013 and 2016 the absolute level of ODA remained effectively stable, as did the important donors.
19. State government officials have a poor understanding of the mechanisms of the GPE funding and think that NIPEP is just another World Bank loan. Nonetheless, stakeholders believe that the GPE funding is very useful, albeit insufficient, in addressing the gaps in funding for the states’ education sector developmental needs. Choices made on what to fund under the ESPIG have limited opportunities to deliver against the GPE aim to use its grants to leverage more accountability and better financing at government level. This is partly because the core of NIPEP’s influence is located at the federal level, and partly because the funding delivered through NIPEP is delivered through the State Ministries of Education (SMoEs) rather than the State Universal Education Boards (SUBEBs). As the SUBEBs are responsible for the majority of state education funding (receiving their funding from UBEC), limiting the financial leverage of GPE funding on SUBEBs limits the impact that GPE funding can have on state-level accountability in financing. This decision was made on the basis that the SUBEBs did not have the fiduciary safeguarding systems in place.
20. While there were some positive reports from interviewed stakeholders that GPE funding was leveraging additional funding for education, there is no concrete evidence of additionality in funding coming from the presence of GPE resources. The lack of detailed information on ODA at the state level makes it difficult to carry out an analysis of this issue of additionality. Further assessment of the additionality of GPE funding will form a key part of the final evaluation of GPE in Nigeria in 2019. 21. Implementation. Obtaining analysis of state-level ESP performance from federally-based stakeholders is challenging. At state level, reporting against the ESPs is constrained by a lack of capacity and data, and failure to set realistic targets at the outcome level. While the AESPRs set out achievements made in the education sector, it is difficult to link this progress to the sector plans, as no clear indicators are given against which success in implementation can be measured. 22. NIPEP is monitored more closely by the World Bank (the grant agent for the ESPIG), with the most recent implementation status and results report (ISR) rating as ‘satisfactory’ progress towards achieving its goals in promoting school effectiveness and improved learning outcomes, and increasing access to basic education for out-of-school girls. Progress on access is tracked by the number of grants disbursed to schools and students, with impact indicators (for example, reading performance) showing no improvement over the project lifetime. The latest ISR notes a decrease in the gender parity index
2 Reported as part of the Organisation for Economic Co-operation and Development (OECD) Development Assistance Committee’s (DAC’s) development finance data – http://www.oecd.org/dac/financing-sustainable-development/development-finance-data/

NIGERIA FIRST ANNUAL REPORT 13
© UNIVERSALIA
(GPI) for primary enrollment between June 2018 and December 2018, making it difficult to assess on what basis progress is deemed to be satisfactory. 23. Progress on the third component of NIPEP, strengthening planning and management systems, including learning assessment and capacity development, is measured by progress on the development of EMISs, LASs and AESPRs. Progress was noted in all of these areas, with all five states having developed EMISs and produced AESPRs. Large scale (non-project) learning assessments had never been carried out at the time of writing, but progress was underway to contract an organization to carry out the first state level assessments before NIPEP closes in June 2019. 24. Progress toward a stronger education system. Assessing progress towards a stronger education system assumes a clear agreement on what needs to be achieved beyond the level of inputs and outputs, and a system that can collect the requisite evidence. Currently, weaknesses in the ESPs mean that a clear and realistic set of targets for the system to achieve during the period of the ESPIG are lacking. A lack of state-level data means it is not possible to assess progress towards stronger education systems at state level. The data that are available from sources such as the United Nations Educational, Scientific and Cultural Organization (UNESCO) Institute of Statistics (UIS) and SABER is not disaggregated by state.
25. Evidence is available at the level of NIPEP and other donor-funded support. The only evidence available state-wide in any of the five states is the annual school census (ASC), the results of which were not made available directly to this evaluation. While it is hoped that NIPEP’s work in strengthening the EMISs will mean that more evaluation of the education systems in the five states will be possible in the final iteration of this evaluation, the overall conclusion is that if it relies on secondary evidence, it will be very challenging for the prospective evaluation to make credible claims on progress towards stronger education systems in any of the five states.
26. Progress toward stronger learning outcomes and equity. There is no standard learning assessment conducted in the five states to provide data on the learning achievement of pupils. Over the years, federal and state education ministries, departments and agencies (MDAs) and international DPs have carried out learning assessments specific to their programs to meet monitoring and evaluation (M&E) needs and other requirements. Most of these exercises do not relate to or build on each other. The latest will be released in 2019 and may later be used to assess learning outcomes in the five states. Learning assessments at the level of donor projects in three of the five GPE states indicate learning is deteriorating. It is important to note that the data available on learning outcomes are available through projects carried out by international DPs, and thus track the learning outcomes of students sampled for their involvement in specific interventions. This means that while they are the best indicators of learning achievement available to this evaluation, they are not representative of the general student population.
27. The data that are available on gender equity in access to education have proven problematic, with different sources providing contradictory figures. Both the AESPRs and the National Bureau of Statistics (NBS) provide figures on equity, but the NBS figures have since been withdrawn due to measurement errors on some of their figures. While this is emblematic of the data production issues in Nigeria, it makes assessment of enrollment and access difficult. What is clear from all the figures available (regardless of their source) is that the five NIPEP states are failing to meet the GPE benchmarks (set out in the GPE results framework indicators) for gender equity in enrollment. Both the NIPEP ISR places the primary GPI at .72, which is below the minimum of .88 set out in the GPE results framework, with the NIPEP ISR showing no improvement in GPI since baseline in 2015). The only recent state-level data on enrollment are given in the NIPEP ISR, which notes a primary net enrollment rate (NER) of 46 percent across both public and private schools. While no state level data are available on the number of out-of-school children, recent data place the figure nationally at 13.5 million – making Nigeria home to the world’s largest population of out-of-school children.

14 NIGERIA ANNUAL REPORT YEAR ONE
© UNIVERSALIA
G) Conclusions, based on lessons learned
28. The GPE generic country-level ToC includes a number of assumptions on how and why the GPE will add value beyond providing financial resources. Many of the assumptions on how and why these benefits are to be delivered have proven invalid in Nigeria. The overall conclusion is that the GPE model will not work in Nigeria without extensive adaptation to align it with the actual context at both federal and state levels. Adaptation needs to be based on the reality that alignment and coordination between the various levels of government in Nigeria responsible for basic education suffer from a number of well understood limitations. These limitations have meant that, despite good intentions, in interviews, representatives of several of the key international DPs were clear that their support has become projectized and they focus on achievements in their priority states. Coordination and alignment at the federal level is missing, as is effective engagement with planning and decision-making institutions at the state level.
29. On the other hand, there is evidence that the ESPIG, delivered through NIPEP, is making a contribution in all five states. However, the lack of outcome-level evidence of educational sector performance will make it challenging to assess the actual level of contribution in each of the five states.
H) Recommendations
30. Recommendations focus on issues that experience to date suggests need to be addressed in the design and implementation of support under the new ESPIG, as well as on the broader work of GPE in advocacy and technical support. These include the following:
Future GPE engagement in Nigeria should start with a clear understanding of which aspects of its standard model can work in the Nigerian context and which need to be adapted, and whether this is feasible.
The role and added value of a federal-level LEG needs to be clearly identified and incentives for its continued operation during implementation of the ESPIG identified and built upon. The decision not to create state-level LEGs should be revisited for any new ESPIG and, if these are not created, how this role would be fulfilled in their absence needs to be considered, with any solution needing to be clear and feasible to implement.
The GPE model starts with an assumption that there is a government-owned and evidence-based ESP that can be used as the basis for alignment, coordination and mutual accountability between key stakeholders. In the Nigerian context, it is questionable whether this assumption can be fully operationalized, given the challenges of relations between the three – federal, state, local – layers of government responsible for various aspects of basic education in Nigeria. The GPE also does not have the leverage to change this context and therefore needs to work within it and work with other development partners to develop a coherent and synergistic approach to addressing these challenges. Logic would suggest starting by examining how among the three main development partners – the World Bank, DFID and USAID – and ensuring that any successor to NIPEP reflects what has been learned and so creates such synergies.
AESPRs add little value if they are not used. Future support therefore should be conditional on having a feasible approach to enhancing their use. Such approaches are generally more effective when they start by first asking how better evidence-based, and useful, AESPRs would help the individual stakeholders meet their own specific needs.
The lack of data and evidence is a significant challenge for evidence-based investment and adaptation in the basic education sector. Responsibility for carrying out ASCs lies at the state

NIGERIA FIRST ANNUAL REPORT 15
© UNIVERSALIA
level and has been routinized, and so improvement can be supported by the provision of ESPIG support directly to the individual state levels. On the other hand, MLA has been designated as a statutory responsibility of the Department for Educational Planning, Research, and Development of the FMoE, but the exercise is far from being institutionalized across the states. Future direct support through an ESPIG to fill this gap will therefore not address the issue that such assessments are not institutionalized and hence will likely not have a sustainable impact. Future GPE inputs, through grants, advocacy and technical support, therefore need to include consideration of (a) why such assessments are not institutionalized; (b) whether there are already realistic plans in place that will address that lack of institutionalization; and (c) if not, what the best use of ESPIG resources and GPE wider support might be to address these challenges. This is representative of the broader issues around political economy and dialogue between states, within states and between state and federal actors, which will be investigated more fully in the final evaluation in 2019.
Work to address the fact that there is no verified consolidated information on public expenditure allocated to and effectively spent on basic education in Nigeria, which prevents an informed evaluation of financial resource mobilization, is also something that cannot be easily addressed at state level. It is a logical assumption that consideration of how to address this should take place at the federal-level LEG.

16 NIGERIA ANNUAL REPORT YEAR ONE
© UNIVERSALIA
1 Introduction 31. This section introduces the report and the evaluation. It covers the relevant country context, as well as the background of this project and the methodology for the evaluation.
1.1 Background
1.1.1 Overview of Nigeria Context area Features
Country context
Nigeria is the most populous country in Africa, with a population of 185 million. It operates a federalized government system, with a federal-level government, 36 state governments and 774 local government councils within six geo-political zones.
Economically, the country is classified as a lower middle-income country and has only recently emerged from an economic recession due to oil price shocks, which resulted in a depreciation of the national currency.
Terrorist activities in the north have exacerbated the socio-economic disparities between northern and southern Nigeria.
Education context
Nigeria operates a decentralized education system, with mother tongue instruction for the first three years, followed by English as the language of instruction for the remainder of time in school.
Despite Nigeria’s commitment to free, compulsory and universal basic education (UBE) under the Universal Basic Education Act of 2004, basic education continues to suffer from low and inequitable access.
There are 31 million children of primary school age, and 25 million of secondary age, with a total of 82 million children under the age of 14.
Nigeria’s gross enrollment rate (GER) in 2016 for primary education was 87 percent and the rate for junior secondary education was 42 percent.
Nigeria, as the largest country in Africa in terms of population, has approximately 20 percent of the total out-of-school children population in the world. Adding to this challenge is the demographic pressure, with about 11,000 newborns every day, which overburdens the system capacity to deliver quality education.
Structure and features of the education system
The Nigerian education system can be described as a ‘1-6-3-3-4’ system: one pre-primary year and six years of primary, followed by three years of junior secondary education—which together comprise basic education; the next three years are senior secondary education, followed by four years of tertiary education.
Basic and senior secondary education remain mostly under the jurisdiction of the state and local governments, while the federal government is responsible for the administration of federally owned universities and Federal Unity Colleges that were set up to serve as model secondary schools. The FMoE has a policy formulation and coordination mandate, the National Council on Education (NCE) coordinates policymaking across the different tiers of government, and UBEC is the executive agency of the federal government responsible for basic education policy implementation.
At the state level, operational responsibility for basic education rests with the SUBEBs, with some variations in the institutional framework: in some instances, secondary education falls under a separate executive agency, the State Education Board, and the SMoE.
At the local level, the institutional framework is not clearly delineated since Local Government Education Authorities (LGEAs)—the local arm of SUBEBs— are in

NIGERIA FIRST ANNUAL REPORT 17
© UNIVERSALIA
charge of basic education, whereas local governments are involved in the management and financing of primary education.
Country context
32. Nigeria, the most populous country in Africa, has a population of about 186 million people, with an annual population growth rate of 3 percent. It is governed through a democratic federation and the constitution confers significant powers, resources, responsibilities and autonomy on the sub-national levels of government.3 Government is therefore split between the federal government, a Federal Capital Territory administration, 36 state governments, and 774 local government councils, and is divided into six geo-political zones: South West, South, South East, North West, North East, and North Central.
33. Nigeria is a lower middle-income country, ranked 152 of 188 on the United Nations Development Program’s 2016 Human Development Index.
34. The country has recently emerged from an economic recession, which started in the second quarter of 2016, caused by an oil price shock as well as shortages in domestic supply due to sabotage of oil export terminals by militants in the Niger Delta. The recession was characterized by a shortage of foreign exchange earnings which led to a depreciation of the national currency – the Naira – and hence a reduction in government’s ability to fund critical interventions, as well as a rise in general prices.4
35. In response to the economic crisis, the federal government initiated the New Nigeria Economic Recovery and Growth Plan for the period, 2017–2020. The vision of this plan is one of sustained inclusive growth, with an emphasis on improving both public and private sector efficiency. This is aimed at increasing national productivity and achieving sustainable diversification, to significantly grow the economy and achieve maximum welfare for the citizens. This plan encourages the use of science, technology and innovation to drive growth and focuses on building the capabilities of the youth of Nigeria to be able to take the country into the future.
36. In recent years, the country, especially the northern region in general, and the north-eastern region in particular, has suffered from continued attacks by Boko Haram, a terrorist group. Their activities have led to over 3 million people becoming internally displaced, and have disrupted agricultural produce and decimated educational infrastructure and activities in the North East zone.5 Furthermore, terrorist activities have exacerbated the socio-economic disparities between northern and southern Nigeria. Even prior to the terrorist insurgency, a high percentage6 of school-aged children in northern Nigeria did not have access to basic education and the region usually ranked lowest on most socio-economic and educational indices.7 Research undertaken for the NIPEP project appraisal document (PAD) found that 2010 out-of-school rates for 6–11-year-olds in the North West were 53 percent and 43 percent, for girls and boys respectively (compared with 31 percent and 25
3 National Population Commission (2017, May 14). Http://population.gov.ng/(Publication). Retrieved February 19, 2018, from website of the Director General of the National Population Commission: http://population.gov.ng/nigerias-population-now-182-million-npc/ 4 PricewaterhouseCoopers (2017) Nigeria's economic recovery Defining the path for economic growth. Retrieved February 26, 2018, from https://www.pwc.com/ng/en/assets/pdf/nigerias-economic-recovery.pdf 5 UNICEF (2016) North East Nigeria: education sector year in review, 2016 (Issue brief). Retrieved February 19, 2018, from the website of Dr. Judith Giwa-Amu: https://www.humanitarianresponse.info/system/files/documents/files/education_sector_2016_year_in_review_factsheet2.pdf 6 The national rate of out-of-school children in Nigeria has not been reported to UIS since 2010. In 2010 the percentage of children out of school nationally was 34.3 percent. 7 UNICEF (2005) Education(Rep.). Retrieved from https://www.unicef.org/nigeria/children_1937.html

18 NIGERIA ANNUAL REPORT YEAR ONE
© UNIVERSALIA
percent nationally)8. In the North West, between 20 percent and 33 percent attend non-integrated Qur’anic schools, while the rest have never attended any form of school.9
Education context
37. The education sector in Nigeria lies within the purview of the federal, state and local governments. Governance and oversight of the sector is on the concurrent legislative list, according to the 1999 constitution. As a result, both the federal and state governments have joint legislative jurisdiction and functional responsibilities in the governance and administration of the sector. Nigeria therefore operates a decentralized system where policies are set at the national level (with input from states) and implemented at the state level.
38. Besides the enactment of the Universal Basic Education Act in 2004, making basic education compulsory, in 2006, another major reform focused on a new vision for the education sector, a national framework, and the 10-year ESP, emphasizing: (i) universal access to basic education; (ii) minimum quality standards; (iii) finance reform to underpin greater equity; and (iv) effective human capital development.
39. The National Policy on Education was last updated in 2013. According to the policy, the key objectives of basic education include providing children with permanent literacy, numeracy and effective communication skills. Additional objectives outlined by the policy include laying a sound basis for scientific, critical and reflective thinking, and promoting patriotism, fairness and national unity.
40. The curriculum at the primary and junior secondary school (JSS) levels broadly focuses on teaching English Studies, Mathematics, Basic Science and Technology, Religious and National Values, Cultural and Creative Arts, one Nigerian language and French. A unique feature of the primary school curriculum is that for the first three years, the medium of instruction is to be the language of the immediate environment in monolingual communities. From the fourth year, English is to be progressively introduced as a language of instruction.10
41. There are currently various government reforms and initiatives aimed at enhancing access to quality education. These include, among others, the introduction of the UBE Fund (a federal intervention fund, which provides matching grants for infrastructure at state level), the upgrade of some polytechnics and colleges of education to the status of degree-awarding institutions, and the introduction of public-private partnerships, as well as approval and accreditation of more private schools and universities across the country.
42. Despite these attempts, the Nigerian system is faced with challenges, especially those related to quality and access, and particularly for children from poor socio-economic backgrounds. A 2012 report by UNESCO revealed that Nigeria was home to the highest number of out-of-school children (10.5 million11), suggesting that one out of every five Nigerian children was out of school in 2012.12 According to 2013 UNESCO UIS data, 31 percent of these estimated 10.5 million were children of primary school age.13 It is likely that this figure is now an underestimate, in light of population growth and child displacement due to terrorist activities. However, the Nigerian government claims that the
8 Figure from NEDS 2010 referenced in 2015 NIPEP PAD 9 NIPEP PAD (2015). 10 NERDC (2013) National Policy on Education (6th ed.) (Nigeria, NERDC). Yaba, Lagos: NERDC Press. 11 It has been widely reported that the 2015 demographic health survey carried out by UNICEF and UBEC found the figure to have increased to 13.2 million, but this figure has not been officially published. Source: https://www.thecable.ng/revealed-number-of-out-of-school-children-rose-to-13-2-million-in-three-years (accessed February 11, 2019). 12 UNICEF (2012) Global Initiatives on Out of School Children: Nigeria Country Study (Rep.). 13 UIS (2013) Available at: https://tinyurl.com/y9ovtecs. Retrieved in June 2018.

NIGERIA FIRST ANNUAL REPORT 19
© UNIVERSALIA
figure has decreased in the last three years and is now at 8.6 million.14 Furthermore, the absorptive capacity of the tertiary institutions is far lower than the demand. As a result, an increasing number of families and students who can afford it are seeking alternative educational opportunities abroad.15
Structure and features of the education system
43. The Nigerian education system can be described as a ‘1-6-3-3-4’ system: one pre-primary year (recently introduced) and six years of primary, followed by three years of junior secondary education—which together comprise basic education; the next three years are senior secondary education, followed by four years of tertiary education. Basic and senior secondary education remain mostly under the jurisdiction of the state and local governments, while the federal government is responsible for the administration of federally owned universities and Federal Unity Colleges that were set up to serve as model secondary schools. The FMoE has a policy formulation and coordination mandate, the NCE coordinates policymaking across the different tiers of government, and UBEC is the executive agency of the federal government responsible for basic education policy implementation.
44. At the state level, operational responsibility for basic education rests with the SUBEBs, with some variations in the institutional framework: in some instances, secondary education falls under a separate executive agency, the State Education Board, and the SMoE. At the local level, the institutional framework is not clearly delineated since LGEAs—the local arm of SUBEBs— are in charge of basic education, whereas local governments are involved in the management and financing of primary education.
45. In the northern states of Nigeria, Islamic education plays a central role in the basic education system. Schools can generally be divided into three categories: purely Qur’anic schools, which teach no formal subjects, and receive no state funding (referred to as Tsangaya schools); Islamiyya schools, which integrate Qur’anic education with the state basic education curriculum, and thus receive the same funding as state schools (also referred to as integrated Qur’anic training and education (IQTE)); and state schools, which have some religious education but are entirely owned and operated by the state. Each state has organizations responsible for setting policy directions in Islamic education, such as the sharia commission. In some northern states a majority of students attend Islamiyya primary schools (for example, 52 percent of schools in Kano State were classed as Islamiyya in 201416), and many students classed as out of school attend un-registered Qur’anic schools.
46. Private education also forms a significant proportion of the basic education sector in the five NIPEP focus states. In Kano and Kaduna states, private schools account for 13 percent and 26 percent of all primary schools.17 Private schools are entirely funded by the fees paid by parents, and generally have lower pupil–teacher ratios. All private schools must be registered with the SUBEB and their enrollment figures are recorded alongside those of public schools.
47. Students receive the Primary School Leaving Certificate based on the completion of Grade 6, based on continuous assessment. Progression to junior secondary education is automatic and compulsory. At the completion of Grade 9, pupils receive the Basic Education Certificate, also known as the Junior School Certificate, based on the results of final examinations. Examinations are
14 The Guardian. Scaling up Northern Girls’ Interest in Education. Accessed at https://guardian.ng/features/scaling-up-northern-girls-interest-in-education/ 15 World Bank (2015) GPE/NIPEP Project Appraisal Document (pp. 7–15, Rep.). 16 Taken from the 2013/14 ASC reports for Kano and Kaduna. Source: https://www.esspin.org/resources/reports/asc 17 Ibid.

20 NIGERIA ANNUAL REPORT YEAR ONE
© UNIVERSALIA
implemented in June each year and students must achieve passes in six subjects, including English and Mathematics, to pass the examination.
1.1.2 GPE in Nigeria 48. Nigeria became a partner of GPE in 2012.18 From the inception of the GPE process in Nigeria, there has been collaboration between the federal and state governments and the local donor group (International Development Partners Group, or IDPG). As co-chair of the IDPG, USAID assisted the FMoE in drafting a letter requesting membership of GPE. Once Nigeria had been accepted as a GPE partner, the IDPG met regularly to discuss strategies and a plan of action to meet the deadline for submission of the program implementation grant. The IDPG and the FMoE nominated USAID as coordinating agency, and the World Bank as grant agent. In 2018 the role of coordinating agency changed to DFID.
49. Initial support started with two grants, an ESPDG and a program development grant. The ESPDG was used primarily to strengthen the ESPs in the five states in which GPE funds were to be used: Jigawa, Kaduna, Kano, Katsina and Sokoto.
50. In December 2014, the Board of GPE approved a program implementation grant of US$100.7 million, to be delivered through NIPEP.
51. The amounts and dates of these GPE grants to Nigeria, and actual expenditure, are detailed in Table 1 below.
Table 1 - Summary of GPE funding to Nigeria as at November 2018 in US$
Grant type Year Allocations Disbursements Grant agent
Program implementation (ESPIG)
2015-2019 100,700,000 74,213,050 International Bank for
Reconstruction and
Development (IBRD)
Sector plan development (ESPDG)
2013 249,900 232,961 IBRD
Program development 2013 480,000 476,992 IBRD
Civil Society Education Fund (CSEF I)
2016 95,943 95,943 Civil Society Coalition on
Education for All (CSACEFA)
CSEF II 2017 114,910 114,910 CSACEFA
Total 100,940,753 75,113,856
Source: GPE19
52. During the evaluation period (2018–2020), GPE’s engagement largely consists of NIPEP and non-financial support to planning, dialogue/monitoring, and financing and engagement on development of the possible successor ESPIG.
53. The size of the education sector in the country, the federal nature of education administration, and the decentralization of education policy in Nigeria present significant challenges for the
18 USAID supported the Nigerian government in drafting the application letter for GPE membership. 19 Retrieved November 12, 2018. www.globalpartnership.org/country/nigeria

NIGERIA FIRST ANNUAL REPORT 21
© UNIVERSALIA
channeling of GPE support to effectively impact educational outcomes. As a consequence, the decision was taken that funds be focused in specific states, based on the following selection criteria: (i) strong government ownership and commitment to the project at national and state levels, as evidenced by the ESP and MTSS; (ii) a focus on states with weak basic education indicators; (iii) willingness on the part of beneficiary states to access and efficiently use UBEC funds to achieve tangible results; and (iv) commitment on the part of the FMoE through UBEC, to sustain and scale up the project activities in participating states following project completion.
54. Drawing on these criteria, the final selection of five states was mutually agreed by the LEG20 – a consortium of federal and state education decision-makers and development partners with a mandate to bring stakeholders together to discuss and make decisions on education programs in Nigeria. Three states were initially identified by the federal government as potential beneficiaries of the grant, but subsequently during the preparation phase a further two states were added. All five states are located in the North West region: Jigawa, Kaduna, Kano, Katsina and Sokoto. Two states of this region do not benefit directly from the grant: Kebbi and Zamfara were excluded largely because they lack an international DP presence to support them in the education sector.
55. NIPEP operationalizes the first ESPIG, with a value of US$100.7 million. The World Bank is the grant agent and USAID is the coordinating agency. NIPEP has three key components:
• Component 1: Promoting School Effectiveness and Improved Learning Outcomes
(estimated total cost: US$42 million). Project activities envisioned under Component 1 include the provision of school grants for student and school materials, and teacher development in primary and pre-primary schools. The objective of this component is to improve the effectiveness of schools, and in so doing, to encourage pupils to enroll and stay in school. These ends will be achieved by promoting school-level resourcing and decision-making, with measures to promote increased accountability. The provision of resources to primary and pre-primary education will focus on interventions that target improved teaching and learning in reading, literacy and numeracy.
• Component 2: Increasing Access to Basic Education for Out-of-School Girls (estimated total cost: US$40 million). The objective of this component is to expand access to basic education for female students, and to promote gender equality.
• Component 3: Strengthening Planning and Management Systems, Including Learning Assessment and Capacity Development (estimated total cost: US$18 million). The objective of this component is to ensure the effective coordination, monitoring and supervision of project activities, and the provision of technical support and capacity building through the provision of funds to support operating costs and short- and long-term consultancy services for state and federal governments. Component 3 provides resources for technical assistance, independent third-party monitoring, operational costs, training, policy research, the delivery of learning assessments and funding for SUBEB-LGEA monitoring activities.
56. As discussed in more detail in Section 2.2.3, funding of basic education comes from multiple sources, making it extremely difficult to track total allocations and expenditure. However, in general in Nigeria, the federal government’s UBE Conditional Grants are the largest source of funds. Table 2 below shows that GPE funding is quite small relative to these grants from the federal government.
20 While a LEG has been functioning as a development partner group for many years in Nigeria, the Minister of Education launched it formally at the time of the GPE country lead’s visit to Nigeria in December 2012.

22 NIGERIA ANNUAL REPORT YEAR ONE
© UNIVERSALIA
Table 2 - GPE financing for components 1 and 221 as a percentage of UBE Conditional Grants by participating state for four years
Participating state UBE funding (US$ million)
GPE funding (US$ million)
GPE funding as a percentage of UBE
funding
Jigawa 211.5 12.9 6 percent
Kaduna 211.5 23.1 11 percent
Kano 211.5 29.7 14 percent
Katsina 211.5 14.1 7 percent
Sokoto 211.5 9.2 4 percent
Total 1,057.5 89.0 8 percent Source: NIPEP PAD (2015) and consolidated AESPR for NIPEP states (2018)
57. The timeline below outlines major events, state ESP periods across the five GPE focus states, key partnership dates and the years of this evaluation.
21 Data not available on the breakdown of spending per state on Component 3: Strengthening Planning and Management Systems including Learning Assessment and Capacity Development – as much of this spending is allocated federally.

NIGERIA FIRST ANNUAL REPORT 23
© UNIVERSALIA
Figure 1 - Timeline of the education sector and national events in Nigeria
Category 2010 2011 2012 2013 2014 2015 2016 2017 2018 2019 2020
Legislation and national policy
National education policy updated
State-level plans
Kaduna Kaduna State ESP (2005–2016)
MTSS 2013–2015 Revised MTSS 2015–2017 MTSS 2018–2020
Kano Kano State ESP (2009–2018)
MTSS 2013–2015 Revised MTSS 2015–2017 MTSS 2018–2020
Jigawa Jigawa State ESP (2013–2022)
MTSS 2013–2015 Revised MTSS 2015–2017 MTSS 2018–2020
Katsina Katsina State ESP (2011–2020)
MTSS 2014–2016
Revised MTSS 2015–2017 MTSS 2018–2020
Sokoto Sokoto State ESP (2011–2020)
MTSS
2014-2016
Revised MTSS 2015–2017 MTSS 2018 - 2020
Plan appraisal Appraisal of ESPs and MTSSs. Shift to focus on three-year plans beginning in 2015
State-level reviews (AESPRs)
Sokoto, Kano
Jigawa, Kaduna, Kano, Katsina, Sokoto
GPE events, grants
Nigeria joins GPE
Program development grant

24 NIGERIA ANNUAL REPORT YEAR ONE
© UNIVERSALIA
ESPDG
ESPIG (2015–2019)
NIPEP (2015–2019)
GPE country missions
First annual mission (Q1)
Second annual mission (Q2)
GPE prospective evaluation reports
First annual report
Second annual report

NIGERIA FIRST ANNUAL REPORT 25
© UNIVERSALIA
1.1.3 Evaluation background 58. In June 2016, GPE’s strategic plan (GPE 2020) aligned its vision and mission to the Sustainable Development Goals (SDGs), and recognized that education is pivotal to the achievement of all other SDGs. It also articulated this vision in actionable goals, as well as both country and global objectives. GPE 2020 adopted a M&E strategy for the 2016–2020 strategic plan period, including a results framework for monitoring progress across three goals and five strategic objectives in ToC, and a set of 37 indicators (fully detailed in Annex C). The strategy comprises independent evaluation studies, including programmatic, thematic, and country-level evaluations, which will lead to an evaluation of the entire GPE portfolio.
Country-level evaluations 59. The country-level evaluations comprise independent prospective and summative analyses. Prospective evaluations focus on eight selected countries to address whether GPE inputs to the education sector during this time are conducive to the intermediary outcomes in the country’s ToC. Summative evaluations assess ex-post the contribution of inputs to intermediate outcomes, outcomes and potential impact in a diverse sample of 22 countries.
60. The prime purpose of this work is to design and implement the prospective country-level evaluations of GPE’s M&E strategy for the period 2018–2020. It aims to: (i) evaluate GPE’s contributions to strengthening education systems and, ultimately, achieving education results within DCPs in the areas of learning, equity, equality and inclusion; and (ii) evaluate the relevance, efficiency and effectiveness of GPE’s ToC and country-level operational model.
Prospective evaluations 61. The purpose of the prospective evaluations is to assess if GPE’s inputs and influence are orienting education sector planning, implementation and monitoring towards the intermediary outcomes as outlined in the ToC. The evaluations are forward-looking, and explore what happens, while it happens. They closely observe initial decisions, document the perspectives of decision-makers and focus on the activities and involvement of key stakeholders early in the period under review in order to understand whether progress is being made and whether GPE is making a contribution.
62. The objective of the prospective evaluations is to assess the relevance, efficiency and effectiveness of GPE’s inputs at the country level, as well as the validity of GPE’s ToC in light of its strategic plan. They seek to establish if and how GPE inputs and activities contribute to outcomes and potential impact at country level. They are designed to assess GPE’s progress on its goals and objectives towards its mission and vision of inclusive and equitable quality education and lifelong learning opportunities for all.
63. In this context, GPE support is defined as both financial inputs deriving from GPE grants and related funding requirements, and non-financial inputs deriving from the work of the Secretariat, the grant agent, the coordinating agency, and from GPE’s global-level engagement (e.g. technical assistance, advocacy, knowledge exchange, quality standards and funding requirements).
1.1.4 Methodology and tools 64. The methodology for the prospective evaluations is a formative, learning focused and theory-based contribution analysis approach. The contribution claims to be tested during the evaluation include the following:
• Claim A: “GPE (financial and non-financial) support and influence contribute to the development of government-owned, credible and evidence-based sector plans focused on equity, efficiency and learning.”

26 NIGERIA ANNUAL REPORT YEAR ONE
© UNIVERSALIA
• Claim B: “GPE (financial and non-financial) support for inclusive sector planning and joint monitoring contribute to mutual accountability for education sector progress.”
• Claim C: “GPE advocacy and funding requirements contribute to more and better financing for education in the country”.
• Claim D: “GPE (financial and non-financial) support and influence contribute to the effective and efficient implementation of sector plans.”
• Claim E: “The implementation of realistic evidence-based sector plans contributes to positive changes at the level of the overall education system.”
• Claim F: “Education system-level improvements result in improved learning outcomes and in improved equity, gender equality and inclusion in education”.
65. The guiding framework is provided in an evaluation matrix, and a generic country-level ToC, developed according to GPE’s existing overall ToC for the GPE 2020 ToC. The evaluation matrix and generic ToC are presented in Annex C. The evaluation will seek to answer three key evaluation questions:
• Key question I: Has GPE support to Nigeria contributed to achieving country-level objectives related to sector planning, sector plan implementation, sector dialogue and monitoring, and more/better financing for education? If so, how?
• Key question II: Has the achievement of country-level objectives contributed to making the overall education system in Nigeria more effective and efficient?
• Key question III: Have changes at the education system level contributed to progress towards impact?
66. The evaluation involves a seven-stage process. The first four stages focus on establishing a solid baseline for each country and the subsequent three stages constitute iterative annual country-level reporting. This is further described in the inception report. Together with a series of summative evaluations these studies will contribute to a final synthesis of findings in 2020. In the application of contribution analysis, prospective evaluations are formative and forward-looking, and assess if inputs and influence in the education sector planning are conducive to intermediary outcomes, as per the ToC. Conversely, summative evaluations trace ex-post the contribution of inputs to intermediate outcomes, outcomes and impact. The country-level ToC (in line with the evaluation matrix and the generic ToC) are the evaluators’ tools and guiding documents.
67. The focus for data collection and analysis is relevant to the key indicators in GPE’s results framework and additional indicators described in the respective countries’ ESPs. The evaluation team has not collected primary quantitative data but instead drawn upon secondary data to base the evaluation findings on a solid quantitative basis. In addition, two rounds of data collection, drawing on key informant interviews, are being conducted in 2018 and 2019. Each of these rounds of interviews will therefore contribute to their respective annual reports.
68. The anticipated risks and related potential limitations that may negatively affect the conduct of the progressive and summative country evaluations, as well as proposed mitigation strategies, are detailed in Annex E.
1.1.5 About this annual report 69. This report frames the country-level evaluation throughout 2018 and summarizes the baseline plus progress thus far, based upon which GPE’s support to the country will be evaluated. It includes a country-specific ToC; a stakeholder mapping; an analysis of GPE alignment, coherence and harmonization at baseline; an analysis of GPE support to planning, dialogue/monitoring, implementation and financing since baseline; and any available information on the current policy cycle’s education sector planning and implementation thus far; the country-specific work planning and

NIGERIA FIRST ANNUAL REPORT 27
© UNIVERSALIA
data collection, and relevant analytical approaches; and a stocktaking of available data for all levels of the ToC, highlighting data gaps that could be addressed in subsequent reporting.
70. This first annual report constitutes the first annual in-country analysis and will contribute to the first synthesis report (January 2019). Second annual country missions and reports are foreseen for the second quarter of 2019, and their corresponding synthesis for the last quarter of 2019.
1.2 Country-specific ToC
1.2.1 Objective 71. The evaluations start with a generic country-level ToC that elaborates on the key changes targeted by GPE, and the main causal explanations, factors and alternative hypotheses that determine them. The generic ToC assumes a scenario whereby a country would benefit from all available types of GPE financial and non-financial support for the complete policy cycle. It is therefore a high-level document to be tailored to each country’s context in the form of a country-level ToC.
72. An important condition in the generic country-level ToC reflects the fact that it is usual for a GPE grant to be allocated to a country on the basis of a national ESP judged by the participating international DPs to be “credible”. The development of a credible ESP is a key link in the causal chain, theorized to lead to system strengthening and stronger learning outcomes and equity in education. In the case of the Federal Republic of Nigeria, while there are national policies and a national framework, there is no national ESP. Federal intervention is in policy and funding, not in the direct provision of education services. Each of the 36 states has constitutional responsibility, along with local governments, for the provision of basic education and development of the supporting ESP.
1.2.2 Development of country-adapted ToC 73. The emerging country-specific ToC for Nigeria is shown on the following page. It will continue to be reviewed and updated during the evaluation. The ToC has been tailored and enriched with the information and data gathered in stages one to four of the evaluation methodology, including the first country mission. These include the following: Stage One: This includes the assessment of data availability and quality, the preliminary input
mapping against the generic ToC, stakeholder mapping and country calendar. Stage Two: Gathering further evidence on the country-specific ToC through in-country missions,
including discussions with relevant stakeholders. Stage Three: Reviewing stakeholders, data availability and evaluation foci across countries, with
a strategic perspective. Stage Four: Assessing the validity of the ToC on the basis of the current state of affairs and the
broader evidence base for each country in the prospective evaluation sample.

28 NIGERIA ANNUAL REPORT YEAR ONE
© UNIVERSALIA
ESPIG funding and requirements (2015-2019: US$ 100 million)
Program development grant funding (2013: US$
States use ESPs to implement and monitor activities focused on: a. school infrastructural development and facilities provision; b. provision of learning and instructional materials; c. training and capacity development of teachers and headteachers; d. advocacy, community mobilization and SBMCs capacity development; e. institutional capacity development for EMISs and planning; and f. quality assurance, performance monitoring and reporting.
Country context: High levels of inequality; serious economic shock 2016–18; federal state; political instability; net ODA received as % of GNI was 0.63% (2016) Education context: Nigeria operates a decentralized system where policies are set at the national level (with input from states) and implemented at the state level. Total educational spend at state level
unknown. Home to the highest number of out-of-school children in the world (10.5 million) Global education context: Focus on education quality access and equity
Direction of change
ESPDG (2013, US$ 250,000) and requirements
GPE technical assistance, standards, capacity building and Secretariat quality assurance
1
Five state-level governments produce and own credible and evidence-based sector plan (MTSSs 2015–2017, 2018–2020) that address: education access, equity and completion; quality and relevance of education; and systems strengthening
Mutual accountability for education sector progress through inclusive sector policy dialogue and monitoring at federal and state levels
S.O. # 2
2.3
S.O. # 1
1.2
1.4
S.O. # 3
2.4
Collaboration with global and country actors and civil society. Capacity building and support to government through the LEG. Bi-annual JSRs. Evidence generation. Third-party technical assistance to government stakeholders
GPE advocates and establishes mechanisms for increased, harmonized, and better aligned international financing for education
2.1 2.2
2.7
Partnership strengthening: GPE fosters clear roles, responsibilities, and accountabilities among stakeholders in policy dialogue and their collaboration in a coordinated, harmonized way to solve sector issues
Knowledge and information exchange: GPE promotes and facilitates cross-national sharing of evidence and good practice
S.O. # 5
1.3
Improved capacity of schools to deliver quality learning outcomes
Improved educational outcomes and equitable access for all learners
EMIS and LAS producing timely data
l l
Increase in availability of schools and facilities
Increased capacity of SBMCs and LGEAs
More and better international financing is mobilized for education (GPE RF Ind. 29, 30)
GPE quality assurance processes, guidelines, capacity building and technical guidance for ESPIG
S.O. # 4
2.5
2.6 4

NIGERIA FIRST ANNUAL REPORT 29
© UNIVERSALIA
LEGEND xxx
Non-financial GPE inputs/support (technical assistance, facilitation, advocacy) xxx
GPE financial inputs/support (grants) and related funding requirements
Country-level objectives that GPE support/influence directly contributes to. Underlined items are issues (at least partly) supported through the ESPIG-funded PRIEDE project
Global-level objectives that GPE support/influence directly contributes to, which have consequences at country level
Global-level objectives with ramifications at country level, that are influenced but not solely driven by GPE’s global and country-level interventions and/or influence
Intermediate outcomes: Education system-level changes
Impact: Changes in learning outcomes, equity, equality and inclusion
Contextual factors
Corresponding Strategic Objective in the GPE 2020 Strategic Plan
Numbers represent the key areas where logical linkages (explanatory mechanisms) connect different elements of the ToC to one another (“because of x, y happens”). Numbers are aligned with the anticipated sequencing of achievements (1. ESP development, 2. ESP implementation, sector monitoring and dialogue, 3. education system-level changes, 4. envisaged impact).
S.O. # 3
1
30 NIGERIA ANNUAL REPORT YEAR ONE
© UNIVERSALIA
1.2.3 Assembling the contribution story 74. GPE claims to contribute in the areas of planning, implementation, financing, dialogue and monitoring, through both financial and non-financial inputs.
75. As outlined in the inception report, there are seven mechanisms by which GPE claims to contribute to impact. The mechanisms, critical underlying assumptions, contribution claims and to assess GPE’s contribution in Nigeria are summarized in Table 3. The Nigeria case study makes use of the framework from the GPE country-level evaluation inception report and tailors the assumptions and indicators to the Nigeria case study.
76. Following the GPE contribution claims, Section 2 assesses GPE contributions to education sector planning and policy implementation, financing and sector monitoring in Nigeria.
1.2.4 Country Specific Limitations 77. The 2015 World Bank Public Expenditure Review (PER) in Nigeria noted that the introduction of the Universal Basic Education act in 2004 had mandated a shift in accountability for basic education service delivery, away from State Ministries of Education (SMoEs) and towards the newly formed Universal Basic Education Commission (UBEC), State Universal Education Boards (SUBEBs) and Local Government Education Authorities (LGEAs)22. While this shift led to more consistent and guaranteed investment in education, and improvement in the reliability of teachers’ salaries, the complexity of the new system and its limited uptake led to confusion over reporting and data collection responsibilities.
78. Partly as the result of this, education performance monitoring data, and education financing data in Nigeria are incomplete and unreliable. For this evaluation the issue is compounded by the need for state level disaggregation of data. For the five states in question, no data was provided to UIS on any of the 12 core indicators, the reporting of which is the standard set for GPE results framework indicator 14. For gender parity of enrollment, significantly different figures have been published by the national statistics bureau and the state ministries of education. No comprehensive learning assessments have taken place in any of the five states as part of this study, and no figures exist for key data points on number and quality of teachers or other system level inputs. For financing data, as so many bodies have a role in the funding of education, it is nearly impossible to determine, any accuracy, the funding gaps that exist within the education sectors, or to look seriously at the amount or quality of financing for education.
79. For this first annual report, the authors attempted to answer the questions set out in the evaluation matrix using what data was available, but the limitations of this approach became clear. Compounded by the fact that none of the states have a sector plan or forum for sector dialogue (equivalent to a Local Education Group) that could be considered credible, there are a range of limitations to analyzing the GPE’s theory of change. While this, first, annual report uses available data to answer the questions in the evaluation matrix, the final annual report will look for additional or alternative data sources to compensate for missing or partial data on key indicators. It will also look directly at the causes and consequences of the lack of data driven planning and accountability across the five states under study.
22 Source: http://documents.worldbank.org/curated/en/123131468195000690/pdf/ACS14245-WP-P153070-Box394836B-PUBLIC-Nigeria-Governance-and-Finance-Analysis-Dec30.pdf

NIGERIA FIRST ANNUAL REPORT 31
© UNIVERSALIA
Table 3 - Explanatory mechanisms, critical underlying assumptions and contribution claims for Nigeria
Explanatory mechanism Critical underlying assumptions (Implicit) contribution claim
BECAUSE (1) GPE provides ESPDGs and guidance, quality assurance, capacity development and technical guidance, and (2) promotes evidence-based and adaptive planning – State-level governments produce and own credible and evidence-based sector plans focused on equity, efficiency and learning.
There is sufficient alignment across partner activities.
Country and state-level partners work inclusively through LEGs.
There is political will at the state level to use evidence and best practice in sector analysis and planning.
GPE has sufficient leverage within the country and at state-level for GPE advocacy and support to be effective.
The process of sector plan development at the state level aligns with the principles and good practices promoted by GPE.
Contribution claim A: GPE (financial and non-financial) support and influence contribute to the development of state-level government-owned, credible and evidence-based sector plans focused on equity, efficiency and learning.
BECAUSE (1) GPE supports and promotes evidence-based and inclusive national and state-level sector monitoring and adaptive planning at global and state and country levels, (2) GPE promotes and facilitates mutual accountability for education sector progress at state level, and (3) GPE promotes and facilitates cross-national sharing of evidence and good practice – there is mutual accountability for sector progress through inclusive sector policy dialog and monitoring at state level.
The context is conducive at national and state levels to effective partnership engagement.
The evidence generated is trusted and accurate.
Civil society groups have the capacity to monitor education service delivery, based on outcomes, at state level.
Parents and communities have the capacity to monitor education service delivery, based on outcomes.
Contribution claim B: GPE (financial and non-financial) support for inclusive sector planning and joint monitoring contribute to mutual accountability for education sector progress at the state level.
BECAUSE (1) GPE advocates for increased, harmonized and better coordinated international financing for education at both federal and state level, and (2) GPE funding requirements include the promotion of improvements in domestic financing for education – more and better financing for education is mobilized in the country and at the state level.
Grants and increased national and state-level financing are sufficient to support required improvements.
GPE has sufficient leverage to influence domestic and international education sector financing.
External (contextual) factors permit national and international actors to increase/improve the quality of education sector financing.
Contribution claim C: GPE advocacy and funding requirements contribute to more and better financing at both the federal and state levels.

32 NIGERIA ANNUAL REPORT YEAR ONE
© UNIVERSALIA
BECAUSE of – (1) GPE funding through program development grants and ESPIGs, and (2) GPE quality assurance, processes, guidelines, capacity building and technical guidance for ESPIG development and implementation, (3) there is mutual accountability for education sector progress at the state level, (4) the individual states have developed credible and evidence-based sector plans, and (5) more and better domestic and international financing for education is available – the states implement and monitor realistic evidence-based state-level sector plans based on equity, efficiency and learning.
The combination of GPE and partner outputs will result in the policy influence and capacity necessary for education management at the federal and state levels to achieve outcomes and impacts.
Outputs are relevant to partners and federal/state governments, and therefore sustain the partnership and achieve impacts.
There is sufficient political at federal and state levels to improve education systems.
Partnership outputs are coherent.
Public sector duty bearers want to achieve education service delivery impact and are willing to change.
There are sufficient financial resources to implement state-level ESPs.
There is sufficient alignment across partner activities at the state level.
State-level governments have the capacity and financial resources to continue to implement their ESPs.
Contribution claim D: GPE (financial and non-financial) support and influence contribute to the effective and efficient implementation of sector plans.
BECAUSE (1) the states implement and monitor realistic, evidence-based ESPs based on equity, efficiency and learning – the education systems in the individual states become more effective and efficient in delivering equitable quality educational services for all.
There is sufficient political will to improve education systems at the state level.
The required partner inputs are sufficient for GPE inputs to be effective at the state level.
There is sufficient alignment across partner activities at the state level.
Inputs are sufficient, in combination, to allow partnerships to occur at the state level.
Grants and increased federal- and state-level financing are sufficient to support the improvements required.
Contribution claim E: The development, implementation and monitoring of realistic evidence-based sector plans contributes to positive changes at the level of the overall education system in each state.
BECAUSE (1) sector plan implementation in each state includes provisions for strengthened EMISs and LASs, and (2) because GPE promotes and facilitates sharing of evidence and mutual accountability for education sector progress
The generated evidence is trusted and accurate.
There are clearly delineated roles and responsibilities in relation to producing data, reporting against data and using data to monitor implementation between and within the federal and individual state governments.

NIGERIA FIRST ANNUAL REPORT 33
© UNIVERSALIA
– the individual states produce and share disaggregated data on equity, efficiency and learning. BECAUSE of improvements at the level of the overall education systems in each state, there are improved learning outcomes and improved equity, equality and inclusion in education.
Systemic issues within the education sectors in each state keep children out of school, reduce quality and increase inequality.
Contribution claim F: Education system-level improvements in each state result in improved learning outcomes and in improved equity, gender equality and inclusion in education.

34 NIGERIA ANNUAL REPORT YEAR ONE
© UNIVERSALIA
2 Assessment of GPE contributions to education sector planning and policy implementation, financing and sector dialog/ monitoring in Nigeria
81. This section summarizes the progress since baseline and assesses the likelihood of GPE contributing in the areas of planning, implementation, financing and sector dialog and monitoring.
2.1 Situation analysis at Year 1
2.1.1 Education sector planning Assessment of sector planning
82. Nigeria, as a federal state, has no national ESP. Instead, ESP development is done at the state level, with support from the federal government. NIPEP is the project through which the ESPIG is being delivered in the five states.
83. In all five of the states covered by GPE funding, 10-year ESPs23 were already in place when Nigeria joined GPE in 2012. These plans had been developed with support from development partners working in the individual states, principally the Education Sector Support Program in Nigeria (ESSPIN, funded by DFID), the Northern Education Initiative (NEI, and its follow-on activity, NEI Plus, funded by USAID), and the Girls’ Education Project (funded by DFID and implemented by UNICEF). In theory, operationalization of the 10-year plans was supposed to be through rolling three-year operational plans. However, there were no available assessments of the quality of either the 10-year strategic or three-year operational plans at the time of joining. Subsequent experience and interviews with key informants within the development partners has shown that the broader population of donors within the education sector have struggled to use state-level education plans as a tool for planning and mutual accountability with state-level actors. In 2013 GPE provided an ESPDG to fund the appraisal of the ESPs already in place. Table 4 gives an overview of the initial appraisal of the 10-year ESPs24.
Table 4 - Initial (2013) assessment of state education sector plans25
Very satisfactory Satisfactory Room for improvement
Education plan preparation process
JG, KD, KN, KT26 SK
23 Kaduna 2005–2016, Kano 2009–2018, Jigawa 2013–2022, Katsina 2011–2020, Sokoto 2011–2020. 24 Federal Republic of Nigeria: Appraisal of Education Sector Plans of Five States of the North West Region of July 2013. Report prepared for the Global Partnership for Education and Nigeria Development Partner Group. July 10, 2013. 25 The same analysis was done as part of the reappraisal but only one aspect was appraised – “development and financing of an action plan”, on which all five states were marked “satisfactory”.
26 JG = Jigawa, KN = Kano, KD = Kaduna, SK = Sokoto, KT = Katsina.

NIGERIA FIRST ANNUAL REPORT 35
© UNIVERSALIA
Very satisfactory Satisfactory Room for improvement
Education plan development process
Stakeholders’ engagement
JG, KD KN, KT, SK
Education plan Education sector analysis JG, KT KD, KN, SK
Plan design
Policy priorities
JG, KN, KD, KT, SK
Program design and prioritization of strategies
JG, KN, KD, KT, SK
Plan financing JG, KN, KD, KT, SK
M&E JG, KN, KD, KT, SK
Development and financing of an action plan
JG, KN, KD, KT, SK
Appraisal of implementation readiness
System capacity JG, KN, KD, KT, SK
Governance and accountability
JG, KN, KD, KT, SK
Risks to implementation and mitigation
JG, KN, KD, KT, SK
Source: 2013 GPE appraisal document
84. The results of this appraisal showed the state-level plans were inadequate. The two central criticisms of the original plans were the lack of credible baseline data, targets and performance indicators, as well as serious issues with tracking expenditure. After consideration, the GPE requested the Nigerian federal government resubmit the grant application in 2014, after revising some of the state-level documents. It was agreed that improvements should be made in the three-year plans, and only these would be re-appraised. Strengthening what became the three-year operational plans for 2015–2017 in each state, which was carried out by small working groups within the state education offices, was then supported with resources from the ESPDG.
85. The August 2014 re-appraisal27 of the five state-level three-year operational plans found that while the documents were better organized and less cluttered than the previous versions, many of the weaknesses identified in the original appraisal remained. The authors suggested that insufficient time had been allowed for thorough revision and editing of the plans, meaning improvements could not be made in providing indicators and expenditure tracking strategies. Nevertheless, the overall recommendation was that, despite the weaknesses remaining, the states should be “given the benefit
27 Addendum to the August 2013 Appraisal of Education Sector Plans of Five States of the North West Region of July 2013. Report prepared for the Global Partnership for Education and Nigeria Development Partner Group. August 2014.

36 NIGERIA ANNUAL REPORT YEAR ONE
© UNIVERSALIA
of the doubt” and the plans should be judged as satisfactory by the Nigerian Development Partners Group who carried out the appraisal.
86. At the time of this evaluation two of the original ten-year plans were no longer in operation (Kaduna 2005–2016 and Kano 2009–2018) and the others had been superseded in use by the operational plans for 2015–2017 and 2018–2020. This means that, effectively, the operational strategies had become the central planning documents, rather than a supplement to the ESPs. This means that for this evaluation, emphasis will be put on these operational plans rather than the original 10-year ESPs.
87. The initial ESPs were also appraised against the GPE results framework criteria – in which two, Jigawa and Kaduna were deemed to have met the requisite number of standards (at least five) out of the seven quality standards while the others met four or less standards (Katsina met four standards, while Sokoto and Kano met three standards, each). The standards most prevalently met across all five plans were “evidence based” and “attentive to disparities” (met by all five plans). The standard least met was “achievable,” which met by none of the five plans.
88. While there is significant variance in language between the 2015–2017 state-level three-year operational plans (Medium-Term Sector Strategies, MTSSs), there is a common set of priorities for the period. For consistency of presentation, four overarching themes from the five ESPs have been extracted. Table 5 covers the individual aims from the five ESPs as they map onto common priority objectives distilled by this evaluation. It is clear from this table that the presentation of goals varies widely across the MTSSs, with some outlining specific outcome targets, while others only give vague policy directions.
Table 5 - ESP priorities in the five GPE states, grouped by overarching theme
State
Overarching MTSS themes
I) Improve the quality and relevance of
basic, secondary and tertiary education
II) Expand basic education coverage,
especially for disadvantaged groups
III) Provide appropriate non-formal learning opportunities, particularly for
illiterate and hard-to-reach children and
youth
IV) Strengthen government’s
capacity to manage, plan, and monitor the delivery of education
services more effectively and
efficiently
Jigawa Provide 80 percent of basic schools with teaching and learning materials
30 percent of JSS with libraries, laboratories, ICT labs and technical equipment
Reduce parent–teacher ratio from 93:1 to 54:1, and from 45:1 to 30:1 for primary and JSS
Increase GER from 65 percent to 70 percent at primary and 73 percent to 80 percent at JSS Increase gender parity at primary and JSS from .43 to .50
Increase number of IQTE schools from 25 to 175
Promote dissemination of information to the public (e.g. EMIS) by raising proportion of ICT-trained staff from 50 percent to 65 percent
Produce comprehensive policy review in support of gender IQTE, ICT and private entrepreneurship education
Kaduna Improve student learning outcomes
Recruit new teachers
Increase enrollment at primary, pre-
Improve budget implementation for MTSS priorities

NIGERIA FIRST ANNUAL REPORT 37
© UNIVERSALIA
State
Overarching MTSS themes
I) Improve the quality and relevance of
basic, secondary and tertiary education
II) Expand basic education coverage,
especially for disadvantaged groups
III) Provide appropriate non-formal learning opportunities, particularly for
illiterate and hard-to-reach children and
youth
IV) Strengthen government’s
capacity to manage, plan, and monitor the delivery of education
services more effectively and
efficiently
Train teachers in literacy, numeracy and leadership
Provide textbooks at a 1:1 ratio
primary, secondary and tertiary levels
Increase opportunities for students with special educational needs (SEN)
Improve GPI
Improve function of LGEAs and education MDAs
Ensure timely availability of data for planning
Kano 85 percent increase in proportion of primary pupils acquiring expected RWA skills
Reduce number of out of school children by 50 percent
Increase primary enrollment by ~50 percent
Increase GER at junior secondary from 42 percent to 55 percent
Increase in number of IQTE schools
Adult literacy rate reaches 85 percent
Develop realistic MTSS and annual action plans (including development of EMIS)
Promote teacher/admin capacity building (build libraries)
Katsina Improve physical infrastructure
Recruit new teachers, provide textbooks and materials
Increase enrollment through community enrollment campaigns
Promote equity in enrollment through cash transfers
Build new facilities for students with SEN
Improve accounting capacity
Improve school-level inspections
Improve EMIS capacity
Sokoto “To improve quality learning outcomes through enhanced teacher training opportunities”
“To ensure that appropriate practices are adapted to meet the needs of all children of school age”
“provide equitable access and quality basic education for all children of school age”
“Increase and support the inclusion of OOS children, those with special needs and from disadvantaged socio-economic backgrounds”
“Enhance financial and material support to relevant sectors in charge of basic education service delivery”
“Establish efficient management and standards of operation for quality service delivery to basic education”

38 NIGERIA ANNUAL REPORT YEAR ONE
© UNIVERSALIA
State
Overarching MTSS themes
I) Improve the quality and relevance of
basic, secondary and tertiary education
II) Expand basic education coverage,
especially for disadvantaged groups
III) Provide appropriate non-formal learning opportunities, particularly for
illiterate and hard-to-reach children and
youth
IV) Strengthen government’s
capacity to manage, plan, and monitor the delivery of education
services more effectively and
efficiently
“Improve the efficacy of the policy, planning and management framework for effective education service delivery system”
Source: State MTSS documents (direct quotations shown in quotation marks)
89. The 2015–2017 state-level three-year operational plans have subsequently been revised to cover the current 2018–2020 period. Key informants confirmed that the suggestions around developing monitoring and expenditure tracking strategies made in the re-appraisal of the state-level MTSSs were not acted upon. State-level LEGs were not created, whilst the federal-level LEG ceased to be active once implementation of NIPEP started. As part of the ESPDG in 2013, a GPE-led task force was set up in each state to assist with planning. It was recommended at the end of the funding period that these task forces be continued to help coordinate planning on an ongoing basis (focused on developing sector analysis capacity, and preparing for subsequent revisions of the three-year MTSSs). This recommendation was not revisited by NIPEP and funding was not made available to build state planning capacity, although it is listed as a part of NIPEP Component 3 (funding focused on the improvement of data availability, which has an indirect benefit to planning).
90. The 2018–2020 state-level MTSSs have not been appraised and there is no evidence of these state-level plans being used as a tool for mutual accountability between actors at the state and federal levels (including the development partners). This needs to be seen in a context where the conclusion of the first AESPR28 across all five states (completed early 2018) was that “Greater attention and priority should be given to strengthening the alignment and linkages of education sector plans, budgeting and funding provision. The existing longterm and medium-term education sector strategic plans of the states require comprehensive reviews and updating to reflect and address current realities. The review and update should be inclusive and participatory. All major stakeholders including government MDAs, LGEAs, communities, the civil society and development partners should be appropriately involved for collective ownership.”
GPE contribution to sector planning 91. GPE support through the ESPDG for the strengthening of the 2015–2017 state-level MTSSs has been discussed above. The ESPDG was used to fund technical assistance and logistical support to the federal-level LEG to support appraisal and then re-appraisal of the state-level plans, and also to the states to strengthen their three-year plans. Assistance was provided to states through a constituted GPE task force. This task force was led by GPE and comprised members of the international DPs operating at state level, as well as representatives from the SMoEs. However, the authors of the re-appraisal of these state-level plans suggested, as stated above, that this support showed limited
28 FMoE (2018) 2016 Annual Education Sector Performance Review – Consolidated Report for Jigawa, Kaduna, Kano, Katsina and Sokoto State. February 2018.

NIGERIA FIRST ANNUAL REPORT 39
© UNIVERSALIA
effectiveness in improving the issues around monitoring and expenditure tracking. They suggested that if further financial support could be provided by GPE, the standards set by GPE would bring additional pressure to bear on state-level officials to improve planning processes and planning documents. The need for a LEG in each state was also highlighted, in addition to the need for the national-level, Abuja-based LEG, to hold the representatives of the state-level governments to an agreed schedule for the provision of information and data that could be used in the revision of the sector plans. Review of documentation and interviews with key stakeholders indicate that none of these suggestions were operationalized.
92. On the other hand, provision for building the planning capacity of state- and federal-level actors was included in the vision of NIPEP. The most relevant such support was to the aforementioned 2016 AESPR process, which was carried out in all five states. This support allows for the publishing of annual performance reports which at least provide the basis for more evidence-informed planning. The reports do not, however, provide a forum for meaningful dialog around planning and the use of evidence. This work built on the AESPR process already introduced in 2010 in Jigawa, Kaduna and Kano through the DFID ESSPIN. Unfortunately, evidence on the degree to which the NIPEP-funded support has further strengthened planning in Jigawa, Kaduna and Kano, or triggered routinization of such reviews in Sokoto and Katsina states, is currently lacking.
93. In addition, according to both DP and Nigerian stakeholders, GPE has played a role in quality assurance, encouraging DPs and SMoEs to re-work and improve their ESPs in order to maintain the GPE relationship. However, Nigerian key informants thought that the modest size of GPE funding, relative to total education spending at state level, meant that GPE was not able to provide a strong incentive for either the federal- or state-level partners to focus on ESP development and use.
2.1.2 Mutual accountability through sector dialog and monitoring Assessment of sector dialogue 94. The assumption is that the ESP is the framework within which national stakeholders and DPs can have sector dialogue, drawing on evidence of sector performance. In Nigeria, sector plans are at the state level, but much of the funding is transferred from the federal level and policy is also set at this level. This means that sector dialogue needs to happen at both federal and state levels.
95. We have found little evidence of sector dialogue happening as a matter of routine at the state level. In interviews, DP stakeholders describe a situation in which DPs work on their own projects in their own states, with weak links to the state-level education plans.
96. The lack of sector dialogue also extends to dialogue between the key Nigerian stakeholders. The most significant source of funding for basic education is the federal UBE Intervention Fund (UBE-IF) but UBE program interventions in support of increasing access to basic education are overwhelmingly supply-driven—largely providing school infrastructure and furniture. This is even the case when the UBE program is aiming to increase enrollment of specific out-of-school population groups, such as almajiri students or girls. Fifty percent of the UBE-IF is so-called direct interventions, where UBEC administers the funds and interventions that are carried out at the state level, and the great majority of funds are allocated equally across states. The other 50 percent of the UBE-IF is used for infrastructure matching grants, again allocated equally across states, but where different states have accessed the matching grant to different degrees because of the counterpart funding requirement and likely other state-specific considerations. These funds are disbursed to SUBEBs (or directly to LGEAs), and are not targeted at interventions included in the state ESPs, as the ESPs are developed by the SMoEs. This is symptomatic of the difficulties in communication caused by the concurrent system in Nigeria, in which multiple state actors fund capital interventions, without any meaningful forum for dialogue and mutual accountability between actors. Combined with a lack of state-level monitoring data on the impact of the UBE-IF matching grant, the result is that key federal and state actors are not

40 NIGERIA ANNUAL REPORT YEAR ONE
© UNIVERSALIA
held accountable for results and have little incentive to coordinate efforts and interventions, and the state-level ESPs are not seen as the tool for dialogue between the federal and state levels.
97. This picture of poor communication and dialogue, and the deficiencies in the role of the state- level ESPs, is also identified in the 2018 synthesis of the five states’ 2017 AESPRs, which concludes by highlighting that “The annual plans of education MDAs and LGEAs, UBE-IF action plans and the implementation plans of development programmes should be harmonised, integrated and informed by the long and medium-term strategic plans of the states. Strategies and enabling platforms should evolve to facilitate coordinated planning, budgeting and performance monitoring and reporting. This is essential for synergy and enhanced sector performance to achieve articulated educational development goals, objectives and targets.”
98. Before Nigeria joined GPE in 2012, there was no LEG at the federal level. In 2013 and 2014, in the context of Nigeria having joined the partnership, there was discussion as to whether individual LEGs should be convened at the state level, or whether there should be one LEG at the level of the federal government. It was decided to have one LEG, at federal level. Key informants stated that this LEG was active in 2013–2014 but documentation setting out what was discussed in these meetings is lacking. However, one DP key informant present at the time commented on the fact that entry of the GPE re-ignited discussion between the DPs of the need to more explicitly use state-level ESPs as the means of fostering mutual accountability.
99. In the ESPIG application the LEG is referred to as the IDPG, and minutes from a meeting between the LEG and the NIPEP steering committee show that it comprised representatives of international DPs, UBEC, FMoE and CSACEFA. No official list of members of the original LEG was available to the evaluation team. More recent meetings of the re-formed LEG included representatives of major international DPs (World Bank, DFID, USAID, UNICEF, Japan International Cooperation Agency, African Development Bank) and federal bodies (FMoE and UBEC). The assessment of GPE Results Framework (RF) indicator 19 shows that in 2016 no true LEG existed but that civil society was represented in the NIPEP steering committee through CSACEFA. In 2017 the assessment shows representation of teachers organizations and civil society, but does not give details regarding the actuality of this representation. There is no evidence of this participation in the LEG minutes made available to this evaluation.
100. During the grant application process, CSACEFA29 engaged with the SMEs of the five selected GPE states in the development of the ESPs, as well as the NIPEP Appraisal Report, Quality Appraisal Report and PAD and endorsed the grant application package submitted to GPE30. However, beyond representation on the NIPEP National Project Steering Committee, CSACEFA does not have any formalized monitoring role within the NIPEP Federal Project Support Unit (FPSU) and has only been formally invited to serve as an independent monitor in Sokoto State.
101. This LEG then effectively ceased to operate in 2015, despite the fact that the World Bank PAD for NIPEP pointed out that the complexity of operating at state level requires significant coordination and that the LEG would meet every two months to provide a platform for communication between stakeholders and to act as a forum for development and coordination solutions. However, the federal-level LEG has now been revived as part of the process of developing the next ESPIG that is planned for 2019. As at October 2018, the LEG was meeting, seeking to establish itself as a multi-stakeholder forum for discussing policy priorities. Although membership appears to be broadly similar to the previous LEG, it is hard to speak to the continuity between the two groups due to a lack of documentation and the lack of a clear agenda for meetings.
29 A membership-based nongovernmental organization in the education sector, with representation in all states, and representing 600-member organizations across Nigeria. 30 USAID, and other international DPs (2014) C-Nigeria Endorsement Letters (Rep.).

NIGERIA FIRST ANNUAL REPORT 41
© UNIVERSALIA
Assessment of sector monitoring 102. The GPE-funded appraisal and re-appraisal of the state ESPs/MTSSs highlighted a lack of realistic monitoring strategies at the state level. The documents point out that plan prioritization was poor across all five states’ plans, while monitoring focused at the input and activity levels, neglecting outputs and outcomes, and hence leading to the availability of few meaningful targets to monitor progress towards higher-level change.
103. The key monitoring documents currently being produced are the AESPRs, which were produced in all five states in 2017 (per latest data available to the evaluation). These reports are developed by a third-party contractor. While there is consultation with a broad range of stakeholders, it is not possible to say to what extent the process of developing the AESPRs is promoting mutual accountability beyond providing data on the education sector. Regardless, the production of these reports is a meaningful step towards more systematic monitoring of the education sector. The limitation of the AESPRs is in that the data reported on are mostly related to attendance, enrollment and expenditure, with a lack of data on learning outcomes. The lack of embedding monitoring strategies in the MTSSs also means that these data do not allow for meaningful monitoring of the performance of the MTSSs.
104. None of the five states have currently developed standardized tests for their education sectors. One state (Katsina) carried out an early grade reading assessment (EGRA) in 2016, but this was a one-off assessment of a small random sample of primary students, rather than a comprehensive assessment exercise. This means that while data are available for enrollment and attendance through the AESPRs, there are no comprehensive state-level data on student retention, completion, or learning. This is evidenced in sector plans that focus heavily on student enrollment and the construction and upkeep of school facilities, rather than addressing learning issues.
105. This challenge is also replicated in the monitoring of UBEC funding, where responsibility lies with UBEC and the SUBEBs. Interviews with key informants and documents31 reviewed indicate that: (a) information on key outputs and outcomes to monitor and evaluate are not available: UBEC only records states’ planned outputs (projects) in the form of annual action plans, it has no records of actual state-level outputs; and (b) UBEC has no clear set of agreed output and outcome indicators. The MTSSs, which are produced by the SMoEs, do not make it clear whether they are addressing all capital expenditure in the state, or whether UBEC actions are effectively being operated off budget. More investigation is needed to ascertain the details of how UBEC actions are being monitored through the MTSSs by the SMoEs.
106. The FMoE’s (2018) 2016 Annual Education Sector Performance Review – Consolidated Report for Jigawa, Kaduna, Kano, Katsina and Sokoto states suggests that the problems identified in the GPE ESP appraisal and re-appraisal remain essentially the same. Key conclusions in the report include the following:
• “Government leadership of education sector performance monitoring and reporting through comprehensive and credible AESPRs needs to be strengthened and instilled. Only the availability of well-trained, competent and adequately supported state staff can guarantee effective government leadership necessary to ensure that AESPRs serve the intended purposes. More support from government and development partners is required in sustained systemic training and capacity development of relevant state staff for credible AESPRs and quality reports for use by all stakeholders.
31 For example: World Bank (2017) Better Education Service Delivery For All Operation – Program Appraisal Document. Report No: 115391-NG. May 30, 2017. http://documents.worldbank.org/curated/en/839251498183393835/pdf/BESDA-PAD-May-30-2017-06012017.pdf

42 NIGERIA ANNUAL REPORT YEAR ONE
© UNIVERSALIA
• The quality of AESPRs to a large extent depend on the availability and quality of data and evidence to inform assessment and judgement. The Education Management Information System (EMIS) is the principal source of basic and secondary education data in Nigeria. Data to populate and regularly update state EMISs are sourced almost entirely from ASCs as other possible sources are weak and unreliable. Serious efforts should be made to bring the EMISs of the 5 GPE-NIPEP states to attain the required credibility and functionality. Functional EMIS entails regular and timely conduct of credible ASCs, prompt production and dissemination of good quality user-friendly reports. It ensures availability of timely, credible and adequate education data. Poor quality data and data unavailability render AESPRs mere routines and of no value in truly assessing education sector performance and system efficiency.”
GPE contribution to sector dialogue and monitoring
Contribution to sector monitoring 107. Three of the five states (Kano, Katsina and Kaduna) held AESPRs in 2015 and 2016. In 2017, AESPRs were conducted in the five NIPEP states, with a summary of the five reports being made publicly available. The 2017 exercise was financially supported through component 3(b) of NIPEP through technical assistance from Cambridge Education. For Katsina and Sokoto states, this exercise was the first introduction to systemic education sector reviews, whereas it built on existing practices in Jigawa, Kaduna and Kano. While it is reported that Cambridge Education engaged a wide range of stakeholders in conducting the research for the AESPRs, it is not clear how much focus was put on building capacity within states to continue annuals reviews without NIPEP funding – raising questions regarding sustainability and continuity. The final country mission for this evaluation will look in more detail at how embedded the AESPRs have become in state governments, and how GPE has contributed to sustainable monitoring practices.
108. Otherwise, the main contribution of GPE was to take place under component 3(b) of NIPEP. Leaving aside activities under this component intended to support M&E of the project’s impact, activities intended to support sector-level monitoring included:
a) EGRA activities to establish a standardized system of student learning measurement in Hausa and English, and to support the development of teachers’ skills to improve the quality of teaching;
b) financing the provision of training and goods to strengthen the government’s EMIS and data analysis capacity;
c) development of a national strategy for the integration, scaling up and enhanced implementation of activities to mainstream integrated Islamiyah schools and pre-primary education into the public education system (K-12) and an associated policy strategy dialogue within states; and
d) support to strengthen the national LAS to enable the validation of findings, improve data management and ensure consistent and comparable data for student learning achievement.
109. The NIPEP mid-term review32 shows that other than support for the AESPRs, little progress has been made under this component. More recent ISRs note that progress is being made in strengthening EMIS data collection at the LGEA level, led by UNICEF, aiming to provide timely data for the ASC. An external consultancy has been contracted to conduct the EGRA, with a draft results report expected in June 2019.33 A number of impact evaluations of NIPEP activities have been commissioned as part
32 Sages Consult (2017) Mid Term Review of NIPEP Activities. Final Report. November 10, 2017 33 Data from the latest ISR available at: http://documents.worldbank.org/curated/en/845131546900485821/pdf/Disclosable-Version-of-the-ISR-Nigeria-Partnership-for-Education-Project-P143842-Sequence-No-07.pdf

NIGERIA FIRST ANNUAL REPORT 43
© UNIVERSALIA
of the M&E strategy. There is a danger that by using external consultants to improve M&E systems, focus is diverted from building M&E capacities at state level (especially in SUBEBs, which have primary responsibility for basic education, and are not targeted by any NIPEP funding). The effects of NIPEP interventions on building in-house monitoring capacity, and the sustainability of NIPEP monitoring interventions, will be a focus for the final prospective evaluation in 2019.
Contribution to sector dialogue 110. While GPE support was instrumental in the formation of the federal LEG in 2015, this support has not extended to maintaining membership or focus of the federal LEG. There appears to be a pattern in which a LEG comes together around the application period for an ESPIG, but has no support or incentive from GPE to continue operating once funding has been approved. GPE provided no support beyond the technical support in the 2013 ESPDG for the creation of a LEG or planning task force at state level, and so has had little direct influence on promoting mutual accountability at state level.
111. NIPEP is governed by the National Project Steering Committee, which meets on NIPEP priorities. The committee includes participation from the FMoE, UBEC, CSACEFA, the World Bank and the three international DPs which provide support to the NIPEP states (DFID, USAID and UNICEF). When regular meetings were taking place, states’ interests were represented by international DPs, with no participation from state government officials. This format does not necessarily promote state-level sector dialogue, as it does not discuss the implementation or priorities of the state-level ESPs, but rather NIPEP’s activities at state level. After the grant application process, the National Project Steering Committee has met less frequently than it did before.34 A subset of key informants at both federal and state levels are of the opinion that the effectiveness of the steering committees at both the national and state levels is impeded by the absence of high-level ministry officials, who are unable to attend these meetings frequently, and attendance of designated subordinates who may not have enough power to make commitments and decisions at these meetings.
112. Civil society is represented in the NIPEP National Project Steering Committee through the participation of CSACEFA. CSACEFA representation at the national level is not seen as being representative of the voice of local civil society partners within the states. The reason for this may be attributed to the institutional challenges of CSACEFA within the states. In Kaduna State, 11 civil society organizations (CSOs), under the aegis of the Coalition of Education, reportedly reached out to the NIPEP State Project Technical Committee, before they were formally invited to collaborate with the program in the beneficiary selection and community sensitization processes involved in implementing a component of the program. While this is not unusual, it is not clear what efforts are being made by the NIPEP National Project Steering Committee to encourage the participation of civil society at the state level. In the other four NIPEP states, there appears to be no meaningful engagement with CSOs. From the meeting minutes available, there appears to be no engagement with teachers organizations.
34 The evaluators received minutes of meetings the FPSU held with DPs on July 12, 2016, and January 31 and April 10, 2017.

44 NIGERIA ANNUAL REPORT YEAR ONE
© UNIVERSALIA
2.1.3 Education sector financing
Assessment of sector financing Public expenditure on education
113. In northern states, a significant number of students attend un-registered Qur’anic schools (Tsangaya or Almajiri schools). Increasingly, these schools are being integrated with the state curriculum, becoming Islamiyya schools. These receive funding from UBEC in the same way that state schools do, but funding is supplemented by contributions from parent–teacher associations and community leaders. The extent of these contributions is not recorded. Qur’anic schools are entirely privately funded and un-registered, and therefore receive no public funding or supplies through UBEC. Census data are not available for all states but in 2014 in Kano and Kaduna states, Islamiyya schools accounted for 52 percent and 65 percent respectively – highlighting the wide variance in the prevalence of integrated Islamiyya schools.
114. Privately funded schools form an increasingly important sector in Nigeria35. Private primary schools account for 13 percent and 26 percent of schools in Kano and Kaduna states36. The funding
35 Privately funded schools include all schools that cover an academic curriculum but receive no government funding, therefore it excludes qur’anic schools. 36 No data on other states. Source: NIPEP PAD (2015) http://documents.worldbank.org/curated/en/506841476077511270/pdf/PAD634-PAD-P143842-Box396300B-PUBLIC-ACS.pdf
Summary
• Public funding for education comes from four main sources: (a) federal statutory allocations to federal, states and local governments; (b) state and local governments’ internally generated funds; (c) UBEC and other federal earmarked transfers for education; and (d) DPs’ funds.
• The lack of standardized budget information across these sources means that it is practically impossible to assess the effectiveness of financial resources allocation and actual expenditure in basic education. This in turn makes it impossible to speak clearly about funding gaps in education.
• Federal statutory allocations are by far the largest source of funding, underscoring the vulnerability of states and local governments to federally redistributed revenues.
• GPE ESPIG funding is probably less that 4 percent of basic education funding in any of the five states, and so is seen as modest. Overall in Nigeria, 7 percent of ODA is allocated to education, with the World bank, United States, United Kingdom, European Union, Global Fund and Gavi being the major donors. Detailed information on donor spending on education at state level is not available, and much spending is non-aligned and off budget. In comparison, GPE funding is rated as aligned according to results framework data.
• Donors report that, initially, state government officials had a poor understanding of the mechanisms of the GPE grant and thought that NIPEP was a World Bank loan. Nonetheless, at the state level, government stakeholders believe that the GPE funding is very useful, albeit inadequate in addressing the states’ education sector developmental needs.
• With regard to the available choices regarding what to fund under the ESPIG, there are limited opportunities to deliver against the GPE aim to use its grants to leverage more accountability and better financing at government level.
• While there were some positive reports from interviewed stakeholders, there is no concrete evidence of additionality in funding coming from the presence of GPE resources.

NIGERIA FIRST ANNUAL REPORT 45
© UNIVERSALIA
for these schools comes entirely from the fees paid by parents, but schools must be registered with LGEAs. This means that while private schools are counted in reporting on enrollment and completion, there is no record kept of the amount of money received and spent. Considering the proportion of private schools, this has a significant effect on the validity of any government reporting on the true cost of education, and the funding gaps that exist within the five NIPEP states.
115. Public funding for education comes from four main sources: (a) federal statutory allocations to federal, state and local governments; (b) state and local governments’ internally generated funds; (c) UBEC and other federally earmarked transfers for education; and (d) DPs’ funds.
116. Unfortunately, there are challenges in assessing total public expenditure on education across these four sources. These challenges are succinctly summarized in a recent World Bank PAD for its latest education sector loan.37 There is no verified consolidated information on public expenditure allocated to and effectively spent on basic education in Nigeria, which prevents an informed evaluation of financial resource mobilization. Consolidated budget information would require the harmonization of charts of accounts used across the three levels of government, and their various schemes and programs, the functional reclassification of budget expenditure, and systematic and audited reporting on budget execution. The lack of such standardized budget information means that it is practically impossible to assess the amount and effectiveness of financial resources allocation in basic education.
117. To add to this, the UBE act has not been universally adopted. According to the legislation, all basic education funding is to come through LGEAs, funded by UBEC (and administered by SUBEBs). This implied a transition from JSS teachers being paid by SMoEs (through LGAs), to them being paid by LGEAs, while SSS teachers were to continue being funded by SMoEs. In practice is many of these schools contained both JSS and SSS students and teachers, the adoption of this has been patchy, with many states and LGEAs adopting hybrid approaches to paying teachers. This means that a potentially large amount of SMoE funding is fungible, and the balance of funding between recurrent and capital expenditure being difficult to analyze, as the final allocation of funding is being done off budget, and against legislative norms. State budget data is not available for every state, and covers only state contributions (i.e. excluding SUBEBs, UBEC-IF and TETfund), while the standard budget line analysis carried out by GPE to assess total education spending (for results framework indicator 10) was not carried out, due to difficulty in obtaining data. Finally, there is a certain amount of community funding for education, raised through SBMCs, which is not recorded, and specific funding for areas like examinations, teacher education, and curriculum development which is funded through parastatals, overseen by SMoEs, but not recorded in their budgets38.
118. Subject to this limitation on knowledge of the overall expenditure, it is clear that the federal statutory allocations are by far the largest source of funding, underscoring the vulnerability of states and local governments to federally redistributed revenues. However, even budget execution under the UBE program is opaque because of a lack of adequate auditing of financial statements. The execution of the budget line earmarked in the federal budget for the financing of the UBE program is not adequately captured by the audit report on budget execution: it is categorized as a statutory transfer and its disbursement is deemed completed when the funds are released to UBEC. UBEC’s own financial statements are supposed to be audited each year by a private auditor, under the supervision of the Auditor-General of the Federation, but no such financial audit has been conducted for several
37 http://documents.worldbank.org/curated/en/839251498183393835/pdf/BESDA-PAD-May-30-2017-06012017.pdf 38 All of the limitations of assessing education financing are detailed in the World Bank Public Expenditure Review. Source: http://documents.worldbank.org/curated/en/123131468195000690/Governance-and-finance-analysis-of-the-basic-education-sector-in-Nigeria

46 NIGERIA ANNUAL REPORT YEAR ONE
© UNIVERSALIA
years. In principle, the jurisdiction of the Auditor-General of the Federation extends to the use of the matching grant by the states, but there is no evidence that it has conducted such financial audits.
119. Apart from the UBE scheme, the federal government also provides direct funding and support to the sector through the Education Trust Fund39, and other Social Investment Programs (SIPs), such as the Home-Grown School Feeding Program and a Conditional Grant Scheme, a counterpart contributory mechanism which incentivizes sub-national governments to mobilize resources to accelerate progress in SDGs core areas.40
120. The 2016 Annual Education Sector Performance Review – Consolidated Report for Jigawa, Kaduna, Kano, Katsina and Sokoto states does provide information on state-level allocations and releases for financial years 2015 and 2016 for the five states supported under the ESPIG. Key findings reported included: (a) a decline in education budget release rates in 2016 (see Figure 2) (b) poor budget performance, with significant gaps between state budget allocations and actual releases, as well as delays in fund releases; and (c) inefficient expenditure tracking, reporting and documentation.
121. In 2016, the average share of education sector budget to total state budget for the five NIPEP states was 28 percent. However, the average release rate was 59 percent. The release rates for Kaduna and Sokoto states were 63 percent and 29 percent, respectively. This was different from 2015, where the average proportion of education sector spending to total state budget was 25 percent while the average release rate was 73 percent. In 2015, the release rates were 65 percent and 72 percent, respectively, for Kaduna and Sokoto states. There is a lack of detail in the figures given in the AESPR, making it difficult to look at possible reasons for these changes. The lack of matching between budgeting and expenditure in the MTSSs and AESPRs makes it difficult to ascertain the size of the funding gaps for education in the five NIPEP states.
Figure 2 - Comparison of state budget allocations and release rates for 2015 and 2016 (Naira millions)
Source: Consolidated report of AESPRs (2017)
39 Renamed the Tertiary Education Trust Fund (TETFUND) in 2011; now only dedicated to tertiary education. 40 Nigeria: Sustainable Development Knowledge Platform. (n.d.). Retrieved June 5, 2018, from https://sustainabledevelopment.un.org/memberstates/nigeria
0
10,000
20,000
30,000
40,000
50,000
60,000
Jigawa Kaduna Kano Katsina Sokoto
2015 Allocation 2015 Release 2016 Allocation 2016 Release

NIGERIA FIRST ANNUAL REPORT 47
© UNIVERSALIA
122. About 80 percent of the education spending nationally is allocated to recurrent costs, such as salaries. This figure varies from state to state, between 94 percent in Kano state, and 80 percent in Sokoto state41. This is likely driven by the guarantee of teachers’ incomes by the UBE act, which transfers earmarked funds directly to LGEAs to pay teachers. Non-recurrent expenditure is not guaranteed in the same way either by the SMoE’s or the UBE-IF. It is not clear what proportion of SMoE funds are spent on salary costs – with some junior secondary school teachers being paid by LGEA’s (as per the UBE act) and some still being paid by the SMoEs.
123. The most comprehensive figures for financing allocations and funding gaps are given in the 2014 ESPIG application document. These figures, are however, clearly unreliable. For example, the figures given for the share of funding for basic education in Kaduna state vary between 44.52 percent and 15 percent over 3 years, and the amount of domestic funding increasing by 70 percent over the same period. In Sokoto a significant change is seen both in sector plan costs and funding between 2014 and 201542 (marking the beginning of the new MTSS), implying inconsistency in budgeting and recording of finances. A framework for what is and isn’t covered in ESP costing or budgeting is not laid out either in the ESPIG application, or in the MTSSs – making it difficult to compare funding between states, or between sector plans.
124. The application itself notes that it can’t realistically assess the funding gap, as all external funding is off budget, and when the projections received from DPs were included, they reported a negative funding gap in all states. The MTSSs don’t note what funding is or isn’t included in their projections, beyond what is dedicated to teacher salaries through UBEC, and what is received from UBE-IF (which is a fixed amount), limiting the understanding of where the funding gap is (i.e. what section of the sector is underfunded, and who is responsible for this funding).
Amount and quality of international financing
125. In 2016, Nigeria received US$2.50 billion43 in ODA, which is 0.63 percent of Nigeria’s GNI, with the major donors being the World Bank, United States, United Kingdom, Global Fund, the European Union and Gavi, in descending order. Between 2013 and 201644 the absolute level of ODA remained effectively stable, as did the important donors.
126. In 2013, official figures from the Nigerian NBS confirmed Nigeria as a lower middle-income country. Due to its lower middle-income country status, financial and technical support will change, although as yet the overall volume of ODA has not declined.
127. In 2016 US$ 209 million was directed to education, or approximately 7 percent of total ODA, the biggest donors for education being the United States, EU institutions and the United Kingdom.45 It has not been possible to obtain data on education sector ODA flows to the five states supported by the GPE, as donor funding does not feature in state-level reporting or in the AESPRs reviewed.
128. Most of the ODA provided is off budget, with the lack of detailed reporting being indicative of the fact that there is little formal alignment between government and donor budgets at the state level.
41 Figures for 2014 taken from the ESPIG application document, 80 percent is the figure given for the whole of Nigeria. 42 An 81 percent increase from 2014 to 2015 43 Taken reported under the OECD DAC’s development finance data: http://www.oecd.org/dac/financing-sustainable-development/development-finance-data/ 44 More recent data will be made available by the OECD-DAC in 2019 45 Data on donations specifically for education are not available, as the OECD CRS agglomerates education with all social institutions. Source: http://www.oecd.org/dac/financing-sustainable-development/development-finance-data/

48 NIGERIA ANNUAL REPORT YEAR ONE
© UNIVERSALIA
Donor funding tends to focus on projects that lie across state lines, with the degree of harmonization being dependent on matched priorities within crossover states. While no formal data were made available to this evaluation, interviews with stakeholders in international DPs speak to a lack of harmonization on donor priorities. The extent to which alignment and harmonization exist, or are improving, will be a subject of continued focus for the final country mission of this evaluation.
GPE contribution to sector financing 129. The GPE grant to Nigeria of US$100.7 million is incorporated into the states’ budgets for implementing their education sector operational plans. The average share of the NIPEP funding out of estimated state basic education financing was 3.67 percent between 2015 and 2017; this ranged from 2.70 percent in Kano to 12.64 percent in Sokoto.46 As at November 2018, 74 percent of the US$100.7 million GPE ESPIG had been disbursed.47
Table 6 - Comparison of UBE funding and GPE ESPIG divisions (NIPEP components 1 and 2) for five NIPEP states (2016–2019)
Participating state UBE funding (US$ million)
GPE funding (US$ million)
GPE funding as a percentage of UBE
funding
Jigawa 211.5 12.9 6 percent
Kaduna 211.5 23.1 11 percent
Kano 211.5 29.7 14 percent
Katsina 211.5 14.1 7 percent
Sokoto 211.5 9.2 4 percent
Total 1,057.5 89.0 8 percent Source: NIPEP PAD (2015) and consolidated report of AESPRs (2017)
130. When asked about the relative size of GPE funds to the education sector, a subset of federal government stakeholders opined that it was relatively small compared to the size of other donor interventions, although it was said to be influential in supporting government implementation of specific priorities outlined in ESPs.48 It was noted that due to the complexity of government funding channels and donor funding in the Nigerian system, many state-level actors had a poor understanding of the mechanisms of the GPE funding. A stakeholder from DFID noted that there was often a perception that the ESPIG was a loan rather than a grant.
131. At the state level, government stakeholders believe that the GPE funding was very useful, albeit inadequate in addressing the funding gaps needed to fund the states’ education sector developmental needs. Some state actors also took issue with how the money from NIPEP has been divided between states. It was noted by officials from Sokoto State that they received only 9 percent of GPE funding (full figures shown in Table 6), despite having a much higher proportion of the school-aged population. The interviewed stakeholders bemoaned a lack of transparency in the process of assigning and disbursing the ESPIG through NIPEP. For this evaluation no information was available to detail the rationale used for dividing the ESPIG funding between the states.
132. Normally, funding for basic education comes to the SUBEBs through the UBEC at the federal level. This means that the bulk of basic education spending at the state level is not operationalized by
46 World Bank. Project Appraisal Document (p. 98). 47 The World Bank (2017) Implementation Status and Results Report (p. 7, Rep. No. ISR 28235). 48 Federal Government Representative. Interview. April 12, 2018.

NIGERIA FIRST ANNUAL REPORT 49
© UNIVERSALIA
the SMoEs as SUBEBs have responsibility for teachers’ salaries and school facilities. GPE-NIPEP funding is, in contrast to this, being operationalized by the SMoEs, who direct the funding towards the LGEAs and the SBMCs for the school improvement grants, and support for female teachers and students.
133. Stakeholders interviewed from the World Bank in Nigeria, as well as from SUBEBs and SMoEs in Sokoto and Kaduna, noted that this way of providing funding is unusual. The reasoning given for this change was to promote accountability at the state level, by avoiding routing funding through SUBEBs, which are seen as unreliable, as they have no model for results-based financing. It is not clear how this model is designed to improve accountability or support the introduction of results-based financing, and it is not clear whether it is simply intended to maximize the effectiveness of the NIPEP funding. It is interesting to note that Better Education Service Delivery for All (BESDA), funded and implemented by the World Bank, will direct its funding through UBEC and the SUBEBs.
134. The focus in NIPEP has been on cash transfers to teachers, students and SBMCs. The reasoning for this seems to have been that by avoiding infrastructure and capital projects, NIPEP can avoid the risk of convoluted procurement processes, as well as the attendant risk of corruption. While this ensures some efficiency in NIPEP funding, it does little to improve these issues around capital financing. A core aim of GPE funding is to improve the amount and quality of domestic financing, through capacity building and the imposition of fiduciary safeguards and procurement processes. As the funding for NIPEP is being directed to the SMoEs, these safeguards and standards will not have any capacity building impact on the SUBEBs (particularly in a political economy in which communication between bodies is poor, and the SUBEBs and SMoEs are considered rivalry structures). This means that the funding can have very little impact on improving the quality of finance in the long term, as it is the SUBEBs rather than the SMoEs that are responsible for the bulk of funding for basic education at the state level. From the stakeholders interviewed in SUBEBs and SMoEs it is clear that there is a lack of trust and communication around financial matters, and that there are serious concerns in the SMoEs about transparency in reporting and spending within the SUBEBs, particularly on capital projects.
135. There is no concrete evidence at this point of additional funding coming from the presence of GPE resources. This is something that the final evaluation will focus on more concretely. It is also not clear how GPE encouraged state governments to raise their education spending above the 20 percent threshold. Considering that state funding comes through the SUBEBs, and NIPEP operated solely through the SMoEs, it seems unlikely that GPE Secretariat advocacy has had an effect on state education spending – as this is the primary responsibility of the SUBEBs. This is also something that will need to be further investigated and tracked over the course of the ESPIG. Some stakeholders interviewed mentioned that NIPEP is attracting more educational sector programs to the NIPEP states (e.g. through Jollyphonics, new UNICEF programs, etc.). However, there is no concrete evidence for, and no concerted effort to document and support, this claim.

50 NIGERIA ANNUAL REPORT YEAR ONE
© UNIVERSALIA
2.1.4 ESP implementation
Assessment of ESP implementation 136. In interviews with stakeholders at state level, both in the SMoEs and SUBEBs, questions regarding the progress of ESP implementation were often met with project-level implementation information. When probed, some stakeholders clearly outlined their scope of interest at the project level and not at the level of sector plan implementation. Some were unable to conceptualize how the various projects relate to the broader plans. This implies some further work can be undertaken to ensure actors know how different elements of the plan fit together to contribute to the sector as a whole.
137. Evidence available regarding progress towards the four priority objectives shared across the five ESPs is outlined in Table 7. The table covers activities carried out in 2016 (the latest data available). The information is taken from the state-level AESPR reports. Two of these – for Jigawa and Kaduna – were not available at the time of writing, leading to an absence of implementation data from these two states (it is reported that the AESPRs have been carried out, but it was not clear at the time of writing whether data from these reviews would be published).
138. The table below serves to indicate the lack of evidence on ESP implementation available at the federal and state levels and the reality that even when assessments such as the AESPRs are carried out, copies may be impossible to obtain without directly approaching the relevant staff at the state level and hoping that they are available there. An important issue with this reporting is the lack of feedback between targets and outputs. As there are no concrete targets set out in the most recent ESPs, it is very difficult to assess the success of state governments in implementing their ESPs. What is clear is that there is a lack of coherency in actions taken. With no meaningful strategies set out in the MTSSs, there is no guiding direction for actions undertaken, with the AESPRs giving a summary of actions undertaken with no thought given to why these actions were undertaken, and what the intention or desired outcomes were.
Summary
• Obtaining analysis of state-level ESP performance from federally-based stakeholders is challenging. At the state level, reporting against the ESPs is constrained by a lack of capacity and data, and failure to set realistic targets at the outcome level.
• Nevertheless, the mid-term review of NIPEP found that the project had progressed significantly towards achieving its goals in promoting school effectiveness and improved learning outcomes, and increasing access to basic education for out-of-school girls.

NIGERIA FIRST ANNUAL REPORT 51
© UNIVERSALIA
Table 7 - ESP implementation by priority area in each state in 201649
State
MTSS thematic area Improve the quality and
relevance of basic, secondary and tertiary education
Expand basic education coverage, especially for disadvantaged
groups
Provide appropriate non-formal learning opportunities,
particularly for illiterate and hard-to-reach children and
youth
Strengthen government’s capacity to manage, plan, and monitor the
delivery of education services more effectively and efficiently
Jigawa Could not obtain Could not obtain Could not obtain Could not obtain Kaduna Could not obtain Could not obtain Could not obtain Could not obtain Kano Procurement of teaching and
learning materials for special needs schools
Procurement of sports materials
Payment for training on research and staff development in tertiary education
Books purchased for 17 divisional libraries
Conducting of a community sensitization campaign for pre-primary and primary schools
Payment of examination fees for secondary school students
Integration of 82 Islamiyya schools
Mentoring and monitoring of SBMC activities in secondary
Conducting of ASC
Development of MTSS
Katsina Recruiting of 1,933 basic and post-basic teachers
Construction of computer centers
Establishment of new schools
Initiation of family support incentives
Development of more community schools
Adoption of an effective budgeting system
Increased community participation in school management through SBMC reform
49 This table reflects directly what is reported in the AESPRs. Much of the reporting lacks detail on what was achieved, and how it is linked to what was intended to have been implemented. This gives an indication of what is being achieved at state level, but also highlights the lack of focus and clarity on how education sector development takes place, and the impact of a lack of coordination between the MTSSs and plan implementation.

52 NIGERIA ANNUAL REPORT YEAR ONE
© UNIVERSALIA
State
MTSS thematic area Improve the quality and
relevance of basic, secondary and tertiary education
Expand basic education coverage, especially for disadvantaged
groups
Provide appropriate non-formal learning opportunities,
particularly for illiterate and hard-to-reach children and
youth
Strengthen government’s capacity to manage, plan, and monitor the
delivery of education services more effectively and efficiently
SUBEB investment in teacher professional development
Enrollment drive campaign to engage communities in mainstreaming out-of-school children
Training of SBMC on school management issues
Investment in upgrading EMIS facilities and training EMIS staff
Increase in quality assurance staff
Conducting of ASC
EGRA carried out across all LGEAs
Study on supply and demand of teachers carried out to assess future resource gaps
Sokoto Training of over 2,000 teachers, 334 head teachers and 50 education managers at primary level
Training of 250 ECCDE care fivers and education managers
Rehabilitation of four government secondary schools
Upgrading and expansion of three further government secondary schools
Construction of 75 new classrooms and renovation of 712 classrooms
Training of 2,162 SBMC members, 13 district heads, and 65 LGEA officials to carry out enrollment drives across 23 LGAs
Community mapping carried out in three LGAs
Construction of new classrooms at nomadic primary schools
Training of 100 quality assurance officers
Source: AESPRs for Kano, Katsina and Sokoto

NIGERIA FIRST ANNUAL REPORT 53
© UNIVERSALIA
GPE contribution to ESP implementation 139. Considering that the ESPIG in Nigeria is split between five states, its relative financial contribution to the implementation of state ESPs is modest. The proportion of funds provided by the ESPIG over the four-year term, as a percentage of those provided through the federal UBE, ranges from 4 percent in Sokoto State to 14 percent in Kano State (figures for all states shown in Table 6).
140. It is important to note that while the ESPIG is directed to state-level projects by NIPEP it is unclear how much the implementation of NIPEP priorities engages actors in the SMoEs. For example, the school improvement grants disbursed by NIPEP are transferred directly to SBMCs, rather than through the LGEAs or SMoEs. This effectively places SMoEs in the role of coordinating/disbursing NIPEP activities, while the planning and direction for NIPEP is located federally with the NIPEP National Project Steering Committee. While this a reasonably effective arrangement, it misses opportunities for capacity building at state level.
141. When asked about the likelihood of government institutionalizing some elements of NIPEP, stakeholders in Sokoto State were of the opinion that the state government is likely to institutionalize and continue the cash transfer1 to households to encourage enrollment of female children, whereas in Kaduna, the SIP grant to Islamiyyah schools is likely to be institutionalized. It will be interesting for the subsequent evaluation to investigate whether the intention in these cases is to maintain the responsibility for these transfers with the SMoEs, or to transfer it to SUBEB – and how this modality would affect relationships between bodies at the state level.
142. A new World Bank program-for-results project, BESDA, budgeted at $615 million, with a focus on out-of-school children, is viewed by stakeholders as a successor to NIPEP. The program is going to be implemented in 13 states, including the five NIPEP states and six north-eastern states in Nigeria. Unlike NIPEP, the control and coordination of this program is likely to be situated within the SUBEBs.
Table 8 - NIPEP contributions to ESP implementation in the five states (project components 1, 2 and 3)
Sub-component Intervention Current Target MTSS focus area 1. Promoting School Effectiveness and Improved Learning Outcomes Sub-component 1(a) – school improvement grants to primary schools
Schools receiving school improvement grants
118,818 174,000* Improve the quality and relevance of basic, secondary and tertiary education
Sub-component 1(b) – school improvement grants to pre-primary schools
Schools awarded grants
10,626 11,000
Sub-component 1(c) – support to teachers’ professional development
Early grade teachers, complete training with NIPEP funds
73,808 96,954
2. Increasing Access to Basic Education for Out-of-School Girls
Sub-component 2(a) – girls’ access to primary education
Girls receiving scholarships
299,629 300,000 Expand basic education coverage, especially for

54 NIGERIA ANNUAL REPORT YEAR ONE
© UNIVERSALIA
Sub-component Intervention Current Target MTSS focus area Sub-component 2(b) – scholarships for female teachers
Female teachers receiving grants
5,656 21,000* disadvantaged groups
Sub-component 2(c) – community mobilization and SBMC training
SBMC members given training
8,635 12,130 Strengthen government’s capacity to manage, plan, and monitor the delivery of education services more effectively and efficiently
3. Strengthening Planning and Management Systems including Learning Assessment and Capacity Development Sub-Component 3(a) – management and implementation support
State-level education actors engaged in capacity building programs
555 (13 events) - Strengthen government’s capacity to manage, plan, and monitor the delivery of education services more effectively and efficiently
Sub-component 3(b) – monitoring, evaluation and learning assessment
AESPRs completed EMISs in place Standardized tests being run
5 5 2
5 5 2
Source: NIPEP ISR 7 (2019)50
143. The 2017 mid-term review of NIPEP found that the project had progressed significantly towards achieving its goals in promoting school effectiveness and improved learning outcomes, and increasing access to basic education for out-of-school girls. This was measured through the proportion of grants and scholarships being disbursed and the number of SBMC members who had received training. There are currently no data available on the effectiveness of NIPEP outputs, meaning that the assessment of progress lacks credibility. A number of outcome indicators are included (shown in Table 9) but there are no intermediate outcome indicators which can create a causal link between program outputs and these high-level indicators.
144. In Kaduna State, an education system restructuring has led to the disengagement of over 20,000 teachers51 and an unknown number of local education monitoring staff. Consequently, some teachers that have been part of NIPEP are no longer in the classroom and any expected impact of either the training or higher qualification they have received through NIPEP on learning outcomes is lost. Another consequence of the restructuring is a lack of continuity of staff responsible for implementing SIP at the school level.
50 Figures marked with * are taken from the 2017 NIPEP mid-term review, as no figures were given in the latest ISR. 51 This disengagement was premised on the fact that the teachers allegedly failed a competency assessment designed at Primary 2 level. Replacement teacher recruitment is currently ongoing on a rolling basis.

NIGERIA FIRST ANNUAL REPORT 55
© UNIVERSALIA
145. In all the states, a common non-program challenge impeding program implementation has been the lack of financial inclusion for some selected beneficiaries of the conditional cash transfers. This led to unsuccessful transfer of funds to some selected beneficiaries of grants and cash transfers in the first year of the program. Some of these issues have been resolved through assistance with bank registration.
146. It is to be noted that the mid-term review noted significant issues relating to poor record-keeping on fund disbursement, as well as a lack of training and preparation for schools due to receive school improvement grants. Progress toward NIPEP’s system-level goals was assessed as mixed, with no progress having been made on the introduction of standardized tests, but significant improvements in the production of annual sector reviews.
147. GPE’s contributions to implementation of the ESPs through NIPEP were also triangulated through stakeholder interviews in two states – Kaduna and Sokoto. For example, representatives from the Teacher Services Commission indicated that GPE support has facilitated the deployment of trained field officers, who measure teacher performance, and teacher training has informed teacher development policies. The January 2019 progress report indicates that as at December 2018, 73,808 teachers had been trained. There are no data available on the impact that this has had on teacher competency.
148. It is detailed by stakeholders that state governments and NIPEP have focused on projects that are easily operationalized and difficult to sustain, such as the school improvement grants and money given to families and teachers. This has led to a lack of focus on the more ineffable aspects of NIPEP, such as the strengthening of EMISs and the introduction of learning assessments.
Table 9 - Summary of progress towards NIPEP outcomes
Outcome indicator Baseline Current Target
Primary NER 48 percent 46.4 percent 52 percent
GPI (primary enrollment) 72 percent 72 percent 76 percent
Hausa reading rate (Grades 2 and 3) 4 percent 4 percent 10 percent
English reading rate (Grades 2 and 3) 3 percent 3 percent 10 percent Source: NIPEP ISR 7 (Jan. 2019)
149. The mid-term review focuses on a lack of progress in developing accountable M&E systems for tracking the implementation and impact of NIPEP’s priorities. This means that while figures are available for progress in terms of the disbursement of grants and scholarships and the organization of training events, there are no data available on the effectiveness of these measures in creating the changes advocated for in the state ESPs. The PDOs that relate to outcomes – reading levels and gender parity in enrollment – have shown no improvements since baseline (summary shown in Table 9). This makes the upgrading of NIPEP’s progress to “satisfactory” in the most recent ISR difficult to understand.
2.1.5 Alternative explanations and unintended/unplanned effects Confirming and refuting alternative explanations 150. For the prospective evaluations, confirming and refuting alternative explanations is undertaken iteratively throughout the evaluation. Thus far in the evaluation process, our ability to identify alternative explanations is limited. Firstly, because the secondary evidence available does not adequately describe progress against objectives of the ESPs. Secondly, because the secondary evidence does not cover and differentiate what support has been provided by various stakeholders, in terms of support from other international DPs or funds disbursed by the federal government.

56 NIGERIA ANNUAL REPORT YEAR ONE
© UNIVERSALIA
151. For the purposes of this evaluation, it is important to note that one likely additional factor contributing to ESP implementation in the five states is the activities of other, non ESPIG-funded, projects that address different aspects of the education sector. A summary of the most significant projects is given in Table 10 below.
Table 10 - Other DP contributions to ESP priorities by state
State ESP priority
I) Improve the quality and relevance
of basic, secondary and tertiary education
II) Expand basic education coverage,
especially for disadvantaged
groups
III) Provide appropriate non-formal learning opportunities, particularly for
illiterate and hard-to-reach children and
youth
IV) Strengthen government’s
capacity to manage, plan, and monitor
the delivery of education services
more effectively and efficiently
Jigawa BESDA (World Bank)52
BESDA (World Bank)
No data BESDA (World Bank)
Kaduna BESDA (World Bank)
BESDA (World Bank)
No data BESDA (World Bank)
Kano BESDA (World Bank)
Teachers’ Development Programme (DFID)
Building the capacity of in-service and pre-service teachers
BESDA (World Bank)
BESDA (World Bank)
Katsina BESDA (World Bank)
UNICEF
Head teacher trainings, early grade reading interventions, monitoring and mentoring
Girls’ Education Project (UNICEF, DFID funding)
Improved capacity of teachers to deliver
BESDA (World Bank)
UNICEF
Community mapping and support for increased enrollment
Girls’ Education Project (DFID)
Increased access to and demand for girls’ education
Educate a Child Project
BESDA (World Bank)
UNICEF
Supported establishment of EMIS
Conducting ASCs
Training and capacity building for SBMC/CBMC
Development of SESP and MTSS
52 BESDA has not yet become operational, but will operate in the five NIPEP states, and aims to improve educational outcomes, primarily through the implementation of a payment for results framework, focusing on directing UBEC funding more effectively to improve educational quality and sector accountability, and reduce the number of out-of-school children. For more details see the BESDA PAD: http://documents.worldbank.org/curated/en/839251498183393835/pdf/BESDA-PAD-May-30-2017-06012017.pdf

NIGERIA FIRST ANNUAL REPORT 57
© UNIVERSALIA
State ESP priority
I) Improve the quality and relevance
of basic, secondary and tertiary education
II) Expand basic education coverage,
especially for disadvantaged
groups
III) Provide appropriate non-formal learning opportunities, particularly for
illiterate and hard-to-reach children and
youth
IV) Strengthen government’s
capacity to manage, plan, and monitor
the delivery of education services
more effectively and efficiently
effective learning for girls
Reading and Numeracy Activity (FHI 360)
Improving Hausa literacy and numeracy instruction at the primary level
Teachers’ Development Programme (DFID)
Building the capacity of in-service and pre-service teachers
VSO
Building the capacity of teaching and learning of sciences through mobile science laboratories
Supports out-of-school children through surveys and cash transfers
Girls’ Education Project (UNICEF, DFID funding)
Improved governance to strengthen girls’ education
Sokoto USAID Northern Education Initiative Plus
Implementation of an early grade reading program in half of LGAs, with materials and approach adopted by UNICEF in other parts of the state
BESDA (World Bank)
Girls’ Education Project (UNICEF, DFID funding)
Improved capacity of teachers to deliver effective learning for girls
BESDA (World Bank)
UNICEF Girls’ education programme
Provision of furniture and learning materials for primary schools
Disbursement of grants for school upkeep to SBMCs at ECCDE level
Oando Foundation Adopt-A-School
Scholarships for 78 pupils to complete basic education
USAID Northern Education Initiative Plus
Established 700 non-formal learning centers, 100 adolescent girls learning centers, and 100 youth learning centers
Training for facilitators at 1,500 centers, and for 59 master trainers
Feed the Future
Development of 35 non-formal education centers to train farmers in basic
BESDA (World Bank)
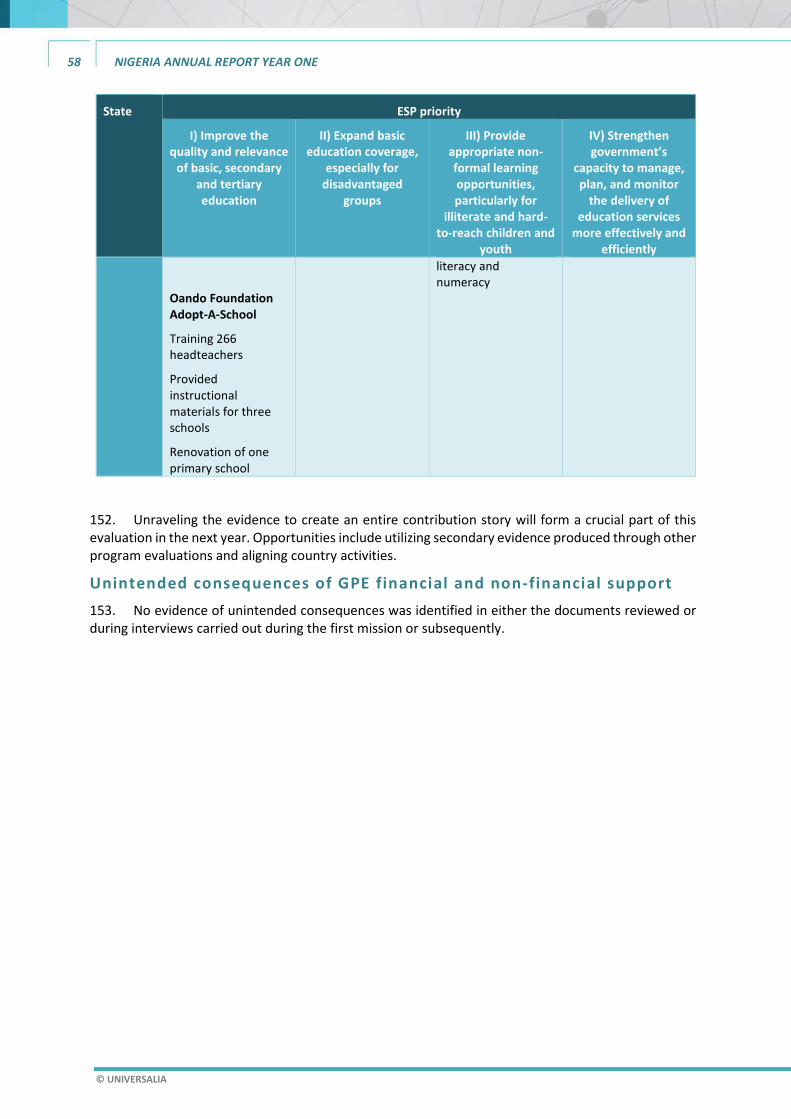
58 NIGERIA ANNUAL REPORT YEAR ONE
© UNIVERSALIA
State ESP priority
I) Improve the quality and relevance
of basic, secondary and tertiary education
II) Expand basic education coverage,
especially for disadvantaged
groups
III) Provide appropriate non-formal learning opportunities, particularly for
illiterate and hard-to-reach children and
youth
IV) Strengthen government’s
capacity to manage, plan, and monitor
the delivery of education services
more effectively and efficiently
Oando Foundation Adopt-A-School
Training 266 headteachers
Provided instructional materials for three schools
Renovation of one primary school
literacy and numeracy
152. Unraveling the evidence to create an entire contribution story will form a crucial part of this evaluation in the next year. Opportunities include utilizing secondary evidence produced through other program evaluations and aligning country activities.
Unintended consequences of GPE financial and non-financial support 153. No evidence of unintended consequences was identified in either the documents reviewed or during interviews carried out during the first mission or subsequently.

NIGERIA FIRST ANNUAL REPORT 59
© UNIVERSALIA
2.2 Progress toward a stronger education system53
2.2.1 Teachers 154. Teachers are among the most critical institutional inputs affecting a child’s educational experience. Research in various country contexts has indicated that while in many contexts teacher shortages are a major constraint, simply supplying more resources is not a panacea, particularly because deep-rooted distortions in developing country education systems, such as weak teacher incentives, can undermine efforts to produce higher student achievement through interventions and reforms focusing on education inputs. The major challenge in increasing teacher effectiveness (with the end goal of achieving better student learning) lies both in recruiting and training, and supporting competent teachers, improving the effectiveness of teachers already in post, as well as motivating and incentivizing them through ensuring the infrastructure around them is conducive to high productivity. 155. The only relevant state-wide, as opposed to project-specific, data available that have been assessed as credible are drawn from the ASCs carried out in each of the five states in 2015 and 2016 and reported in the consolidated AESPR in early 2018. Findings reported relevant to teachers are shown in Table 11 below. The figures show that pupil–teacher ratios and pupil–qualified teacher ratios are increasing. In the majority of cases states fail to meet the benchmark set in the GPE results framework (40:1, shown in the results framework indicators in Annex C), with the exception being Sokoto State.
53 All data taken from the AESPR is not disaggregated by school type. Considering that the ASC is carried out by the SMoE/SUBEB/LGEA it should count all integrated Islamiyya, government and registered private schools (but not Qur’anic or un-registered private schools) – but as the ASC is not available for this evaluation this cannot be said with certainty.
Summary • Assessing progress towards a stronger education system assumes a clear agreement on what
needs to be achieved by when above the level of inputs and outputs, and a system that can collect the requisite evidence.
• Currently, weaknesses in the ESPs mean that a clear and realistic set of targets for the system to achieve during the period are lacking. Progress has been made, through NIPEP, in developing the EMISs and LASs, but the results of this have yet to be seen in terms of the production and use of accurate school census data. In the absence of these tools, there is no source of reliable regularly produced data to talk meaningfully about trends in the number and quality of teachers at state level, for example. What data are available, show a worsening in pupil–teacher and pupil–trained teacher ratios.
• A number of possible future evidence sources have been flagged by stakeholders in Nigeria, but the evaluation team do not have sufficient knowledge to judge whether these are likely to be available in the future and, if so, when. The overall conclusion is that, given the need to rely on secondary evidence, it will be very challenging for the prospective evaluation to make credible claims on progress towards stronger education systems in any of the five states.
• Not enough evidence was available to look at trends in pupil-teacher and pupil classroom ratios, but available data showed that the NIPEP states all for short of the targets set out in the GPE results framework on pupil to trained teacher ratios. Figures for pupil-to-classroom and pupil-to-toilet ratios show a deterioration between 2015 and 2016. None of the five NIPEP states has a LAS in place, while the national-level, sample-based NALABE was last carried out in 2011. Per NIPEP records, all five NIPEP states had an EMIS that was returning timely and accurate data by 2017, although it is unclear how these data are being distributed or used to inform policymaking; while reporting of key indicators to UIS has also been spotty.

60 NIGERIA ANNUAL REPORT YEAR ONE
© UNIVERSALIA
Table 11 - Teacher status in the five states
State
Pupil–teacher ratio
(primary)
Pupil–qualified teacher
ratio (primary)
Pupil–teacher ratio
(junior secondary)
Pupil–qualified teacher
ratio (junior secondary)
2015 2016 2015 2016 2015 2016 2015 2016
Sokoto 46 48 91 95 29 28 34 31
Jigawa 50 52 93 94 36 42 45 51
Kano 59 72 115 134 42 42 54 55
Katsina 76 75 109 104 67 68 81 84
Kaduna 42 48 58 64 44 54 48 59
Average 55 59 93 98 44 47 52 56 Source: Consolidated report of AESPRs (2017)
156. We have not yet been able to access the AESPRs for all of the individual states, which should discuss the significance of these figures in terms of achieving the objectives of the individual ESPs.
2.2.2 Other non-teacher inputs 157. Table 12 and Table 13 are taken from the consolidated AESPR for the five NIPEP states in 2016, and show the ratios of students to classrooms and students to toilets. Both not only highlight a failure to provide adequate facilities for students, but also a failure to make progress towards improving these figures. While some states have made progress, with Sokoto State being the exception in reducing its JSS pupil–classroom and pupil–toilet ratios in 2016, overall the figures show a negative trend in the availability of classrooms and sanitary facilities for students. Toilets and sanitary facilities can be considered particularly important as they disproportionately affect female students, who, in the absence of sanitary and private toilet facilities, are more likely to be absent from, or drop out of, schooling due to menstruation.54
Table 12 - Primary/JSS pupil–classroom ratios
States
Primary JSS
2015 2016 2015 2016
Jigawa 69 80 68 74
Kaduna 81 91 72 89
Kano 96 100 55 58
Katsina 114 120 73 75
Sokoto 79 80 70 63
Average 88 94 68 72 Source: Consolidated report of AESPRs (2017)
54 UNESCO (2014) Good Policy and Practice in Health Education Booklet 9: Puberty Education & Menstrual Hygiene Management. Accessed November 2018 from: http://unesdoc.unesco.org/images/0022/002267/226792e.pdf

NIGERIA FIRST ANNUAL REPORT 61
© UNIVERSALIA
Table 13 - Primary/JSS pupil–toilet ratios
States
Primary JSS
2015 2016 2015 2016
Jigawa 129 143 79 82
Kaduna 313 274 147 164
Kano 230 235 71 71
Katsina 161 172 89 95
Sokoto 208 281 134 105
Average 208 221 104 103 Source: Consolidated report of AESPRs (2017)
158. The consolidated 2016 AESPR, in its conclusion, notes the complete absence of policy direction on school safety and security. Considering the ongoing security situation in northern Nigeria, this is an important oversight. It seems that no concrete, policy-level actions have been undertaken to improve security in schools across the five states. Similarly, while some federal stakeholders spoke of the introduction of a new policy on early childhood development and education, there is no documentation to say how this will change state-level policy, and whether actioned changes have taken place so far.
2.2.2 LASs 159. None of the five states has any LAS in place.55 The NIPEP mid-term review notes that none of the five states had carried out the EGRA that was planned for 2017, with NIPEP support, and allowing trend analysis against the baseline carried out in 2013. EGRA surveys were also planned for 2018, but at the time of the evaluation mission in March 2018 to two of the five states, the team found that the states did not appear to have internal capacity for driving this output. NIPEP therefore commenced negotiations with an agency based in Ghana, which has been contracted to carry out the learning assessments in the five states.56 In the latest ISR it is stated that consultants have been contracted to carry out the EGRAs in 2019, with draft results reported to be due in June 2019. A more strategic challenge is that even if the EGRAs is carried out, its significance and contributions to systemic national tracking of learning outcomes, sector performance evaluation, and development of national strategies for improving education provision will be limited until the national-level MLA approach is institutionalized. MLAs have been carried out in the past, but have never been systematized, and their role in monitoring and policymaking has never been formalized.
160. Similarly, it was intended that the National Assessment of Learning Achievement in Basic Education (NALABE) would be carried out in 2017 (the last one took place in 2011). This survey takes in around 60,000 students across Nigeria (a relatively small sample) and assesses learning in reading and mathematics. While some data are given on state-level achievement, most of the findings are generalized at the national level. Data from the 2017 survey had not yet become available at the time of writing.
55 NIPEP (2017) National Progress Report of the Nigeria Partnership for Education Project (NIPEP) In Five Northern States of Nigeria (p. 10, Rep.). 56 Donor partner. Interview, April 12, 2018.

62 NIGERIA ANNUAL REPORT YEAR ONE
© UNIVERSALIA
Table 14 - Status of AESPRs, EMISs and standardized test administration, by NIPEP states
State States that carried out AESPRs
States with EMISs in place producing timely data
States that have developed and administered standardized tests
2015/2016 2016/2017 2015/2016 2016/2017 2015/2016 2016/2017
Sokoto No Yes No Yes No No
Jigawa No Yes No Yes No No
Kano Yes Yes Yes Yes No No
Katsina Yes Yes Yes Yes No No
Kaduna Yes Yes Yes Yes No No
Total 3 5 3 5 0 0 Source: Progress report, NIPEP, 2017, and authors’ update based on combined AESPR for the five states in 2016.
2.2.3 EMISs 161. Provision for the development of an EMIS, including the purchase of resources to facilitate data gathering and sharing, as well as capacity building activities, is included in all five of the state-level ESPs. According to the NIPEP progress reports, as at 2017 all five NIPEP states had an EMIS that was returning timely and accurate data.57 Informants in the Kaduna SMoE spoke of the purchase of computers and other equipment to support the EMIS that had already been in place. According to the interviewees, the EMIS in Kaduna State was collating data from the LGEAs and passing it on to the FMoE on a quarterly basis. It is not clear how the EMISs in the other four states are functioning.
162. Despite the assertion that EMISs have been created and are producing data, it is unclear how these data are being distributed and how much impact they are having on policymaking at the state level. It is also unclear how the creation and capacity building of EMIS units is linked to the policy priorities and strategies outlined in the state ESPs, and how much is linked to the ESPIG support.
163. Judging by the GPE results framework, Nigeria as a country has performed poorly in reporting education data. In 2019 it was reported that Nigeria had provided58 data on only one (primary gross enrolment ratio) of the 12 key education UIS indicators (Results Framework indicator 14).
ESP Implementation contribution to system-level change 164. Identifying the ESPs’ contribution to system change is currently impossible. This reflects two sets of challenges. The first relates to the limitations in the ESPs themselves, which have been discussed above. Without a clear vision of how the systems within the five states need to develop, underpinned by ESPs that identify a set of achievable priority investments for how to meet the strategic needs, and realistic targets, it is impossible to say more than some aspects of the system may be changing but not if as intended. The second set of challenges relates to the degree to which federal resources (such as through UBEC), or those from donor investments, are explicitly prioritized and focused on the delivery of objectives within the ESPs. The discussion above strongly indicates that the ESPs are not a strong driver of decisions by either federal government (the major source of funds) or DPs on what they invest in.
57 The EMIS also supports the production of the ASC data – although currently these data are not published annually. 58 This is measured with a two-year time lag, meaning that this absence refers to data from 2016.

NIGERIA FIRST ANNUAL REPORT 63
© UNIVERSALIA
2.3 Progress toward stronger learning outcomes and equity
Assessment of learning outcomes 165. There is no standard learning assessment conducted in the five states to provide data on the learning achievement of pupils. The national MLA has been designated a statutory responsibility of the Department for Educational Planning, Research, and Development of the FMoE, but the exercise is far from being institutionalized across the states. The four-year cycle for conducting MLAs has not been maintained. Two MLAs were conducted in 2003 and 2011, with long delays in the production of reports, and poor dissemination. During the same period, UBEC conducted separate learning assessments, in 2003, 2006, and 2011, and UBEC stakeholders who were interviewed stated that another is underway. In addition, over the years, federal and state education MDAs and international DPs have carried out variants of the MLA, in the form of learning assessments specific to their programs, to meet M&E needs and other requirements. Most of these exercises do not relate to or build on each other. The latest was scheduled to be released in 2018 but its results were not available to this evaluation. They may later be used to assess learning outcomes in the NIPEP states.
166. Currently the most robust evidence available is for three of the five states – Kano, Kaduna and Jigawa – and draws on a composite survey funded by the DFID-funded Education Sector Support Program in Nigeria (ESSPIN) programme,59 which assessed learning outcomes between 2012 and 2016. This data is representative at the state level. As can be seen in Figure 3, across all grades and across three of the states, learning outcomes actually deteriorated between 2012 and 2016. This is supported by a variety of data sources, as outlined in the report ‘Reflections on why basic education learning outcomes are declining in Nigeria’ (ESSPIN, 2016)
59 It should be noted that these data are project based, with a standardized measure used by ESSPIN to assess the impact of their interventions. There are no data that cover the general school population.
Summary • A lack of standardised learning assessments in any of the five states makes it difficult to assess
trends in student learning outcomes for basic education. What data is available, including the data produced by DFID’s ESSPIN, shows stagnation and decline in learning outcomes at grade two and grade four.
• Annual School Census data was available only for Kano state, and the figures produced were both at odds with the figures given in NIPEP reporting, and featured incongruous figures (including net enrolment rates above 100 percent). This both highlights the lack of data available for the other four states, and shows the issues around data reliability where it is available.
• Gender parity data produced in the state AESPRs directly conflicts with data produced by the national bureau of statistics. However, both show that GPI for enrolment at every level of education is below acceptable levels. This is backed up by national household survey data which shows that people living in north-west and north-east regions are four times more likely to have no education than those in the south-south region.
• Given the lack of reliable data, and the lack of improvement in the available data – it is not possible at this stage to link system level changes to progress towards stronger learning outcomes and equity in basic education.

64 NIGERIA ANNUAL REPORT YEAR ONE
© UNIVERSALIA
Figure 3 - Literacy and numeracy scores from ESSPIN assessment 2012–2016
167. UBEC conducts an NALABE every three years; the latest was due to be carried out in 2017, but no results had been released at the time of writing, though they may later be used to assess learning outcomes in the NIPEP states. The most recent NALABE report published covers data from the 2011 assessment. State-level data on mathematics and English achievement from Primary 4 (P4) to Junior Secondary 1 (JS1) is included in Annex G. These data are too old currently to be used for assessing the links between current system-level changes and student-level outcomes, but may be a useful reference point in the future, if data publishing becomes more timely.
168. Data from the EGRA carried out by USAID in 2013 and 201460 showed pervasive issues with reading at Grade 2. For the five states in question, between 88 percent and 97 percent of students were not able to correctly read a single word in Hausa. This assessment was not repeated so it is not possible to see how these figures have developed since 2014 – but they triangulate data from other sources, and from the NIPEP ISR,61 showing serious issues with the quality of education and learning outcomes being achieved in basic education.
Assessment of equity, gender equality and inclusion in education 169. In education, equity and inclusion imply equal opportunities to access basic, upper secondary and tertiary education for both male and female children. Generally, in Nigeria, overall enrollment rates in basic and secondary education are still low, especially in the northern regions. The Nigeria Digest of Education Statistics (2006–2010) revealed 54,434 public primary schools in Nigeria, with an enrollment figure of 24.4 million, of which females accounted for 11.1 million (45.5 percent),
60 https://earlygradereadingbarometer.org/nigeria-kano/comparisons 61 The ISR for NIPEP uses English and Hausa reading rates as Project Development Objectives – though it is not clear how progress is being measured in the absence of a LAS.
250
350
450
550
2012 2014 2016
Grade 2 numeracy
Kano Kaduna Jigawa
250
350
450
550
2012 2014 2016
Grade 2 Literacy
Kano Kaduna Jigawa
250
350
450
550
2012 2014 2016
Grade 4 Literacy
Kano Kaduna Jigawa
250
350
450
550
2012 2014 2016
Grade 4 numeracy
Kano Kaduna Jigawa

NIGERIA FIRST ANNUAL REPORT 65
© UNIVERSALIA
indicating a GPI of 83.6. The 7,129 public JSSs recorded total enrollment of about 3.3 million (with about 45 percent female). More recent data reveal that the primary school GER was 87 percent in 2015, while the NER was 67 percent. Also, the GER and NER for JSS were 67 percent and 40 percent respectively62. A large number of students attend un-registered private and non-integrated Qur’anic schools, but their enrollment rates aren’t covered by the ASC and are therefore are not included here.
170. ASC data are available for two of the NIPEP states, which produced reports as part of ESSPIN, most recently in 2013/14. The data from Kano are summarized in Table 15 (including data provided for previous years in the 2013/14 census). No figures for GER/NER were included in the Kaduna State ASC. It is important to note that the figures reported here are at odds with data produced in the NIPEP ISR (primary net enrollment across the five states for 2015 is reported in the NIPEP ISR as 48 percent), and the NIPEP PAD (which reports the proportion of out-of-school children in Kano State as 40 percent). Showing primary NER above 100 percent indicates a flaw either in calculation, or in the census data used to estimate the number of primary school-aged children. These discrepancies between data sources highlight the difficulties in assessing the challenges in access to and quality of education in these states.
Table 15 - Annual census data from Kano State
Indicator 2011/12 2012/13 2013/14
Primary GER 115 percent 123 percent 139 percent
NER 93 percent 108 percent 117 percent
GPI .9 .9 .96
JSS GER 40 percent 41 percent 43 percent
NER 16 percent 30 percent 32 percent
GPI .9 .9 .68
Senior secondary school GER 34 percent 34 percent 32 percent
NER 19 percent 24 percent 21 percent
GPI .8 .9 .52 Source: ASC for Kano State (2014)
171. A survey63 on educational attainment shows wide disparities regarding gender, geographical boundaries, and geo-political zones. Females and males in rural areas are more than twice as likely as those in urban areas to have no education (49 percent against 22 percent for females, and 35 percent against 14 percent for males). Similarly, household members in the North West and North East are four times more likely to have no education than those in the South-South region (68 and 66 percent, against 15 percent). Educational attainment also increases as household economic status increases. For example, 76 percent of women in the poorest households have no formal education, compared with just 4 percent among the most advantaged households. More recent data are not available to discern if there has been improvement in these areas. 172. For gender parity, two conflicting sets of statistics emerge. For 2016, both the NBS and the AESPR (based on state ASC reports) provided data on gender parity. The NBS statistics were later disputed on a different issue (pre-primary enrollment) and are no longer available on the NBS website.
62 Nigeria Education Data Survey 2015 National Population Commission (2015) 2015 Nigeria Education Data Survey (NEDS). 63 National Demographic Household Survey 2008, National Planning Commission, Federal Republic of Nigeria and ICF Macro (Maryland, USA), (November 2009).

66 NIGERIA ANNUAL REPORT YEAR ONE
© UNIVERSALIA
The contrast in the JSS figures was stark, with the AESPR reporting a GPI of .86 for primary and .70 for JSS, and the NBS reporting a GPI of .81 for primary and .11 for JSS. The source for the dispute is a number of news articles about the issue64 and the evaluation could find no official documentation regarding the issue. In light of this it is difficult to make any concrete assertions about gender parity in basic education across the five states. This further highlights the difficulties caused by a lack of reliable education data. The figures from both the NBS report and AESPR are available in Annex H. Contribution of the education system-level improvements to improved learning outcomes, equity and inclusion 173. Considering the lack of improvement on key indicators on system-level improvements, and the absence of up-to-date statistics on learning and equity outcomes, it is too early to say whether any system-level improvements have led to improved learning outcomes and increased equity.
2.4 Plausibility of the ToC at Year 1
174. At Year 1 assumptions within the GPE ToC largely do not hold in the Nigeria context. The key assumptions that underpin the ToC, outlined in Section 1.4, from context, to inputs, to activities and intermediary outcomes, are listed in the table below. The table assesses the most pertinent assumptions for the evaluation after the first annual mission and includes an assessment of the extent to which these assumptions are likely to hold.
Table 16 - Summary of findings against assumptions at Year 1
Assumption Assessment
1. There is sufficient alignment across partner activities. Country and state-level partners work inclusively through LEGs.
Does not hold. Federal-level LEG ceased operation once ESPIG commenced implementation and nothing was put in place to serve the same purpose. Nothing comparable to a LEG at state level in any of the five states.
2. There is political will at state level to use evidence and best practice in sector analysis and planning.
Uncertain. No evidence collected/found in secondary data to test this assumption.
3. GPE has sufficient leverage within the country and at state level for GPE advocacy and support to be effective.
Does not hold. No indications found that GPE has significant leverage with either international DPs or with Nigerian stakeholders at national and state levels. There is evidence at state level that ESPIG is seen as a World Bank “project”.
4. The process of sector plan development at the state level aligns with the principles and good practices promoted by GPE.
Does not hold. There are significant questions over the robustness and credibility and utility of state-level ESPs. No evidence that shortcomings identified in the appraisal/re-appraisal of ESPs in 2013/2014 have been addressed in in the current five state-level ESPs (2018–2020).
5. The context is conducive at national and state levels to effective partnership engagement.
Does not hold. The ambiguous federal–state-level division of roles and responsibilities, combined with lack of alignment and coordination, within the Nigerian institutional context for education, makes partnership challenging. Many DPs focus on their projects in their states.
64 The investigation was led by ICIR: https://www.icirnigeria.org/nbs-pulls-down-misleading-education-statistics-after-fact-check-by-icir/ (accessed November 29, 2018).

NIGERIA FIRST ANNUAL REPORT 67
© UNIVERSALIA
6. Generated evidence is trusted and accurate.
Partially holds. The NIPEP mid-term review indicates that work is still required to improve the robustness and quality of data derived from the state-level ASCs. Systems to collect data on learning outcomes on a regular basis are not in place. The challenge appears to be more with the absence of data rather than trust in it.
7. Civil society groups have the capacity to monitor education service delivery, based on outcome, at state level.
Does not hold. Does not hold as civil society groups have the capacity to monitor education service delivery, based on outcome, at state level but do not have a role in such monitoring. Also, not possible since adequate and realistic outcome targets have not been defined and the data that would allow their monitoring do not exist.
8. Parents and communities have the capacity to monitor education service delivery, based on outcomes.
Uncertain. Evidence on the degree to which this exists across the states is missing.
9. Grants and increased national and state-level financing are sufficient to support required improvements
Uncertain. The education sector challenges are significant and the range of issues to address are wide, so this assumption itself assumes that these have been prioritized, but the ESPs at state level are not prioritized and the ESPs are not used by federal government or DPs to prioritize what they fund or to assess effectiveness.
10. GPE has sufficient leverage to influence domestic and international education sector financing.
Does not hold. No evidence that GPE has influenced funding decisions by either international or national DPs. Possibly the main influences on future funding are likely to be (a) the 2013 Nigeria transition to lower middle-income status (for international DPs) and (b) economic growth (in terms of the size of financial transfers from federal to state level, given that the size of transfers is mainly set as a mandatory percentage of the federal budget).
11. The combination of GPE and partner outputs will result in the policy influence and capacity necessary for education management at the federal and state levels to achieve outcomes and impacts.
Does not hold. No mechanism to allow engagement/dialogue at state level on policy choices and current focus on capacity development for sector management within the ESPIG is modest. No evidence that AESPRs have been discussed by the key stakeholders and used to enhance mutual accountability for delivery of the ESPs at state level.
At federal level, lack of a functioning LEG in late 2015–early 2018 has limited opportunity to engage on policy level with either other DPs or federal government.
12. Outputs are relevant to partners and federal/state governments to sustain the partnership and achieve impacts.
Uncertain. Modest level of evidence collected/found in secondary data that this assumption. Interviews with stakeholders in two of the five states indicate that outputs are seen as useful and relevant but GPE support seen as modest in scale relative to needs.
13. There is sufficient political will at federal and state levels to improve education systems.
Uncertain. No evidence collected/found in secondary data to test this assumption.
14. Partnership outputs are coherent. Uncertain. Weaknesses in the ESPs, in terms of being robust and
credible plans, allied with the challenges of coordination between the key stakeholders, would suggest achieving coordination would be challenging but evidence directly showing a lack of coherence has not been found. Documentation related to the design of NIPEP does not directly examine this issue.
15. Public sector duty bearers want education service No evidence collected/found in secondary data to test this
assumption.

68 NIGERIA ANNUAL REPORT YEAR ONE
© UNIVERSALIA
delivery impact and are willing to change.
16. There are sufficient financial resources to implement state-level ESPs.
Does not hold. The opinion of stakeholders is that resources are insufficient.
17. There is sufficient alignment across partner activities at the state level.
Does not hold. No evidence of institutional systems being in place that would allow discussion of such alignment. If general practice was followed, this would have been done based on results from the AESPRs and discussion by the partners about what needs to be adjusted. There is no evidence that AESPRs are being used for this purpose.
18. State-level governments have the capacity and financial resources to continue to implement their ESPs.
Does not hold. Implementation of the ESPs is mainly contingent on financial transfers from the federal government.
19. The required partner inputs are sufficient for GPE inputs to be effective at the state level.
Uncertain. The NIPEP mid-term review is generally positive about the effectiveness of GPE-supported outputs at school and community levels, but questions sustainability.
20. There are clearly delineated roles and responsibilities to produce data, report against data and use data to monitor implementation between and within the federal and individual state governments.
Does not hold. The challenge is that roles and responsibilities are fragmented between federal and state levels. No-one has data and evidence to allow an overview of the system as a whole.
21. Systemic issues within the education sectors in each state keep children out of school, reduce quality and increase inequality.
Holds. The structure of the present report does not allow presentation of the evidence but a review of both Nigerian and donor documentation provides evidence that this assumption holds.
175. The following table outlines each of the GPE contribution claims and assesses the plausibility of contribution, based on the evidence available at the point of drafting this first annual report.
Table 17 - Assessment of plausibility of contribution claims regarding GPE’s support in Nigeria
Contribution claim Assessment of plausibility
Claim A: ‘GPE (financial and non-financial) support and influence contribute to the development of government-owned, credible and evidence-based sector plans focused on equity, efficiency and learning.’
Not plausible. While GPE contributed both financially through the ESPDG funding, and technically through the support for the creation of planning task forces in each state, these inputs did not lead to plans that were credible or government-owned, and so this claim cannot be said to be plausible.
Claim B: ‘GPE (financial and non-financial) support for inclusive sector planning and joint monitoring contributes to mutual accountability for education sector progress.’
Not plausible. The ESPIG application process led to the creation of a LEG at the federal level, but did little to encourage dialogue or accountability at the state level, and this LEG was never a consistently active body. There has been some improvements in monitoring, with the improvement of the AESPR process, and first steps towards developing a LAS; however, there is no evidence that these tools are being used to promote mutual accountability, or evidence-informed policymaking.

NIGERIA FIRST ANNUAL REPORT 69
© UNIVERSALIA
Claim C: ‘GPE advocacy and funding requirements contribute to more and better financing for education in the country.’
Not plausible. No evidence was seen that GPE funding was attracting additional funding in Nigeria. Interviewed officials stated commitments to maintain extra funding for NIPEP priorities after the project closes, but no evidence was seen of this being actioned.
Claim D: ‘GPE (financial and non-financial) support and influence contribute to the effective and efficient implementation of sector plans.’
Possibly plausible but more evidence required. NIPEP activities contributed to the priorities set out in the state MTSSs, particularly in working towards improved access for female students. However, no effective monitoring data exist at the outcome level to measure the effectiveness of these activities. More data are needed to make this assessment. A lack of credible targets in the MTSSs makes it difficult to track progress in implementation.
Claim E: ‘The implementation of realistic evidence-based sector plans contributes to positive changes at the level of the overall education system.’
Not plausible. The absence of credible state education plans means that the progress made towards system-wide improvements cannot be directly attributed to the MTSSs, beyond in their role in setting broad policy priorities. There were no improvements visible in system-level factors such as pupil–teacher ratios and pupil–trained teacher ratios. Progress was noted in the development of the EMIS and LAS.
Claim F: ‘Education system-level improvements result in improved learning outcomes and in improved equity, gender equality and inclusion in education.’
Possibly plausible but more evidence required. The lack of reliable state-wide data on learning outcomes and access means that it was not possible to fully assess the plausibility of this claim.
Source: Authors’ elaboration
2.5 Available evidence at Year 1
176. Comprehensive literature and data reviews have been undertaken for the baseline report and first annual report. The availability and quality of documents and data has been assessed against the indicators in the evaluation matrix and each country-level question. In doing so, gaps in documentation and data were also identified, where relevant.
177. The in-country mission has provided an opportunity to collect further documentation and national data that were not available during the desk-based study. Further information has been received on planning, implementation and monitoring, and on the education system. Additional information on partner activities has also been used to supplement existing evidence.
Table 18 - Data availability and gaps for Year 1
Evaluation questions Document reviewed Data gaps
Country Evaluation Question (CEQ) 1: Has GPE contributed to education sector planning and sector plan implementation in Nigeria during the period under review? How?
• ESPs and education sector operational plans
• AESPRs for 2015 in three states • Consolidated report drawing on
2016 AESPRs in all five states • GPE grant agent reports and other
grant performance data • Secretariat reports, e.g. reports by
country lead back to office/mission • Grant Application Appraisal Reports • PAD
• The current MTSS for Kaduna State • Other relevant reports or reviews that
comment on the quality of previous sector plans
• AESPR for all five states for 2016 • Reports or studies on ESP/TEP
commissioned by other DCP and/or the DCP government
• CSO reports • National data (e.g. EMIS data)

70 NIGERIA ANNUAL REPORT YEAR ONE
© UNIVERSALIA
CEQ 2 Has GPE contributed to strengthening mutual accountability for the education sector during the period under review? If so, how?
• Minutes of federal steering committee meetings
• Minutes of beneficiary assessment reviews for the five NIPEP states
• Mid-term review of NIPEP activities by Sages Consult
• Back to office reports/ memos from the Secretariat
• The minutes of steering committee meetings received both at federal and state levels were not complete for the period under review, suggesting infrequency of these meetings
• Other documents on technical assistance/advocacy
• Education sector analyses • Minutes of states’ annual sector
review meetings
CEQ 3: Has GPE support had unintended/unplanned effects? What factors other than GPE support have contributed to observed changes in sector planning, sector plan implementation, sector financing and monitoring?
• Key Informant interviews • Media reports on changes in
relevant national contexts and implications for the education sector
• All data sources outlined for CEQs 1 and 2 above
• Donor priorities may be gleaned from program updates on their websites. However, these are usually retrospective and not prospective
• Documents illustrating changes in priorities pursued by (traditional/non-traditional) donors related to implications for Nigeria
• Relevant studies/reports commissioned by other education sector actors (e.g. donors, multilateral agencies) regarding nature/changes in their contributions and related results
CEQ 4 During the period under review, how has the education system changed in relation to: a) quality of
teaching/instruction b) evidence-based,
transparent decision- making
Country-specific areas of system strengthening for furthering equity and/or learning, and for ensuring effective and efficient use of resources
• NIPEP progress update report 2017 • Sages Consult mid-term review of
NIPEP activities • AESPR • ASC for Kaduna State • UIS data • PWC validation of disbursement
report
• The UIS data reported for Nigeria are national, while the NIPEP program is only focused on five north-western states
• Some of the figures for NER reported in states’ individual AESPR reports for 2015 are at odds with the figures reported in the NIPEP progress update report, which used data from the FMoE’s National Education Survey
• Learning assessments (EGRA/Early Grade Mathematics Assessment) data
• Public expenditure reports • ASC for Kano, Katsina, Jigawa and
Sokoto States
CEQ 5 How have changes in sector planning, plan implementation and mutual accountability contributed to observed changes at education system level?
• Sources as shown for CEQ 4 • Literature on good practices in education system domains addressed in country’s sector plan
• Education sector analyses
CEQ 6: During the period under review, what changes have occurred in relation to: a) learning outcomes
(basic education)? b) equity, gender
equality and inclusion in education?
• Combined AESPR for 2016 • Teacher Development Information System
• EMIS data • International and regional learning
assessment data

NIGERIA FIRST ANNUAL REPORT 71
© UNIVERSALIA
178. Focus areas where the evaluation team aims to source further data include the following:
• Evidence on learning outcomes from the UBEC survey for each of the five states, as well as the EGRA report planned for June 2019, trend analysis and any analysis available explaining observed trends in the five states.
• Education sector evaluation reports from international donor projects active in the five states. • The individual AESPRs from the five states covering 2016 and 2017 results. • Key informant interviews at state level covering both the planning and monitoring approaches
supporting the ESPs and the institutional challenges to using ESPs and aligning all partner support in support of delivery of credible ESPs.
• Key informant interviews at federal level focused on possible initiatives to better align federal and state-level support in the basic education sector.
• Review of operation of the reconstituted federal-level LEG.

72 NIGERIA ANNUAL REPORT YEAR ONE
© UNIVERSALIA
3 Evaluation focus 179. The key evaluation focus for the 2019 report will be to identify GPE’s contribution to education planning, financing, monitoring and dialogue, and sector plan implementation in order to support system change and improve learning outcomes, access, equity and inclusion. In addition to this, the evaluation hopes to identify areas where GPE inputs and the partnership can be strengthened, as well as aiming to capture any positive or negative unintended effects of GPE’s support. The key objective is to assess the relevance, efficiency and effectiveness of GPE inputs in Nigeria in light of the GPE Strategic Plan 2016–2020 and government strategy, e.g. Vision 2030.
3.1 Focus themes
180. The evaluation of GPE’s activities in Nigeria is complicated by the fact that GPE is not working with one government and the development/implementation of one ESP, it is working with five states with separate ESPs, as well as with the federal government. The key question for future evaluations will be how GPE is adapting itself to this situation. Currently, the evidence shows that GPE has not made significant adaptations to suit the Nigerian context, but with the application process for GPE 2 in 2019, it remains to be seen what changes to how GPE’s model is operationalized will be made, in order to reflect the context in Nigeria.
181. A second focus of the evaluation is on how GPE is leveraging funding in the five states. What emerged from this evaluation was that, in relative terms, the US$100 million is modest, and does not give GPE significant leverage to shape policy, or promote financial additionality. It remains to be seen whether GPE’s input is promoting financial additionality at the state or federal level. Of particular note will be the effect of the funding channel that GPE has chosen. By choosing to provide NIPEP funds through the SMoEs rather than the SUBEBs, has GPE changed the education funding ecosystem at state level? Has this had an effect on accountability, additionality or transparency in planning and reporting spending? This will become of further interest when World Bank BESDA funding comes into effect: this funding will be provided to UBEC and the SUBEBs.
182. The third focus theme for evaluation is how the GPE is shaping dialogue at the federal level and the state level. This will focus on intra-state dialogue, particularly how different state bodies (e.g., SUBEBs, SMoEs, CSOs, international DPs, etc.) interact with each other and collaborate on issues of planning, implementation and monitoring. It will also focus on inter-state and state/federal-level dialogue and knowledge sharing. This theme will address the issue of how GPE provides financial incentives and fora for productive dialogue and monitoring: for example, by the establishment of LEGs at the state and federal level, and the development of JSRs at the state level.
183. Cutting across these themes will be a continued assessment of GPE’s contribution in the context of a broader ecosystem. Considering the presence of other international DPs in all the GPE states, as well as government programs, and particularly the introduction of BESDA, which will operate in broadly the same focus areas in the same five states (among others), it will be important to keep a constant eye on untangling different contributions and realistically assessing the importance of GPE’s financial and non-financial contributions.
3.2 Gaps to fill
184. Table 18 in Section 2.5 shows serious gaps in the evidence available to the desk review in Year 1. This is particularly evident in the lack of outcome-level data from the state AESPRs. These data gaps mean that the evaluation can say little about the efficacy of state ESP outputs. This, combined with a

NIGERIA FIRST ANNUAL REPORT 73
© UNIVERSALIA
lack of learning assessments at the state level, means that it was not feasible to make any real assessments of the link from outputs through outcomes to impacts.
185. During the course of this evaluation it became clear that GPE in Nigeria is pushed, by the federal structure of education governance, to operate differently than other countries covered by the prospective evaluations. This conclusion shapes the evaluation focus for Year 2, but also means that there were gaps in the interview data collected in Year 1. In particular, the Year 1 evaluation failed to adequately address how GPE was shaping sector dialogue at the state level, and also how sector plans had been operationalized, and whether the process of planning had an impact on thinking in SMoEs. For Year 2, it will be important to reassess the interview questions in order to accurately reflect the nuances of GPE in Nigeria.
186. It was difficult to accurately assess the workings of GPE, and by extension the role that the grant agent and coordinating agent played. In comparison to other evaluations there was relatively little information available on the actions that GPE actors (particularly the Secretariat country lead, coordinating agency and grant agent) were engaged in. While there were some LEG meeting minutes available, they did not cover all meetings, and where they did exist they did not give sufficient detail on the focus of meetings, and particularly the role that GPE played in structuring and developing them.
3.3 Risks to address
187. Political risk: A key risk that may affect future prospective evaluations for Nigeria and the GPE contribution in the five states in general is the forthcoming elections scheduled during the first half of 2019. The period preceding elections is typically marked by a lull in the implementation of government programs as most politicians divert time and resources away from administration and towards election campaigning. Further, depending on the results of the election, there may be changes in key personnel in the education sector at both the state and federal levels.
188. Unavailable data: The inability to conduct reliable trend analysis poses a risk. This is due to the lack of a solid basis upon which to assess progress made in strengthening the overall education systems and changes in education outcomes in the five states, as well as GPE contributions along the ToC in each state.
3.4 Key steps
189. This report concludes the first phase of the evaluation (baseline situation plus first annual report), including the first four stages, as per the described methodology. Continuing from the country-specific work planning, data collection and elaboration of country-specific tools, the next phase will focus on assessing how progress is being made toward education goals and envisaged country-level intermediary outcomes.
190. The next phase will include:
Stage five: Assembling the contribution story and seeking additional evidence over time. Stage six: Revising and strengthening the GPE contribution story. Stage seven: Elaboration of the GPE contribution story.
3.5 Workplan
191. Key activities and dates for the remainder of this project are detailed in Table 19 below.

74 NIGERIA ANNUAL REPORT YEAR ONE
© UNIVERSALIA
Table 19 - Activities and key dates
DELIVERABLE DATE
Inception report November 2017
Baseline studies (desk review) April 2018
Country mission I Q1 2018
Eight prospective country missions and annual report (first year) June 2018
Calendar Year 18 synthesis report December 2018
Country mission II Q1 2019
Eight prospective country missions and annual report (second year) June 2019
Calendar Year 19 synthesis report December 2019 Source: Project workplan and timeline

NIGERIA FIRST ANNUAL REPORT 75
© UNIVERSALIA
4 Conclusions and recommendations 192. This section summarizes some of the key findings emerging from an extensive desk review and from stakeholder interviews with a range of key informants during the first country mission to Nigeria in April 2018. The aim of this prospective country-level evaluation report is to provide evidence of the situation at the baseline, plus progress since the baseline, relating to (i) GPE’s contributions to strengthening education systems and, ultimately, the achievement of education results within Nigeria in the areas of learning, equity, equality and inclusion; and hence (ii) the relevance, efficiency and effectiveness of GPE’s ToC and country-level operational model.
4.1 Conclusions
193. The GPE generic country-level ToC includes a number of assumptions on how and why GPE will add value beyond providing financial resources. The technical, political and administrative realities in Nigeria work against many of the assumptions underpinning the GPE ToC. The ability to leverage systems through the relatively small technical and financial inputs into the system is near extremely limited. As shown in Table 16 and Table 1 above, many of the assumptions for how and why these benefits are to be delivered have proven invalid in Nigeria. In addition, this is complicated further within a decentralized system. The overall conclusion is that the GPE model will not work in Nigeria without adaptation to align with the actual context at both Federal and state levels. Adaptation needs to be based on the reality that alignment and coordination between the various levels of government in Nigeria responsible for basic education suffer from a number of well understood limitations. While the barriers to systemic change remain an external factor, by focusing support for dialogue and monitoring at the federal level, no meaningful improvements have been made to improve mutual accountability at the state level – making inclusive planning and effective implementation very challenging. These limitations have meant that despite good intentions, in interviews representatives of several of the key international DPs were clear that their support had become projectized and they focused on achievements in their priority states. Coordination and alignment at the Federal level was missing, as was effective engagement with planning and decision-making institutions at the state level.
194. On the other hand, there is evidence that the ESPIG, delivered through NIPEP, is making a contribution in all five states. However, the lack of outcome-level evidence of educational sector performance will make it challenging to assess the actual level of contribution in each of the five states.
4.2 Recommendations
195. The closing date for NIPEP, which operationalizes the current GPE ESPIG, is the end of June 2019. As such, it does not make sense to make recommendations on how NIPEP is implemented, as there is not sufficient time remaining for them to be operationalized. The recommendations therefore focus on issues that experience to date suggests need to be addressed in the design and implementation of support under any new ESPIGs applied for. These recommendations include the following:
a) Future GPE engagement in Nigeria should start with a clear understanding of which aspects of GPE’s standard model can work in the Nigerian context and which need to be adapted, as well as whether these adaptations are feasible. Future engagement should focus on promoting mutual accountability at the state level, and should focus on developing the structures to build meaningful dialogue between state-level actors and supporting international DPs/CSOs around

76 NIGERIA ANNUAL REPORT YEAR ONE
© UNIVERSALIA
improving planning from the bottom up. This does not imply a change to the fundamentals of GPE’s model, but rather a change in how it is applied in Nigeria.
b) If the current structure is to be maintained then the role and added value of a federal-level LEG needs to be clearly identified and incentives for its continued operation during implementation of the ESPIG identified and built upon. The decision not to create state-level LEGs should be revisited for any new ESPIG and, if these are not created, it needs to be made clear how this role would be fulfilled in their absence (and how it would be feasible to implement this). The current ESPIG has been designed with little investment in dialogue and engagement at the level of the individual states. If sector-level dialogue is important, sufficient resources should be allocated to supporting it in any future ESPIG.
c) The GPE model starts with an assumption that there is a government-owned and evidence-based ESP that can be used as the basis for alignment, coordination and mutual accountability between key stakeholders. In the Nigerian context, it is questionable whether this assumption can be fully operationalized, given the challenges of relations between federal and state layers of government responsible for various aspects of basic education in Nigeria. The GPE also does not have the leverage to change this context and therefore needs to work within it and work with other DPs to develop a coherent and synergistic approach to addressing these challenges. Logic would suggest starting by examining how the three main DPs – the World Bank, DFID and USAID – are approaching this and ensure that any successor to NIPEP reflects what was learned and so create such synergies.
d) AESPRs add little value if they are not used. Future support should therefore be conditional on having a feasible approach to enhancing their use. Such approaches are generally more effective when they start by first asking how better evidence-based, and useful, AESPRs would help the individual stakeholders meet their own specific needs.
e) The lack of data and evidence is a significant challenge for evidence-based investment and adaptation in the basic education sector. Responsibility for carrying out ASCs lies at the state level and has been routinized, and so improvement can be supported by ESPIG support directly to the individual state levels. On the other hand, MLA has been designated as a statutory responsibility of the Department for Educational Planning, Research, and Development of the FMoE, but the exercise is far from being institutionalized across the states. Future direct support through an ESPIG to fill this gap will therefore not address the issue that such assessments are not institutionalized and hence will likely not have a sustainable impact. Design of a future ESPIG therefore needs to include consideration of (a) why such assessments are not institutionalized; (b) whether there are already realistic plans in place that will address that lack of institutionalization; and (c) if not, what the best use of ESPIG resources and GPE wider support might be to address these challenges.
f) Work to address the fact that there is no verified consolidated information on public expenditure allocated to and effectively spent on basic education in Nigeria, which prevents an informed evaluation of financial resource mobilization, is also something that cannot be easily addressed at the state level. Logically, this should be addressed by the federal-level LEG. It will be of interest for this evaluation to see if this is something that is integrated into a potential future ESPIG application.

NIGERIA FIRST ANNUAL REPORT 77
© UNIVERSALIA
Annexes Annex A Background to the GPE country-level evaluation and
stakeholder mapping
Background 197. GPE is the only global fund solely dedicated to education in developing countries. Established in 2002, it is a multi-stakeholder partnership and funding platform that aims to strengthen education systems in developing countries to increase the number of children who are in school and learning. GPE brings together developing countries, donors, international organizations, civil society, teachers’ organizations, the private sector and foundations.
198. GPE works closely with partner countries to help them develop and implement quality ESPs. At the national level, GPE convenes all education partners in a collaborative forum, the LEG, which is led by the ministry of education. The LEG participates in the development, implementation, monitoring and evaluation of ESPs and programs. A coordinating agency is selected among its members to facilitate the work of the LEG. Additionally, a grant agent is chosen by the government, and approved by the LEG, to oversee the implementation of GPE grants.
199. GPE’s country-level approach is set out in a series of Country-Level Process Guides. GPE supports DCPs through financial and non-financial support, though the following: • ESPDGs: support the development of national ESPs, and are complementary to government and
other development partner financing. • Program Development Grants: support the development of an ESPIG program proposal. • ESPIGs: support the implementation of national ESPs. • CSEFs: support civil society engagement in education sector policy, planning, budgeting and
monitoring. • Global and Regional Activities program: engages education stakeholders in researching and
applying new knowledge and evidence-based practices to resolve education challenges.
200. GPE adopted as its vision the new Global Goal for education, SDG4, which aims to ‘ensure inclusive and equitable quality education and promote lifelong learning opportunities for all’ by 2030. In June 2016, the GPE Strategic Plan 2016–2020 aligned its vision and mission to the SDGs, and recognized that education is pivotal to the achievement of all of the other SDGs. It also articulated this vision in actionable goals, as well as both country and global objectives.
201. The GPE Strategic Plan 2016–2020 adopted an M&E strategy for the 2016–2020 period. This includes a results framework for monitoring progress across three goals and five strategic objectives in GPE’s ToC, and a set of 37 indicators. The strategy includes linked evaluation studies, including programmatic, thematic, and country-level evaluations, which in combination will inform a summative 2020 evaluation on the entire GPE portfolio.
202. There are three key evaluation questions for the GPE country-level evaluations (both the prospective and summative evaluation streams), which are presented below.
Annex Box 1 - Key Evaluation Questions
Key Evaluation Question 1: Has GPE’s support to the country contributed to achieving country-level objectives related to sector planning, sector plan implementation, sector dialogue and monitoring, and more/better financing for education? If so, how?

78 NIGERIA ANNUAL REPORT YEAR ONE
© UNIVERSALIA
Key Evaluation Question 2: Has the achievement of country-level objectives contributed to making the overall education system in the reviewed country/countries more effective and efficient?
Key Evaluation Question 3: Have changes at education system level contributed to progress toward impact?
Stakeholder mapping 203. The assessment of the ToC underpinning GPE’s support to Nigeria is based on Key Informant Interviews (KIIs), secondary review of documents and data and the wider evidence base. KIIs were undertaken with key stakeholders in Nigeria in April 2018. The assessment also makes use of a document review of secondary data sources and literature. Over the lifecycle of the evaluation, the stakeholder mapping will be reviewed and updated. Changes in interest and influence will likely indicate a change in political economy.
204. One of the major challenges in Nigeria’s education system is that responsibilities for implementing policies are fragmented between different stakeholders. For example, there are often duplications in role among the federal and state governments due to the presence of education on the concurrent legislative list. In addition, UBEC was designed as a finite intervention fund to help push the basic education agenda. At the moment however, UBEC still plays an enormous role in the funding of basic education with some levels of opaqueness in role between state ministries of education and state universal basic education boards.
205. Annex Table 1 below illustrates the categories of informants that were consulted during the First Annual Mission to Nigeria. The last two columns depict our evaluation of the interest in and influence of these stakeholders as regards the programs receiving GPE support and being evaluated, and the importance of these stakeholders in the current evaluation.
Annex Table 1 - Stakeholder mapping for Nigeria
Category Stakeholder Interest in and influence on programs receiving GPE support in country
Importance for evaluation
Federal level
GPE Secretariat Country lead High/high High
Other key Secretariat staff High/high High
Federal government Federal MoE High/High High
UBEC High/Medium High
IDPs World Bank (current grant agent)
High/High High
DFID High/Medium High
UNICEF High/Medium High
USAID High/Medium High/Medium
Civil society CSACEFA High/Low Low
FPSU High/High Medium

NIGERIA FIRST ANNUAL REPORT 79
© UNIVERSALIA
Category Stakeholder Interest in and influence on programs receiving GPE support in country
Importance for evaluation
NIPEP oversight/management
NIPEP Secretariat High/High High/High
State level
State government level State MoE High/Low High
SUBEB High/Low High
IDPs DFID High/Medium High
UNICEF High/Medium High
USAID High/Medium Medium
Local Government Authority
Local government LGEA Medium/Low Low
School governance SBMC Medium/Low Medium
Beneficiaries Teachers Low/Low Low
Students Low/Low Low
Parents Low/Low Low
Source: Prepared by the authors

80 NIGERIA ANNUAL REPORT YEAR ONE
© UNIVERSALIA
Annex B Nigeria GPE program details and timeline
GPE engagement during the evaluation period
206. During the evaluation period (2018–2020), GPE engagement will largely consist of NIPEP which operationalizes the first ESPIG, in the value of US$100.7 million. The World Bank is the grant agent and USAID is the coordinating agency. This grant became effective on July 8, 2015, and is due to be closed by June 31, 2019. The project has the following components:
• Component 1: Promoting School Effectiveness and Improved Learning Outcomes
(estimated total cost: US$42 million). Project activities envisioned under Component 1 include the provision of school grants for student and school materials; teacher development in primary and pre-primary schools. The objective of this component is to improve the effectiveness of schools, and in so doing, encourages pupils to enroll and stay in school. These ends will be achieved by promoting school-level resourcing, decision-making with measures to promote increased accountability. The provision of resources to primary and pre-primary education will focus on interventions that target improved teaching and learning in reading, literacy and numeracy.
Sub-component 1(a) - School Improvement Grants to Primary Schools (estimated total cost US$22 million). Sub-component 1(a) provides all eligible primary schools in the five NIPEP states with a School Improvement Grant (SIG) through a decentralized mechanism for non-salary related expenditures to improve school learning and teaching. The grant will be channeled to school’s bank accounts for the procurement of materials for students in support of improved access, retention and learning. Approximately 16,000 primary schools will be supported in the NIPEP states, and that, on average, 10 percent of registered Integrated Islamiyah schools that satisfy the eligibility criteria for SIG will benefit from GPE support. A SIG manual has been developed to guide the school grant process and forms part of the Project Implementation Manual (PIM). Sub-component 1(b) - School Improvement Grants to Pre-Primary Schools (estimated total cost US$7 million). Sub-component 1(b) will provide SIGs to schools with established pre-primary classrooms to support teaching and learning activities, and the procurement of materials and resources for pre-primary education. Pre-primary SIGs will be channeled to school accounts and will be eligible for expenditures related to pre-primary education only. The administration of pre-primary SIGs will follow the same procedures as subcomponent 1(a), in line with the provisions articulated in the SIG manual. Approximately 10,800 schools will receive support through the pre-primary grant. Sub-component 1(c) – Support to Teachers Professional Development (estimated total cost US$13 million). Sub-component 1(c) will support the cost of training and materials for state-led interventions to develop the skills of primary school teachers, mentor teachers and head teachers in the core areas of reading, literacy and mathematics. These initiatives already receive technical support from IDPs and receive additional funding from federal interventions (UBEC Teacher Professional Development funds) and state funds. Funds distributed under this sub-component will be channeled through the SUBEBs and LGEAs. Each state has an active teacher development program that will be scaled up to reach all teachers delineated in their MTSSs. It is estimated that at least 96,955 teachers’ scholarships will benefit from activities delivered under this sub-component

NIGERIA FIRST ANNUAL REPORT 81
© UNIVERSALIA
• Component 2: Increasing Access to Basic Education for Out-of-School Girls (estimated total cost: US$40 million). The objective of this component is to expand access to basic education for female students, and promote gender equality.
Sub-component 2(a) – Girls’ Access to Primary Education (estimated total cost US$30 million). Sub-component 1(a) will focus on increasing the demand for girls’ education through the provision of scholarships to households to encourage the enrolment of girls in lower primary schools. NIPEP will support 87,000 girls through state specific scholarship schemes. Sub-component 2(b) – Scholarships for Female Teachers (estimated total cost US$4 million). Sub-component 2(b) will increase the supply of qualified female teachers by providing scholarships to approximately 11,000 female teachers to upgrade their qualifications to the NCE. Sub-component 2(c) – Community Mobilization and SBMC Training (estimated total cost US$6 million).16 Activities to be delivered in support of sub-component 2(c) will provide capacity-building and operational support to LGEAs and school-level stakeholders. The sub-component will target gender advisors, Social Mobilization Officers (SMOs), School Support Officers (SSOs), SBMCs, and school staff. Interventions will focus on issues affecting enrollment and girls’ retention, and ensure that SIG-supported activities are designed and implemented with due regard for gender sensitivity. Activities will also support systematic sensitization, outreach campaigns, and the mapping of communities to encourage families to send their children (especially girls) to school and keep them in school. Moreover, at a minimum, 12,000 SBMCs will receive training to ensure effective grant management and the planning of activities, as well as familiarity with governance and benchmarking frameworks for schools and SBMCs. The bank accounts of beneficiary SBMCs will be audited to ensure compliance and transparency.
• Component 3: Strengthening Planning and Management Systems including Learning
Assessment and Capacity Development (estimated total cost: US$18 million). The objective of this component is to ensure the effective coordination, monitoring and supervision of project activities, and the provision of technical support and capacity building through the provision of funds to support operating costs and short and long-term consultancy services for state and federal governments. Component 3 provides resources for technical assistance (TA), independent third-party monitoring, operational costs, training, policy research, the delivery of learning assessments and funding for SUBEB-LGEA monitoring activities.
Sub-Component 3(a) – Management and Implementation Support (estimated total cost US$9 million). Sub-component 3(a) will provide resources for TA and capacity building to the FMOE, and its implementing agencies, to fund key operational costs related to the management, monitoring and supervision of NIPEP activities, including procurement and financial management (FM). Activities to be supported will include: (i) coordination activities and state monitoring visits; (ii) implementation of capacity strengthening interventions for key agencies to ensure effective quality assurance and reporting, including the delivery of technical audits and annual reviews; and (iii) third party monitoring to validate and support analysis of project performance and implementation. Activities supported under this sub-component are expected to include: the provision of TA and studies to support policy reform, including an annual assessment of improvements to infrastructure as well as financial and cost management reviews for mainstreaming integrated Islamiyah and pre-primary schools into basic education service delivery. Sub-component 3(b) – Monitoring, Evaluation and Learning Assessment (estimated total cost US$9 million). Sub-component 3(b) will provide resources for M&E activities, and support capacity building of SUBEBs and LGEAs for monitoring and evaluation, data analysis,

82 NIGERIA ANNUAL REPORT YEAR ONE
© UNIVERSALIA
and the implementation of learning assessments. SUBEBs will support LGEA operational activities such as routine school visits, and provide supportive supervision and monitoring. Interventions delivered under this sub-component will measure changes in the learning outcomes of benefiting schools, including the production of EGRA surveys in 2017 and 2018, building on a baseline assessment undertaken in 2014. EGRA activities will establish a standardized system of student learning measurement in Hausa and English, and support the development of teachers’ skills to improve the quality of teaching. Sub-component 3(b) will finance the provision of training and goods to strengthen the government’s Education Management Information System (EMIS) and data analysis capacity, as well as the dissemination of education publications including annual reviews, semi-annual implementation progress reports, semester Financial Management Reports (FMRs), a midterm review (MTR), and a project completion report. This component will support the development of a national strategy for the integration, scaling up and enhanced implementation of activities to mainstream integrated Islamiyah schools and preprimary education into the public education system (K-12) and an associated policy strategy dialogue within states. Moreover, support will be provided to strengthen the National Learning Assessment (NLA) System to enable the validation of findings, improve data management and ensure consistent and comparable data for student learning achievement. Sub-component 3(b) will support the implementation of two Impact Evaluations (IEs) to assess the effectiveness of interventions delivering scholarships and SIGs, and provides resources for an annual school grant audit, to be undertaken by SUBEB, to capture the type of activities financed under this component and their impact on learning.

NIGERIA FIRST ANNUAL REPORT 83
© UNIVERSALIA
Annex C Evaluation tools
Annex Figure 1 - Prospective evaluations – Stages of the evaluation
7. Writing up the
contribution story.
Country-specific
work planning,
data collection
and analysis
1. Assessing data
availability and quality,
mapping the country-level theory
of change and
stakeholder mapping
2. Gathering
further evidence
on the country
theory of change
3. Mapping out country
stakeholders, data availability and foci across
countries
4. Assessing the theory of change
Assessing How Progress is
being madetowards
Education Goals and envisaged
Country Level Intermediary
Outcomes
5. Assembling the
contribution story and
seeking out additional
evidence over time
6. Revising and strengthening the contribu-
tion story.
Prospective evaluations
Baseline phase

84 NIGERIA ANNUAL REPORT YEAR ONE
© UNIVERSALIA
i. GPE Results Framework
Annex Table 2 - GPE 2016–2020 Results Framework – 1/10

NIGERIA FIRST ANNUAL REPORT 85
© UNIVERSALIA
[cont.] GPE 2016–2020 Results Framework – 2/10

86 NIGERIA ANNUAL REPORT YEAR ONE
© UNIVERSALIA
[cont.] GPE 2016–2020 Results Framework – 3/10

NIGERIA FIRST ANNUAL REPORT 87
© UNIVERSALIA
[cont.] GPE 2016–2020 Results Framework – 4/10

88 NIGERIA ANNUAL REPORT YEAR ONE
© UNIVERSALIA
[cont.] GPE 2016–2020 Results Framework – 5/10

NIGERIA FIRST ANNUAL REPORT 89
© UNIVERSALIA
[cont.] GPE 2016–2020 Results Framework – 6/10

90 NIGERIA ANNUAL REPORT YEAR ONE
© UNIVERSALIA
[cont.] GPE 2016–2020 Results Framework – 7/10

NIGERIA FIRST ANNUAL REPORT 91
© UNIVERSALIA
[cont.] GPE 2016–2020 Results Framework – 8/10

92 NIGERIA ANNUAL REPORT YEAR ONE
© UNIVERSALIA
[cont.] GPE 2016–2020 Results Framework – 9/10

NIGERIA FIRST ANNUAL REPORT 93
© UNIVERSALIA
[cont.] GPE 2016–2020 Results Framework – 10/10

94 NIGERIA ANNUAL REPORT YEAR ONE
© UNIVERSALIA
ii. Evaluation matrix Annex Table 3 - Evaluation matrix
MAIN EVALUATION QUESTIONS AND SUB-
QUESTIONS
INDICATORS MAIN SOURCES OF INFORMATION
ANALYSIS
Key Question I: Has GPE support to [country] contributed to achieving country-level objectives related to sector planning, sector plan implementation, sector dialogue and monitoring, and more/better financing for education?65 If so, how? CEQ 1: Has GPE contributed to education sector planning and sector plan implementation in [country] during the period under review? 66 How? CEQ 1.1 What have been strengths and weaknesses of education sector planning during the period under review?
• Extent to which the country’s most recent sector plan meets GPE/UNESCO IIEP appraisal criteria67 − Plan preparation process has been country-led, participatory and transparent − Plan constitutes a solid corpus of strategies and actions addressing the key
challenges of the education sector − Issues of equity, efficiency and learning are soundly addressed to increase
sector performance − There is consistency between different components of the sector plan − Financing, implementation and monitoring arrangements offer a good
perspective for achievement • Extent to which previous sector plans met current GPE or other (e.g. country-
specific) quality standards (if and where data are available) • Stakeholder views on strengths and weaknesses of (most recent and previous)
sector planning processes in terms of: − Leadership for and inclusiveness of sector plan preparation − Relevance and coherence of the sector plan
• Current and past sector plans (including from period prior to country joining GPE, if available)
• GPE ESP/TSP quality assurance documents
• JSR reports • Other relevant
reports or reviews that comment on the quality of previous sector plans
• Pre/post analysis (where data on previous policy cycles are available)
• Triangulation of data deriving from document review and interviews
65 OECD DAC evaluation criteria of relevance, effectiveness and efficiency. 66 The core period under review varies for summative and prospective evaluations. Prospective evaluations will primarily focus on the period from early 2018 to early 2020 and will relate observations of change back to the baseline established at this point. The summative evaluations will focus on the period covered by the most recent ESPIG implemented in the respective country. However, for selected indicators (and subject to data availability) the summative evaluations will look back up to five years prior to the country becoming a GPE member to conduct a trend analysis of relevant data. 67 GPE, UNESCO International Institute for Educational Planning. Guidelines for Education Sector Plan Appraisal. Washington and Paris. 2015. Available at: file:///C:/Users/anett/AppData/Local/Packages/Microsoft.MicrosoftEdge_8wekyb3d8bbwe/TempState/Downloads/2015-06-gpe-iiep-guidelines-education-sector-plan-appraisal.pdf

NIGERIA FIRST ANNUAL REPORT 95
© UNIVERSALIA
MAIN EVALUATION QUESTIONS AND SUB-
QUESTIONS
INDICATORS MAIN SOURCES OF INFORMATION
ANALYSIS
− Adequacy of sector plan in addressing equity, efficiency and learning issues − Timeliness of plan preparation processes
• Interviews
CEQ 1.2 What have been strengths and weaknesses of sector plan implementation during the period under review?
• Progress made toward implementing sector plan objectives/meeting implementation targets of current/most recent sector plan. (If data are available: compared to progress made on implementing previous sector plan)
• Extent to which sector plan implementation is fully funded (current/most recent plan compared to earlier sector plan if data are available)
• Stakeholder views on timeliness, effectiveness and efficiency of sector plan implementation, and on changes therein compared to earlier policy cycles, due to: − Extent to which plans are coherent and realistic − Implementation capacity and management − Funding − Other (context-specific)
• Current and past sector plans (including from period prior to country joining GPE, if available)
• DCP government ESP/TSP implementation documents, including mid-term or final reviews
• Relevant program or sector evaluations, including reviews preceding the period of GPE support under review
• JSR reports • Reports or studies
on ESP/TSP commissioned by other development partners and/or the DCP government
• CSO reports • Interviews
• Pre/post analysis (where data on previous policy cycles are available)
• Triangulation of data deriving from document review and interviews
CEQ 1.3 Has GPE contributed to the observed characteristics of sector planning? How?
a) Contributions through GPE ESPDG grant and related funding requirements: • ESP implementation data including JSRs
• Triangulation of data deriving from document

96 NIGERIA ANNUAL REPORT YEAR ONE
© UNIVERSALIA
MAIN EVALUATION QUESTIONS AND SUB-
QUESTIONS
INDICATORS MAIN SOURCES OF INFORMATION
ANALYSIS
a) Through the GPE ESPDG grant (funding, funding requirements)
b) Through other support (technical assistance, advocacy, standards, quality assurance procedures, guidelines, capacity building, facilitation, CSEF and ASA grants, and cross-national sharing of evidence/good practice)68
• ESPDG amount as a share of total resources invested in sector plan preparation. Evidence of GPE ESPDG grant addressing gaps/needs or priorities identified by the DCP government and/or LEG
b) Contributions through other (non-ESPDG-related) support: • Support directed at priority needs/gaps identified by the DCP government and/or
LEG • Support adapted to meet the technical and cultural requirements of the specific
context in [country] • Support aimed at strengthening sustainable local/national capacities for sector
planning or plan implementation • Stakeholder views on relevance and appropriateness of GPE technical assistance,
advocacy, standards, guidelines, capacity building, facilitation, CSEF and ASA grants, and knowledge exchange in relation to: − Addressing existing needs/priorities − Respecting the characteristics of the national context − Adding value to country-driven processes (e.g. quality assurance provided by
Secretariat)
• GPE grant agent reports and other grant performance data
• Secretariat reports, e.g. country lead back to office/mission reports
• GPE ESP/TSP quality assurance documents
• Other documents on technical assistance/advocacy
• Country-specific grant applications
• Interviews • Education sector
analyses • Country’s poverty
reduction strategy paper
review and interviews
• Where applicable: comparison of progress made toward ESPIG grant objectives linked to specific performance targets with those objectives without targets (variable tranche)
CEQ 1.4 Has GPE contributed to the observed characteristics of sector plan implementation? How?
a) Contributions through GPE ESPDG and ESPIG grants, related funding requirements and variable tranche (where applicable)
• Absolute amount of GPE disbursement and GPE disbursement as a share of total aid to education
• ESP implementation data, including JSRs
• GPE grant agent reports and other
• Triangulation of data deriving from document
68 Technical assistance and facilitation provided primarily through the Secretariat, the grant agent and coordinating agency. Advocacy can include inputs from the Secretariat, grant agent, coordinating agency, LEG, and GPE at the global level (e.g. Board meetings, agreed-upon standards). Knowledge exchange includes cross-national/global activities related to the diffusion of evidence and best practice to improve sector planning and implementation.

NIGERIA FIRST ANNUAL REPORT 97
© UNIVERSALIA
MAIN EVALUATION QUESTIONS AND SUB-
QUESTIONS
INDICATORS MAIN SOURCES OF INFORMATION
ANALYSIS
a) Through GPE ESPDG and ESPIG grants-related funding requirements and the variable tranche69
b) Through non-financial support (technical assistance, advocacy, standards, quality assurance procedures, guidelines, capacity building, and facilitation, and cross-national sharing of evidence/good practice)70
• Maximum allocation amounts and actual amount a country received from GPE through the fixed and/or the variable tranche and reasons for not receiving the total MCA
• Evidence of GPE grants addressing gaps/needs or priorities identified by the DCP government and/or LEG
• Progress made toward targets outlined in GPE grant agreements as triggers for variable tranche, compared to progress made in areas without specific targets (where applicable)
• Proportion of overall sector plan funded through GPE ESPIG • Proportion of textbook purchases planned under current/most recent sector plan
funded through GPE grant • Proportion of teachers trained under current/most recent sector plan funded
through GPE grant • Proportion of classrooms built under current/most recent sector plan funded
through GPE grant • Progress made toward objectives/targets outlined in GPE grant agreement
(where applicable: compare progress made in areas with specific targets as triggers for release of variable tranche compared to progress made in areas without specific targets)
• Timeliness of implementation of GPE grants (ESPDG, Program Development Grant, ESPIG)
• Grant implementation is on budget b) Contributions through non-financial support • GPE support aimed at strengthening sustainable local/national capacities for plan
implementation • Stakeholder views on relevance and appropriateness of GPE non-financial
support in relation to: − Addressing existing needs/priorities − Respecting characteristics of the national context
grant performance data
• Secretariat reports, e.g. country lead back to office/mission reports
• GPE ESP/TSP quality assurance documents
• Other documents on technical assistance/advocacy
• Country-specific grant applications
• Interviews • Education sector
analyses • Country’s poverty
reduction strategy paper
review and interviews
• Where applicable: comparison of progress made toward ESPIG grant objectives linked to specific performance targets with those objectives without targets (variable tranche)
69 Where applicable.

98 NIGERIA ANNUAL REPORT YEAR ONE
© UNIVERSALIA
MAIN EVALUATION QUESTIONS AND SUB-
QUESTIONS
INDICATORS MAIN SOURCES OF INFORMATION
ANALYSIS
− Adding value to country-driven processes (e.g. quality assurance provided by Secretariat)
CEQ 1.4 Has GPE contributed to leveraging additional education sector financing and improving the quality of financing? a) Leveraging of additional
finance from the government?
b) Leveraging of additional finance from other partners through the GPE multiplier funding mechanisms (where applicable)?
c) Leveraging of additional finance from other partners through means other than the multiplier funding mechanism?
d) Improvements in the quality of education finance (e.g. short-, medium- and long-term predictability, alignment with government systems)?
a) Leveraging additional finance from government • Changes in country’s public expenditures on education during period under
review (by sub-sector if available) b) Leveraging additional finance through multiplier funding • Extent to which country has achieved, maintained or exceeded 20 percent of
public expenditures on education during period under review • Amount received through the GPE multiplier fund (if applicable) c) Leveraging additional finance through other means • Amounts and sources of domestic resources mobilized through GPE advocacy
efforts (b and c): • Changes in relative size of GPE financial contribution in relation to other donor’
contributions • Trends in external and domestic financing channeled through and outside of GPE,
and for basic and total education, to account for any substitution by donors or the country government
• Changes in donor aid to country; extent to which GPE Program Implementation Grant-supported programs have been co-financed by other actors or are part of pooled funding mechanisms; Amounts and sources of non-traditional financing (e.g. private or innovative finance) that can be linked to GPE leveraging
d) Quality of education finance • Alignment of GPE ESPIGs with GPE’s system alignment criteria (including the 10
elements of alignment and the elements of harmonization captured by RF indicators 29, 30 respectively)
• Possible reasons for non-alignment or non-harmonization (if applicable)
• Interviews with national actors (e.g. ministry of finance, ministry of education, LEGs/ development partner groups)
• GPE data (e.g. grant documents, country commitments and disbursements, donor pledges and contributions)
• Creditor Reporting System of OECD DAC
• UIS data of UNESCO • National data (e.g.
EMIS, school censuses and surveys, National Education Accounts, JSRs, public expenditure reviews)
• Trend analysis for period under review
• Comparative analysis (GPE versus other donor contributions)
• Triangulation of quantitative analysis with interview data
CEQ 2 Has GPE contributed to strengthening mutual accountability for the education sector during the period under review? If so, how?
CEQ 2.1 Has sector dialogue changed during the period under review?
• Composition of the country’s LEG (in particular, civil society and teacher association representation), and changes in this composition during period under review
• Frequency of LEG meetings, and changes in frequency during period under review
• LEG meeting notes • JSRs or equivalent
from before and
• Pre-post comparison
• Triangulation of results of

NIGERIA FIRST ANNUAL REPORT 99
© UNIVERSALIA
MAIN EVALUATION QUESTIONS AND SUB-
QUESTIONS
INDICATORS MAIN SOURCES OF INFORMATION
ANALYSIS
• Stakeholder views on changes in sector dialogue in terms of: − Inclusiveness − Frequency, consistency, and clarity of roles and responsibilities − Relevance (i.e. perceptions on whether stakeholder input is considered for
decision-making) − Quality (evidence-based, transparent)
during most recent ESPIG period
• GPE sector review assessments
• ESP/TSP, and documents illustrating process of their development
• Back to office reports/memos from Secretariat
• Interviews
document review and interviews
• Stakeholder analysis and mapping
CEQ 2.2 Has sector monitoring changed?
• Frequency of JSRs conducted, and changes in frequency during period under review
• Extent to which JSRs conducted during period of most recent ESPIG met GPE quality standards (if data are available: compared to JSRs conducted prior to this period)
• Evidence deriving from JSRs is reflected in DCP government decisions (e.g. adjustments to sector plan implementation) and sector planning
• Measures in the current sector plan to strengthen sector monitoring (especially monitoring the quality of teaching and learning, equity, equality and inclusion) are implemented
• Stakeholder views on changes in JSRs in terms of them being: − Inclusive and participatory − Aligned to existing sector plan and/or policy framework − Evidence-based − Used for learning/informing decision-making
• LEG meeting notes • JSRs or equivalent
from before and during most recent ESPIG period
• GPE sector review assessments
• Grant agent reports • Back to office
reports/memos from Secretariat
• Interviews
• Pre/post comparison
• Triangulating the results of document review and interviews

100 NIGERIA ANNUAL REPORT YEAR ONE
© UNIVERSALIA
MAIN EVALUATION QUESTIONS AND SUB-
QUESTIONS
INDICATORS MAIN SOURCES OF INFORMATION
ANALYSIS
− Embedded in the policy cycle (timing of JSR appropriate to inform decision-making; processes in place to follow up on JRS recommendations)71
• Stakeholder views on extent to which current practices of sector dialogue and monitoring amount to ‘mutual accountability’ for the education sector
CEQ 2.3 Has GPE contributed to observed changes in sector dialogue and monitoring? How? a) Through GPE grants and
funding requirements b) Through other support72
a) Grants and funding requirements • Proportion of EMIS-related improvements outlined in current/most recent sector
plan funded through GPE grant b) Non-grant-related support • Support is targeted at issues identified as priorities by DCP government and/or
LEG • Support is adapted to meet the technical and cultural requirements of the
specific context in [country] • Support is aimed at strengthening local/national capacities for conducting
inclusive and evidence-based sector dialogue and monitoring a) and b) • Stakeholder view on relevance and appropriateness of GPE grants and related
funding requirements, and of technical assistance in relation to: − Addressing existing needs/priorities − Respecting characteristics of the national context − Adding value to country-driven processes (e.g. around JSRs)
• LEG meeting notes • JSRs or equivalent
from before and during most recent ESPIG period
• GPE sector review assessments
• Grant agent reports • Back to office
reports/memos from Secretariat
• Interviews
• Triangulation of the results of document review and interviews
CEQ 3: Has GPE support had unintended/unplanned effects? What factors other than GPE support have contributed to observed changes in sector planning, sector plan implementation, sector financing and monitoring?
71 Technical assistance and facilitation provided primarily through the Secretariat, the grant agent and coordinating agency. Advocacy – including inputs from the Secretariat, grant agent, coordinating agency, LEG and GPE at global level (e.g. Board meetings, agreed-upon standards). Knowledge exchange – including cross-national/global activities related to the diffusion of evidence and best practice to improve sector planning and implementation. 71 Criteria adapted from: GPE. Effective Joint Sector Reviews as (Mutual) Accountability Platforms. GPE Working Paper #1. Washington. June 2017. Available at: https://www.globalpartnership.org/blog/helping-partners-make-best-use-joint-sector-reviews 72 Technical assistance, advocacy, standards, quality assurance, guidelines, capacity building, facilitation and cross-national sharing of evidence/good practice.

NIGERIA FIRST ANNUAL REPORT 101
© UNIVERSALIA
MAIN EVALUATION QUESTIONS AND SUB-
QUESTIONS
INDICATORS MAIN SOURCES OF INFORMATION
ANALYSIS
CEQ 3.1 What factors other than GPE support are likely to have contributed to the observed changes (or lack thereof) in sector plan development, sector financing and plan implementation, and in sector dialogue and monitoring?
• Changes in nature and extent of financial/non-financial support to the education sector provided by development partners/donors (traditional/non-traditional donors including foundations)
• Contributions to sector planning, plan implementation, sector dialogue or monitoring made by actors other than GPE
• Changes/events in national or regional context(s) − Political context (e.g. changes in government/leadership) − Economic context − Social/environmental contexts (e.g. natural disasters, conflict, health crises) − Other (context-specific)
• Documents illustrating changes in priorities pursued by (traditional/non-traditional) donors with related implications for [country]
• Relevant studies/reports commissioned by other education sector actors (e.g. donors, multilateral agencies) regarding nature/changes in their contributions and related results
• Government and other (e.g. media) reports on changes in relevant national contexts and implications for the education sector
• Interviews
• Triangulation of the results of document review and interviews
CEQ 3.2 During the period under review, have there been unintended, positive or negative, consequences of GPE financial and non-financial support?
• Types of unintended, positive and negative, effects on sector planning, sector financing, sector plan implementation, sector dialogue and monitoring deriving from GPE funding (grants)
• Types of unintended, positive and negative, effects deriving from other GPE support
• All data sources outlined for CEQs 1 and 2 above
• Interviews
• Triangulation of the results of document review and interviews

102 NIGERIA ANNUAL REPORT YEAR ONE
© UNIVERSALIA
MAIN EVALUATION QUESTIONS AND SUB-
QUESTIONS
INDICATORS MAIN SOURCES OF INFORMATION
ANALYSIS
Key Question II: Has the achievement of country-level objectives73 contributed to making the overall education system in [country] more effective and efficient? CEQ 4 During the period under review, how has the education system changed in relation to: c) Quality of
teaching/instruction d) Evidence-based,
transparent decision-making
e) Country-specific areas of system strengthening for furthering equity and/or learning, and for ensuring effective and efficient use of resources
a) Quality of teaching/instruction • Changes in pupil/trained teacher ratio during period under review • Changes in equitable allocation of teachers (measured by relationship between
number of teachers and number of pupils per school) b) Evidence-based, transparent decision-making • Changes in number of education indicators that country reports to UIS during
period under review • Changes in whether country has quality learning assessment system within the
basic education cycle during period under review • Other, country-specific indicators illustrating changes in evidence-based,
transparent data collection, reporting and decision-making c) Indicators for specific areas of education systems strengthening, as outlined in
the country’s current sector plan, related to: • Sector management (e.g. changes in ministerial, district and/or school-level
management structures, guidelines, staffing, financing, and approaches to ensuring effective and efficient use of resources)
• Learning (appropriate and available education inputs, additional country-specific efforts to enhance the quality of teaching/instruction, e.g. through new/improved incentives for schools/teachers)
• Equity (removal of barriers to school participation for all learners; creating inclusive learning environments)
(a-c): Stakeholder perceptions of areas within the education system that have/have not changed during period under review
• EMIS • UIS data • World Bank data • Household survey
data • ASER/UWEZO other
citizen-led surveys • Grant agent
progress reports • Implementing
partner progress reports
• Mid-term evaluation reports
• GPE annual results report
• Appraisal reports • Public expenditure
reports • CSO reports • SABER database • Education financing
studies • Literature on good
practices in education system domains addressed in country’s sector plan
• Pre/post comparison of statistical data for periods under review
• Triangulation of the results of document review, with statistical data, interviews and literature on ‘good practice’ in specific areas of systems strengthening
73 GPE country-level objectives related to sector planning, plan implementation, and mutual accountability through sector dialogue and monitoring

NIGERIA FIRST ANNUAL REPORT 103
© UNIVERSALIA
MAIN EVALUATION QUESTIONS AND SUB-
QUESTIONS
INDICATORS MAIN SOURCES OF INFORMATION
ANALYSIS
• Interviews CEQ 5 How have changes in sector planning, plan implementation, and mutual accountability contributed to observed changes at education system level?
• The specific measures put in place as part of sector plan implementation address previously identified bottlenecks at system level
• Alternative explanations for observed changes at system level (e.g. changes due to external factors, continuation of a trend that was already present before current/most recent policy cycle, targeted efforts outside of the ESP)
• Stakeholder perceptions of reasons for observed changes
• Sources as shown for CEQ 4
• Literature on good practices in education system domains addressed in country’s sector plan
• Education sector analyses
• Country’s poverty reduction strategy paper
Key Question III: Have changes at education system level contributed to progress toward impact? CEQ 6: During the period under review, what changes have occurred in relation to: c) Learning outcomes (basic
education)? d) Equity, gender equality and
inclusion in education?
a) Learning outcomes: • Changes in learning outcomes (basic education) during period under review. • Changes in percentage of children under five years of age in [COUNTRY] who
have been developmentally on track in terms of health, learning and psychosocial well-being. Or changes in other early childhood care and education measures from country-level surveys
b) Equity, gender equality and inclusion: • Changes in proportion of children who complete (i) primary, (ii) lower-secondary
education • Changes in out-of-school rate for (i) primary, (ii) lower-secondary education • Changes in the distribution of OOSC (girls/boys; children with/without disability;
ethnic, geographic and/or economic backgrounds) • ESP sets Gender Parity Index/targets for (i) primary, (ii) lower-secondary
education • Extent to which these targets have been achieved • Stakeholder perceptions of extent of, and reasons for, impact-level changes
during period under review
• Sector performance data available from GPE, UIS, DCP government and other reliable sources
• Teacher Development Information System
• EMIS • National
examination data • International and
regional learning assessment data
• EGRA/EGMA data • ASER/UWEZO other
citizen-led surveys
• Pre/post comparison of available education sector data during period under review
• Triangulation of statistical data with qualitative document analysis and interviews

104 NIGERIA ANNUAL REPORT YEAR ONE
© UNIVERSALIA
MAIN EVALUATION QUESTIONS AND SUB-
QUESTIONS
INDICATORS MAIN SOURCES OF INFORMATION
ANALYSIS
(a and b): Additional country-specific indicators as outlined in current sector plan and/or related monitoring framework
• Grant agent and implementing partner progress reports
• Mid-term evaluation reports
• GPE annual results report
• Appraisal reports • Interviews
CEQ 7 Is there evidence to link changes in learning outcomes, equity, gender equality and inclusion to system-level changes identified under CEQ 4? What other factors can explain changes in learning outcomes, equity, etc.?
• Changes in country’s change trajectory related to learning outcomes, equity, gender equality and inclusion during period under review
• Additional explanations for observed changes in learning outcomes, equity, gender equality, and inclusion other than system-level changes noted under CEQ 4 and 5
• Stakeholder perceptions of extent of, and reasons for, impact-level changes during period under review
• Studies/evaluation reports on education (sub-)sector(s) in country commissioned by the DCP government or other development partners (where available)
• Literature on key factors affecting learning outcomes, equity, equality and inclusion in comparable settings
• Interviews
• Pre/post comparison of available education sector data during period under review
• Triangulation of statistical data with qualitative document analysis and interviews
• Weighing supporting and refuting evidence of GPE contributions to sector outcomes during period of review

NIGERIA FIRST ANNUAL REPORT 105
© UNIVERSALIA
iii. GPE ToC

106 NIGERIA ANNUAL REPORT YEAR ONE
© UNIVERSALIA
iv. Generic country-level ToC

NIGERIA FIRST ANNUAL REPORT 107
© UNIVERSALIA
Annex D People consulted
ORGANIZATION LAST NAME, FIRST NAME TITLE (AND DEPARTMENT) M/F
National Stakeholders
GPE Nigeria Dhar, Subrata GPE Country Lead M
NIPEP SPSC Waworo, Fati Jigawa State Project Coordinator
F
NIPEP SPSC Lawal, Halima Katsina State Project Coordinator
F
NIPEP SPSC Yabo, Aminu Musa Sokoto State Project Coordinator
M
NIPEP SPSC Nutta, Abdusshakur A. Kano State Project Coordinator M
NIPEP SPSC Datturu, Musa Kaduna State Project Coordinator
M
NIPEP FPSU Achede, Joseph National State Project Coordinator
F
NIPEP FPSU Olatunji-David, Folake National M&E Officer F
Teachers’ Registration Council Nigeria (TRCN)
Ezeankwukwe, Jacinta Assistant Director, Education Accreditation
F
Federal Ministry of Finance Onabanjo, Remi Director, Social Services M
Federal Ministry of Finance Lawal, Usman M
Federal Ministry of Education Mrs Aribaoye Director, Basic Education F
NERDC Unungu, Paul Director NERDC Board M
NERDC Otaru, Bernard Research Officer M
NERDC Madu, Samuel Research Officer M
Federal Education Quality Assurance Services
Mbaakaa, Jonathan Director M
UBEC Iro, Umar Director, Special Projects M
Development Partners, Donors and Private Sector
The World Bank Adekola, Olatunde Task Team Leader, Education M
DFID Eshoe Eigbike Education Advisor F
USAID O’Toole, Denise Education Office Director F
USAID Nura Ibrahim Education Program Manager F
USAID Olawale, Samuel Education Program Manager M
MacArthur Foundation Olaide, Oladayo Head, Nigeria Office M

108 NIGERIA ANNUAL REPORT YEAR ONE
© UNIVERSALIA
ORGANIZATION LAST NAME, FIRST NAME TITLE (AND DEPARTMENT) M/F
Civil Society
CSACEFA Kabiru, Amiru National Moderator M
CSACEFA Okafor, Tochukwu Member M State-Level Stakeholders (Kaduna and Sokoto)
NIPEP Sokoto SPSU Sabo, Aminu Musa State Project Coordinator M
NIPEP Sokoto SPSU Sani, Umar Member M
NIPEP Sokoto SPSU Amanana, A.B. Member M
NIPEP Sokoto SPSU Salisu, Ibrahim Member M
NIPEP Sokoto SPSU Gacadian, Mamuda Deputy Project Coordinator M
NIPEP Sokoto SPSU Haruna, Aliyu Member M
NIPEP Sokoto SPSU Abubakar, Maimuna Member F
NIPEP Sokoto SPSU Umar, Husaina Member F
NIPEP Sokoto SPSU Abdumalik, Ahmad Member M
NIPEP Sokoto SPSU Auwal, Ibrahim Member M
NIPEP Sokoto SPSU Garba, Yusuf Member M
NIPEP Sokoto SPSU Mulid, Sambo EMIS and Communications M
Sokoto State Ministry of Education
Madawaki, Aisha Honourable Commissioner F
Sokoto State Ministry of Education
Abubakar, Muhammad Sambo
M
Sokoto SUBEB Bello, Yusuf Executive Chairman M
Sultan Maiturare Nizzamiyya Primary School
Kabiru, Mohammhed Headmaster M
Sultan Maiturare Nizzamiyya Primary School SBMC
Mohammad Shehu Chairman M
Sultan Maiturare Nizzamiyya Primary School SBMC
Sambo Aliyu Member M
Sultan Maiturare Nizzamiyya Primary School SBMC
Badamasi Buda Member M
Sultan Maiturare Nizzamiyya Primary School SBMC
Musa, Mansura Member; Women Leader F
Sultan Maiturare Nizzamiyya Primary School
Abdullahi, Aminu Teacher M
Sultan Maiturare Nizzamiyya Primary School
Murtala, Jekada Teacher M
Sultan Maiturare Nizzamiyya Primary School
Tukor, Umar Teacher F

NIGERIA FIRST ANNUAL REPORT 109
© UNIVERSALIA
ORGANIZATION LAST NAME, FIRST NAME TITLE (AND DEPARTMENT) M/F
Sultan Maiturare Nizzamiyya Primary School
Alheri, Hauwau Teacher M
Sultan Maiturare Nizzamiyya Primary School
Ubaidah, Isah Teacher M
Sultan Maiturare Nizzamiyya Primary School
Abdulah, Aisha Teacher F
Sultan Maiturare Nizzamiyya Primary School
Nabila Pupil F
Sultan Maiturare Nizzamiyya Primary School
Namira Pupil F
Sultan Maiturare Nizzamiyya Primary School
Nana Bello Pupil F
Kaduna State Ministry of Education, Science & Technology
Salisu, A.Y. Director, Planning, Research & Statistics
M
Kaduna State Basic Education Board (SUBEB)
Aminu, Ibrahim Acting Director, Socail Mobilization
M
Kaduna State Basic Education Board (SUBEB)
Halima Mohammad Director, School Services F
Kaduna State Ministry of Education, Science & Technology
Sani, Jaafam I Honorable Commissioner M
Kaduna State Ministry of Education, Science & Technology
Bage, Kande Nana Permanent Secretary F
Kaduna State Ministry of Education, Science & Technology
Dahuru, Musa Kaduna State NIPEP Project Coordinator
M
Kaduna State Ministry of Education, Science & Technology
Jimoh, Musa EMIS Officer M
Lifeline Education Centre Aliu, Ahamad Tijani Director M
Civil Society Organisation Dikko, Hauwa F
Sheik Gumi Model Pry School Tiwada, Kaduna
Larai, Salamatu Salisu Head Teacher F
Sheik Gumi Model Pry School Tiwada, Kaduna
Ibrahim, Salisu Teacher M
Maiduguri Road Pry School, Kaduna
Hassan, Jibring Head Teacher M
Maiduguri Road Pry School, Kaduna
Atabo, Grace Teacher F

110 NIGERIA ANNUAL REPORT YEAR ONE
© UNIVERSALIA
Annex E Interview guides
207. These guidelines are not intended as questionnaires. It will not be possible to cover all issues in all categories with all individuals or groups. The evaluation team members will use their judgment and focus on areas which are likely to add most to the team’s existing knowledge, while allowing interviewees and groups to highlight the issues that are most important to them.
208. The evaluators will formulate questions in a (non-technical) way that respondents can easily relate to, while generating evidence that is relevant to the evaluation questions that the evaluators have in mind.
i. Approach to interviews 1. Interviews will be a major source of information for this evaluation. These will be a means to
extract evidence, as well as to triangulate evidence drawn from other interviews and the document review, and will form part of the consultative process.
2. A stakeholder analysis, as presented in baseline report, will inform the selection of interviewees. Over the evaluation period the evaluation team aims to target a comprehensive range of stakeholders that fully represent all significant institutional, policy and beneficiary interests. The team will periodically review the list of those interviewed to ensure that any potential gaps are addressed and to prevent under-representation of key stakeholders.
1. All interviews will comply with the team’s commitment to the respective evaluation ethics (the work of the evaluation team will be guided by: OECD DAC Evaluation Quality Standards for Development Evaluation;74 UNEG Norms, Standards, Ethical Guidelines and Code of Conduct for Evaluation in the UN System;75 the World Bank’s principles and standards for evaluating global and regional partnership programs;76 ALNAP’s Evaluation of Humanitarian Action Guide;77 the Sphere Handbook and Standards for Monitoring and Evaluation;78 and Guidance on Ethical Research Involving Children.79)
3. Interviews will be conducted in confidence and usually on a one-to-one or one-to-two basis (to enable note-taking). Reports will not quote informants by name and will not include direct quotes where it could risk revealing the participant’s identity or attribution without prior consent.
4. A protocol and standard format for recording interview notes is presented below. This will be used for all interviews and will ensure systematic recording of details, while allowing for flexibility in the specific questions asked. Interview notes will be written up, consolidated into an interview compendium and shared among team members via the internal team-only e-library. To respect interviewee confidentiality, the interview notes will be accessible only to team members. The compendium of interview notes will facilitate analysis across all interviews and will enable searches on key thematic terms, initiatives and so on. This will maximize the analytical potential of interviews and the possibilities for triangulation.
74 http://www.oecd.org/development/evaluation/qualitystandards.pdf 75 http://www.uneval.org/document/detail/21 and http://www.uneval.org/document/detail/22 , http://www.uneval.org/document/detail/102 and http://www.unevaluation.org/document/detail/100 76 http://siteresources.worldbank.org/EXTGLOREGPARPROG/Resources/sourcebook.pdf 77 http://www.alnap.org/resource/23592.aspx 78 http://www.sphereproject.org/silo/files/sphere-for-monitoring-and-evaluation.pdf 79 http://childethics.com/
NIGERIA FIRST ANNUAL REPORT 111
© UNIVERSALIA
ii. Focus group discussions 5. The evaluation team may also make use of focus group discussions. Similar to the interview
guides, the sub-headings and discussion guide points used are linked to the areas of enquiry and evaluation questions set out in the evaluation matrix, and are intended as a guide only, for the evaluation team to follow flexibly in order to maximize its learning from each discussion group.
6. All focus group discussions will reflect with the evaluation team’s commitment to appropriate evaluation ethics (as referenced above).

112 NIGERIA ANNUAL REPORT YEAR ONE
© UNIVERSALIA
Annex F Additional budget data for 2015/16
Annex Table 1. 2016 and 2015 education budget allocations, actual releases and differences (Naira millions)
State 2016 allocation
2015 allocation
Difference 2016 release
2015 release
Difference
Jigawa 43,620 34,474 9,146 31,279 29,225 2,054
Kaduna 48,892 39,223 9,669 30,607 25,354 5,253
Kano 54,637 44,318 10,319 30,303 23,644 6,659
Katsina 33,203 24,182 9,021 25,384 21,799 3,585
Sokoto 47,951 23,065 24,886 13,852 16,640 -2,788
Annex Figure 1. Education budget allocations and releases for 2015/16 (Naira millions)
Annex Table 2. Proportion of state budgets spent on education for 2015/16
State 2016 percent of total state budget
2015 percent of total state budget
Jigawa 31.80 34.50
Kaduna 28.40 19.54
Kano 20.00 24.00
Katsina 22.00 22.00
Sokoto 38.31 23.00
Average 28.10 24.61
0
10,000
20,000
30,000
40,000
50,000
60,000
Jigawa Kaduna Kano Katsina Sokoto
2015 Allocation 2015 Release 2016 Allocation 2016 Release

NIGERIA FIRST ANNUAL REPORT 113
© UNIVERSALIA
Annex G NALABE 2011 mathematics and English data
Annex Table 3. Means and standard deviations for English scores in NALABE 2011 for five GPE states, as compared to national scores
English
P4 P5 P6 JS1 Mean SD Mean SD Mean SD Mean SD
National 54.04 21.77 60.38 21.92 60.02 19.84 47.66 18.08 Kaduna 42.13 20.05 38.44 14.36 45.95 20.32 31.3 12.17 Kano 53.03 20.84 54.83 19.01 57.93 15.63 36.94 15.06 Katsina 60.3 20.87 67.72 17.46 60.79 19.95 55.87 16.18 Jigawa 52.11 20.14 55.07 22.74 52.55 19.55 47.02 18.38 Sokoto 58.82 14.95 49.62 24.08 52.74 21.22 52.24 16.97
Annex Table 4. Means and standard deviations for mathematics scores in NALABE 2011 for five GPE states, as compared to national scores
Mathematics
P4 P5 P6 JS1 Mean SD Mean SD Mean SD Mean SD
National 51.63 20.07 50.36 17.47 52.94 19.2 41.08 17.78 Jigawa 55.3 19.66 50.69 17.33 56.85 16.65 47.82 18.6 Kaduna 43.36 17.44 42.52 16.6 37.5 16.97 27.14 8.79 Kano 49.61 20.68 50.28 19.12 55.46 17.62 39.99 19.34 Katsina 59.28 18.34 60.86 14.92 59.29 18.89 57.47 14.22 Sokoto 46.4 19.26 47.17 16.98 47.46 17.85 47.2 16.28

114 NIGERIA ANNUAL REPORT YEAR ONE
© UNIVERSALIA
Annex H GPIs
209. The following are two contrasting sets of GPIs for primary and JSS. The data from the NBS were taken down from their database after some figures were shown not to be accurate. The particular figures that were fact checked were for enrollment numbers at primary and pre-primary. As no reference can be found to check the veracity of the gender parity figures, and the source for doubting the other figures was in the news media rather than being from a reliable third party, they are presented here, in contrast with the figures taken from the consolidated AESPR. As neither have been independently verified, both must be considered unreliable.
Annex Table 5. NBS figures for primary enrollment by gender
Year 2014 2015 2016
State Male Female GPI Male Female GPI Male Female GPI
Sokoto 64 percent
36 percent .67 62
percent 38 percent .61 62
percent 38 percent .61
Katsina 58 percent
42 percent .72 58
percent 42 percent .72 56
percent 44 percent .78
Jigawa 57 percent
43 percent .75 57
percent 43 percent .75 56
percent 44 percent .78
Kaduna 54 percent
46 percent .85 53
percent 47 percent .88 53
percent 47 percent .88
Kano 51 percent
49 percent .96 50
percent 50 percent 1.00 50
percent 50 percent 1.00
Average 57 percent
43 percent
0.79 56 percent
44 percent
0.79 55 percent
45 percent
0.81
Annex Table 6. NBS figures for JSS enrollment by gender
Year 2014 2015 2016
State Male Female GPI Male Female GPI Male Female GPI
Jigawa 98 percent
2 percent .02 98
percent 2 percent .02 98
percent 2 percent .02
Sokoto 94 percent
6 percent .06 92
percent 8 percent .09 93
percent 7 percent .08
Katsina 91 percent
9 percent .10 91
percent 9 percent .10 89
percent 11 percent .12
Kano 85 percent
15 percent .18 85
percent 15 percent .18 87
percent 13 percent .15
Kaduna 76 percent
24 percent .32 52
percent 48 percent .92 84
percent 16 percent .19
Average 89 percent
11 percent 0.14
84 percent
16 percent 0.26
90 percent
10 percent 0.11

NIGERIA FIRST ANNUAL REPORT 115
© UNIVERSALIA
Annex Table 7. AESPR figures for primary/JSS GPI
State Primary JSS
2015 2016 2015 2016
Jigawa 0.84 0.88 0.70 0.82
Kaduna 0.92 0.96 1.08 0.85
Kano 0.98 1.00 0.83 0.45
Katsina 0.80 0.84 0.71 0.75
Sokoto 0.63 0.64 0.45 0.64
Average 0.83 0.86 0.75 0.70
Annex I Risks to the evaluation, quality assurance and ethics
i. Risks to the evaluation 1. The table below outlines the key anticipated risks and limitations as outlined in the risk management and contingency plan section of the inception report. It also puts forward the anticipated mechanisms to mitigate risks.
Annex Table 4 - Key anticipated risks and limitations, and proposed mitigation mechanisms
ANTICIPATED RISK AND CONSEQUENCES MITIGATION MECHANISMS
Delays in the timing of the 24 country visits Consequences: some country evaluation reports are submitted later than required to inform GPE strategy and impact committee and/or Board meetings, or to feed into the synthesis report. Likelihood: High
If full evaluation/progress reports are not yet complete, the evaluation team will provide the Secretariat with at least an overview of emerging key findings at the agreed-upon timelines that are linked to SIC and Board meetings or the submission of synthesis reports. The full reports will be submitted as soon as possible thereafter and will be reflected in subsequent synthesis reports in case important information was missed.
Conflict or fragility undermine the ability of our teams to conduct in-country data collection for summative or prospective evaluations Consequences: international consultants cannot conduct in-person data collection on the ground. Delays in conducting of site visits and of subsequent deliverables. Likelihood: Medium to high
Change timing of site visits, and postpone related deliverables. Change order in which 22 summative evaluations are conducted and/or make use of the contingency provision of two extra countries included in the sample for summative evaluations. Collect data from individual in-country stakeholders via email, telephone, Skype; use electronic survey to reach several stakeholders at once. Increase level of effort of national consultant(s) to ensure in-country data collection.
Interventions are not implemented within the lifecycle of the evaluation This constitutes a particular risk for the prospective evaluations. While a lack of implementation can create learning
If interventions are not implemented within the lifecycle of the evaluation, data on bottlenecks, barriers, contextual factors and the political economy will be able to shed light on why implementation did not take place and the extent to which such factors were within GPE’s control.

116 NIGERIA ANNUAL REPORT YEAR ONE
© UNIVERSALIA
ANTICIPATED RISK AND CONSEQUENCES MITIGATION MECHANISMS
opportunities in impact evaluations, such situations do not present value for money. Likelihood: Medium
Large data and evidence gaps Consequences: inability to conduct reliable trend analysis. Lack of a solid basis on which to assess country progress made in strengthening the overall education system and education outcomes, as well as GPE contributions along the ToC. Likelihood: Medium, but varying by country
Inclusion of data availability as a consideration in the sampling strategy. Work with the Secretariat and in-country stakeholders to fill data gaps. For prospective evaluations, if gaps identified at baseline cannot be filled, adjust the prospective evaluation focus to make the most of alternative data that may be available. Use of qualitative data – e.g. based on stakeholder consultations – to reconstruct likely baseline for key issues relevant for assembling the contribution story. Clearly identify data gaps and implications for data analysis in all deliverables.
Structure of available data is limiting To assess education sector progress, the evaluation team will use the best data available at country level. However, the format of available data may vary by country. For example, countries may use different criteria to define ‘inclusion’ in their data. This can pose challenges to synthesizing findings on GPE contributions in the respective area. Likelihood: Medium
As qualitative synthesis does not face the same limitations, we will mitigate this risk by describing differences in measurement criteria across countries.
Inaccessibility of in-country partners, resulting in incomplete datasets; limited triangulation; partners not fully seeing their views reflected in, and therefore rejecting, evaluation findings and forward-looking suggestions; increases in costs and time required for data collection; and delays in completing data collection and submitting deliverables. Likelihood: Medium
Reaching out to in-country stakeholders as early as possible before scheduled missions to explore their availability. Data collection via email, telephone, Skype, or through local consultants before or after site visits. Close collaboration with the Secretariat country lead and in-country focal point (e.g. coordinating agency) to identify and gain access to all key in-country stakeholders. Consult other individuals from the same stakeholder group if key envisaged informants are not available.
Being part of an evaluation changes the behavior of actors, independent of GPE support GPE partners within prospective evaluation countries may, involuntarily, perceive the prospective evaluation countries as showcase examples and increase efforts due to the evaluation. Likelihood: Medium to low
The evaluation team will review the performance data for the full set of GPE countries and see if the prospective evaluation countries have moved in their performance ranking over the lifecycle of the evaluation.
Evaluations (perceived to be) not sufficiently independent from the Secretariat Consequences: negative effects on credibility of evaluation findings and forward-looking suggestions in the eyes of key stakeholders. Limited use of evaluations to inform decision-
Findings, conclusions and forward-looking suggestions will be based on clearly identified evidence. Review of all draft deliverables by an Independent Technical Review Panel (ITRP).

NIGERIA FIRST ANNUAL REPORT 117
© UNIVERSALIA
ANTICIPATED RISK AND CONSEQUENCES MITIGATION MECHANISMS
making and/or behaviors of key stakeholders. Reputational damage for the Secretariat and consortium members. Likelihood: Medium to low
The evaluation team will incorporate feedback received on draft deliverables as follows: (a) factual errors will be corrected; (b) for other substantive comments, the evaluation team will decide based on the available evidence whether (and how) to incorporate them or not. If comments/suggestions are not accepted, the evaluation team will explain why.
Prospective country evaluation teams becoming excessively sympathetic to GPE or others through repeat visits This can result in overly positive reports that miss areas requiring constructive criticism. Likelihood: Medium to low
The internal, independent and external quality assurance mechanisms described in Section 4.3, as well as feedback received from the ITRP, will make it possible to identify any cases where prospective evaluation reports provide insufficient evidence for overly positive assessments.
Countries no longer willing to participate in, or wish to withdraw partway through, an (prospective) evaluation Consequences: an unbalanced sample of summative or prospective evaluations. Difficulty completing all eight prospective evaluations in a consistent manner. Likelihood: Medium to low
A transparent selection/sampling process. Early work with GPE country leads and in-country implementing partners to build support for all country-level evaluations. Early and ongoing direct engagement with senior decision-makers in DCPs to ensure that key stakeholders understand the nature and anticipated duration –especially of the prospective evaluations.
ii. Quality assurance 1. Our consortium is committed to providing high-quality reports to GPE. The Team Leader, working with the Itad coordinator, will play the principal role with respect to liaison and coordination with the Secretariat regarding quality assurance throughout the assignment. The table below provides an overview of our approach to ensuring the high quality of all deliverables submitted to the Secretariat.
Annex Table 5 - Quality Assurance
Prospective country
evaluations
• Internal quality assurance: Rachel Outhred and/or Stephen Lister will review (from drafting stage to finalization stage) all major outputs of country team leaders contracted by Itad or Mokoro for the prospective country evaluations. During finalization of reports, Rachel Outhred and Stephen Lister will ensure that feedback received from the Secretariat and the ITRP has been addressed.
• Independent quality assurance: will be provided by the Itad Quality Advisor, Sam MacPherson, an Itad Director external to the evaluation team, who will provide written comments on all major deliverables, once reviewed by Rachel Outhred or Stephen Lister.
• External quality assurance: will be provided through members of the Expert Advisory Panel, who will conduct a review of draft deliverables in parallel to reviews conducted by the Secretariat and the ITRP.
iii. Ethics 1. The members of our consortium abide by and uphold internationally recognized ethical practices and codes of conduct for evaluations, especially when they take place in humanitarian and conflict situations, and with affected and vulnerable populations.
2. For this evaluation the team has been guided by: OECD DAC Evaluation Quality Standards for Development Evaluation; UNEG Norms, Standards, Ethical Guidelines and Code of Conduct for

118 NIGERIA ANNUAL REPORT YEAR ONE
© UNIVERSALIA
Evaluation in the UN System; the World Bank’s principles and standards for evaluating global and regional partnership programs; ALNAP’s Evaluation of Humanitarian Action Guide; the Sphere Handbook and Standards for Monitoring and Evaluation; and Guidance on Ethical Research Involving Children.

NIGERIA FIRST ANNUAL REPORT 119
© UNIVERSALIA
Bibliography BudgIT (2018) Public Education Financing: Issues and Recommendations.
FMoE (2013) National Policy on Education.
FMoE (2018) 2016 Annual Education Sector Performance Review.
GPE and Nigeria Development Partner Group (2013) Appraisal of Education Sector Plans of Five States of the North West Region.
GPE and Nigeria Development Partner Group (2014) Reappraisal of Three-Year Plans of Five States of the North-West Region of Nigeria: Jigawa, Kaduna, Kano, Katsina, Sokoto.
Jigawa Ministry of Education (2013) Education Sector Plan 2013–2022.
Jigawa Ministry of Education (2013) Education Medium Term Sector Strategy 2015–2017.
Jigawa Ministry of Education (2013) Education Medium Term Sector Strategy 2018–2020.
Kaduna Ministry of Education (2018) Annual Education Sector Performance Review (2016).
Kaduna Ministry of Education (2006) Education Sector Plan 2006–2015.
Kaduna Ministry of Education (2013) Education Medium Term Sector Strategy 2015–2017.
Kano Ministry of Education (2009) Education Sector Plan 2009–2018.
Kano Ministry of Education (2013) Education Medium Term Sector Strategy 2015–2017.
Kano Ministry of Education (2017) Education Medium Term Sector Strategy 2018–2020.
Kano Ministry of Education (2018) Annual Education Sector Performance Review (2016).
Katsina Ministry of Education (2011) Education Sector Plan 2011–2020.
Katsina Ministry of Education (2013) Education Medium Term Sector Strategy 2015–2017.
Katsina Ministry of Education (2017) Education Medium Term Sector Strategy 2018–2020.
Nigeria: Sustainable Development Knowledge Platform (n.d.) Retrieved June 5, 2018, from https://sustainabledevelopment.un.org/memberstates/nigeria
Nigeria Partnership for Education Project (2017) National Progress Report of the Nigeria Partnership for Education Project (NIPEP) In Five Northern States of Nigeria.
Nigeria Partnership for Education Project (2017) Mid-Term Review of NIPEP Activities.
National Population Commission (2015) 2015 Nigeria Education Data Survey. National Demographic Household Survey 2008, National Planning Commission, Federal Republic of
Nigeria and ICF Macro (Maryland, USA), (November 2009). https://www.icirnigeria.org/nbs-pulls-down-misleading-education-statistics-after-fact-check-by-icir/
(accessed November 29, 2018).
Sokoto Ministry of Education (2011) Education Sector Plan 2011–2020.
Sokoto Ministry of Education (2013) Education Medium Term Sector Strategy 2015–2017.
Sokoto Ministry of Education (2017) Education Medium Term Sector Strategy 2018– 2020.
Sokoto Ministry of Education (2018) Annual Education Sector Performance Report (2016).

120 NIGERIA ANNUAL REPORT YEAR ONE
© UNIVERSALIA
Sokoto Ministry of Education (2018) Annual Education Sector Performance Report (2016).
World Bank (2017) Implementation Status and Results Report (p. 7, Rep. No. ISR 28235).
World Bank (2017) Nigeria Partnership for Education Project Mid-Term Review: Aide Memoire.
Price Waterhouse Cooper (2017) Nigeria Partnership for Education Project (NIPEP): Consultancy Services for Third Party Monitoring to Validate the Verification of 2015/2016 Disbursement of School Grants, Girls and Female Teachers Scholarships in Five States - Final Report.
UNESCO (2014) Good Policy and Practice in Health Education Booklet 9: Puberty Education & Menstrual Hygiene Management. Accessed November 2018 from: http://unesdoc.unesco.org/images/0022/002267/226792e.pdf