gps algebra unit 1: function families. function notation graphing basic functions function...
TRANSCRIPT
GPS Algebra
Unit 1: Function Families
Unit 1: Function Families• Function Notation• Graphing Basic Functions• Function Characteristics
Function Notation• Use and Purpose of Function Notation• Presentation of Functions in Tables, Mappings,
Graphs, and Algebraic Function Notation• Determining Whether a Relation is a Function• Introduction of Domain and Range
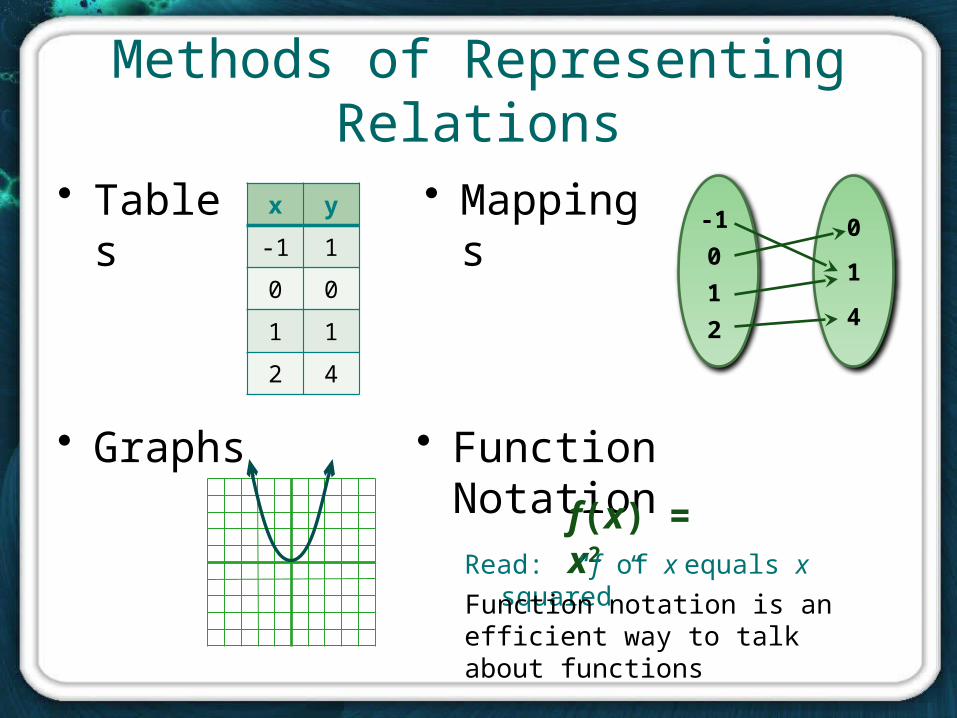
Methods of Representing Relations
• Tables • Mappings
• Graphs • Function Notation
x y
-1 1
0 0
1 1
2 4
-1
0
1
2
0
1
4
f(x) = x2
Read: “f of x equals x squared”
Function notation is an efficient way to talk about functions
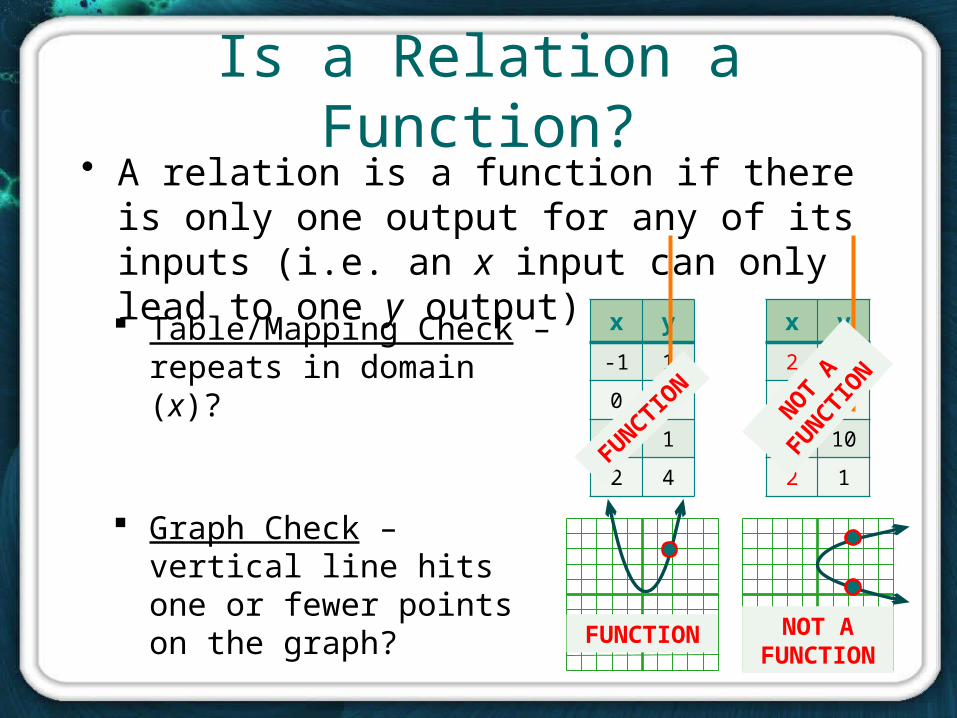
Is a Relation a Function?
Table/Mapping Check – repeats in domain (x)?
Graph Check – vertical line hits one or fewer points on the graph?
• A relation is a function if there is only one output for any of its inputs (i.e. an x input can only lead to one y output)
x y
-1 1
0 0
1 1
2 4
x y
2 8
3 6
5 10
2 1
FUNCTION NOT A FUNCTION
FUNCTION
NOT
A
FUNCTI
ON
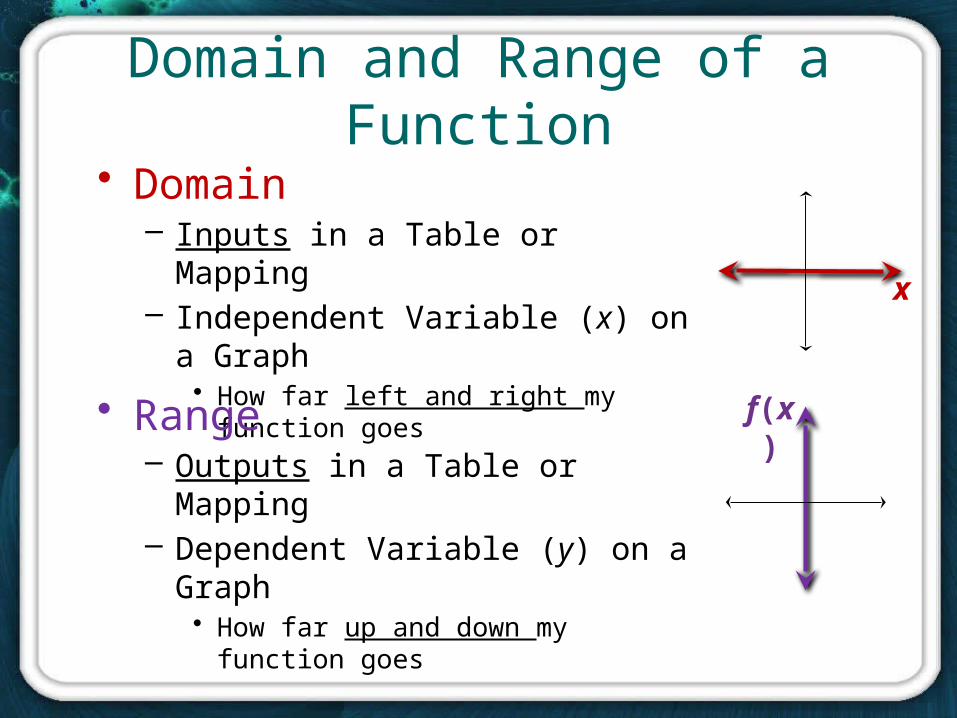
Domain and Range of a Function
• Domain– Inputs in a Table or Mapping– Independent Variable (x) on a Graph
• How far left and right my function goesx
f(x)• Range– Outputs in a Table or Mapping– Dependent Variable (y) on a Graph
• How far up and down my function goes
All Real #s
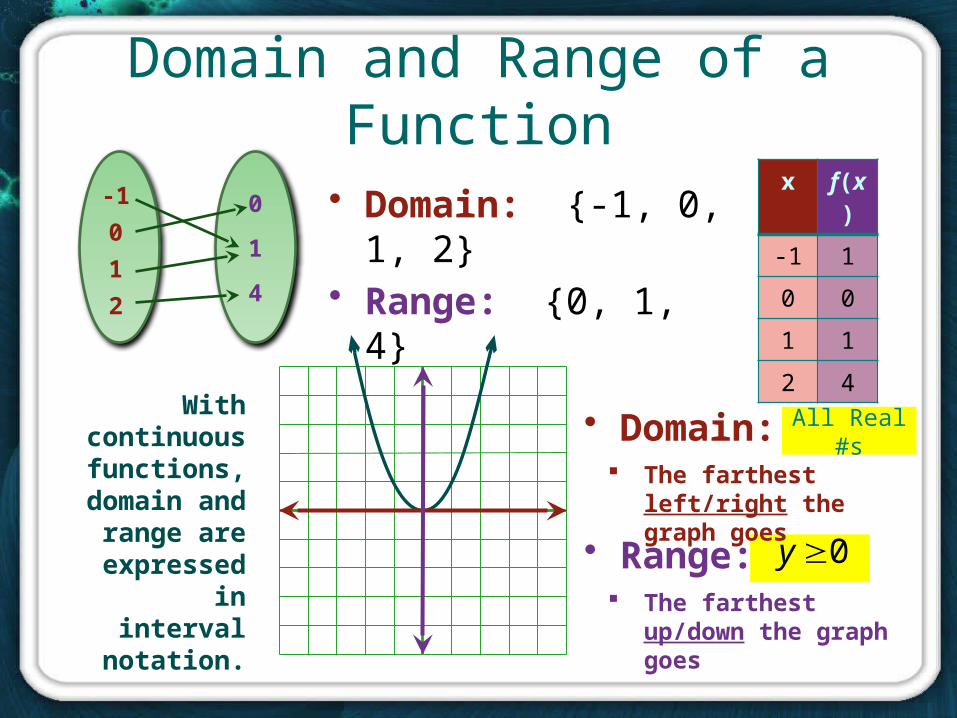
Domain and Range of a Function
• Domain: {-1, 0, 1, 2}• Range: {0, 1, 4}
x f(x)
-1 1
0 0
1 1
2 4
-1
0
1
2
0
1
4
• Range:
• Domain:
The farthest up/down the graph goes
The farthest left/right the graph goes
With continuous
functions, domain and
range are expressed in
interval notation.
0y
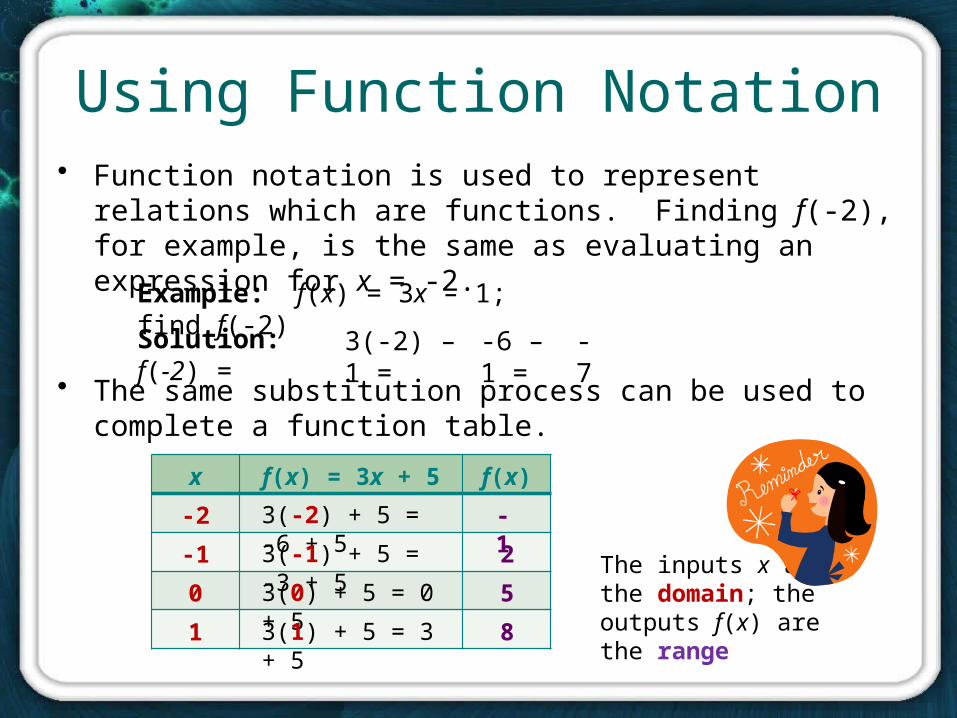
Using Function Notation• Function notation is used to represent relations which are
functions. Finding f(-2), for example, is the same as evaluating an expression for x = -2.
Example: f(x) = 3x – 1; find f(-2)
Solution: f(-2) =
• The same substitution process can be used to complete a function table.
x f(x) = 3x + 5 f(x)
-2
-1
0
1
The inputs x arethe domain; theoutputs f(x) are the range
3(-2) – 1 = -6 – 1 = -7
3(-2) + 5 = -6 + 5
3(-1) + 5 = -3 + 5
3(0) + 5 = 0 + 5
3(1) + 5 = 3 + 5
-1
2
5
8
Graphing Basic Functions• Graphing parent functions for linear, absolute
value, quadratic, square root, cubic, and rational functions
• Introduction to transformations
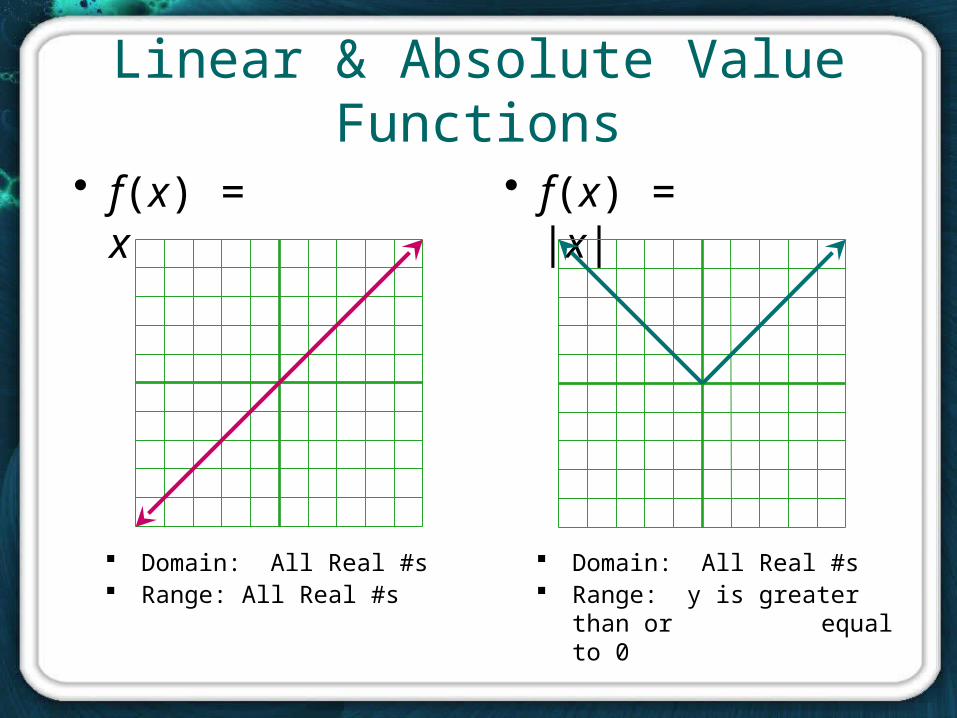
Linear & Absolute Value Functions
• f(x) = x • f(x) = |x|
Domain: All Real #s Range: All Real #s
Domain: All Real #s Range: y is greater than or
equal to 0
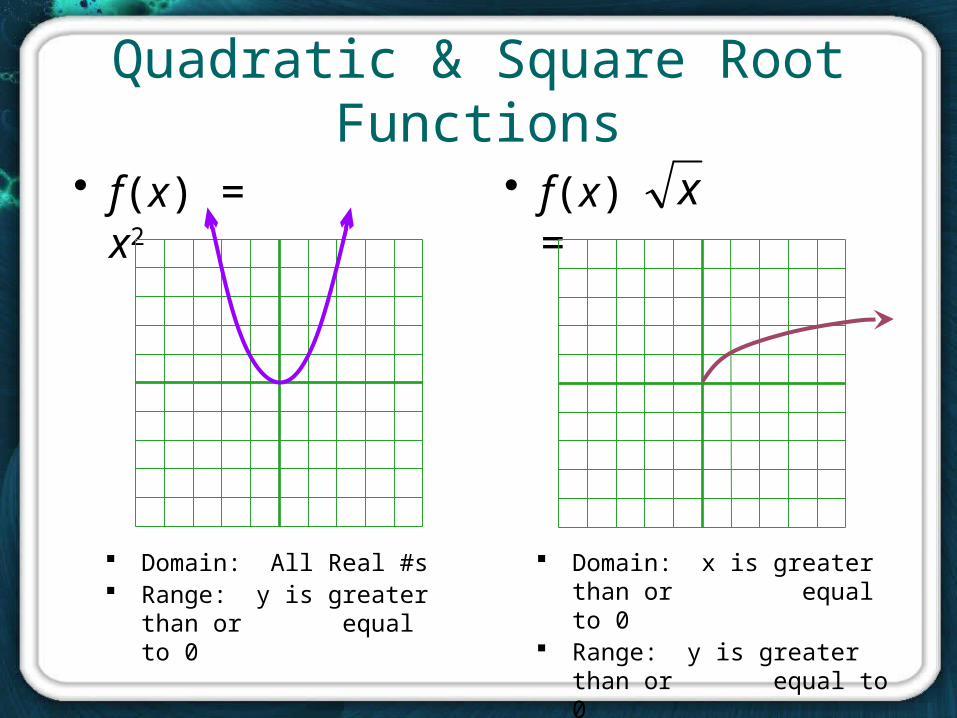
Quadratic & Square Root Functions
• f(x) = x2 • f(x) = x
Domain: All Real #s Range: y is greater than or
equal to 0
Domain: x is greater than or equal to 0
Range: y is greater than or equal to 0
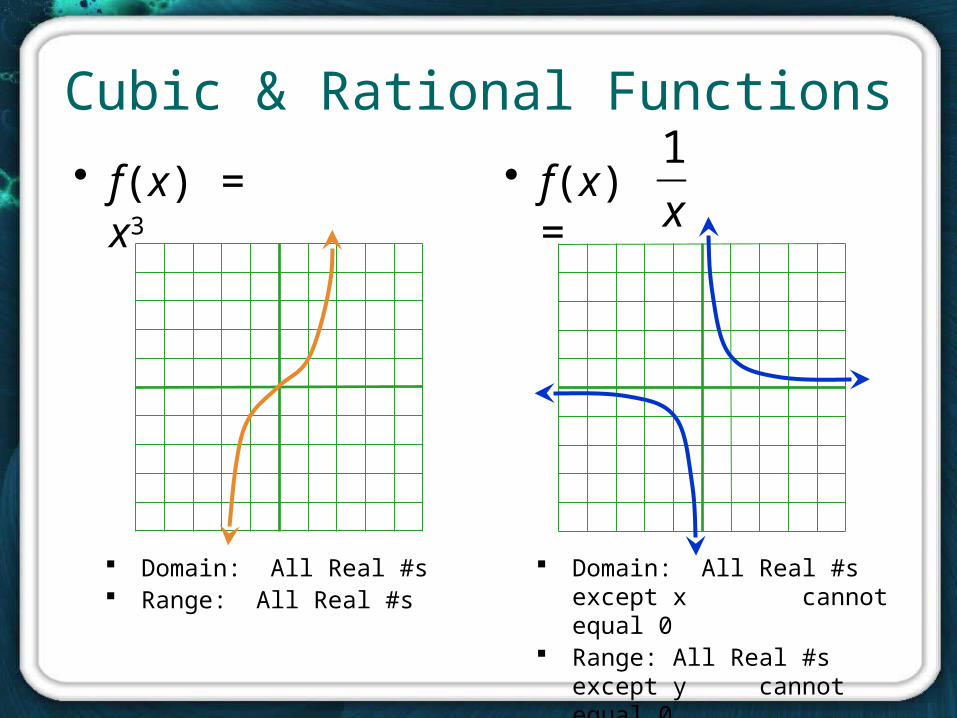
Cubic & Rational Functions
• f(x) = x3 • f(x) =x
1
Domain: All Real #s Range: All Real #s
Domain: All Real #s except x cannot equal 0
Range: All Real #s except y cannot equal 0
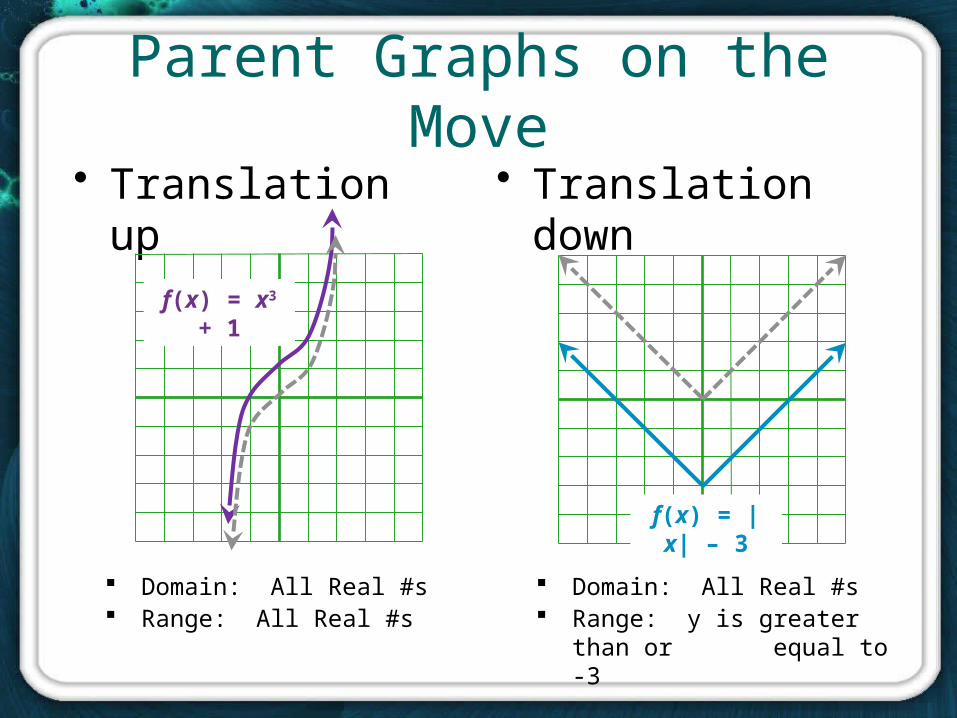
Parent Graphs on the Move• Translation up
Domain: All Real #s Range: y is greater than or
equal to -3
Domain: All Real #s Range: All Real #s
• Translation down
f(x) = x3 + 1
f(x) = |x| – 3
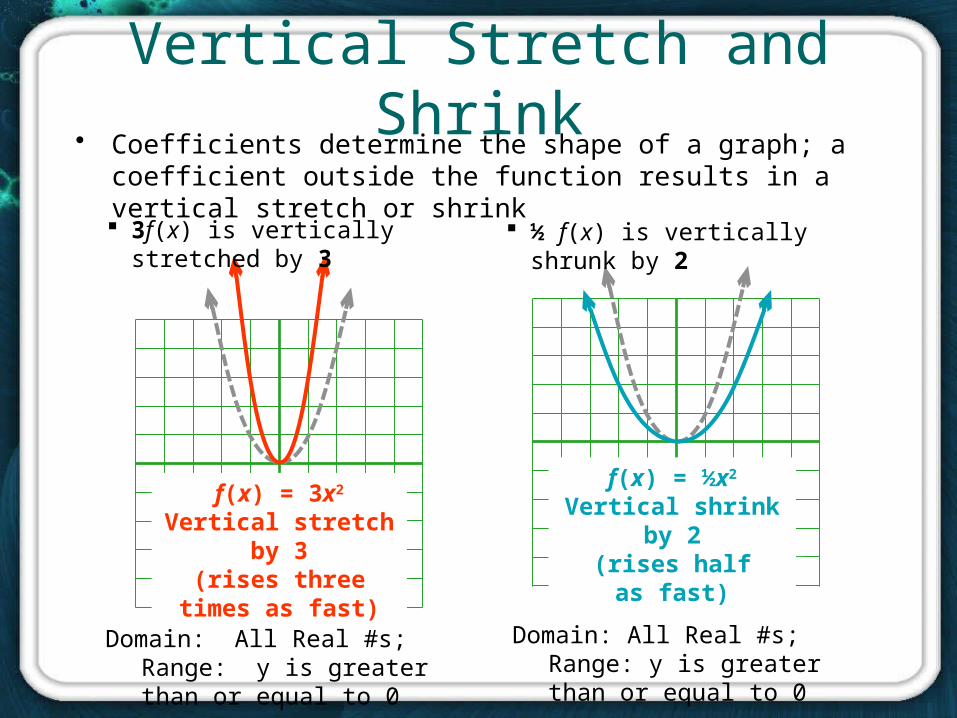
Vertical Stretch and Shrink• Coefficients determine the shape of a graph; a coefficient
outside the function results in a vertical stretch or shrink
f(x) = 3x2
Vertical stretch by 3(rises three
times as fast)
f(x) = ½x2
Vertical shrink by 2(rises half
as fast)
3f(x) is vertically stretched by 3 ½ f(x) is vertically shrunk by 2
Domain: All Real #s; Range: y is greater than or equal to 0
Domain: All Real #s; Range: y is greater than or equal to 0
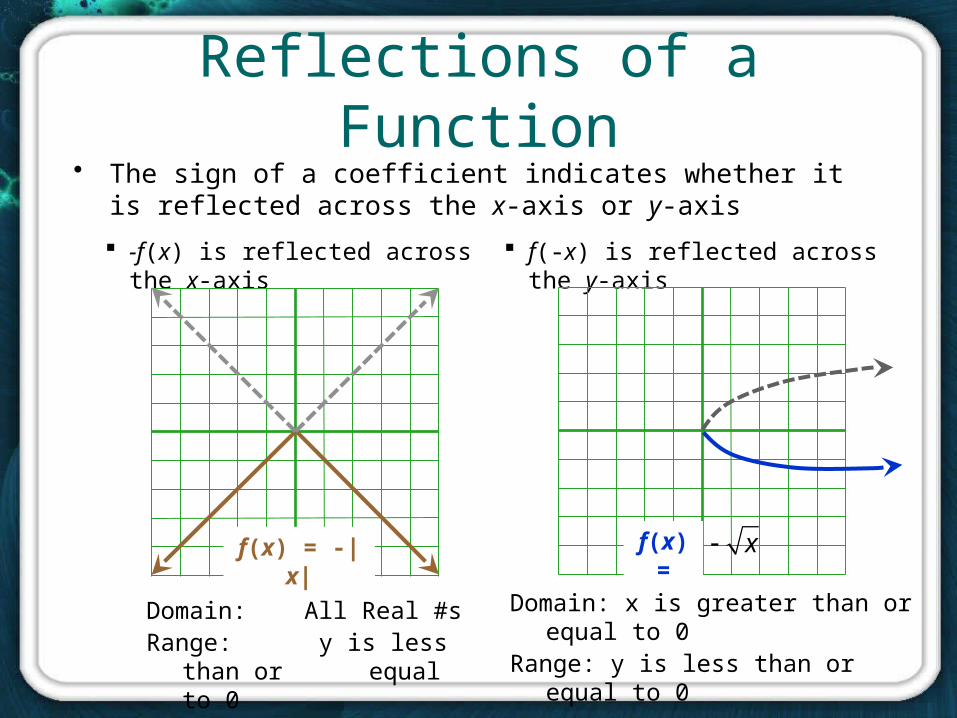
Reflections of a Function• The sign of a coefficient indicates whether it is reflected across
the x-axis or y-axis
-f(x) is reflected across the x-axis f(-x) is reflected across the y-axis
f(x) = -|x| f(x) = x
Domain: All Real #sRange: y is less than or
equal to 0
Domain: x is greater than or equal to 0Range: y is less than or equal to 0
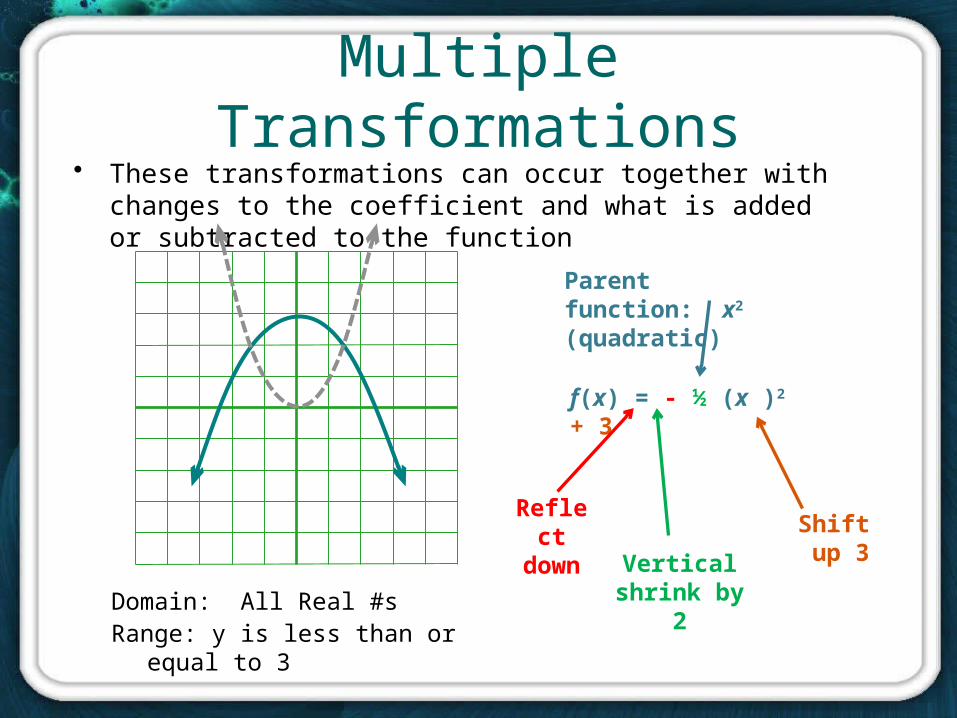
Multiple Transformations• These transformations can occur together with changes to the
coefficient and what is added or subtracted to the function
f(x) = - ½ (x )2 + 3
Parent function: x2
(quadratic)
Reflect down
Vertical shrink by 2
Shift up 3
Domain: All Real #sRange: y is less than or equal to 3
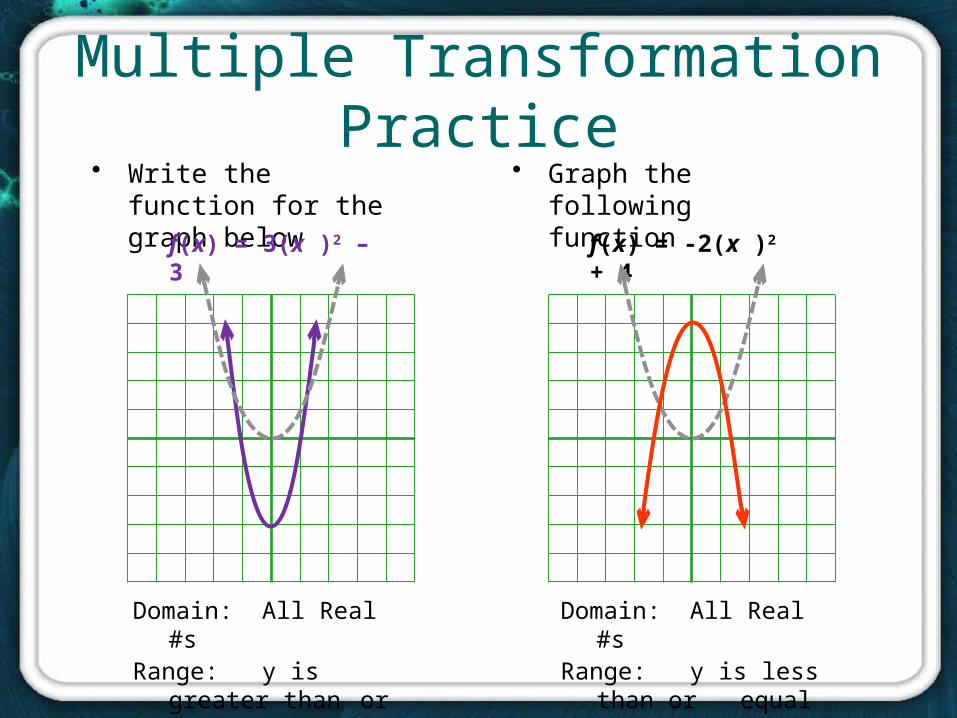
Multiple Transformation Practice• Write the function for
the graph below• Graph the following
function
f(x) = -2(x )2 + 4f(x) = 3(x )2 – 3
Domain: All Real #sRange: y is greater than
or equal to 3
Domain: All Real #sRange: y is less than or
equal to 4
Function Characteristics• Analyzing graphs by determining domain, range,
zeros, intercepts, intervals of increase and decrease, maximums and minimums, and end behavior
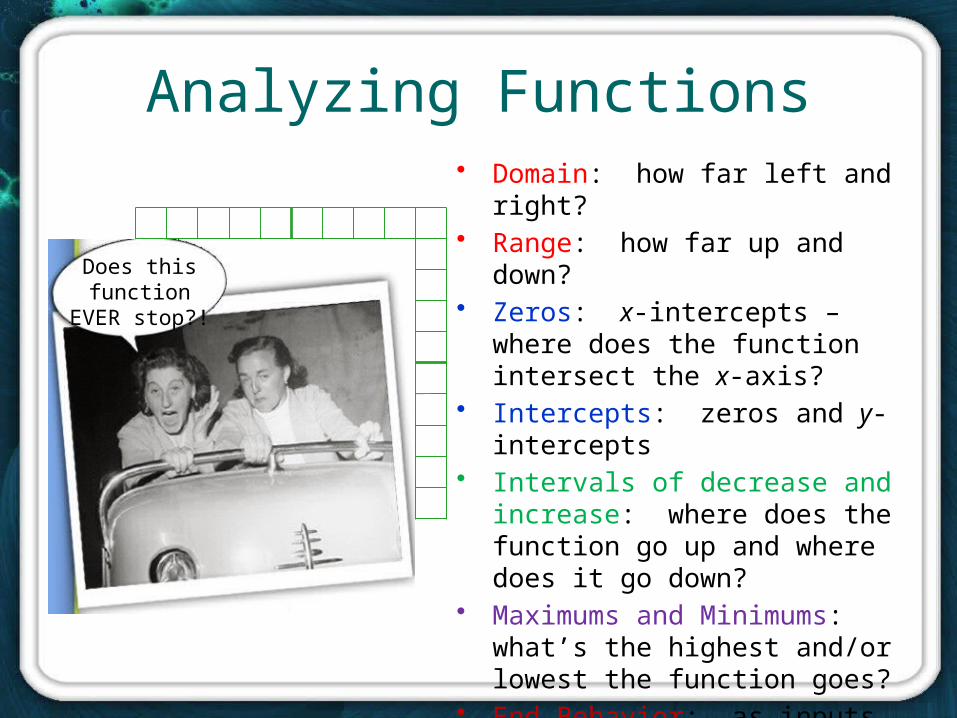
Analyzing Functions• Domain: how far left and right?• Range: how far up and down?• Zeros: x-intercepts – where does
the function intersect the x-axis? • Intercepts: zeros and y-intercepts• Intervals of decrease and
increase: where does the function go up and where does it go down?
• Maximums and Minimums: what’s the highest and/or lowest the function goes?
• End Behavior: as inputs approach infinity, what happens to the function?
Does this function EVER
stop?!
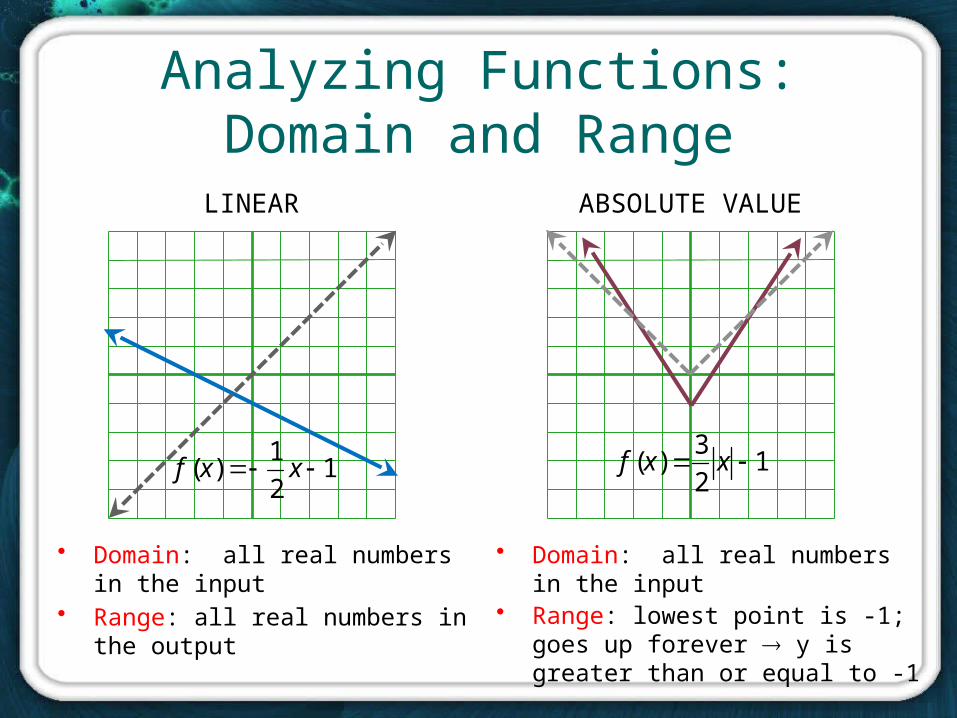
Analyzing Functions:Domain and Range
• Domain: all real numbers in the input
• Range: all real numbers in the output
LINEAR
• Domain: all real numbers in the input
• Range: lowest point is -1; goes up forever y is greater than or equal to -1
ABSOLUTE VALUE
3( ) 1
2f x x 1
2
1)( xxf
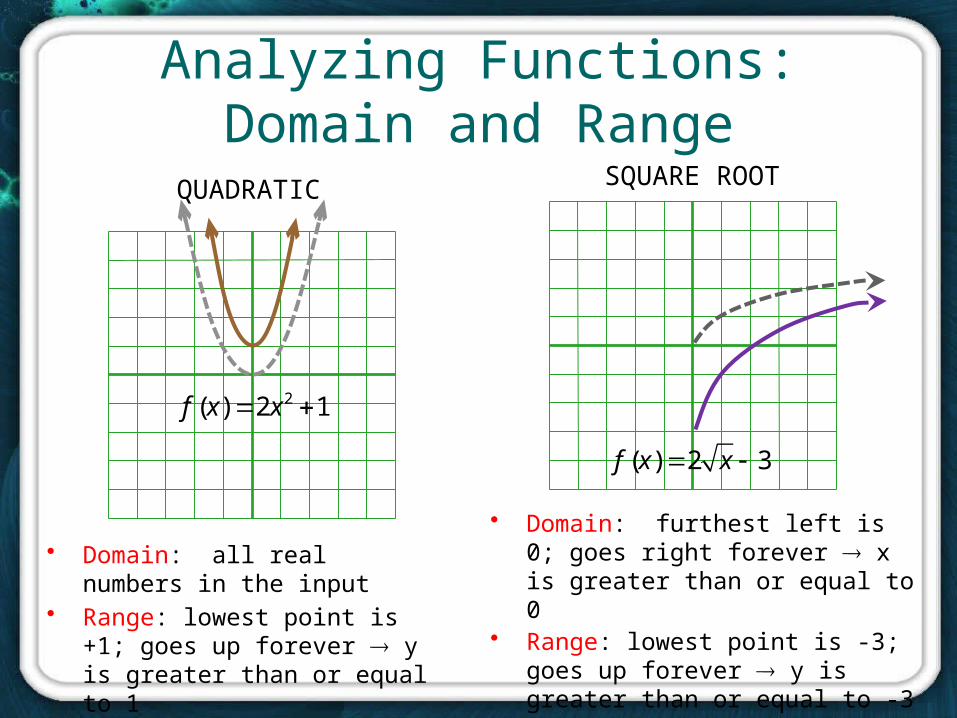
Analyzing Functions:Domain and Range
• Domain: all real numbers in the input
• Range: lowest point is +1; goes up forever y is greater than or equal to 1
• Domain: furthest left is 0; goes right forever x is greater than or equal to 0
• Range: lowest point is -3; goes up forever y is greater than or equal to -3
QUADRATIC SQUARE ROOT
( ) 2 3f x x
12)( 2 xxf
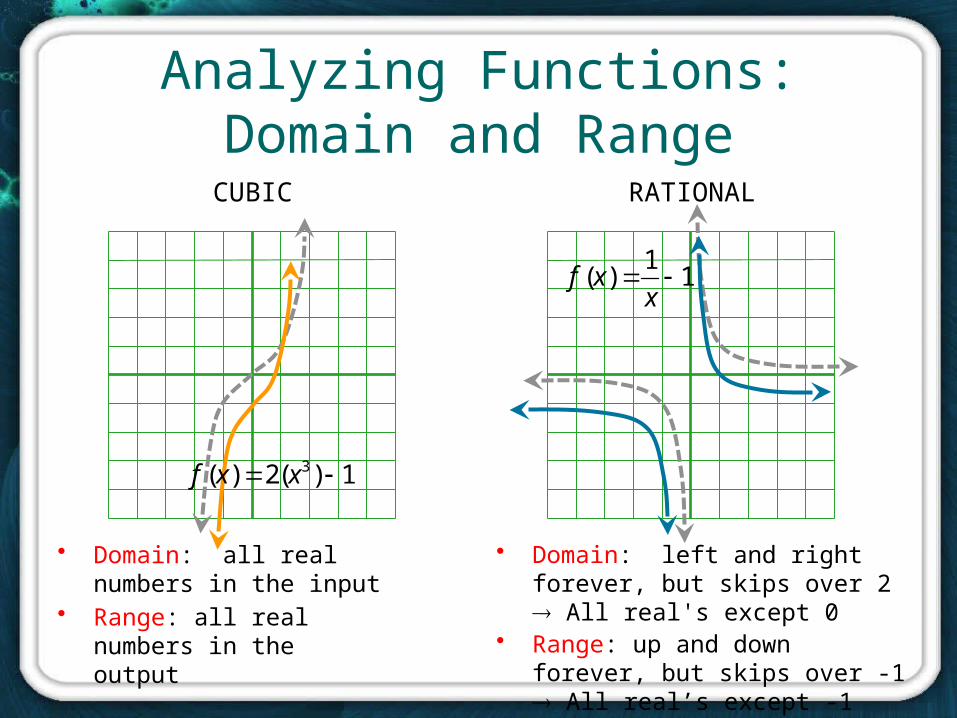
Analyzing Functions:Domain and Range
• Domain: all real numbers in the input
• Range: all real numbers in the output
• Domain: left and right forever, but skips over 2 All real's except 0
• Range: up and down forever, but skips over -1 All real’s except -1
CUBIC RATIONAL
1( ) 1f x
x
3( ) 2( ) 1f x x
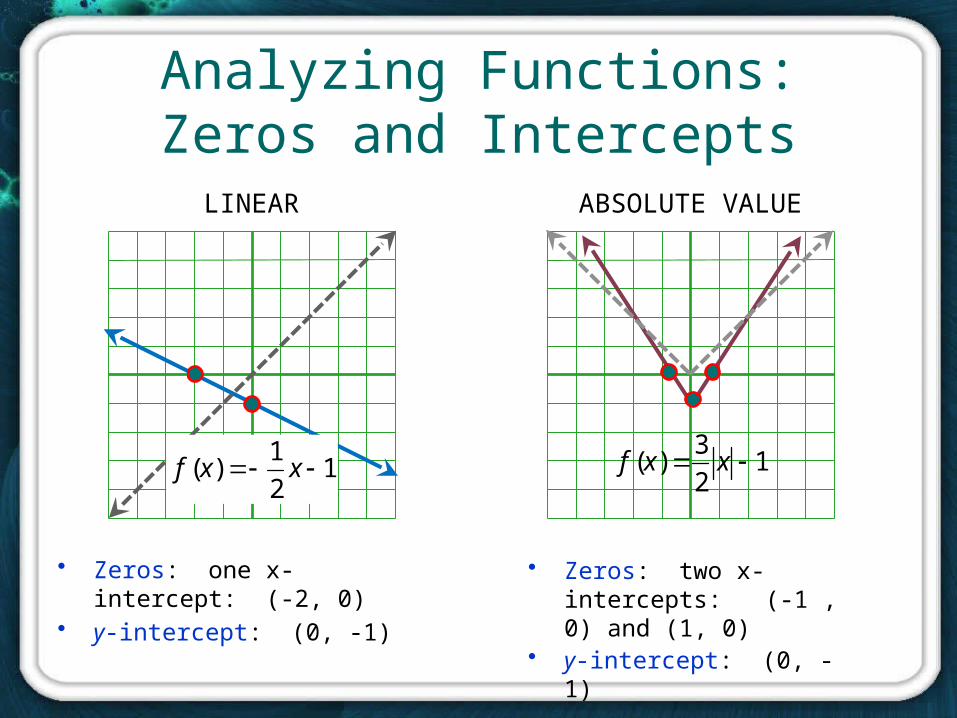
Analyzing Functions:Zeros and Intercepts
LINEAR ABSOLUTE VALUE
3( ) 1
2f x x 1
2
1)( xxf
• Zeros: one x-intercept: (-2, 0)• y-intercept: (0, -1)
• Zeros: two x-intercepts: (-1 , 0) and (1, 0)
• y-intercept: (0, -1)
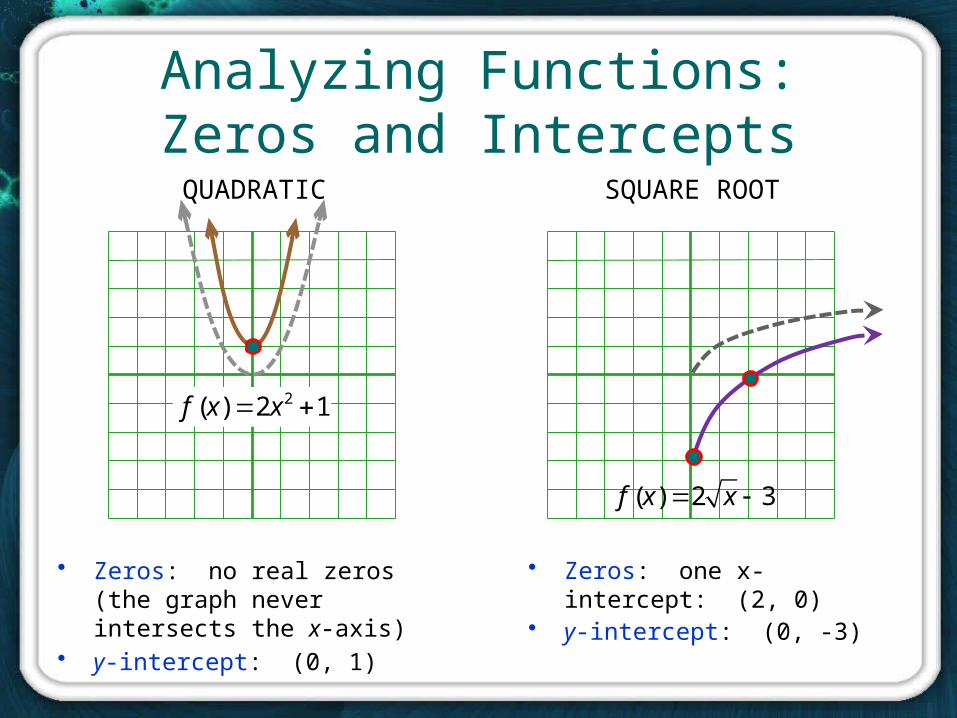
Analyzing Functions:Zeros and Intercepts
• Zeros: no real zeros (the graph never intersects the x-axis)
• y-intercept: (0, 1)
• Zeros: one x-intercept: (2, 0)• y-intercept: (0, -3)
QUADRATIC SQUARE ROOT
( ) 2 3f x x
12)( 2 xxf
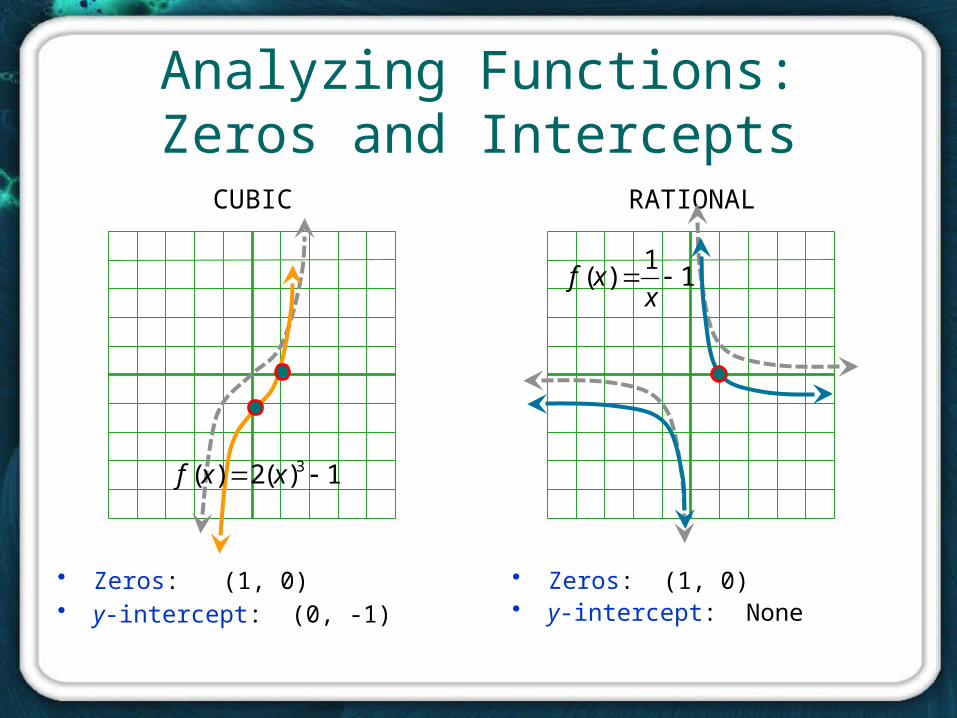
Analyzing Functions:Zeros and Intercepts
• Zeros: (1, 0)• y-intercept: (0, -1)
CUBIC RATIONAL
1( ) 1f x
x
3( ) 2( ) 1f x x
• Zeros: (1, 0)• y-intercept: None
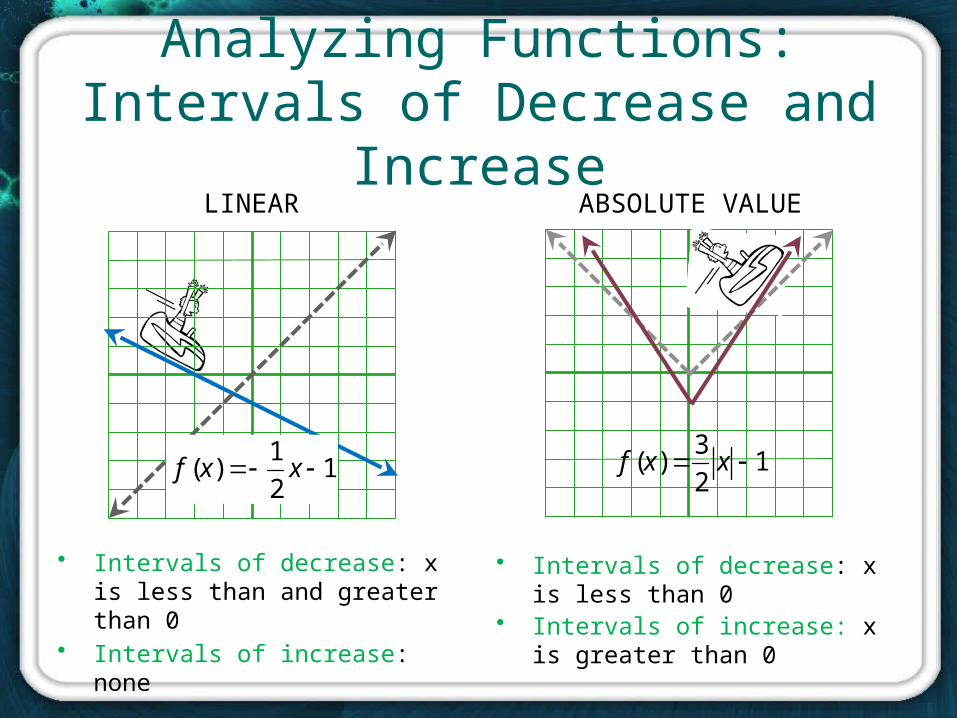
Analyzing Functions:Intervals of Decrease and Increase
• Intervals of decrease: x is less than and greater than 0
• Intervals of increase: none
3( ) 1
2f x x 1
2
1)( xxf
LINEAR ABSOLUTE VALUE
• Intervals of decrease: x is less than 0
• Intervals of increase: x is greater than 0
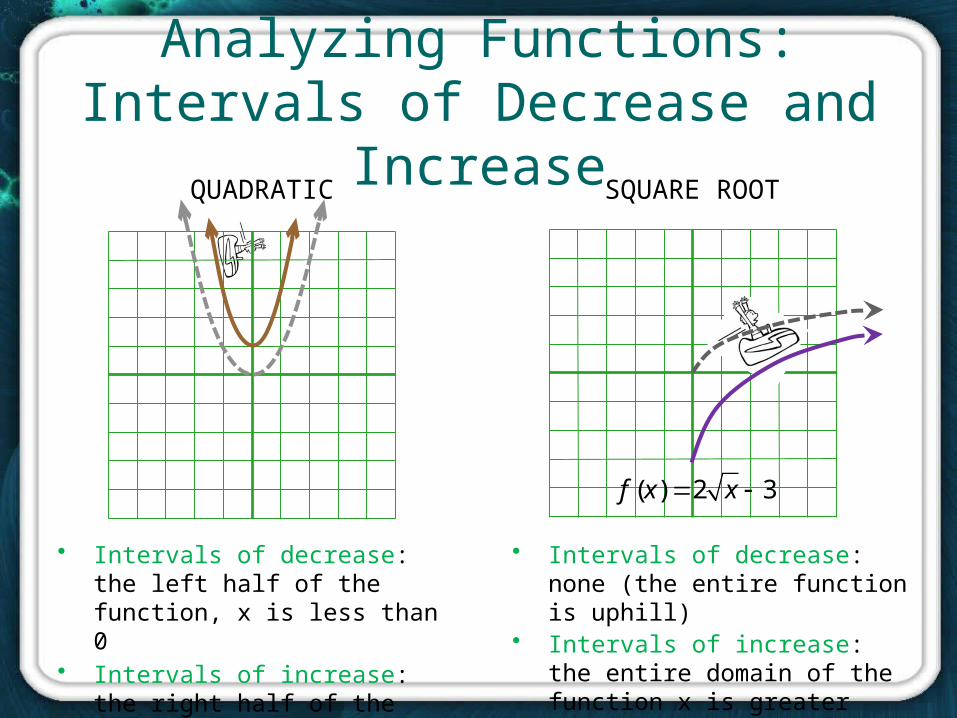
Analyzing Functions:Intervals of Decrease and Increase
• Intervals of decrease: the left half of the function, x is less than 0
• Intervals of increase: the right half of the function, x is greater than 0
• Intervals of decrease: none (the entire function is uphill)
• Intervals of increase: the entire domain of the function x is greater than 0
QUADRATIC SQUARE ROOT
( ) 2 3f x x
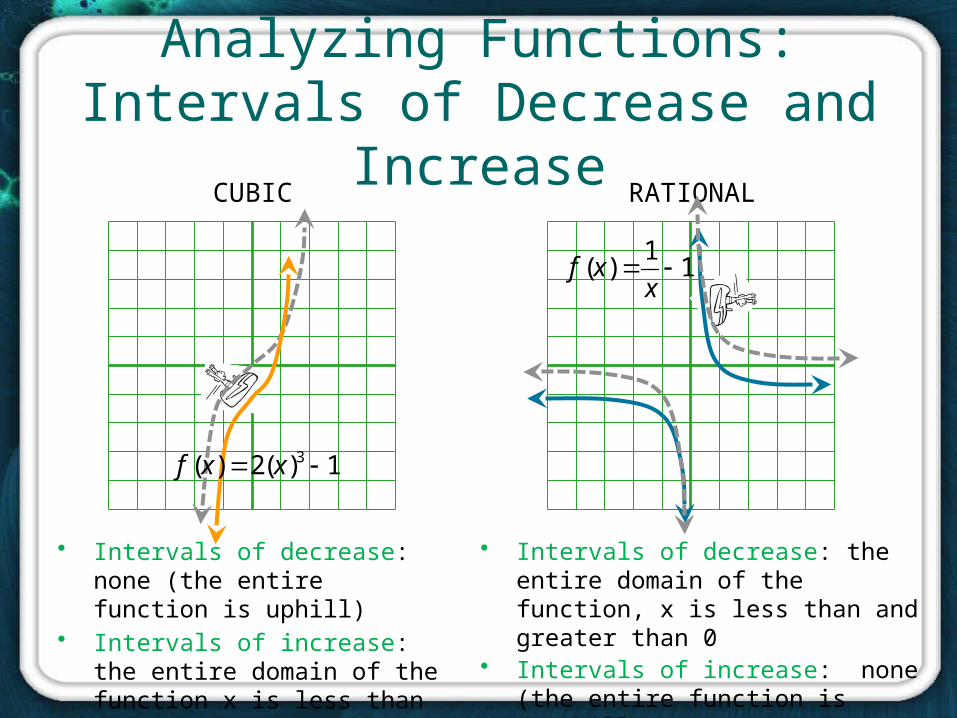
Analyzing Functions:Intervals of Decrease and Increase
• Intervals of decrease: none (the entire function is uphill)
• Intervals of increase: the entire domain of the function x is less than and greater than 0
• Intervals of decrease: the entire domain of the function, x is less than and greater than 0
• Intervals of increase: none (the entire function is downhill)
CUBIC RATIONAL
3( ) 2( ) 1f x x
1( ) 1f x
x
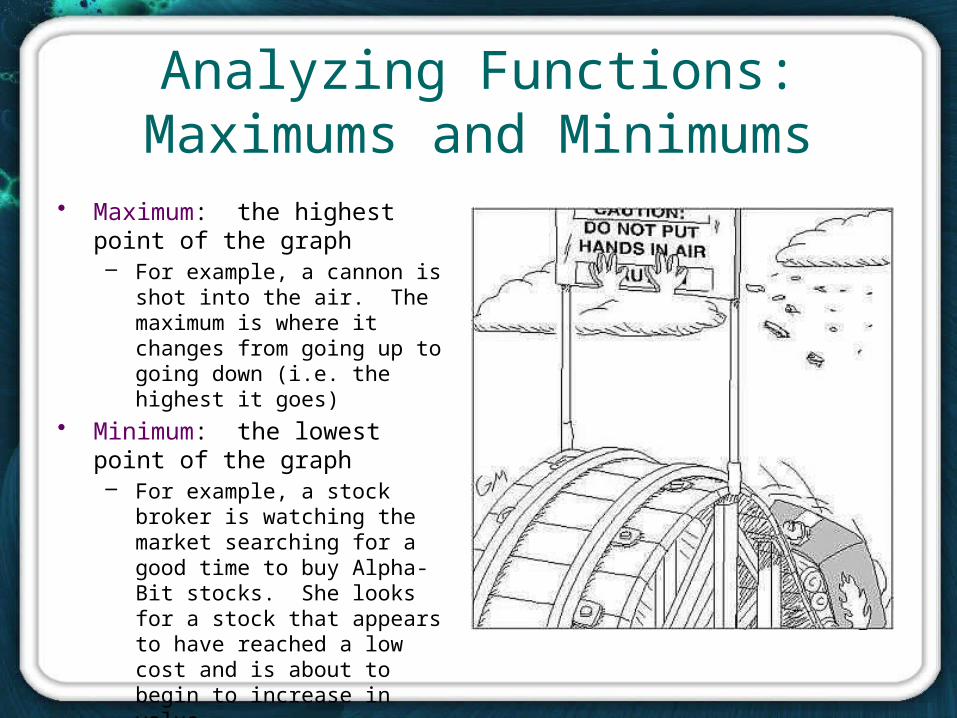
Analyzing Functions:Maximums and Minimums
• Maximum: the highest point of the graph– For example, a cannon is shot into
the air. The maximum is where it changes from going up to going down (i.e. the highest it goes)
• Minimum: the lowest point of the graph– For example, a stock broker is
watching the market searching for a good time to buy Alpha-Bit stocks. She looks for a stock that appears to have reached a low cost and is about to begin to increase in value.
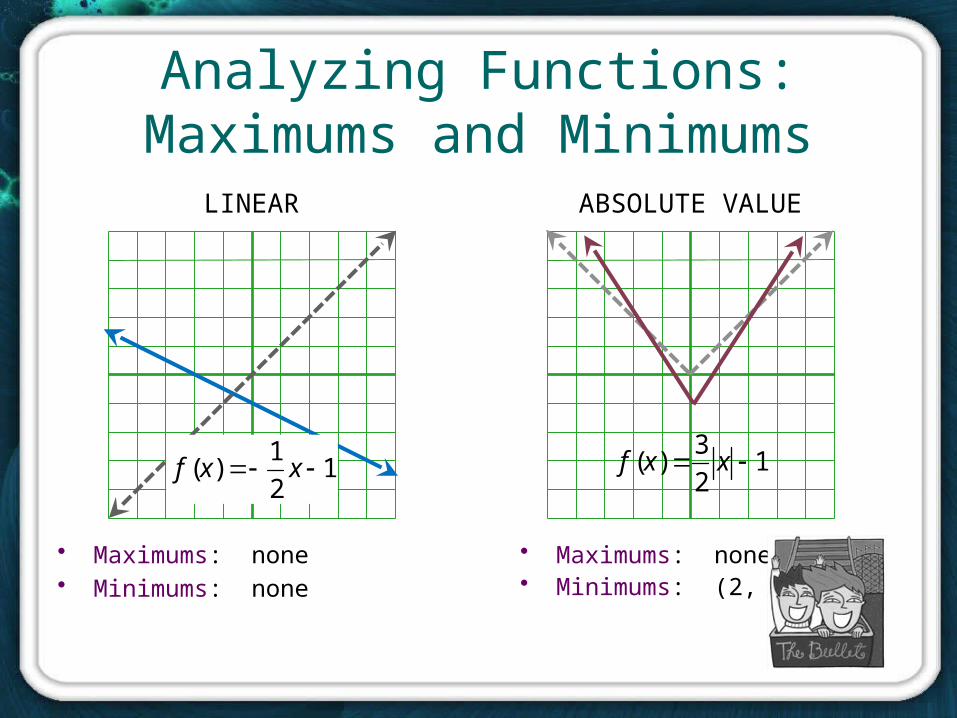
Analyzing Functions:Maximums and Minimums
• Maximums: none• Minimums: none
• Maximums: none• Minimums: (2, -1)
3( ) 1
2f x x 1
2
1)( xxf
LINEAR ABSOLUTE VALUE
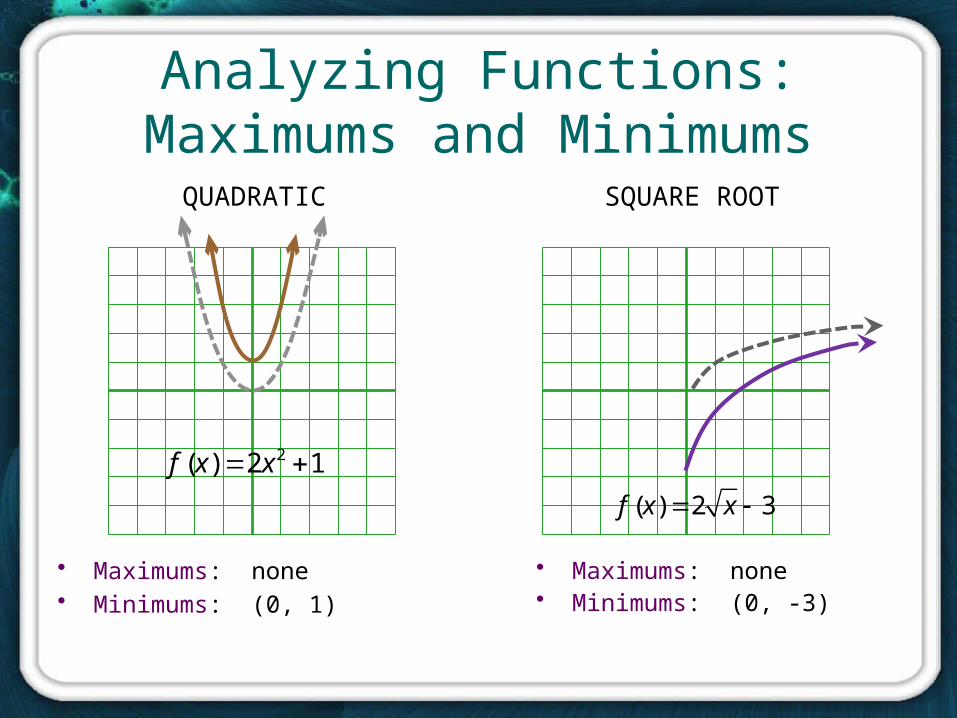
Analyzing Functions:Maximums and Minimums
• Maximums: none• Minimums: (0, 1)
• Maximums: none• Minimums: (0, -3)
QUADRATIC SQUARE ROOT
( ) 2 3f x x
12)( 2 xxf
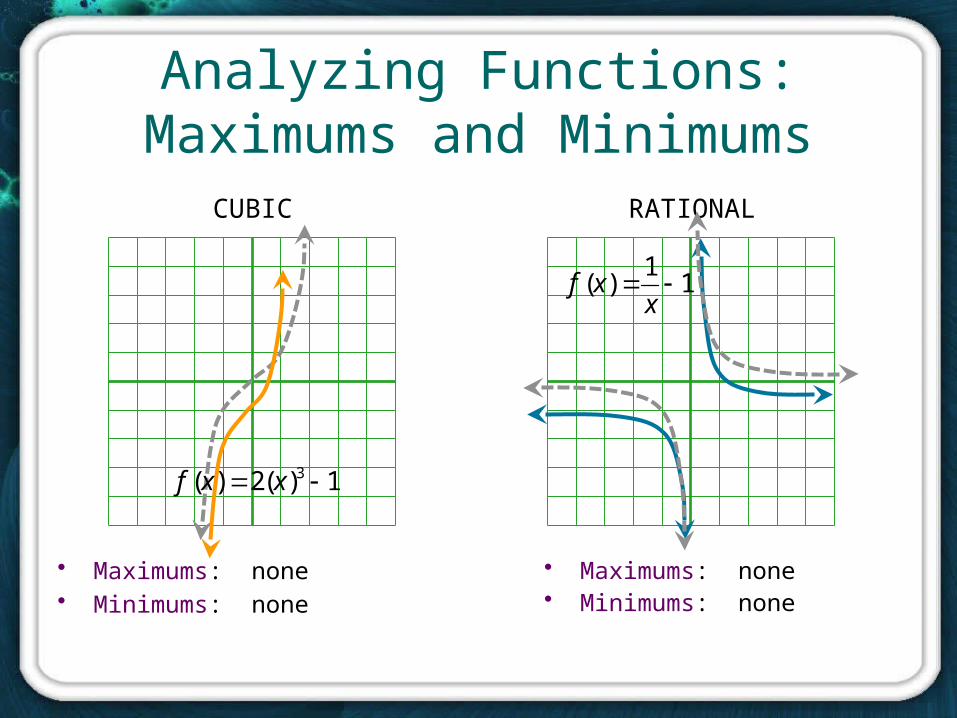
Analyzing Functions:Maximums and Minimums
• Maximums: none• Minimums: none
• Maximums: none• Minimums: none
CUBIC RATIONAL
3( ) 2( ) 1f x x
1( ) 1f x
x
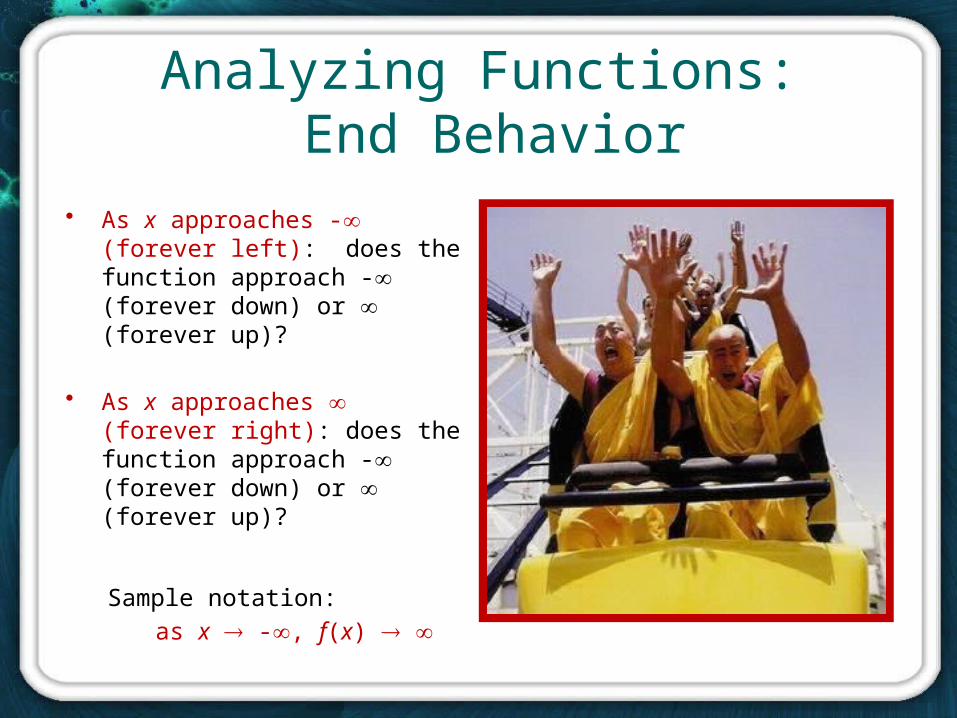
Analyzing Functions: End Behavior
• As x approaches - (forever left): does the function approach - (forever down) or (forever up)?
• As x approaches (forever right): does the function approach - (forever down) or (forever up)?
Sample notation:
as x -, f(x)
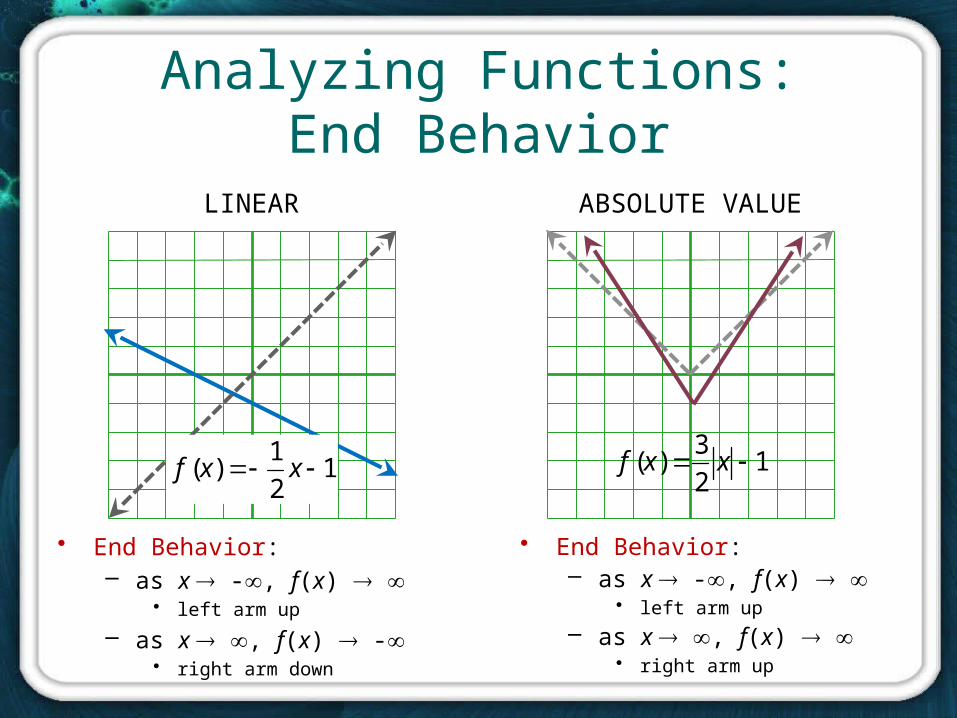
Analyzing Functions:End Behavior
• End Behavior:– as x -, f(x)
• left arm up
– as x , f(x) -• right arm down
3( ) 1
2f x x 1
2
1)( xxf
LINEAR ABSOLUTE VALUE
• End Behavior:– as x -, f(x)
• left arm up
– as x , f(x) • right arm up
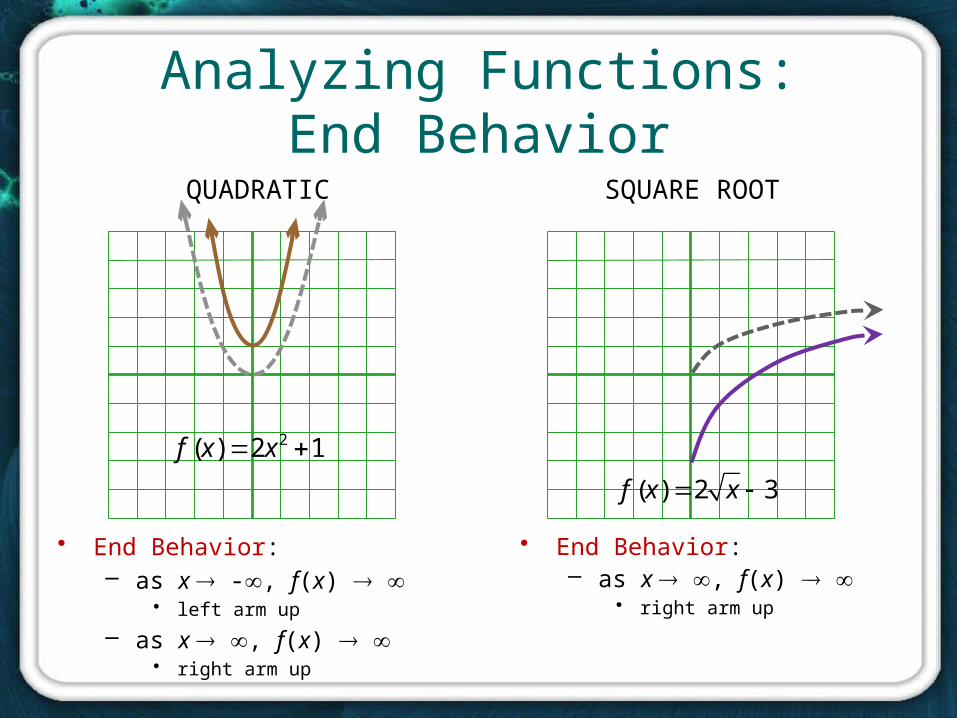
Analyzing Functions:End Behavior
• End Behavior:– as x -, f(x)
• left arm up
– as x , f(x) • right arm up
• End Behavior:– as x , f(x)
• right arm up
QUADRATIC SQUARE ROOT
( ) 2 3f x x
12)( 2 xxf
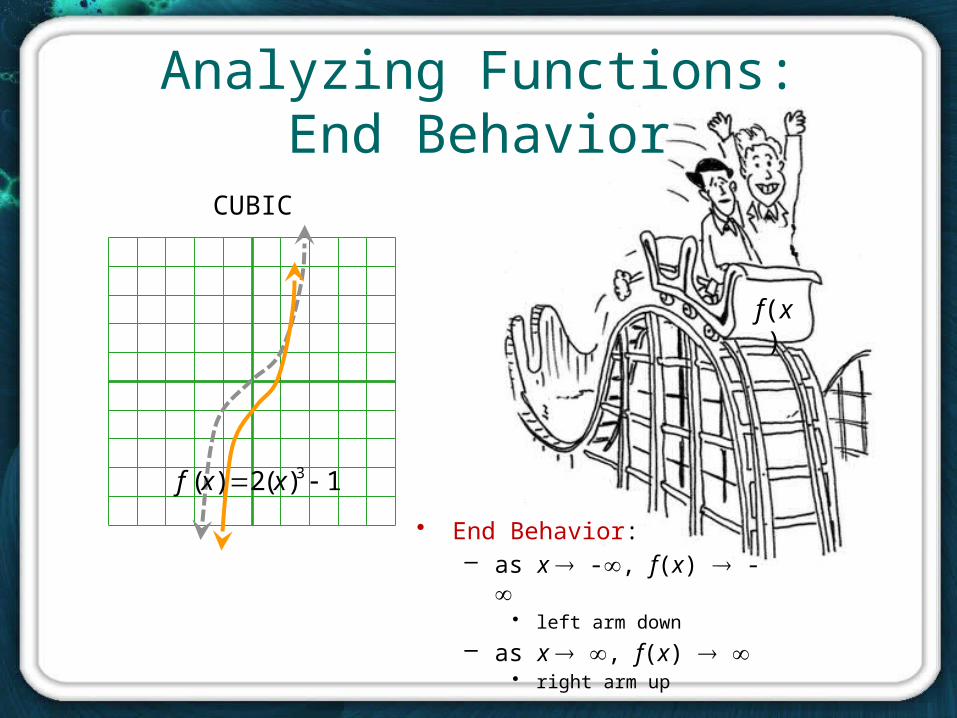
Analyzing Functions:End Behavior
• End Behavior:– as x -, f(x) -
• left arm down
– as x , f(x) • right arm up
CUBIC
3( ) 2( ) 1f x x
f(x)