gps probe data for transportation...
TRANSCRIPT

TRB Using Census Data for Transportation Applications Conference, October 25-27, 2011, Irvine, CA
GPS Probe Data for Transportation Planning Nick Cohn

• New ways of measuring travel speeds and patterns
• Making GPS measurements available and usable
• Combining with other data sources, such as Census
• Consumer Navigation as a data source for transportation planning
• The first steps
• How far can we go?
GPS Probe Data for Transportation Planning Contents
1 November
2011 Draft Presentation Nick Cohn 2
© 2011 TomTom. All rights reserved. Confidential information.
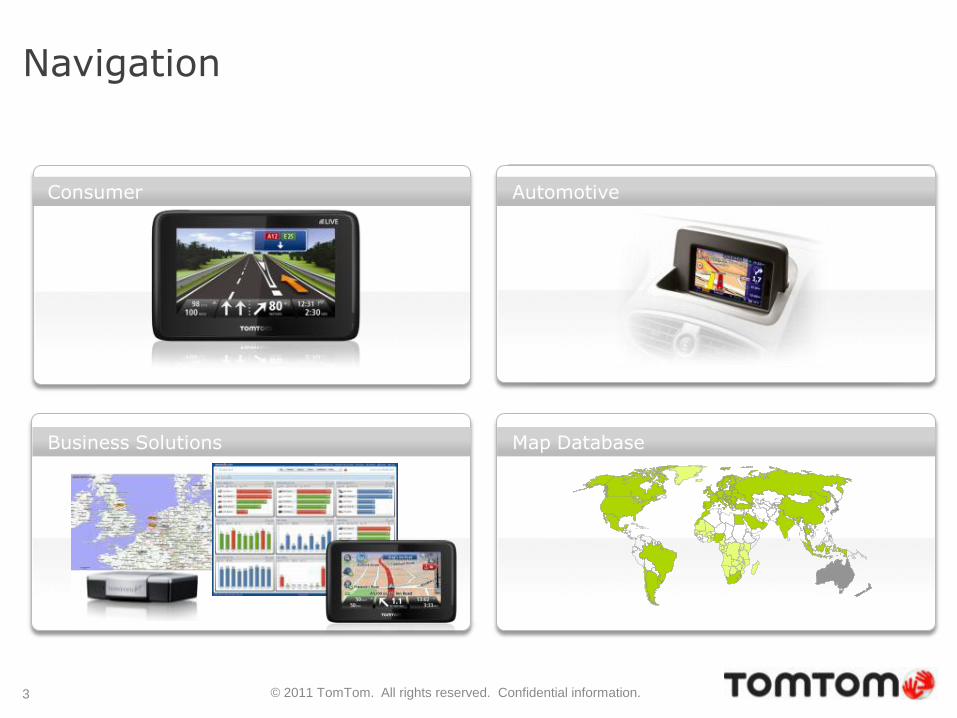
Navigation
Consumer
Business Solutions
Automotive
Map Database
3
© 2011 TomTom. All rights reserved. Confidential information.
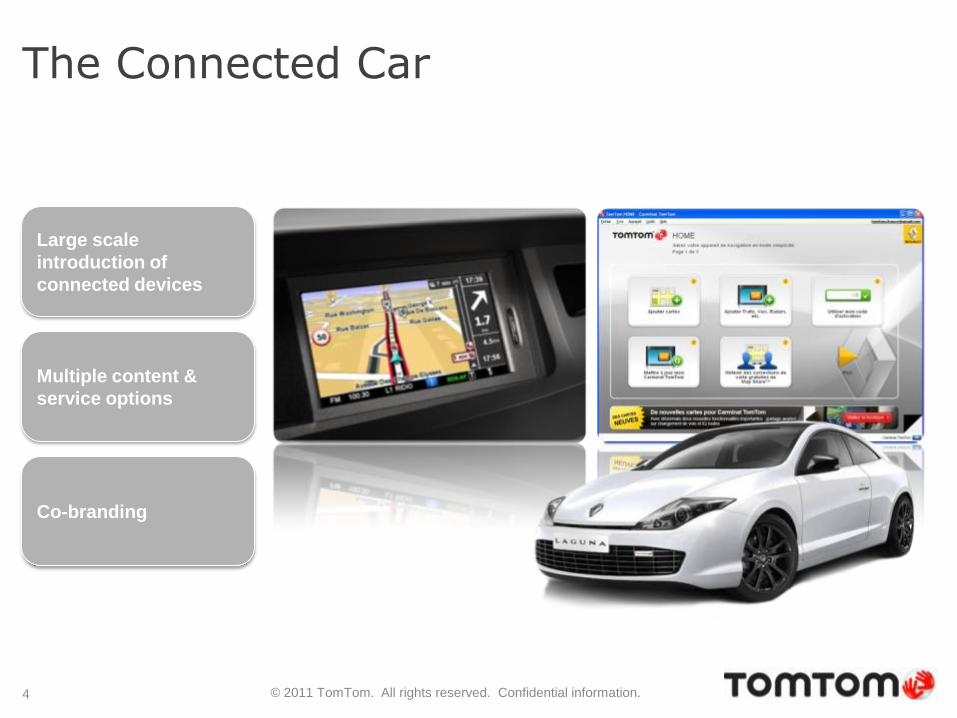
The Connected Car
Large scale
introduction of
connected devices
Multiple content &
service options
Co-branding
4

© 2011 TomTom. All rights reserved. Confidential information.
Business Solutions
Navigation +
Communication +
Fleet management +
5
Environmental responsibility Driver feedback to reduce fuel use and CO2 emissions
© 2011 TomTom. All rights reserved. Confidential information.
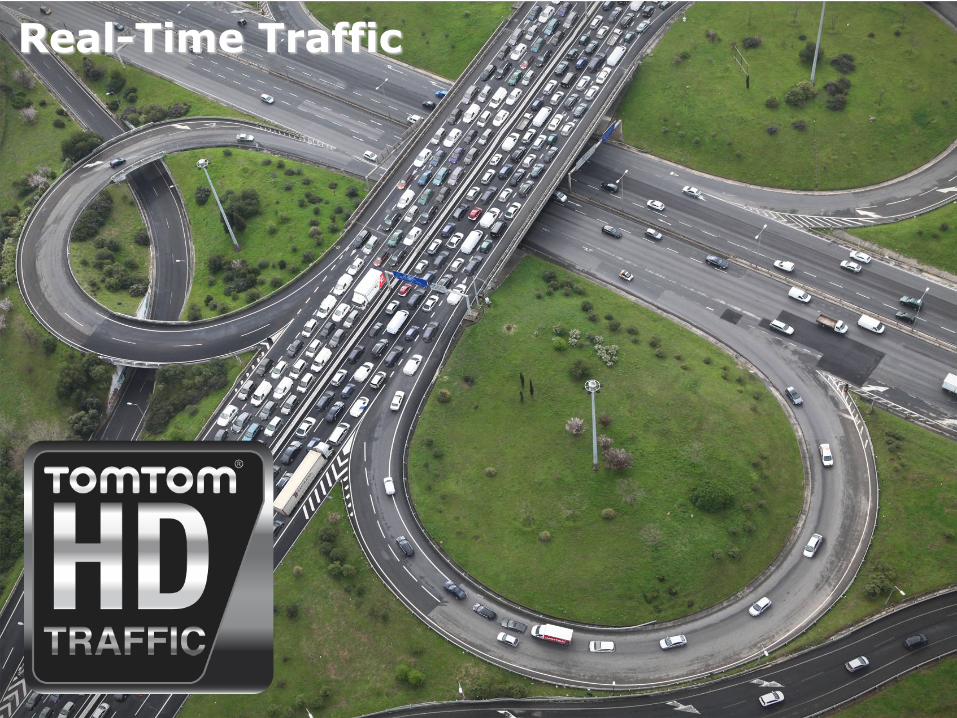
Real-Time Traffic

© 2011 TomTom. All rights reserved. Confidential information.
Real Time Traffic Data Sources & Fusion
7
General Data Sources
Incident Data Road
Sensors
Government or 3rd party
Note: Not all data sources are available or used in every country
The best real time traffic information on highways,
major roads and secondary roads.
Data Fusion
LIVE PND Business
Solutions iPhone
Navigation
In-dash
Navigation 3rd Party
GPS Probes
GSM
Probes
GSM
© 2011 TomTom. All rights reserved. Confidential information.
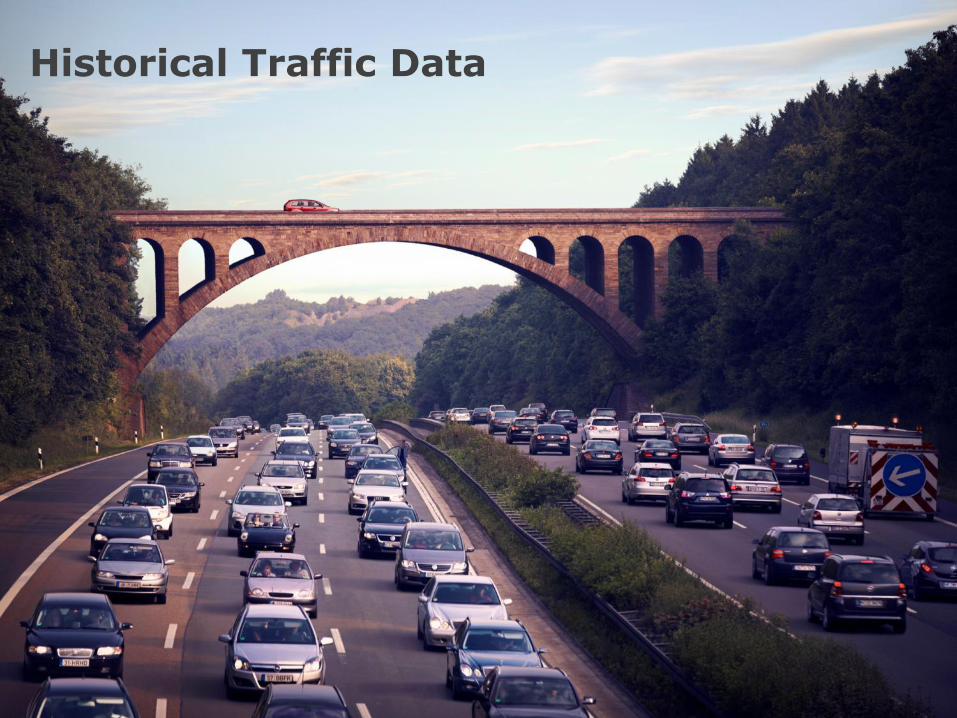
Historical Traffic Data

© 2011 TomTom. All rights reserved. Confidential information.
Anonymous GPS measurements
TomTom HOME
In Dash Navigation
BUSINESS SOLUTIONS
CONNECTED PND
Mobile App
9
© 2011 TomTom. All rights reserved. Confidential information.
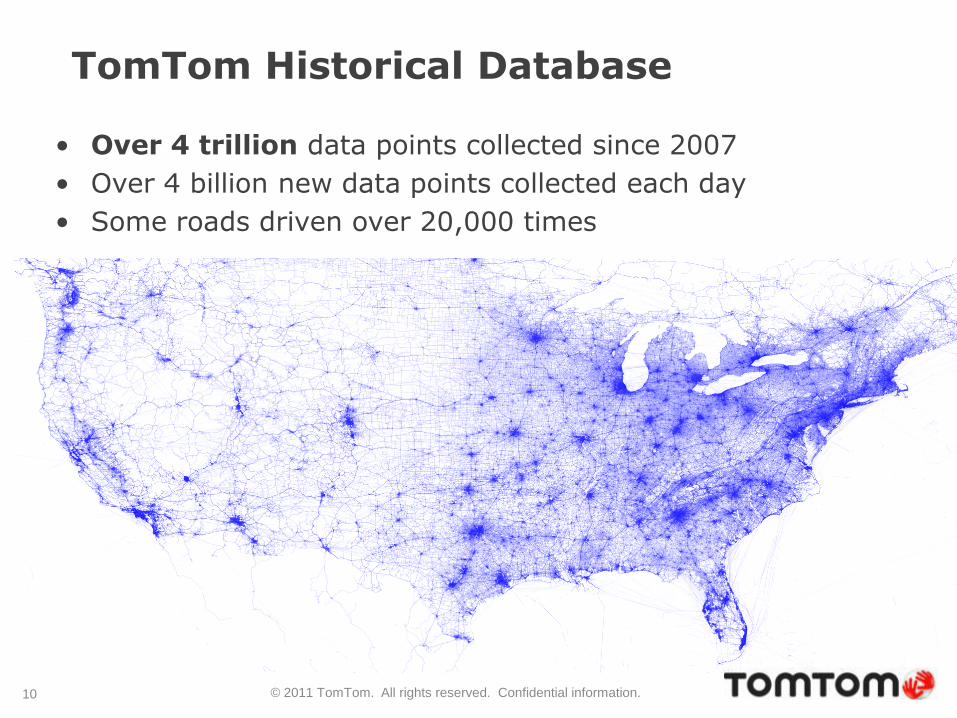
TomTom Historical Database
• Over 4 trillion data points collected since 2007
• Over 4 billion new data points collected each day
• Some roads driven over 20,000 times
10

Speed Profiles
Custom Travel Times
& Custom Area
Analysis
Custom
Probe Counts
Intelligent data for
optimal route planning
Highly granular speed
information
Indicator of relative
traffic volumes
Historical Traffic Products
1 November 2011 © 2011 TomTom

Benefits
• Improved fastest route calculation and ETA
• Time-specific forecasting of travel times on road
links
Use Cases
• PND & Smartphone navigation
• Internet mobility portal
• Logistics scheduling (standard and just-in-time
delivery planning)
Speed Profiles • Better route-time planning with proven long-term knowledge
1 November 2011 © 2011 TomTom

Benefits
• Detailed understanding of route travel times
by time of day
• Ability to study effects of network changes in
before / after studies
Use Cases
• Travel time reliability
• Traffic engineering (traffic light / junction
performance)
• Background information for major
infrastructure changes
• Model validation
Custom Travel Times • Detailed analysis of road or route traffic performance
1 November 2011 © 2011 TomTom
14
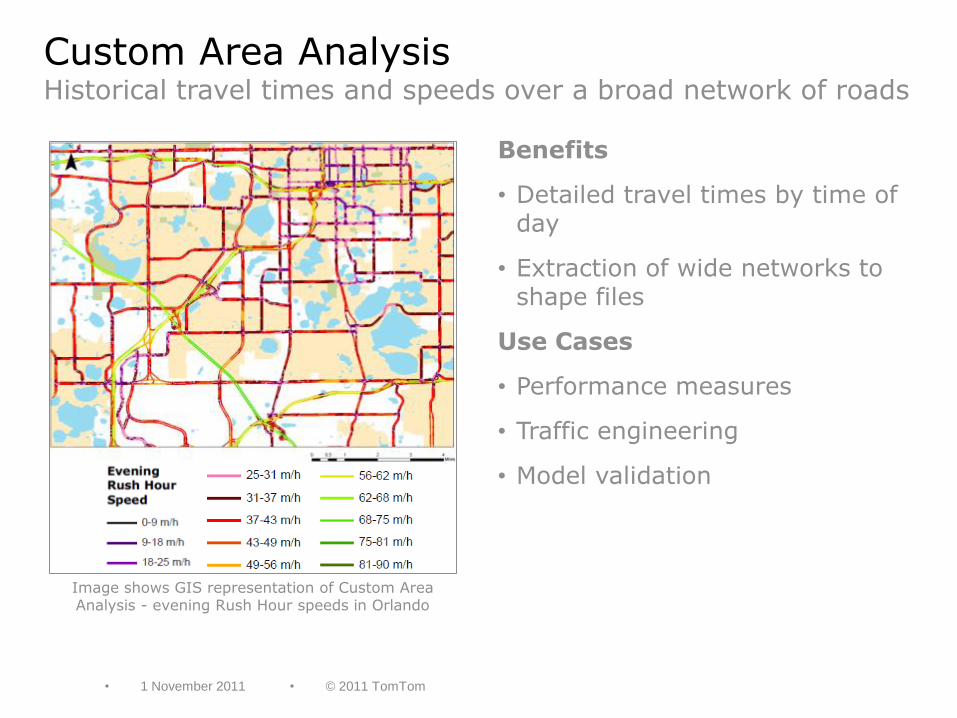
Custom Area Analysis Historical travel times and speeds over a broad network of roads
Benefits
• Detailed travel times by time of day
• Extraction of wide networks to shape files
Use Cases
• Performance measures
• Traffic engineering
• Model validation
Image shows GIS representation of Custom Area Analysis - evening Rush Hour speeds in Orlando
• 1 November 2011
• © 2011 TomTom

15
Traffic Stats internet portal Online access to historical traffic information
Features
• Access to TomTom historical traffic
products from any internet enabled
computer anywhere – anytime
• Reports available within 24 hours
• Data can be downloaded for use in
other applications
• Currently offered:
Custom Travel Times
Custom Area Analysis
• 1 November 2011
• © 2011 TomTom

© 2011 TomTom. All rights reserved. Confidential information.
Origin Destination based on GPS navigation
Benefits
• Large database
• Trips can be distilled based on clear set of criteria
• Routes used for trips known
• Completely anonymous
Challenges
• Completely anonymous
• No trip purpose
• No household characteristics
• Some known biases for consumer (vs. fleet) use patterns
1 November 2011 16

© 2011 TomTom. All rights reserved. Confidential information.
Representativeness Distribution by time of day
0%
1%
2%
3%
4%
5%
6%
7%
8%
9%
10%
0 1 2 3 4 5 6 7 8 9 10 11 12 13 14 15 16 17 18 19 20 21 22 23
Hour of day
Sh
are o
f d
ail
y t
rip
s
Travel survey
TomTom FCD
Connected TomTom FCD

© 2011 TomTom. All rights reserved. Confidential information.
Example output forms
1 November 2011 18
Southbound trip
destinations, Mast 2
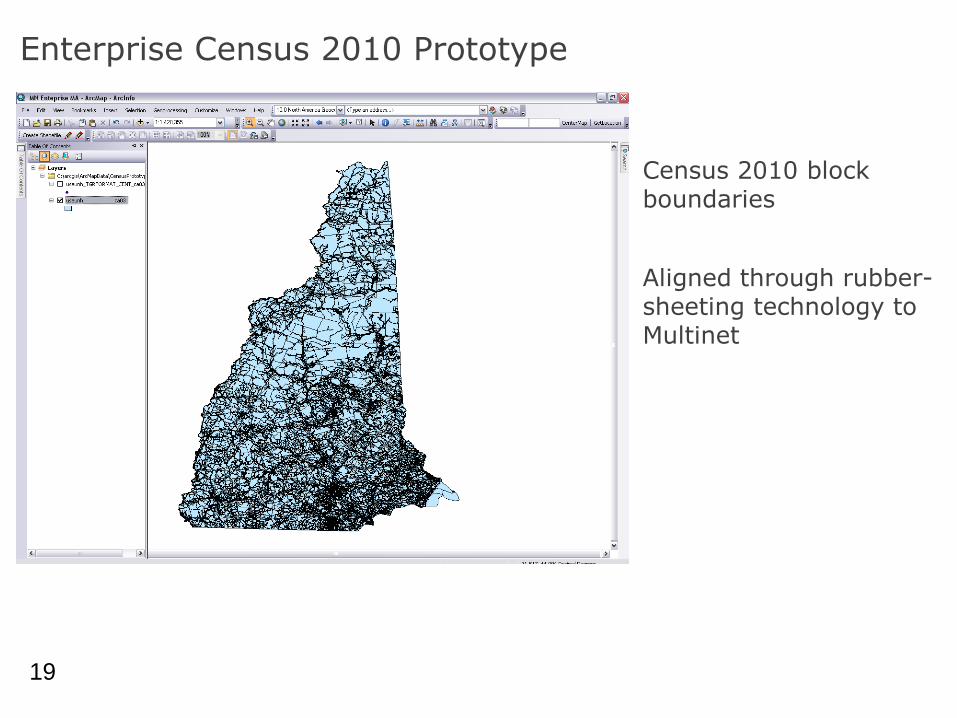
Enterprise Census 2010 Prototype
Census 2010 block boundaries
Aligned through rubber-sheeting technology to Multinet
19
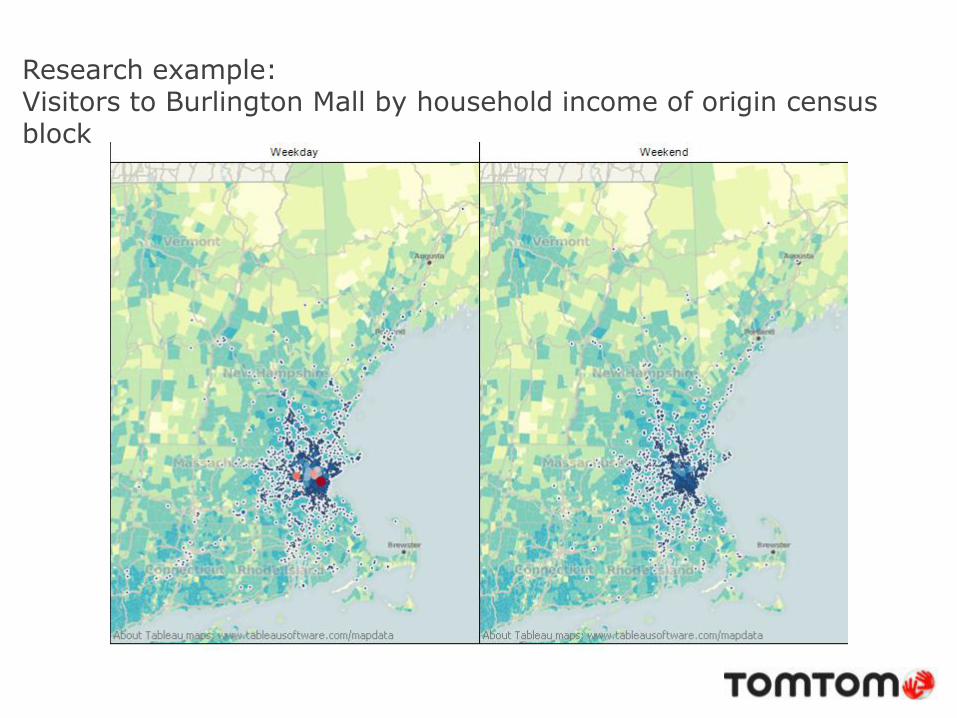
Research example: Visitors to Burlington Mall by household income of origin census block
© 2011 TomTom. All rights reserved. Confidential information.
Next steps:
• Identification of all systematic biases
• Create correction and expansion methods
• Validate use of Census data
• Identify most valuable use cases
• Define standardized output forms
Current projects underway:
• Netherlands: outdoor advertising
• France: toll road analysis
• California: modeling
• Virginia: modeling and planning
1 November 2011 21