gr. 11 physics energy -...
TRANSCRIPT
1
Gr. 11 Physics Energy This chart contains a complete list of the lessons and homework for Gr. 11 Physics. Please complete all the worksheets and
problems listed under “Homework” before the next class. A set of optional online resources, lessons and videos is also listed
under “Homework” and can easily be accessed through the links on the Syllabus found on the course webpage. You may
want to bookmark or download the syllabus for frequent use.
Energy
1 The Flow of Energy Energy flow diagrams, bar charts Lesson: Energy Diagrams
2 Doing Work! Positive, negative work, net work-
kinetic energy theorem Read: “Work”, pg. 126-130
Problems: pg. 128 #1,2,5, pg. 129 #8b, pg. 130
#12,13,14
Handbook: Doing Work Homework pg.4
Lesson: Work and Energy
3 Measuring Energy Kinetic energy, gravitational
potential energy Read: “Kinetic Energy”, pg. 134-135
Problems: pg. 135 #8,11,12
Handbook: Measuring Energy Homework pg.7
Lesson: Work and GPE
Video: Swinging Ball of Death
4 Changes in Gravitational
Energy
Path independence, vertical origin Read: “Determining Gravitational Potential Energy”, pg.
132
Problems: pg. 133 #1,5, pg. 136 #3,4
Handbook: Changes in Gravitational Energy pg.12
5 The Conservation of Energy Conservation of energy, thermal
energy Read: “The Law of Conservation of Energy”, pg. 136-139
Problems: pg. 139 #1-4, pg. 147 #2
Handbook: Conservation of Energy Homework pg.13
Lesson: Conservation Problems
Video: Canada’s Wonderland Behemoth
Simulation: Rollercoaster
Simulation: Skateboarding Park
6 Power Definition of power, watt Read: “Power”, pg. 154-155
Problems: pg. 155 #2,4,5
Video: Power. Stop at watching at 2:30
7 Review Day Review: pg. 158 #5-10, 12, 25, 29, pg. 186 #12-16, 18
Video: The Most Important Video You Will Ever See
8 Energy Test

2
SPH3U: The Flow of Energy
Energy is a mysterious quantity that allows us to do some wonderful things. If
we can keep track of energy, we can make predictions about our world that we
couldn’t easily do with forces.
A: Go with the Flow (of Energy)
When objects interact, energy can flow or transfer between them. Often when energy is transferred it becomes stored in
different ways. For example, it may be stored in the motion of an object and we label that portion of the energy kinetic
energy. Or it may be stored due a gravitational interaction and we label that portion gravitational energy.
1. Reason. For the first part of this investigation your group will need one pullback car. We choose our system to be the
car. Draw the car backwards across the table (don’t release it). During the drawing back process, do you think energy is
flowing into or out of the system? Explain.
2. Explain. Albert says, “I know I used energy to pull back the car, but I think that energy is just used up by my arm - I
learned in biology that my cells burn the energy. It hasn’t flowed anywhere, it’s just used up.” Where did the energy
from your arm go? How can you demonstrate to Albert that he is wrong? Explain.
An energy flow diagram is a representation of the energy that flows into or out of a system. Unlike an interaction diagram for
forces, an energy flow diagram only includes objects that exchange energy. Inside the circle we list the objects of the system
and outside the objects of the environment. We draw a line between each object representing an energy flow. We indicate the
direction energy flows between the objects by adding an arrow to the line.
3. Interpret. To help us understand what is happening with our car, we clarify our system by
showing both the car and the little spring inside it. Examine the energy flow diagram for the
system of the car while it is being pulled back at a steady speed. What is happening to the total
energy of the system? Describe the flows of energy that take place.
4. Represent. Draw an energy flow diagram for the car+spring system after you release it, while the car
is speeding up. Is energy flowing into or out of the system during this process? What is happening to
the total energy of the system?
Energy is never created or destroyed - it flows into or out of a system, or changes how it is stored within a system. This idea
is called the conservation of energy.
Due to friction interactions, energy is often transferred to the random jiggling of the particles in which case it is stored as
thermal energy. Due to friction, some energy is transferred to sound and other vibrations, but in most cases we will ignore
these small amounts.
5. Reason. The car is released and it finally stops. We might wonder if energy was still in the system. What could we
measure about the car to convince us that the energy was, in fact, still in the system?
Recorder: __________________
Manager: __________________
Speaker: _________________ 0 1 2 3 4 5
©
hand
car
spring
3
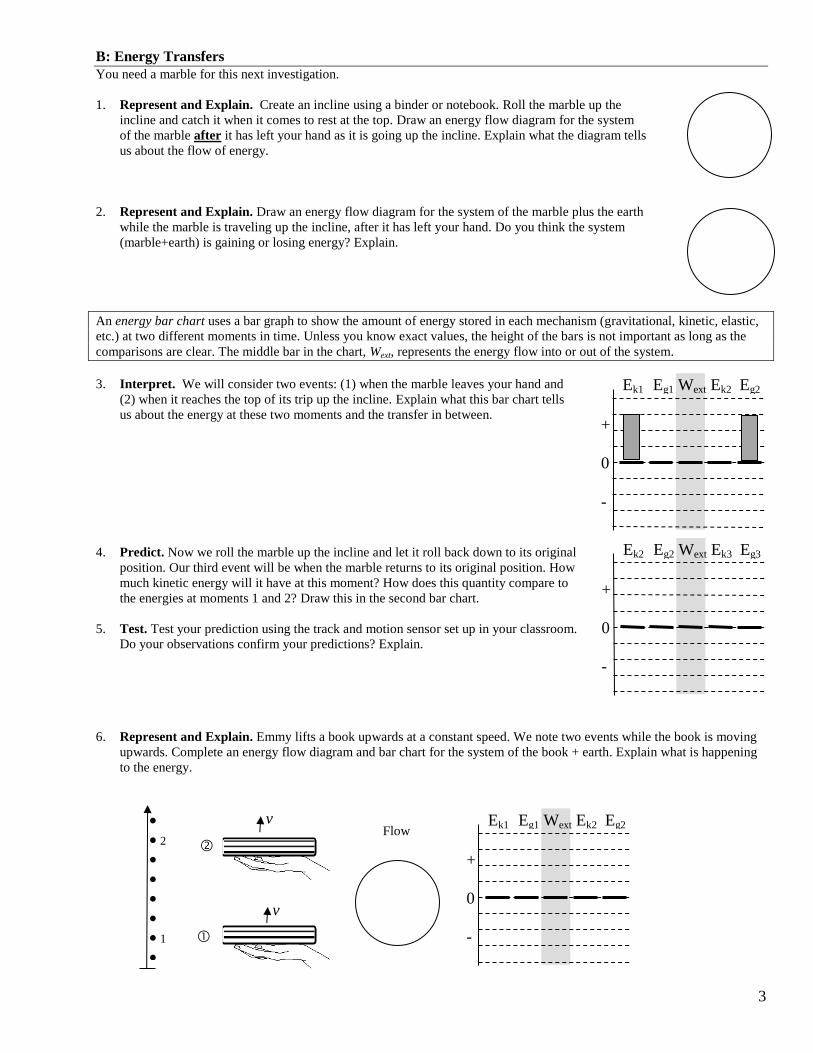
B: Energy Transfers
You need a marble for this next investigation.
1. Represent and Explain. Create an incline using a binder or notebook. Roll the marble up the
incline and catch it when it comes to rest at the top. Draw an energy flow diagram for the system
of the marble after it has left your hand as it is going up the incline. Explain what the diagram tells
us about the flow of energy.
2. Represent and Explain. Draw an energy flow diagram for the system of the marble plus the earth
while the marble is traveling up the incline, after it has left your hand. Do you think the system
(marble+earth) is gaining or losing energy? Explain.
An energy bar chart uses a bar graph to show the amount of energy stored in each mechanism (gravitational, kinetic, elastic,
etc.) at two different moments in time. Unless you know exact values, the height of the bars is not important as long as the
comparisons are clear. The middle bar in the chart, Wext, represents the energy flow into or out of the system.
3. Interpret. We will consider two events: (1) when the marble leaves your hand and
(2) when it reaches the top of its trip up the incline. Explain what this bar chart tells
us about the energy at these two moments and the transfer in between.
4. Predict. Now we roll the marble up the incline and let it roll back down to its original
position. Our third event will be when the marble returns to its original position. How
much kinetic energy will it have at this moment? How does this quantity compare to
the energies at moments 1 and 2? Draw this in the second bar chart.
5. Test. Test your prediction using the track and motion sensor set up in your classroom.
Do your observations confirm your predictions? Explain.
6. Represent and Explain. Emmy lifts a book upwards at a constant speed. We note two events while the book is moving
upwards. Complete an energy flow diagram and bar chart for the system of the book + earth. Explain what is happening
to the energy.
v
v
Flow Ek1 Eg1 Wext Ek2 Eg2
+
0
-
2
1
Ek1 Eg1 Wext Ek2 Eg2
+
0
-
Ek2 Eg2 Wext Ek3 Eg3
+
0
-
4
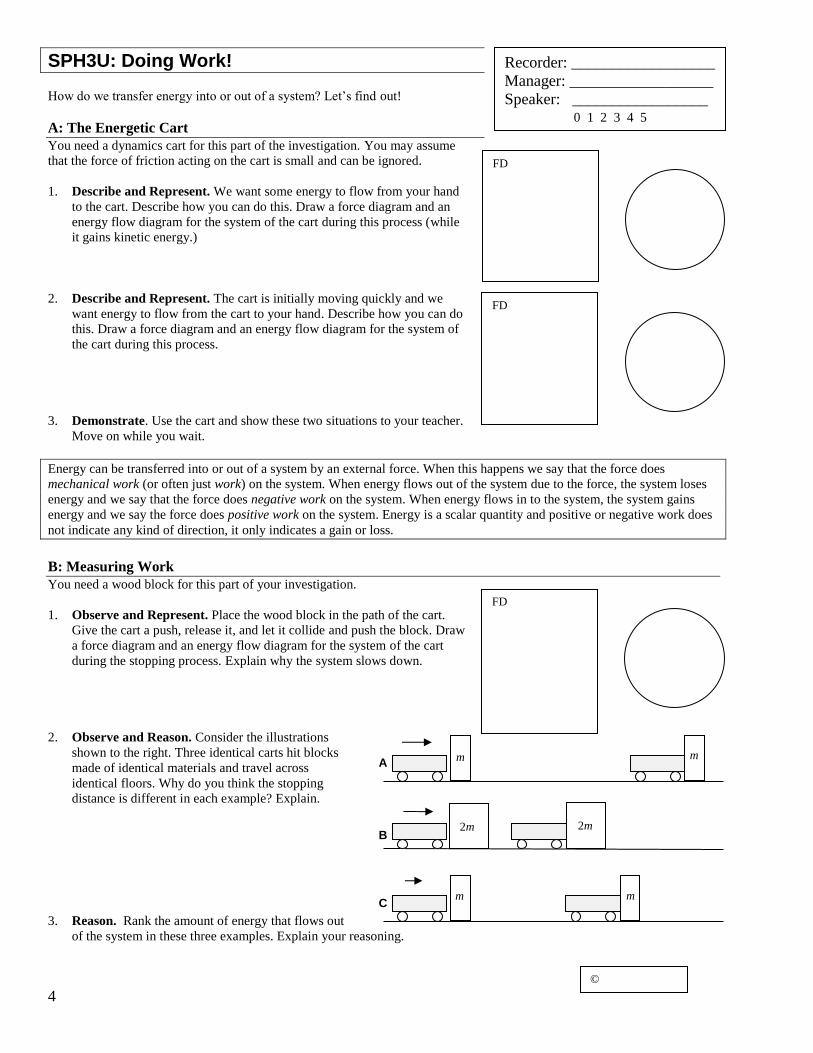
SPH3U: Doing Work!
How do we transfer energy into or out of a system? Let’s find out!
A: The Energetic Cart
You need a dynamics cart for this part of the investigation. You may assume
that the force of friction acting on the cart is small and can be ignored.
1. Describe and Represent. We want some energy to flow from your hand
to the cart. Describe how you can do this. Draw a force diagram and an
energy flow diagram for the system of the cart during this process (while
it gains kinetic energy.)
2. Describe and Represent. The cart is initially moving quickly and we
want energy to flow from the cart to your hand. Describe how you can do
this. Draw a force diagram and an energy flow diagram for the system of
the cart during this process.
3. Demonstrate. Use the cart and show these two situations to your teacher.
Move on while you wait.
Energy can be transferred into or out of a system by an external force. When this happens we say that the force does
mechanical work (or often just work) on the system. When energy flows out of the system due to the force, the system loses
energy and we say that the force does negative work on the system. When energy flows in to the system, the system gains
energy and we say the force does positive work on the system. Energy is a scalar quantity and positive or negative work does
not indicate any kind of direction, it only indicates a gain or loss.
B: Measuring Work
You need a wood block for this part of your investigation.
1. Observe and Represent. Place the wood block in the path of the cart.
Give the cart a push, release it, and let it collide and push the block. Draw
a force diagram and an energy flow diagram for the system of the cart
during the stopping process. Explain why the system slows down.
2. Observe and Reason. Consider the illustrations
shown to the right. Three identical carts hit blocks
made of identical materials and travel across
identical floors. Why do you think the stopping
distance is different in each example? Explain.
3. Reason. Rank the amount of energy that flows out
of the system in these three examples. Explain your reasoning.
Recorder: __________________
Manager: __________________
Speaker: _________________ 0 1 2 3 4 5
FD
FD
FD
©
A
B
C
m m
m m
2m 2m
5
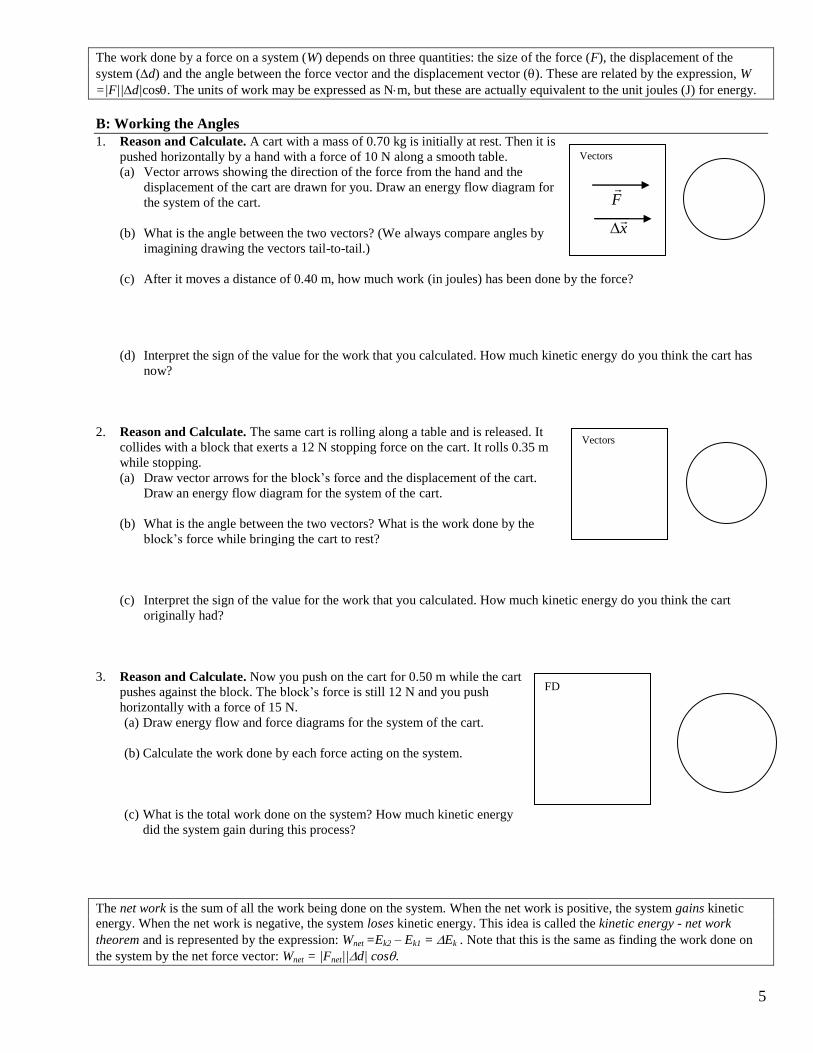
The work done by a force on a system (W) depends on three quantities: the size of the force (F), the displacement of the
system (d) and the angle between the force vector and the displacement vector (). These are related by the expression, W
=|F||d|cos. The units of work may be expressed as Nm, but these are actually equivalent to the unit joules (J) for energy.
B: Working the Angles
1. Reason and Calculate. A cart with a mass of 0.70 kg is initially at rest. Then it is
pushed horizontally by a hand with a force of 10 N along a smooth table.
(a) Vector arrows showing the direction of the force from the hand and the
displacement of the cart are drawn for you. Draw an energy flow diagram for
the system of the cart.
(b) What is the angle between the two vectors? (We always compare angles by
imagining drawing the vectors tail-to-tail.)
(c) After it moves a distance of 0.40 m, how much work (in joules) has been done by the force?
(d) Interpret the sign of the value for the work that you calculated. How much kinetic energy do you think the cart has
now?
2. Reason and Calculate. The same cart is rolling along a table and is released. It
collides with a block that exerts a 12 N stopping force on the cart. It rolls 0.35 m
while stopping.
(a) Draw vector arrows for the block’s force and the displacement of the cart.
Draw an energy flow diagram for the system of the cart.
(b) What is the angle between the two vectors? What is the work done by the
block’s force while bringing the cart to rest?
(c) Interpret the sign of the value for the work that you calculated. How much kinetic energy do you think the cart
originally had?
3. Reason and Calculate. Now you push on the cart for 0.50 m while the cart
pushes against the block. The block’s force is still 12 N and you push
horizontally with a force of 15 N.
(a) Draw energy flow and force diagrams for the system of the cart.
(b) Calculate the work done by each force acting on the system.
(c) What is the total work done on the system? How much kinetic energy
did the system gain during this process?
The net work is the sum of all the work being done on the system. When the net work is positive, the system gains kinetic
energy. When the net work is negative, the system loses kinetic energy. This idea is called the kinetic energy - net work
theorem and is represented by the expression: Wnet =Ek2 – Ek1 = Ek . Note that this is the same as finding the work done on
the system by the net force vector: Wnet = |Fnet||d| cos.
Vectors
F
x
Vectors
FD

6
SPH3U: Doing Work Homework Name:
A: The Toy Car
You are playing with a little kid, pushing a toy car across the floor and making “vroom, vroom” sounds. During a “car crash”
you push the car into a soft stuffed animal and it eventually comes to a stop.
1. Represent. Draw an energy flow diagram and a force diagram
for the system of the car. Use Fc to label the contact force of the
stuffed animal.
2. Reason. Which forces do you think cause energy to flow in or
out of the system? Explain.
3. Reason. Use the new expression for work (W =
|F||d|cos) to help complete the chart for each
force acting on the car.
4. Reason. During the car crash is energy flowing
in or out of the system? Explain how you know.
5. Reason. Do forces acting perpendicular to the displacement of an object transfer energy in or out of a system? Explain.
6. Reason. Did the sign of the work depend on our choice of a sign convention? (Did we make such a choice?) Explain.
7. You continue to push on the car (and so does the stuffed animal), but it is now speeding up.
(a) Reason. Is this situation accurately described by the FD and energy flow diagram above? Would you need to make
any changes? Explain.
(b) Reason. Is the car gaining or losing kinetic energy? Use the kinetic energy-net work theorem to determine the sign
of the net work.
(c) Reason. How does the amount of energy transferred by each force compare in this situation?
8. Calculate. The size of your push is 3.1 N. The contact force from the stuffed animal is 3.4 N. The car initially had 1.7 J
of kinetic energy. How far does it travel before stopping?
Force Sign of work?
(+, - or 0)
Flow of energy?
(in, out or none)
Fa
Fc
Fn
Fg
FD
©

7
SPH3U: Measuring Energy Homework Name:
A: Comparing Gravitational Energies
1. Reason. Six objects and their vertical positions relative to an origin are shown. Rank the gravitational energies of each
object relative to its vertical origin. Explain your ranking.
B: Comparing Kinetic Energies
1. Reason. The velocity and mass of
five objects is shown to the right.
Rank the amount of kinetic energy
each object has. Explain your
ranking.
2. Reason. The velocity and mass of
five objects is shown to the right.
(Note the directions!) Rank the
amount of kinetic energy each
object has. Explain your ranking.
C: Calculating Energies
1. Reason. A friend proudly shows you the results of his calculation. Explain what errors he made and correct his solution.
m = 250 g
v1 = 5.0 km/h
y1 = 3.4 m
Eg1 = mgy1 = (250 g)(9.8 N/kg)(3.4 m) = 8330 J
Ek1 = ½mv2 = (0.5)(250 g)(5.0 km/h)
2 = 3125 J
2. Reason. Two identical test cars are driving down a test track and hit their brakes at the same position. One car is
travelling at twice the speed as the other. Compare the kinetic energies of the two cars. Use the idea of work to explain
how much further the faster car travels while braking.
m 2m
m 2m
v 2v 4m v v 2v
A B C D E
m 2m
m 2m
v v m 2v v v
A B C D E
2m
m
A
0
y =
10 m m
B
0
y =
5 m
m
C
0
y =
5 m
D
0
y =
5 m
2m
E
0
y =
5 m 2m
F
y =
0
8
SPH3U: Measuring Energy
The idea of work provides us with a handy way to measure the amount of
energy transferred during some process involving forces. Now we need to use
work to find out how much energy transfers into kinetic or gravitational energy.
A: Making Dents
Imagine you lift up a heavy weight and place a foam block underneath. You let go of the weight and it falls on top of the
block. A dent is left in the piece of foam.
1. Explain. How does energy flow while you lift the heavy weight?
2. Reason. What could you change about this situation to change the size of the dent in the same foam block?
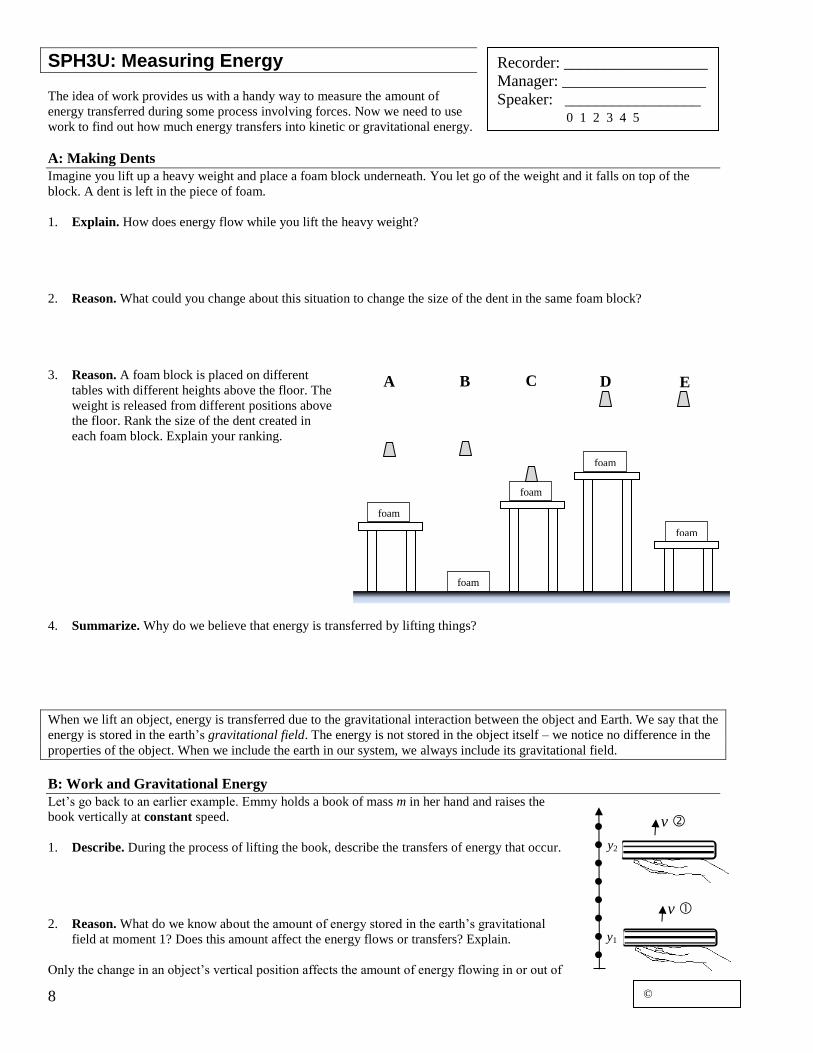
3. Reason. A foam block is placed on different
tables with different heights above the floor. The
weight is released from different positions above
the floor. Rank the size of the dent created in
each foam block. Explain your ranking.
4. Summarize. Why do we believe that energy is transferred by lifting things?
When we lift an object, energy is transferred due to the gravitational interaction between the object and Earth. We say that the
energy is stored in the earth’s gravitational field. The energy is not stored in the object itself – we notice no difference in the
properties of the object. When we include the earth in our system, we always include its gravitational field.
B: Work and Gravitational Energy
Let’s go back to an earlier example. Emmy holds a book of mass m in her hand and raises the
book vertically at constant speed.
1. Describe. During the process of lifting the book, describe the transfers of energy that occur.
2. Reason. What do we know about the amount of energy stored in the earth’s gravitational
field at moment 1? Does this amount affect the energy flows or transfers? Explain.
Only the change in an object’s vertical position affects the amount of energy flowing in or out of
Recorder: __________________
Manager: __________________
Speaker: _________________ 0 1 2 3 4 5
●
● y2
●
●
●
●
● y1
●
v
v
©
foam
A
foam
B
foam
C D
foam
foam
E
9
Earth’s gravitational field. As a consequence, no matter what amount of initial gravitational energy we guess, the flows will
turn out the same. We could even guess zero. Because of this, we have a freedom to choose a zero point for gravitational
energy.
3. Represent and Describe. Complete the energy flow diagram and
bar chart for the book-earth system. Describe what vertical position
you are using for your zero point for the gravitational energy.
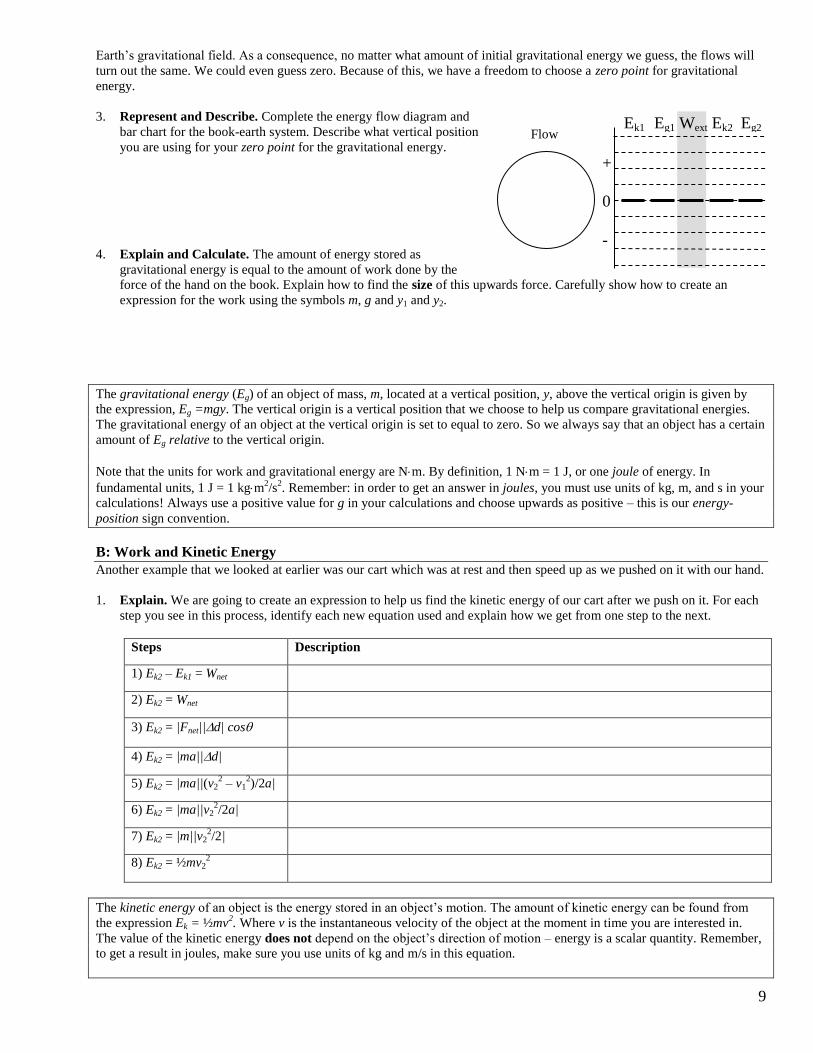
4. Explain and Calculate. The amount of energy stored as
gravitational energy is equal to the amount of work done by the
force of the hand on the book. Explain how to find the size of this upwards force. Carefully show how to create an
expression for the work using the symbols m, g and y1 and y2.
The gravitational energy (Eg) of an object of mass, m, located at a vertical position, y, above the vertical origin is given by
the expression, Eg =mgy. The vertical origin is a vertical position that we choose to help us compare gravitational energies.
The gravitational energy of an object at the vertical origin is set to equal to zero. So we always say that an object has a certain
amount of Eg relative to the vertical origin.
Note that the units for work and gravitational energy are Nm. By definition, 1 Nm = 1 J, or one joule of energy. In
fundamental units, 1 J = 1 kgm2/s
2. Remember: in order to get an answer in joules, you must use units of kg, m, and s in your
calculations! Always use a positive value for g in your calculations and choose upwards as positive – this is our energy-
position sign convention.
B: Work and Kinetic Energy
Another example that we looked at earlier was our cart which was at rest and then speed up as we pushed on it with our hand.
1. Explain. We are going to create an expression to help us find the kinetic energy of our cart after we push on it. For each
step you see in this process, identify each new equation used and explain how we get from one step to the next.
Steps Description
1) Ek2 – Ek1 = Wnet
2) Ek2 = Wnet
3) Ek2 = |Fnet||d| cos
4) Ek2 = |ma||d|
5) Ek2 = |ma||(v22 – v1
2)/2a|
6) Ek2 = |ma||v22/2a|
7) Ek2 = |m||v22/2|
8) Ek2 = ½mv22
The kinetic energy of an object is the energy stored in an object’s motion. The amount of kinetic energy can be found from
the expression Ek = ½mv2. Where v is the instantaneous velocity of the object at the moment in time you are interested in.
The value of the kinetic energy does not depend on the object’s direction of motion – energy is a scalar quantity. Remember,
to get a result in joules, make sure you use units of kg and m/s in this equation.
Flow Ek1 Eg1 Wext Ek2 Eg2
+
0
-
10
SPH3U: Changes in Gravitational Energy
When objects move vertically energy flows in or out of Earth’s gravitational
field. Let’s follow this transfer and learn how to predict the motion of the
system.
A: The Ball Drop and Kinetic Energy
You will drop a basketball through a displacement of your choice (between 0.5 and 1.2 m) and examine the energy changes.
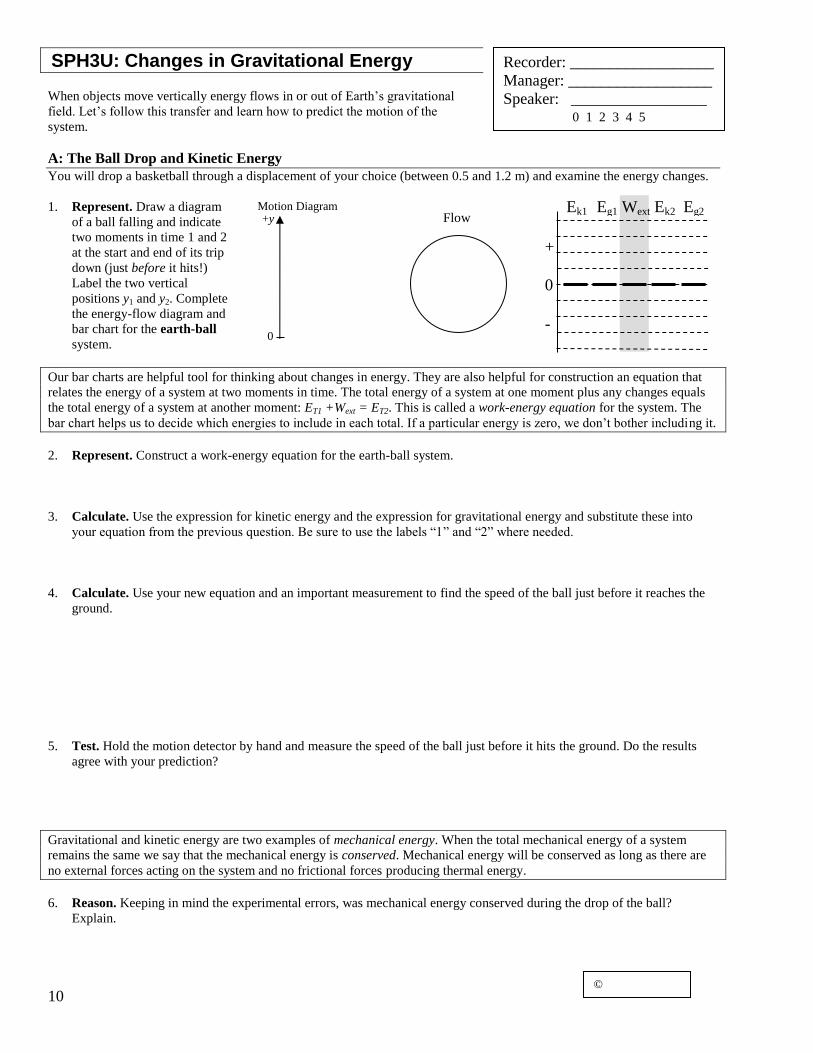
1. Represent. Draw a diagram
of a ball falling and indicate
two moments in time 1 and 2
at the start and end of its trip
down (just before it hits!)
Label the two vertical
positions y1 and y2. Complete
the energy-flow diagram and
bar chart for the earth-ball
system.
Our bar charts are helpful tool for thinking about changes in energy. They are also helpful for construction an equation that
relates the energy of a system at two moments in time. The total energy of a system at one moment plus any changes equals
the total energy of a system at another moment: ET1 +Wext = ET2. This is called a work-energy equation for the system. The
bar chart helps us to decide which energies to include in each total. If a particular energy is zero, we don’t bother including it.
2. Represent. Construct a work-energy equation for the earth-ball system.
3. Calculate. Use the expression for kinetic energy and the expression for gravitational energy and substitute these into
your equation from the previous question. Be sure to use the labels “1” and “2” where needed.
4. Calculate. Use your new equation and an important measurement to find the speed of the ball just before it reaches the
ground.
5. Test. Hold the motion detector by hand and measure the speed of the ball just before it hits the ground. Do the results
agree with your prediction?
Gravitational and kinetic energy are two examples of mechanical energy. When the total mechanical energy of a system
remains the same we say that the mechanical energy is conserved. Mechanical energy will be conserved as long as there are
no external forces acting on the system and no frictional forces producing thermal energy.
6. Reason. Keeping in mind the experimental errors, was mechanical energy conserved during the drop of the ball?
Explain.
Recorder: __________________
Manager: __________________
Speaker: _________________ 0 1 2 3 4 5
©
0
Flow Ek1 Eg1 Wext Ek2 Eg2
+
0
-
+y Motion Diagram

11
B: The Ramp Race
Your teacher has two tracks set up at the front of the class.
One track has a steep incline and the other a more gradual
incline. Both start at the same height and end at the same
height. Friction is very small and can be neglected.
1. Reason. What energy changes take place as the ball
travels down the incline?
2. Reason and Predict. Two horizontal positions, 1 and
2, are indicated in the diagram. The two balls are released at the same time. Which ball do you think will reach position 2
first? Justify your prediction with energy arguments.
3. Reason and Predict. How will the speeds of the two balls compare when they reach position 2? Justify your prediction.
4. Observe. Record your observations of the motion of the balls when they are released at position 1 at the same time.
5. Observe. Record your observations of the speeds of the balls when they reach position 2.
6. Reason. Albert says, “I don’t understand why ball B wins the race. They both end up traveling roughly the same distance
and ball A even accelerates for more time! It should be faster!” Based on your observations and understanding of energy,
help Albert understand.
7. Reason. According to your observations, how do the kinetic energies of the two balls compare at position 2? Where did
this energy come from?
8. Reason. The distance the balls travel along each incline is slightly different, but there is an important similarity.
Compare the horizontal displacement of each ball along its incline (you may need to make measurements). Compare the
vertical displacement of each ball along its incline. Illustrate this with vectors on the diagram above. Which displacement
is the important one when determining the change in gravitational potential energy?
The amount of energy stored in, or returned from gravity does not depend on the path taken by the object. It only depends
on the object’s change in vertical position (displacement). The property is called path independence – any path between the
same vertical positions will give the same results. This is a result of the fact that gravity does no work on an object during the
horizontal parts of the object’s motion.
1 2 Ball
A
Ball
B
12
SPH3U: Changes in Gravitational Energy Homework Name:
A: Comparing Vertical Origins
The value for the gravitational energy depends on the
choice of the vertical origin. If two people choose a
different vertical origin, will their calculations predict
different things? Let’s see!
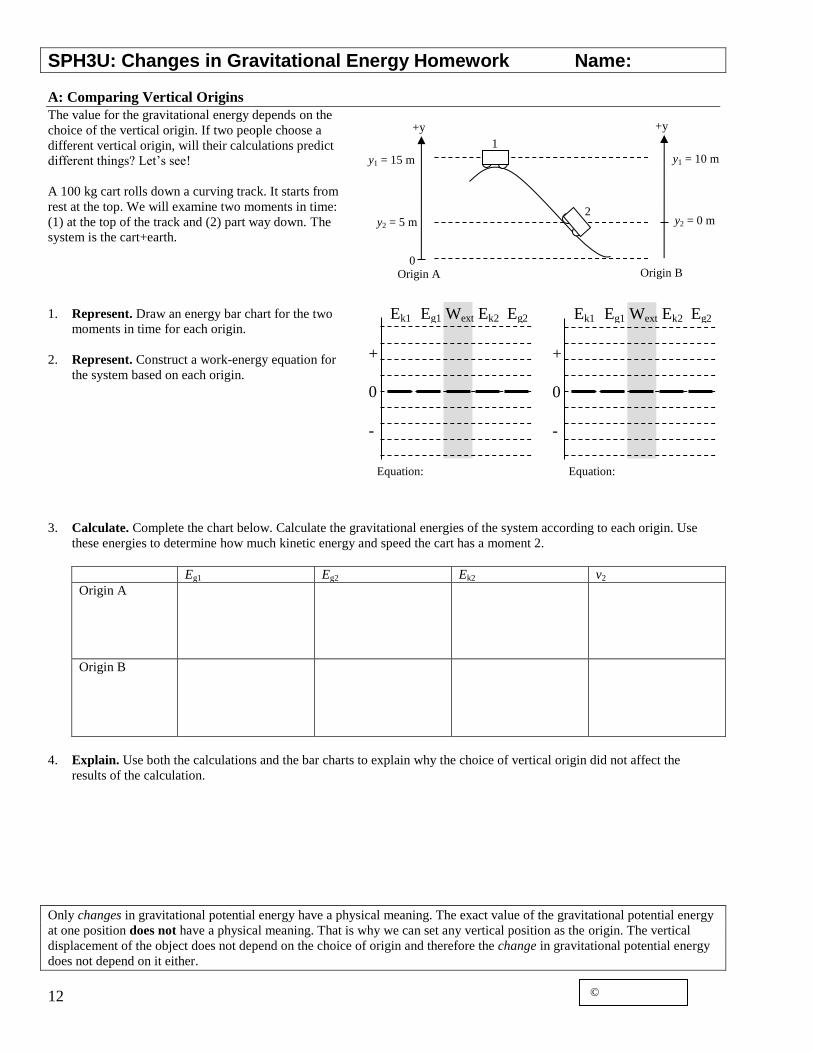
A 100 kg cart rolls down a curving track. It starts from
rest at the top. We will examine two moments in time:
(1) at the top of the track and (2) part way down. The
system is the cart+earth.
1. Represent. Draw an energy bar chart for the two
moments in time for each origin.
2. Represent. Construct a work-energy equation for
the system based on each origin.
3. Calculate. Complete the chart below. Calculate the gravitational energies of the system according to each origin. Use
these energies to determine how much kinetic energy and speed the cart has a moment 2.
Eg1 Eg2 Ek2 v2
Origin A
Origin B
4. Explain. Use both the calculations and the bar charts to explain why the choice of vertical origin did not affect the
results of the calculation.
Only changes in gravitational potential energy have a physical meaning. The exact value of the gravitational potential energy
at one position does not have a physical meaning. That is why we can set any vertical position as the origin. The vertical
displacement of the object does not depend on the choice of origin and therefore the change in gravitational potential energy
does not depend on it either.
1
2
Origin A
+y
y1 = 15 m
y2 = 5 m
0 Origin B
+y
y1 = 10 m
y2 = 0 m
Ek1 Eg1 Wext Ek2 Eg2
+
0
-
Ek1 Eg1 Wext Ek2 Eg2
+
0
-
Equation: Equation:
©
13
SPH3U: Conservation of Energy Homework Name:
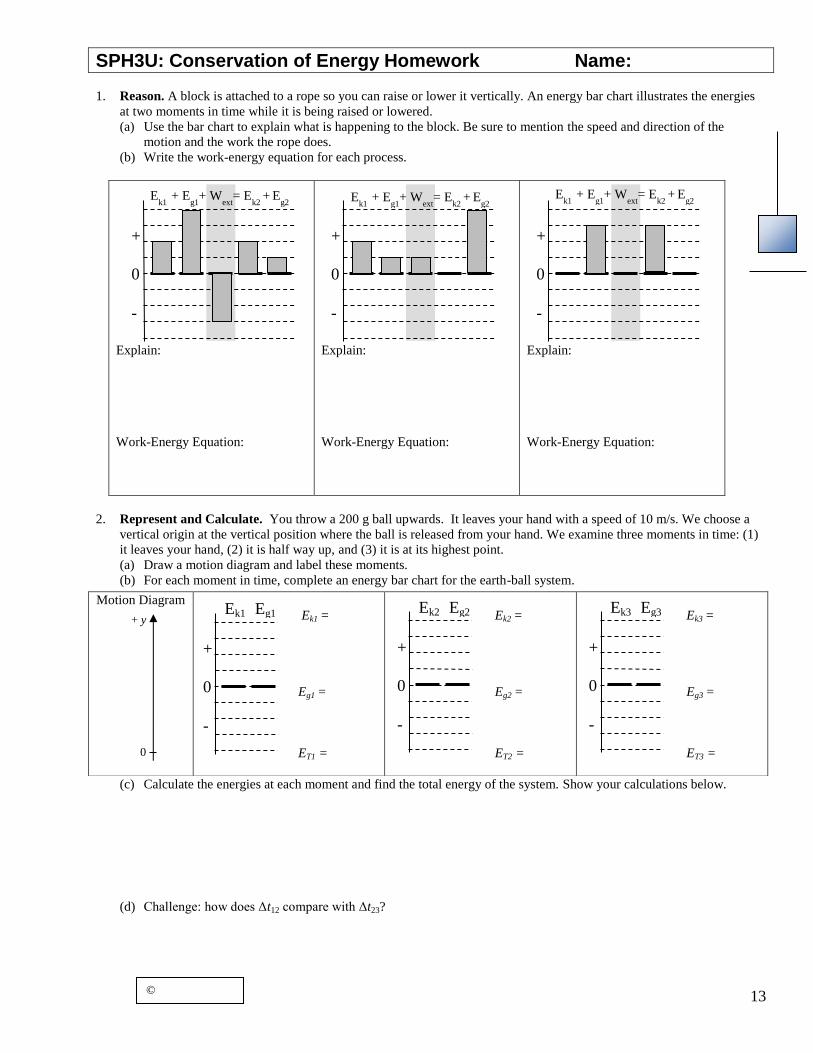
1. Reason. A block is attached to a rope so you can raise or lower it vertically. An energy bar chart illustrates the energies
at two moments in time while it is being raised or lowered.
(a) Use the bar chart to explain what is happening to the block. Be sure to mention the speed and direction of the
motion and the work the rope does.
(b) Write the work-energy equation for each process.
Explain:
Work-Energy Equation:
Explain:
Work-Energy Equation:
Explain:
Work-Energy Equation:
2. Represent and Calculate. You throw a 200 g ball upwards. It leaves your hand with a speed of 10 m/s. We choose a
vertical origin at the vertical position where the ball is released from your hand. We examine three moments in time: (1)
it leaves your hand, (2) it is half way up, and (3) it is at its highest point.
(a) Draw a motion diagram and label these moments.
(b) For each moment in time, complete an energy bar chart for the earth-ball system.
(c) Calculate the energies at each moment and find the total energy of the system. Show your calculations below.
(d) Challenge: how does Δt12 compare with Δt23?
Motion Diagram
Ek1 =
Eg1 =
ET1 =
Ek2 =
Eg2 =
ET2 =
Ek3 =
Eg3 =
ET3 =
+
0
-
Ek1
+ Eg1
+ Wext
= Ek2
+ E
g2
+
0
-
Ek1
+ Eg1
+ Wext
= Ek2
+ E
g2
+
0
-
Ek1
+ Eg1
+ Wext
= Ek2
+ E
g2
0
+ y
©
Ek1 Eg1
+
0
-
Ek2 Eg2
+
0
-
Ek3 Eg3
+
0
-
14
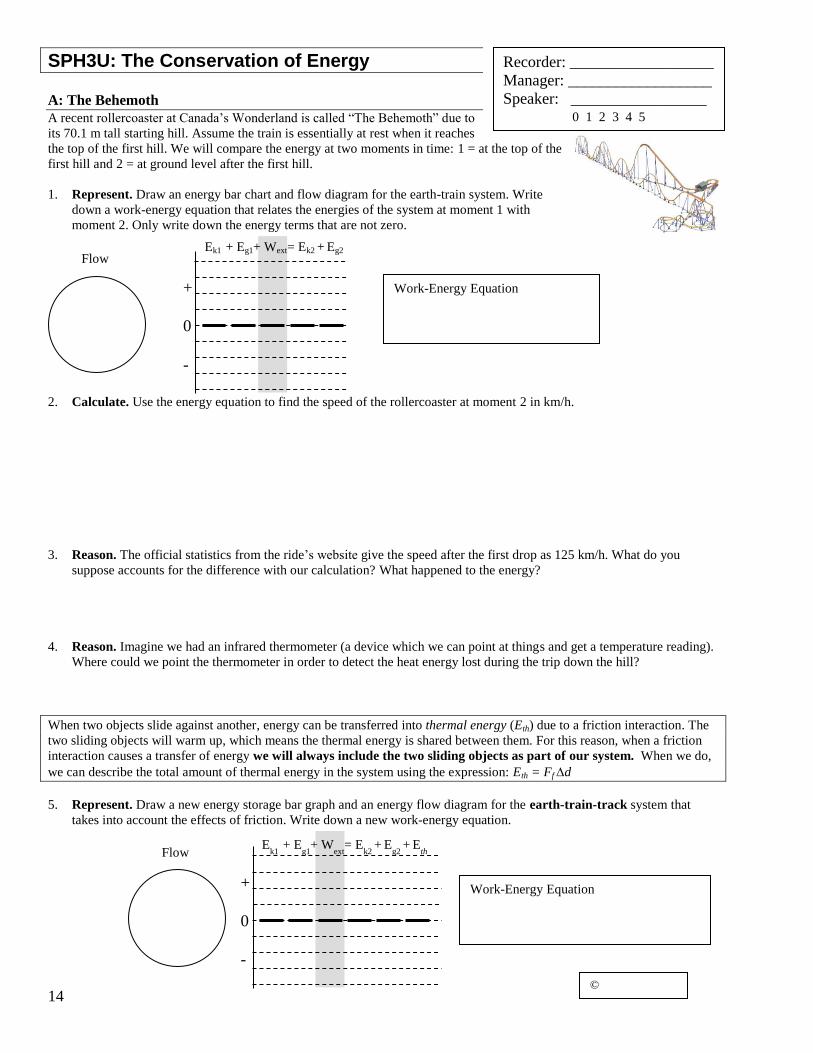
SPH3U: The Conservation of Energy A: The Behemoth
A recent rollercoaster at Canada’s Wonderland is called “The Behemoth” due to
its 70.1 m tall starting hill. Assume the train is essentially at rest when it reaches
the top of the first hill. We will compare the energy at two moments in time: 1 = at the top of the
first hill and 2 = at ground level after the first hill.
1. Represent. Draw an energy bar chart and flow diagram for the earth-train system. Write
down a work-energy equation that relates the energies of the system at moment 1 with
moment 2. Only write down the energy terms that are not zero.
2. Calculate. Use the energy equation to find the speed of the rollercoaster at moment 2 in km/h.
3. Reason. The official statistics from the ride’s website give the speed after the first drop as 125 km/h. What do you
suppose accounts for the difference with our calculation? What happened to the energy?
4. Reason. Imagine we had an infrared thermometer (a device which we can point at things and get a temperature reading).
Where could we point the thermometer in order to detect the heat energy lost during the trip down the hill?
When two objects slide against another, energy can be transferred into thermal energy (Eth) due to a friction interaction. The
two sliding objects will warm up, which means the thermal energy is shared between them. For this reason, when a friction
interaction causes a transfer of energy we will always include the two sliding objects as part of our system. When we do,
we can describe the total amount of thermal energy in the system using the expression: Eth = Ff d
5. Represent. Draw a new energy storage bar graph and an energy flow diagram for the earth-train-track system that
takes into account the effects of friction. Write down a new work-energy equation.
Flow Ek1 + Eg1+ Wext= Ek2 + Eg2
+
0
-
Work-Energy Equation
Recorder: __________________
Manager: __________________
Speaker: _________________ 0 1 2 3 4 5
Flow
Work-Energy Equation +
0
-
Ek1
+ Eg1
+ Wext
= Ek2
+ E
g2 +
E
th
©
15
6. Calculate. Use the train mass, mt = 2.7 x 10³ kg to determine the amount of thermal energy at moment 2.
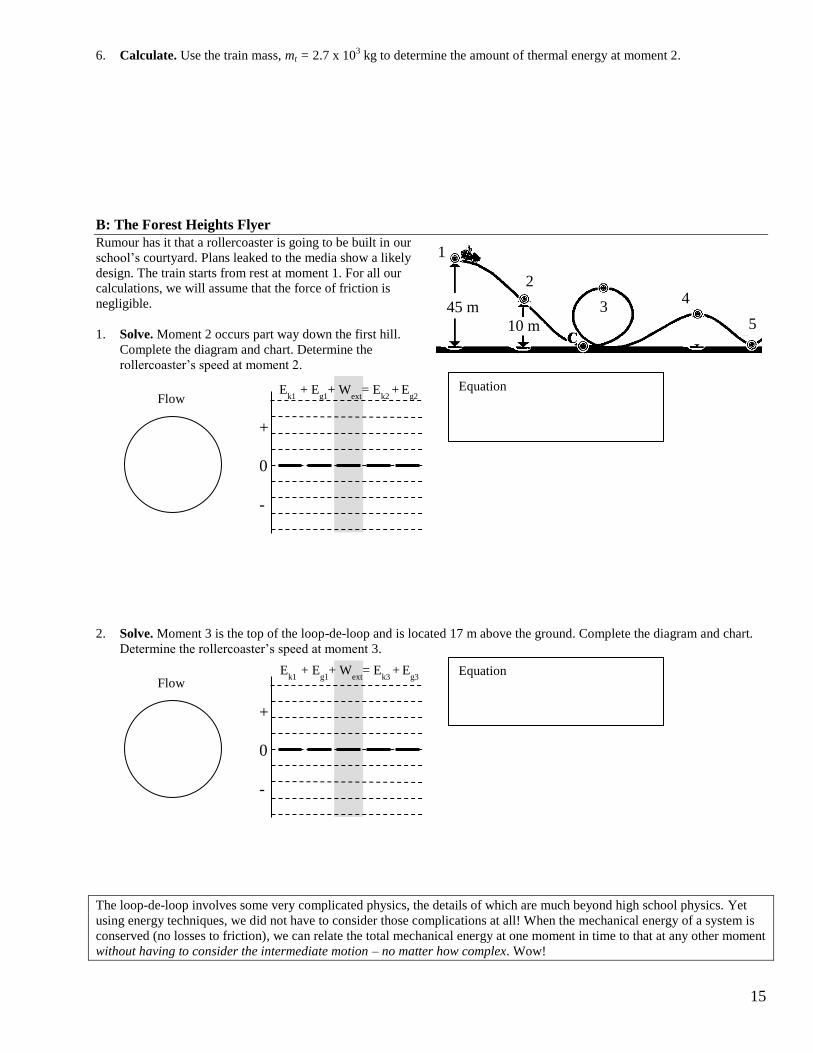
B: The Forest Heights Flyer
Rumour has it that a rollercoaster is going to be built in our
school’s courtyard. Plans leaked to the media show a likely
design. The train starts from rest at moment 1. For all our
calculations, we will assume that the force of friction is
negligible.
1. Solve. Moment 2 occurs part way down the first hill.
Complete the diagram and chart. Determine the
rollercoaster’s speed at moment 2.
2. Solve. Moment 3 is the top of the loop-de-loop and is located 17 m above the ground. Complete the diagram and chart.
Determine the rollercoaster’s speed at moment 3.
The loop-de-loop involves some very complicated physics, the details of which are much beyond high school physics. Yet
using energy techniques, we did not have to consider those complications at all! When the mechanical energy of a system is
conserved (no losses to friction), we can relate the total mechanical energy at one moment in time to that at any other moment
without having to consider the intermediate motion – no matter how complex. Wow!
Flow
+
0
-
Equation Ek1
+ Eg1
+ Wext
= Ek2
+ E
g2
Flow
+
0
-
Equation Ek1
+ Eg1
+ Wext
= Ek3
+ E
g3
1
2
3 4
5 45 m
10 m

16
SPH3U: Power
Winning a race is all about transferring as much energy as possible in the least
amount of time. The winner is often the most powerful individual.
Power is defined as the ratio of the amount of work done, W, to the time interval, t, that it takes to do the work, giving:
P=W/t. The fundamental units for power are joules/seconds where 1 joule/second equals one watt (W).
A: The Stair Master
Let’s figure out your leg power while travelling up a flight of stairs.
1. Reason. Describe the energy changes that take place while you go up the stairs at a constant speed.
2. Represent. Complete an energy flow diagram and bar chart
for your trip up the stairs.
3. Reason. Explain what you would measure in order to
determine the work you do while travelling up a set of stairs.
Quickly sketch a diagram of this showing all the important
quantities.
4. Reason. To calculate your power, you will need one other piece of information. Explain.
** check with your teacher before gathering any equipment **
5. Observe. Gather the equipment you will need for your measurements. Travel up a flight of stairs at a quick pace (but
don’t run, we don’t want you to fall!) Record your measurements on your diagram.
6. Calculate. Compute your leg power in watts (W).
Recorder: __________________
Manager: __________________
Speaker: _________________ 0 1 2 3 4 5
Flow
+
0
-
Ek1
+ Eg1
+ Wext
= Ek2
+ E
g2
17
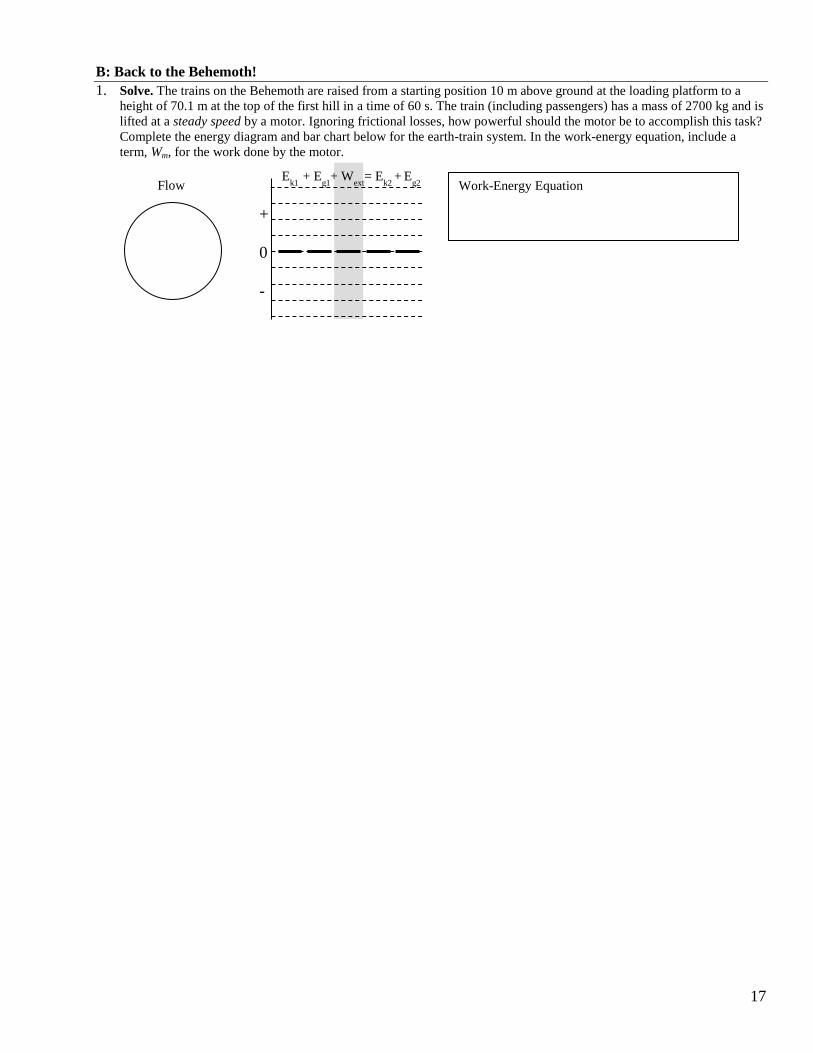
B: Back to the Behemoth!
1. Solve. The trains on the Behemoth are raised from a starting position 10 m above ground at the loading platform to a
height of 70.1 m at the top of the first hill in a time of 60 s. The train (including passengers) has a mass of 2700 kg and is
lifted at a steady speed by a motor. Ignoring frictional losses, how powerful should the motor be to accomplish this task?
Complete the energy diagram and bar chart below for the earth-train system. In the work-energy equation, include a
term, Wm, for the work done by the motor.
Flow
+
0
-
Work-Energy Equation E
k1 + E
g1+ W
ext= E
k2 +
E
g2