gracefully mitigating breakdowns in robotic...
TRANSCRIPT

Gracefully Mitigating Breakdowns in Robotic Services
Min Kyung Lee1, Sara Kiesler1, Jodi Forlizzi1, Siddhartha Srinivasa2, 3, Paul Rybski2
Human-Computer Interaction Institute1, Robotics Institute2
Carnegie Mellon University Pittsburgh, PA, USA
{mklee, kiesler, forlizzi, rybski}@cs.cmu.edu
Intel Research3
Pittsburgh, PA, USA [email protected]
Abstract — Robots that operate in the real world will make mistakes, and those who design and build systems will need to understand how best to provide ways for robots to mitigate those mistakes. Building on diverse research literatures, we consider how to mitigate breakdowns in services provided by robots. Expectancy-setting strategies forewarn people of a robot’s limitations so people will expect mistakes. Recovery strategies, including apologies, compensation, and options for the user, aim to reduce the negative consequence of breakdowns. We tested these strategies in an online scenario study with 317 participants. A breakdown in robotic service had severe impact on evaluations of the service and the robot, but forewarning and recovery strategies reduced the negative impact of the breakdown. People’s orientation toward services influenced which recovery strategy worked best. Those with a relational orientation responded best to the apology; those with a utilitarian orientation responded best to the compensation. We discuss robotic service design to mitigate service problems.
Keywords- robot error; error recovery; services; service recovery; social robot; HRI
I. INTRODUCTION Robots are increasingly able to perform services for people,
and they will be especially attractive for doing repetitive, unpleasant, and effortful tasks in workplaces, hospitals, and public environments. As anyone knows who has dealt with airlines, hospitals, and stores, services are imperfect. Robotic services may offer an overall service improvement, such as when a robot reliably delivers medications in a hospital, but robots that interact with people will make mistakes. For example, the hospital delivery robot may interrupt nurses dealing with an emergency [see [18][26]]. Service mistakes can lower people’s trust and satisfaction, and increase their reluctance to use the service again. Service mistakes are a leading cause of customer switching behavior [11].
We argue that designing appropriate robotic service recovery strategies is a necessary component of robotic services. People often become emotionally upset when there is a service breakdown, and often are more dissatisfied by a failure of the recovery than the mistake itself [3]. Gracefully mitigating breakdowns can be important for sustaining people’s satisfaction and preventing them from abandoning a robotic service. Appropriate recovery strategies also offer an
opportunity for a strengthened relationship between the service and its users [1][7][28].
Service breakdowns can occur at many levels of a service. For example, a service breakdown at the organizational level occurs when management fails to put resources into customer service, and a service breakdown at the individual provider level occurs when a customer service agent is rude. When a service is partly automated, customers can blame the breakdown on factors at any level. Technology used in service provision can complicate the blame and recovery process. For example, when an automated telephone reservation agent’s understanding of speech is faulty, people may not be sure who or what is at fault, including themselves.
We focus in this paper on a robot that delivers a personal service, using the example of a mobile robot that delivers the wrong drink. We apply ideas from psychology, consumer research, and HRI (Human-Robot Interaction) to the question of how such a robot should mitigate errors and aid in service recovery. From a scenario study of the delivery mistake, we show that service failure does impact satisfaction and perceptions of the robot negatively, that a recovery strategy can mitigate these negative effects, and that successful strategies depend in part on peoples’ orientation toward services.
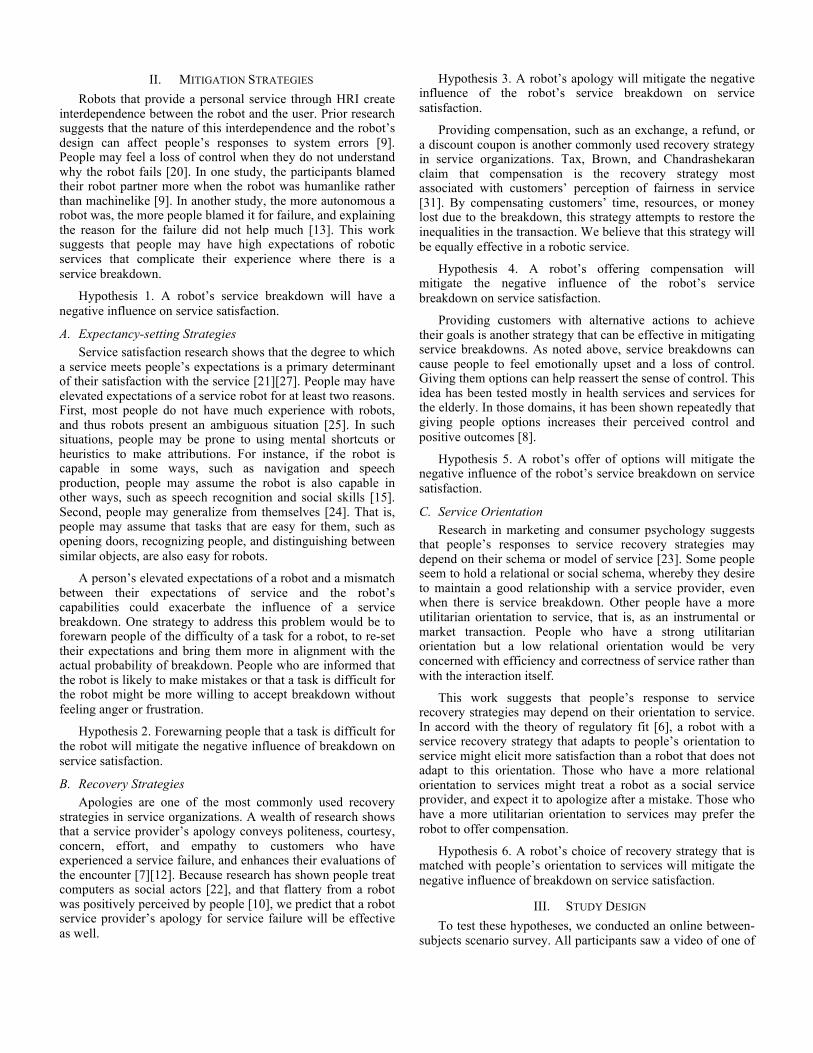
Figure 1. Snackbot (a) and HERB (b), service robots used in the study.
II. MITIGATION STRATEGIES Robots that provide a personal service through HRI create
interdependence between the robot and the user. Prior research suggests that the nature of this interdependence and the robot’s design can affect people’s responses to system errors [9]. People may feel a loss of control when they do not understand why the robot fails [20]. In one study, the participants blamed their robot partner more when the robot was humanlike rather than machinelike [9]. In another study, the more autonomous a robot was, the more people blamed it for failure, and explaining the reason for the failure did not help much [13]. This work suggests that people may have high expectations of robotic services that complicate their experience where there is a service breakdown.
Hypothesis 1. A robot’s service breakdown will have a negative influence on service satisfaction.
A. Expectancy-setting Strategies Service satisfaction research shows that the degree to which
a service meets people’s expectations is a primary determinant of their satisfaction with the service [21][27]. People may have elevated expectations of a service robot for at least two reasons. First, most people do not have much experience with robots, and thus robots present an ambiguous situation [25]. In such situations, people may be prone to using mental shortcuts or heuristics to make attributions. For instance, if the robot is capable in some ways, such as navigation and speech production, people may assume the robot is also capable in other ways, such as speech recognition and social skills [15]. Second, people may generalize from themselves [24]. That is, people may assume that tasks that are easy for them, such as opening doors, recognizing people, and distinguishing between similar objects, are also easy for robots.
A person’s elevated expectations of a robot and a mismatch between their expectations of service and the robot’s capabilities could exacerbate the influence of a service breakdown. One strategy to address this problem would be to forewarn people of the difficulty of a task for a robot, to re-set their expectations and bring them more in alignment with the actual probability of breakdown. People who are informed that the robot is likely to make mistakes or that a task is difficult for the robot might be more willing to accept breakdown without feeling anger or frustration.
Hypothesis 2. Forewarning people that a task is difficult for the robot will mitigate the negative influence of breakdown on service satisfaction.
B. Recovery Strategies Apologies are one of the most commonly used recovery
strategies in service organizations. A wealth of research shows that a service provider’s apology conveys politeness, courtesy, concern, effort, and empathy to customers who have experienced a service failure, and enhances their evaluations of the encounter [7][12]. Because research has shown people treat computers as social actors [22], and that flattery from a robot was positively perceived by people [10], we predict that a robot service provider’s apology for service failure will be effective as well.
Hypothesis 3. A robot’s apology will mitigate the negative influence of the robot’s service breakdown on service satisfaction.
Providing compensation, such as an exchange, a refund, or a discount coupon is another commonly used recovery strategy in service organizations. Tax, Brown, and Chandrashekaran claim that compensation is the recovery strategy most associated with customers’ perception of fairness in service [31]. By compensating customers’ time, resources, or money lost due to the breakdown, this strategy attempts to restore the inequalities in the transaction. We believe that this strategy will be equally effective in a robotic service.
Hypothesis 4. A robot’s offering compensation will mitigate the negative influence of the robot’s service breakdown on service satisfaction.
Providing customers with alternative actions to achieve their goals is another strategy that can be effective in mitigating service breakdowns. As noted above, service breakdowns can cause people to feel emotionally upset and a loss of control. Giving them options can help reassert the sense of control. This idea has been tested mostly in health services and services for the elderly. In those domains, it has been shown repeatedly that giving people options increases their perceived control and positive outcomes [8].
Hypothesis 5. A robot’s offer of options will mitigate the negative influence of the robot’s service breakdown on service satisfaction.
C. Service Orientation Research in marketing and consumer psychology suggests
that people’s responses to service recovery strategies may depend on their schema or model of service [23]. Some people seem to hold a relational or social schema, whereby they desire to maintain a good relationship with a service provider, even when there is service breakdown. Other people have a more utilitarian orientation to service, that is, as an instrumental or market transaction. People who have a strong utilitarian orientation but a low relational orientation would be very concerned with efficiency and correctness of service rather than with the interaction itself.
This work suggests that people’s response to service recovery strategies may depend on their orientation to service. In accord with the theory of regulatory fit [6], a robot with a service recovery strategy that adapts to people’s orientation to service might elicit more satisfaction than a robot that does not adapt to this orientation. Those who have a more relational orientation to services might treat a robot as a social service provider, and expect it to apologize after a mistake. Those who have a more utilitarian orientation to services may prefer the robot to offer compensation.
Hypothesis 6. A robot’s choice of recovery strategy that is matched with people’s orientation to services will mitigate the negative influence of breakdown on service satisfaction.
III. STUDY DESIGN To test these hypotheses, we conducted an online between-
subjects scenario survey. All participants saw a video of one of
two service robots (Figure 1), and then viewed a scenario in which the robot either gave correct service or made an error. We investigated people’s reactions to the robot’s error and to different mitigation strategies. The study was a 2 (forewarning vs. no forewarning) x 4 (apology, compensation, options, and no recovery strategy) x 2 (humanlike vs. non-humanlike robot) design with two additional control groups in which the robots did not make an error.
A. Participants We recruited participants on Amazon mTurk [2], the local
Craigslist [4], and a university study participant recruiting site [5]. The recruiting message said that the objective of the survey was to pretest the design of delivery service robots. We offered $1.00 plus a chance at a $50 Amazon raffle prize. Four hundred fifty-seven persons responded. Of this number, we omitted who completed the survey multiple times, did not conform to the participant requirements (e.g., being at least 18 years old), did not take at least 6 minutes to complete the survey, and who gave incorrect answers to questions used to identify participants who randomly selected answers [14]. These procedures left 317 participants in the sample, over two-thirds of the original number. Due to random assignment, there were different numbers of participants in each condition, at least 14, with most having 16-19 participants. Fifty-five percent of the sample was female. Their ages ranged from 18 to 67, with a median of 33 years. They were fairly well educated, with the mean level being at the college level. Most of the participants knew very little about robotics. The mean response on the 4-point scale was 1.7 (SD = .8; 1 = “no knowledge other than books movie”, 2 = “a little knowledge of robotics”). Their mean programming experience was 2 on the 4-point scale (SD = 1; 1 = “no experience”, 2 = “little experience”).
B. Materials The Snackbot robot, as shown in Figure 1 (a), is a 4’5” tall
delivery robot that offers snacks to people [16]. The robot
carries a tray and travels on wheels at about 1-2 mph, can rotate completely in place, and can navigate the building autonomously. The robot’s head is mounted on a 2-axis pan/tilt unit allowing it to pan 270 degrees and to tilt 80 degrees, so it can rotate towards people or turn away, nod, and look up or down. The robot can emit speech or sounds. It has a LED mouth and a directional microphone that feeds into the Sphinx4 speech recognition system.
The HERB robot (Figure 1 (b)) is an autonomous robot that consists of a RMP 200 Segway base that carries a Barrett WAM arm and hand for grasping objects [29]. Sensing is provided by a SICK laser rangefinder and two cameras. The HERB has been developed to efficiently navigate, search, and map indoor environments. Visual object recognition allows it to identify and localize a set of household objects. These objects can be grasped, lifted, and carried by the arm and hand. The robot is designed to perform dexterous operations with these objects, such as pouring water from a pitcher.
Half of the participants evaluated the Snackbot robot and half evaluated the HERB robot as target service providers in the study. We assumed the Snackbot robot would be seen as more humanlike, due to its anthropometric body and head. To help the participants understand how the robot could provide service, we presented a 30-second video that showed the robot carrying an object in an office environment. The robots did not interact with any people in the video. We explained that the robot is autonomous, that it makes its decisions on its own. We did not use the robot’s name and referred to the robot as the “robot in the video.” The logo on the HERB robot was removed when the video was recorded.
C. Scenarios After the participants saw the video, we asked them to
evaluate a situation in which the robot delivered a service. To present the situation, we used a scenario method that has been used in Human-Computer Interaction and HRI studies (e.g.,
Scene Script Condition Manipulation
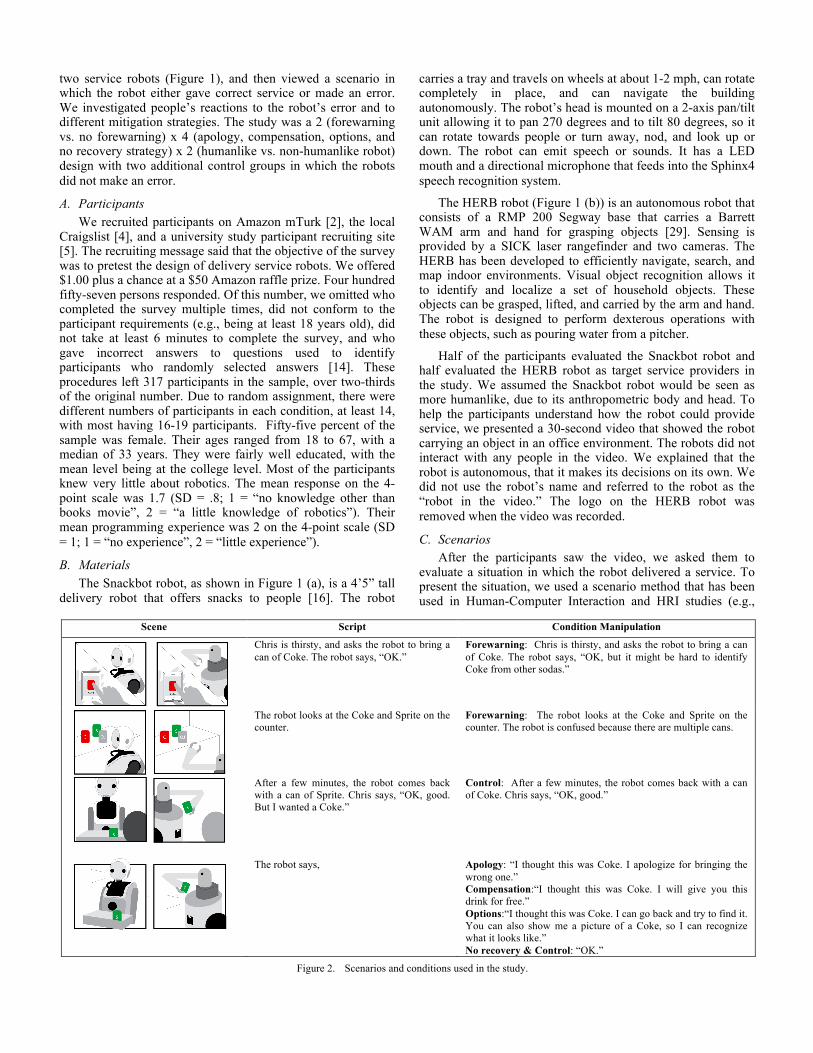
Chris is thirsty, and asks the robot to bring a can of Coke. The robot says, “OK.”
Forewarning: Chris is thirsty, and asks the robot to bring a can of Coke. The robot says, “OK, but it might be hard to identify Coke from other sodas.”
The robot looks at the Coke and Sprite on the counter.
Forewarning: The robot looks at the Coke and Sprite on the counter. The robot is confused because there are multiple cans.
After a few minutes, the robot comes back with a can of Sprite. Chris says, “OK, good. But I wanted a Coke.”
Control: After a few minutes, the robot comes back with a can of Coke. Chris says, “OK, good.”
The robot says, Apology: “I thought this was Coke. I apologize for bringing the wrong one.” Compensation:“I thought this was Coke. I will give you this drink for free.” Options:“I thought this was Coke. I can go back and try to find it. You can also show me a picture of a Coke, so I can recognize what it looks like.” No recovery & Control: “OK.”
Figure 2. Scenarios and conditions used in the study.

[33]). We constructed 16 different scenarios to represent one of the eight experimental conditions (the presence of forewarning strategy x the presence of recovery strategies), and showed these with both types of robot (more humanlike vs. less humanlike). We also had a control scenario for each robot where no breakdown occurred, resulting in 18 scenarios in total.
Each scenario described a situation in which a person, “Chris,” had a knee injury recently. In the scenario, Chris orders a can of soda from a delivery robot, but (except in the control conditions) the robot makes a mistake and returns with the wrong soda. Depending on the condition, the robot attempts to recover its mistake using different strategies. Independent of the employed recovery strategies, the outcome of the service was same. Figure 2 shows the scenarios.
We chose a breakdown caused by an error in the robot’s perception as a quite realistic error that might be applied to diverse robots regardless of their actuators. We used the projective viewpoint when creating scenarios, as they have shown to minimize social desirability effects and have considerable external validity [19]. The name Chris was chosen to be gender-neutral, so that both male and female respondents could identify with the character. We also used a written description of the scenario, and attempted to convey only an unemotional reasonable reaction by Chris. The scenarios were succinct, so that respondents could easily read and understand them.
D. Procedure The scenarios were embedded in a Survey Monkey
template. Once they clicked the link to the survey, participants were connected to a php page, which randomly directed them to one of the 18 surveys. This process was invisible to participants. The survey began with a 30 second video clip that introduced one of the robots to the participant. After the video, we asked some pre-scenario questions to gather participants’ impressions of the robot, and to assess their orientation to services.
Next, we displayed one of the scenarios in the 18 conditions. After the scenario, participants provided their evaluations of the robot and the service, and provided some information about themselves.
E. Measures The survey included items to measure the participants’
evaluation of the robot before and after the scenario, and their evaulation of the service, their orientation to services, and manipulation checks.
1) Evaluation of the robot We adapted questions used to measure people’s
evaluations of a service provider [30]. These items consisted of 10 bipolar adjectives in a 5-Likert scale (capable, efficient, organized, responsible, professional, helpful, sincere, considerate, polite, friendly) where higher scores were more positive. We asked these questions before and after the scenario was presented, to measure the impact of the scenario on the evaluation of the robot.
To examine whether the robot evaluation adjectives were measuring the same or different underlying factors, we conducted a factor analysis of the data from these items. Factor analysis of the pre-scenario ratings suggested we could create two scales from the items, one being a measure of “politeness” (Cronbach’s α= .80) and the other, a measure of “competence” (Cronbach’s α= .81). Two items, “responsible” and “professional,” loaded equally on both factors so were included in both scales.
We also asked questions to measure how much the participants liked and felt close to the robot, and how humanlike they thought the robot was. All items used 5-point Likert scales where a “5” was the most positive rating.
2) Evaluation of the service Three questions in the post-scenario survey measured the
participants’ evaluation of the service from Chris’ point of view using Likert-type scales. We asked participants to rate whether the robot gave good or poor service (1 = “very poor” and 5 = “very good”) and to rate how satisfied Chris would be with the service (1 = "completely dissatisfied" and 5 = “completely satisfied").
We also measured how likely participants thought that Chris would use the service again using a 5-point Likert scale (1 = “would avoid using the service” and 5 = “would want very much to use the service”).
3) Service schema orientation The pre-scenario survey included 9 items about people’s
orientation toward food services in general. There were three questions to infer relational orientation (e.g., “I like to have a positive relationship with a server [waitress and waiter] in a restaurant.”), three questions to infer utilitarian orientation (e.g., “Efficient food service is important to me.”), and three questions to infer the level of control they desired over the service process and outcomes (e.g., “I like to have control over the process and outcome of food service.”).
Factor analysis of the 9 items suggested two factors were captured by the items. These were used to construct two scales, one scale with three items to measure relational orientation (Cronbach’s α = .77), and the other scale with 6 items to measure utilitarian/control orientation (Cronbach’s α = .65).
4) Manipulation checks We asked participants to say whether the robot made an
error (where 1 = “none” and 5 = “many errors”; breakdown check), whether the robot made any error corrections, and if so, how many (recovery strategy check), and how difficult the task was for the robot (1 = “very difficult” and 5 = “very easy”; forewarning check).
IV. RESULTS To check on the effectiveness of the manipulations, we
conducted one-way analyses of variance on the effects of the relevant conditions on the manipulation check ratings. The participants in the breakdown conditions thought that the robot made mistakes (Control=1.08 [.11] vs. No strategy = 2.19 [.08], Apology = 2.26 [.08], Compensation = 2.27 [.08], Options = 2.17 [.08], p<.001). There were no differences across the
conditions with a breakdown. The participants who saw scenarios with recovery strategies said that the robot made more error corrections than those who saw no recovery strategy (No strategy = 1.40 [.10] versus Apology = 1.75 [.10], Compensation = 1.97 [.10], Options = 2.02 [.10] was p < .02, with no differences across the recovery strategy conditions). The manipulation check for the forewarning condition showed that the manipulation was effective. Those in the forewarning condition thought that the task was more difficult for the robot than those in the no forewarning condition (Forewarning=2.4 [.09], No forewarning = 2.80 [.09], p < .002).
A. Evaluation of the Robots The participants’ pre-scenario evaluations of the robots
differed. As expected, they rated the Snackbot robot much more humanlike than the HERB robot (Snackbot = 2.7 [SE = .1] vs. HERB = 1.80 [SE=.1], F [1, 315] = 51, p<.0001). The participants also liked the Snackbot more than the HERB robot (F [1, 315] = 5.8, p = .01) and felt somewhat closer to the Snackbot ([1, 315] = 3.4, p = .06). We used a repeated measures ANOVA to compare the pre-scenario and post-scenario ratings of the robot. Having seen the scenario made people feel that both robots were more humanlike (F [1, 315] = 81, p < .001) and also closed the gap between the Snackbot and HERB robots (interaction F [1, 315] = 15, p < .001). These findings suggest that the scenario, which entailed HRI, was somewhat humanizing as compared with the video, which did not entail HRI and only showed the robot carrying objects.
B. Impact of Service Breakdown Hypothesis 1 predicts that a robot’s service breakdown
would have a negative influence on service satisfaction. Regardless of the robot the participants saw, a service breakdown without mitigation had strongly negative impact on the rating of the service and the robot.
TABLE I. THE IMPACT OF BREAKDOWN ON SERVICE AND ROBOT EVALUATIONS
Dependent measure No Breakdown Breakdown Service Evaluation
Good or bad service 4.64 [.13] 2.32*** [13]
Service satisfaction 4.64 [.11] 2.16*** [.15] Willigness to return 4.61 [.18] 2.58*** [.13]
Robot Evaluation Politeness 3.81 [.10] 3.25*** [.07] Competence 4.01 [.11] 3.01*** [.08] Trust robot 3.81 [.18] 2.86*** [.13]
Like robot 3.34 [.17] 3.41 [.12] Feel close to robot 3.17 [.19] 2.80 t [.14]
Note. The numbers show the least squared means and the standard error in brackets. Robot evaluation ratings shown are post-scenario, and the analyses control for pre-scenario ratings.
tp < .10, *p < .05, ** p < .01, *** p < .001
We compared the control conditions (where no service breakdown occurred) against the conditions where a breakdown occurred and no mitigation took place (i.e., the robot brought the wrong soda). We also crossed this comparison with the Snackbot and HERB robots, to see if service breakdown would be viewed more severely if the robot were more humanlike. The analyses test service evaluations
using analyses of variance with breakdown vs. control crossed with the robot (Snackbot vs. HERB), and their interaction effects. The evaluations of robot ratings are multi-level models that take into account participants’ pre-scenario ratings.
The impact of the breakdown did not differ depending on which robot participants saw. On the contrary, as predicted, regardless of the robot participants saw, a service breakdown without mitigation had strongly significant negative impact on the ratings of the service and the robot. Table I shows the participants’ evaluation of the service and the robot when the service was performed smoothly as compared with the situation when there was a service breakdown.
C. Impact of Expectancy-setting (Forewarning) Strategy Hypothesis 2 predicts that forewarning people that a task is
difficult for the robot will mitigate the negative influence of breakdown on service and the robot evaluations. The forewarning strategy had positive impact on the overall evaluation, in particular the evaluation of the robot.
We compared each robot’s forewarning versus no forewarning in the conditions where there had been a breakdown. Table II shows that generally, the robot’s lowering expectations did mitigate the negative influence of breakdown on the robot evaluation. The forewarning strategy somewhat mitigate how good or bad the participant judged the service was, yet did not increase the participants’ perception that Chris was satisfied with the service and Chris’ willingness to use the service again.
TABLE II. THE IMPACT OF THE FOREWARNING STRATEGY ON SERVICE AND ROBOT EVALUATIONS
Dependent measure No Forewarning Forewarning Service Evaluation
Good or bad service 2.54 [.09] 2.62* [.09]
Service satisfaction 2.33 [.07] 2.52 t [.07] Willigness to return 2.94 [.09] 2.97 [.09]
Robot Evaluation Politeness 3.53 [.05] 3.73** [.05] Competence 3.03 [.06] 3.27** [.06] Trust robot 2.73 [.09] 3.01* [.09]
Like robot 3.28 [.08] 3.61** [.08] Feel close to robot 2.76 [.09] 3.03* [.09]
Note. The numbers show the least squared means and the standard error in brackets. Robot evaluation ratings shown are post-scenario, and the analyses control for pre-scenario ratings.
tp < .10, *p < .05, ** p < .01, *** p < .001
D. Impact of Recovery Strategies Hypotheses 3 - 5 predict that any recovery strategy
(apology, compensation, and options) would be better than no strategy. Overall, all three strategies were effective in mitigating the negative influence of the robot’s service breakdown, but worked differently on different dimensions of the service and robot evaluation (Table III).
We tested the effects of the different recovery strategies on the participants’ evaluation of the service and the robot including variables as: robot, forewarning, and recovery strategy, and all their interactions. Because the evaluation of
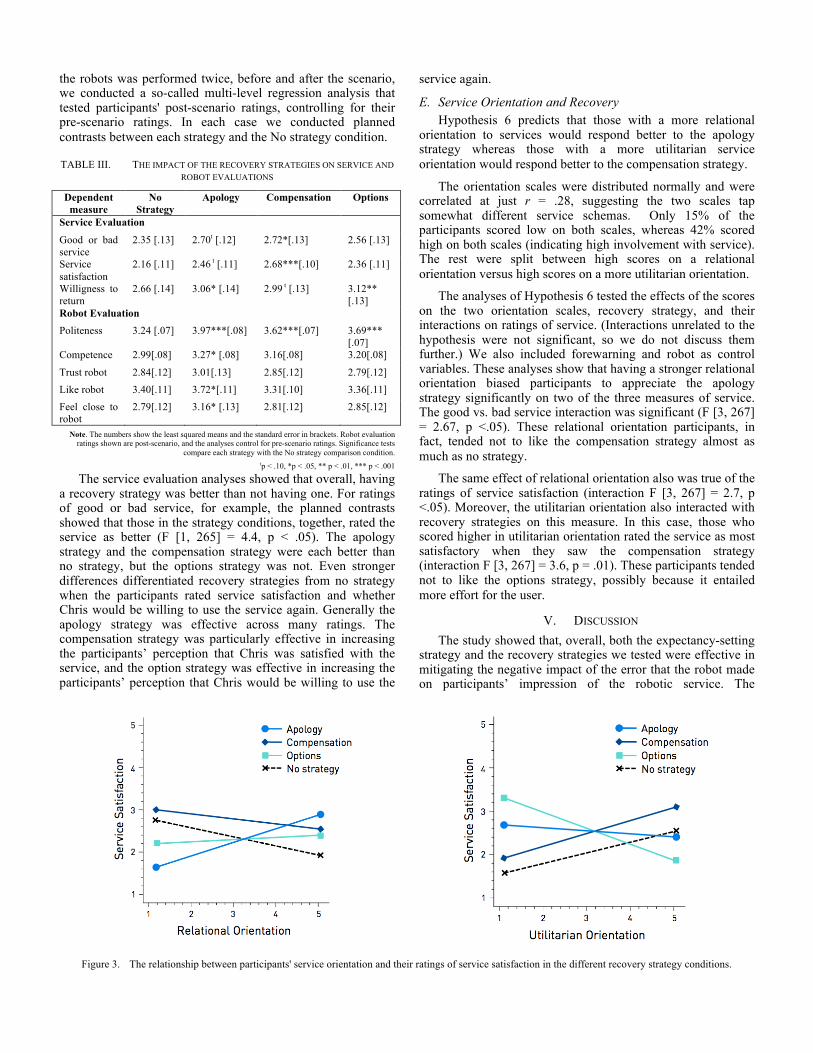
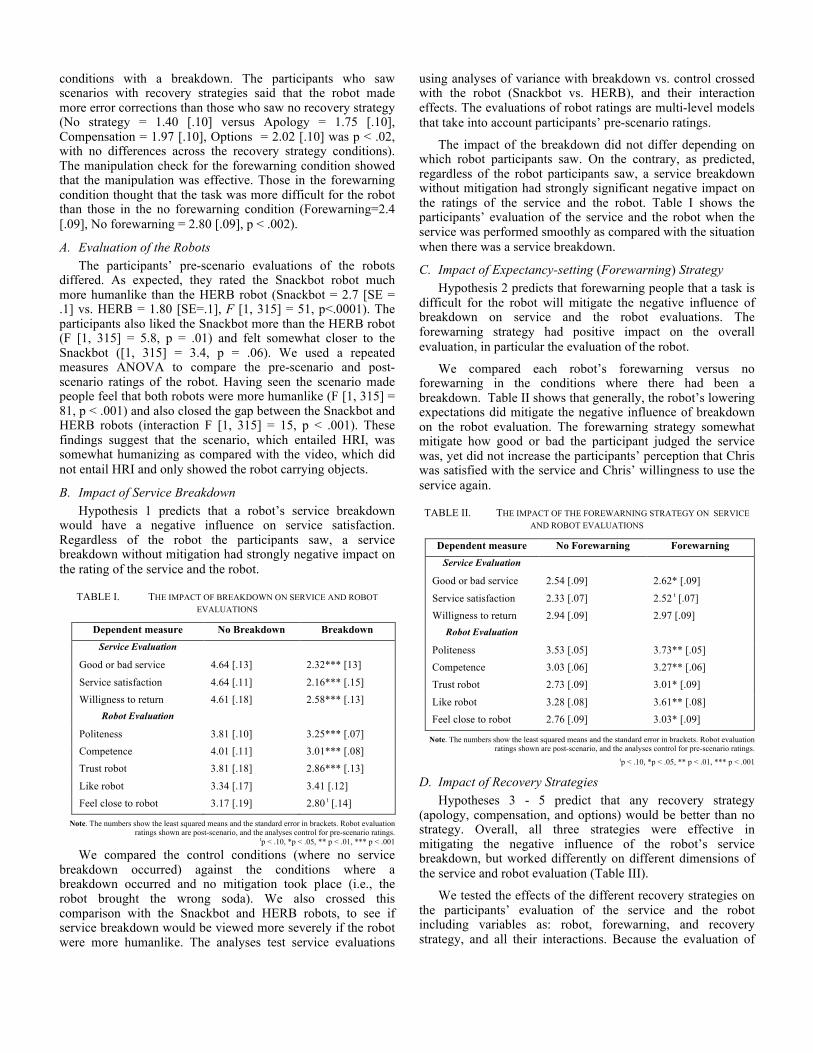
Figure 3. The relationship between participants' service orientation and their ratings of service satisfaction in the different recovery strategy conditions.
the robots was performed twice, before and after the scenario, we conducted a so-called multi-level regression analysis that tested participants' post-scenario ratings, controlling for their pre-scenario ratings. In each case we conducted planned contrasts between each strategy and the No strategy condition.
TABLE III. THE IMPACT OF THE RECOVERY STRATEGIES ON SERVICE AND ROBOT EVALUATIONS
Dependent measure
No Strategy
Apology Compensation Options
Service Evaluation
Good or bad service
2.35 [.13] 2.70t [.12] 2.72*[.13] 2.56 [.13]
Service satisfaction
2.16 [.11] 2.46 t [.11] 2.68***[.10] 2.36 [.11]
Willigness to return
2.66 [.14] 3.06* [.14] 2.99 t [.13] 3.12** [.13]
Robot Evaluation Politeness 3.24 [.07] 3.97***[.08] 3.62***[.07] 3.69***
[.07] Competence 2.99[.08] 3.27* [.08] 3.16[.08] 3.20[.08]
Trust robot 2.84[.12] 3.01[.13] 2.85[.12] 2.79[.12] Like robot 3.40[.11] 3.72*[.11] 3.31[.10] 3.36[.11] Feel close to robot
2.79[.12] 3.16* [.13] 2.81[.12] 2.85[.12]
Note. The numbers show the least squared means and the standard error in brackets. Robot evaluation ratings shown are post-scenario, and the analyses control for pre-scenario ratings. Significance tests
compare each strategy with the No strategy comparison condition. tp < .10, *p < .05, ** p < .01, *** p < .001
The service evaluation analyses showed that overall, having a recovery strategy was better than not having one. For ratings of good or bad service, for example, the planned contrasts showed that those in the strategy conditions, together, rated the service as better (F [1, 265] = 4.4, p < .05). The apology strategy and the compensation strategy were each better than no strategy, but the options strategy was not. Even stronger differences differentiated recovery strategies from no strategy when the participants rated service satisfaction and whether Chris would be willing to use the service again. Generally the apology strategy was effective across many ratings. The compensation strategy was particularly effective in increasing the participants’ perception that Chris was satisfied with the service, and the option strategy was effective in increasing the participants’ perception that Chris would be willing to use the
service again.
E. Service Orientation and Recovery Hypothesis 6 predicts that those with a more relational
orientation to services would respond better to the apology strategy whereas those with a more utilitarian service orientation would respond better to the compensation strategy.
The orientation scales were distributed normally and were correlated at just r = .28, suggesting the two scales tap somewhat different service schemas. Only 15% of the participants scored low on both scales, whereas 42% scored high on both scales (indicating high involvement with service). The rest were split between high scores on a relational orientation versus high scores on a more utilitarian orientation.
The analyses of Hypothesis 6 tested the effects of the scores on the two orientation scales, recovery strategy, and their interactions on ratings of service. (Interactions unrelated to the hypothesis were not significant, so we do not discuss them further.) We also included forewarning and robot as control variables. These analyses show that having a stronger relational orientation biased participants to appreciate the apology strategy significantly on two of the three measures of service. The good vs. bad service interaction was significant (F [3, 267] = 2.67, p <.05). These relational orientation participants, in fact, tended not to like the compensation strategy almost as much as no strategy.
The same effect of relational orientation also was true of the ratings of service satisfaction (interaction F [3, 267] = 2.7, p <.05). Moreover, the utilitarian orientation also interacted with recovery strategies on this measure. In this case, those who scored higher in utilitarian orientation rated the service as most satisfactory when they saw the compensation strategy (interaction F [3, 267] = 3.6, p = .01). These participants tended not to like the options strategy, possibly because it entailed more effort for the user.
V. DISCUSSION The study showed that, overall, both the expectancy-setting
strategy and the recovery strategies we tested were effective in mitigating the negative impact of the error that the robot made on participants’ impression of the robotic service. The
expectancy-setting strategy was particularly effective in extenuating the negative influence on the robot evaluation and somewhat effective in improve the participants’ judgment of the quality of the service. All the recovery strategies increased the ratings of the robot’s politeness. However, only the apology strategy was effective in making the robot seem more competent, making the participants feel closer to and liking the robot more. The compensation strategy was most effective in increasing the participants’ perception that Chris was satisfied with the service, but less effective in increasing their perception of Chris’ willingness to use the service again. The apology and option strategies were effective in increasing the participants’ perception that Chris would use the service again.
The results also showed that tailoring the recovery strategy to people’s cultural orientations is important. As seen in Figure 3, those with a relational orientation responded particularly well to an apology whereas those with a more utilitarian orientation responded better to compensation.
Our results suggest that having a plan for mitigating robot service errors will be an important component of HRI designs for robots that deliver services or otherwise help people. However, our study has some important limitations that prevent us from generalizing overly from our findings. First, and most important, we used a hypothetical scenario survey technique. Even though the response to the scenarios was consistent with previous literature on real services, we do not know for sure if people’s responses to robotic services in real environments will be the same. Second, we only tested the efficacy of the strategies for one type of task and one error. Replicating this study with different tasks, situations, robots, and errors would make the findings much more robust. Finally, we did not test how the recovery strategies, such as apology with compensation, would work in combination with each other. There is some evidence that combining apologies with compensation could backfire [23], especially with relationally oriented people who might see the compensation as manipulative. Our data also suggest that utilitarian oriented people may not like compensation mixed with options, perhaps because options entails more effort.
VI. IMPLICATIONS The findings from the study have interesting implications
for the design of robotic services. As noted above, our results suggest that a robot should be designed so that it can mitigate errors in its behavior or the service through expectation setting and social error recovery strategies. Our results also suggested that matching these strategies to the person’s orientation would be useful.
How would a robot know a person’s service orientation? We can suggest one technique, based on our previous work on people’s initial interactions with a robot [17]. In our previous study, we analyzed visitors’ verbal responses to a receptionist robot in a university building. We observed that half of the visitors greeted the robot (e.g., “hello”) prior to interacting with it. Greeting the robot significantly predicted a more social script with the robot: more relational conversational strategies such as sociable interaction and politeness, attention to the robot’s narrated stories, self- disclosure, and less negative/rude behaviors. This finding suggest people’s first words with a
robot can predict their schematic orientation to a robotic service, thus making it possible to design robots that adapt their recovery strategy at the outset of an interaction. For example, a robot might use relational recovery strategies (such as apologies or empathic comments) with those who greet the robot, and more utilitarian dialogue and compensation for errors with those who do not greet the robot.
There are also various ways to design for appropriate expectations. One possible design direction would build on the work on robot helpers [32], which suggests that if a robot gives advice or helps someone, and exhibits some speech disfluencies, then it is perceived as less controlling without detracting from its perceived expertise. These findings suggest other ways to gracefully mitigate errors by humanizing the robot and making it seem competent but far from perfect.
VII. CONCLUSION Filmmakers and science fiction writers are envisioning
robots, like those in the movie “Surrogates,” that perform tasks almost perfectly, and that can repair themselves when they break, but robots in reality are a long way off from that vision. Furthermore, as long as people design robotic services for people, there will be errors, whether perceived or real, in these services. This study represents an initial attempt to demonstrate the importance of error mitigation in HRI. The results suggest a rich area of debate and research on how a robot can fail gracefully.
VIII. ACKNOWLEDGMENTS This work was supported by National Science Foundation
grants IIS-0624275 and CNS0709077. The Kwan-Jeong Educational Foundation supported the first author. The Hillman Foundation supports the second author. We acknowledge Yiwen Jia, Sean Kim, Jane Park, and Bryan Pendleton for their help in putting the surveys online and drawing the illustrations for the scenarios. We also thank Jessica Hodgins for giving us the idea of working on graceful failure.
IX. REFERENCES [1] Aaker, J. Fournier, S. & Brasel, S. (2004). When good brands do bad.
Journal of Consumer Research, 31(1), 1-16. [2] Amazon mTurk, https://www.mturk.com. [3] Bitner, M.J., Booms, B.H., & Tetreault, M.S. (1990). The service
encounter: Diagnosing favorable and unfavorable incidents. The Journal of Marketing, 71-84.
[4] Craigslist, http://pittsburgh.craigslist.org/. [5] Center for Behavioral Decision Research, http://www.cbdr.cmu.edu/ [6] Cesario, J., Grant, H. & Higgins, E. T. (2004). Regulatory fit and
persuasion: Transfer from “feeling right.” Journal of Personality and Social Psychology, 86, 388-404.
[7] Hart, C.W.L., Heskett, J.L., & Sasser Jr, W.E. (1990). The profitable art of service recovery. Harvard Business Review, 148-156.
[8] Heckhausen, J. & Schultz, R. (1995). A life-span theory of control. Psychological Review, 102, 284-304.
[9] Hinds, P., Roberts, T. L., & Jones, H. (2004). Whose job is it anyway? A study of human-robot interaction in a collaborative task. Human-Computer Interaction, 19, 151-181.
[10] Johnson, D., Gardner, J., & Wiles, J. (2004). Experience as a moderator of media equation: The impact of flattery and praise. International Journal of Human-Computer Studies., 61, 3, 237-258.
[11] Keaveney, S. (1995). Customer switching behavior in service industries: An exploratory study. The Journal of Marketing, 59(2), 71-82.
[12] Kelley, S.W., Hoffman, D.H., & Davis, M.A. (1993). A typology of retail failures and recoveries. Journal of Retailing, 69, 429-429.
[13] Kim, T. & Hinds, P. (2006). Who should I blame? Effects of autonomy and transparency on attributions in human-robot interaction. In the Proceedings of ROMAN’06, 80-85.
[14] Kittur, A., Chi, E.H. & Suh, B. (2008). Crowdsourcing user studies with Mechanical Turk. In the Proceedings of CHI’08, 453-456.
[15] Kunda, Z. (1999). Social cognition: Making sense of people. Cambridge, MA:MIT Press.
[16] Lee, M.K., Forlizzi, J., Rybski, P.E., Crabbe, F., Chung, W., Finkle, J., Glaser, E., & Kiesler, S. (2009).The Snackbot: Documenting the design of a robot for long-term human-robot interaction. In the Proceedings of HRI’09, 7-14.
[17] Lee, M.K., Kiesler, S., & Forlizzi, J. (in press). Receptionist or information kiosk? How do people talk with a robot? To appear in Proceedings of CSCW’10.
[18] Mutlu, B. & Forlizzi, J. (2008). Robots in organizations: The role of workflow, social, and environmental factors in human-robot interaction. In the Proceedings of HRI’08, 239-248.
[19] Nisbett, R., Caputo, C., Legant, P. & Marecek, J. (1973). Behavior as seen by the actor and as seen by the observer. Journal of Personality and Social Psychology, 27(2), 154-164.
[20] Nomura, T., Kanda, T., Suzuki, T., & Kato, K. (2008). Prediction of Human Behavior in Human--Robot Interaction Using Psychological Scales for Anxiety and Negative Attitudes Toward Robots. IEEE Transactions on Robotics, 24, 2, 442-451.
[21] Oliver. A. (1980). Cognitive model of the antecedents and consequences of satisfaction decisions. Journal of Marketing Research, 460-469.
[22] Reeves, B., & Nass, C. (1996). The media equation: How people treat computers, television, and new media like real people and places. New York: Cambridge University Press.
[23] Ringberg, T., Odekerken-Schroder, G., & Christensen, G. (2007). A cultural models approach to service recovery. The Journal of Marketing, 71(3), 194-214.
[24] Ross, L., Greene, D., & House, P. (1977). The false consensus phenomenon: An attributional bias in self-perception and social perception processes. Journal of Experimental Social Psychology, 13, 279-301.
[25] Sheridan, T.B. (2002). Humans and automations: System design and research issues. Wiley-Interscience.
[26] Siino, R. & Hinds, P. (2005). Robots, gender, and sensemaking: Sex segregation’s impact on workers making sense of a mobile autonomous robot. In the Proceedins of ICRA’05, 2773-2778.
[27] Smith, A. Bolton, R. & Wagner, J. (1999). A model of customer satisfaction with service encounters involving failure and recovery. Journal of Marketing Research, 36, 356-372.
[28] Spreng, R, Harrell, G. & Mackoy, R. (1995). Service recovery: Impact on satisfaction and intentions. Journal of Services Marketing, 9(1), 15-23.
[29] Srinivasa, S., Ferguson, D. Helfrich, C., Berenson, D., Collet, A., Diankov, R., Gallagher, G., Hollinger, G., Kuffner, J., & VandeWeghe, M.(2009). HERB: A home exploring robotic butler. Submitted to Autonomous Robots.
[30] Surprenant, C.F. & Solomon, M.R. (1987). Predictability and personalization in the service encounter. The Journal of Marketing, 86-96.
[31] Tax, S. Brown, S. & Chandrashekaran, M. (1998). Customer evaluations of service complaint experiences: Implications for relationship marketing. The Journal of Marketing, 62(2), 60-76.
[32] Torrey, C. (2009). How robots can help: Communication strategies that improve social outcomes Ph.D. Dissertation. Carnegie Mellon University.
[33] Woods, S. N., Walter, M. L., Koay, K.L., & Dautenhahn, K. (2006). Comparing human robot interaction scenarios using live and video based methods: towards a novel methodological approach. In the Proceedings of Workshop on Advanced Motion Control, 750-755.