grade 8 mathematics practice test - louisiana believes · mathematics—sessions 1, 2, and 3...
TRANSCRIPT

Grade 8 Mathematics Practice Test
2013‐2014

For further information, contact: Louisiana Department of Education’s Help Desk
1-877-453-2721 Ask LDOE?
http://www.louisianabelieves.com/resources/contact-us This public document was published at a cost of $6,000.00. This Web-only document was published for the Louisiana Department of Education, Office of Standards, Assessments, and Accountability, Division of Assessments and Accountability, P.O. Box 94064, Baton Rouge, LA 70804-9064, by Data Recognition Corporation, 13490 Bass Lake Road, Maple Grove, MN 55311. This material was printed in accordance with the standards for printing by State Agencies established pursuant to R.S. 43:31.
© 2013 by Louisiana Department of Education

Test Administrator Instructions
When printing the PDF files for the three Math Sessions, be sure to set the Page Scaling drop-down menu on the Print screen to None, No Scaling, or Actual Size depending on the printer you are using. Otherwise, measurement items may not be the correct size, which may impact student responses.
�
�
�
�
�
This document contains a Practice Test that shows what each part, or session, of an actual grade 8 math assessment is like.
The Practice Test may be used at home or at school for students to become familiar with the LEAP test they will take in spring 2014. It may help students feel more relaxed when they take the actual test.
The Assessment Structure provides information on the overall design of the actual test. The Assessment Structure and example items can be found on the Louisiana Department of Education’s website.
The mathematics test has three sessions to be taken separately:
� Session 1 (pages 3 to 19) includes 30 multiple-choice questions—a calculator may not be used.
� Session 2 (pages 21 to 38) includes 30 multiple-choice questions—a calculator may be used.
� Session 3 (pages 40 to 43) includes 4 constructed-response questions—a calculator may be used.
A Mathematics Reference Sheet, which students may use for all sessions, is located on page 46.
Students respond to multiple-choice items using the Answer Sheets on pages 44 and 45 and constructed-response items using pages 40 to 43 of Session 3.
The Answer Keys and Scoring Rubrics, used to score student responses, are located on pages 47 to 52.
LEAP Practice Test—Grade 8 Mathematics
http://www.louisianabelieves.com/resources/library/assessment-guidance-2013-2014
Mathematics Grade 8 Page 1

Mathematics—Sessions 1, 2, and 3GENERAL INSTRUCTIONS
The Mathematics test has three sessions, two with multiple-choice questions and one with constructed-response questions. You may not use a calculator for session 1, but you may use a calculator for sessions 2 and 3.
Mathematics Grade 8 Page 2

Write your answers for questions 1 through 30 in the spaces provided onpage 44, session 1 answer sheet. Write only one answer for each question.You may work problems in your test booklet or on scratch paper, but you mustmark your answer on your answer sheet. You may review your work in thissession, but do not work on any other session.
You may NOT use a calculator for this session.
1. Which model is not a function?
A.–2–1012
–2–1012
B.–2–1012
–2–1012
C.–2–1012
–2–1012
D.–2–1012
–2–1012
Session 1—Mathematics (No Calculator)
Mathematics Grade 8 Page 3 GO ON TO THE NEXT PAGE �

2. Janet graphed a triangle on the coordinate grid shown.
y
x-1-2-3-4
4321
4321
-1-3-4 -2
A B
C
Janet rotated the triangle 90° clockwise about the origin to create figure A'B'C'. What are thecoordinates of the vertices of the figure A'B'C' after the rotation?
A. A' (–4, –4)B' (–4, –2)C' (–1, –2)
B. A' (4, 4)B' (2, 4)C' (2, 1)
C. A' (–4, –4)B' (–2, –4)C' (–2, –1)
D. A' (4, 4)B' (4, 2)C' (1, 2)
3. The choir director set up chairs for the concert with an equal number of rows and columns.The number of chairs in each row and column is represented by the algebraic expression �y,where y is the total number of chairs. What is the number of chairs in each row andcolumn if y = 81 chairs?
A. 3 chairs
B. 9 chairs
C. 40.5 chairs
D. 162 chairs
Session 1—Mathematics (No Calculator)
Mathematics Grade 8 Page 4 GO ON TO THE NEXT PAGE �

4. Rectangle LOSP is shown below. The lengths, in units, of some of the line segments are alsoshown. Line segments MQ and NR are perpendicular to line segment LO.
4 6 8
12
L M N O
P Q R S
Which shape is similar to rectangle LOSP?
A. LMQP
B. LNRP
C. MNRQ
D. OSRN
5. Paul creates a scatter plot with a negative association. The x-axis of the scatter plot is titled,"Minutes Spent at Mall". Which label is most likely the title of the y-axis of Paul’s scatter plot?
A. Distance Walked
B. Money Available to Spend
C. Number of Movies Seen
D. Number of Stores Visited
Session 1—Mathematics (No Calculator)
Mathematics Grade 8 Page 5 GO ON TO THE NEXT PAGE �
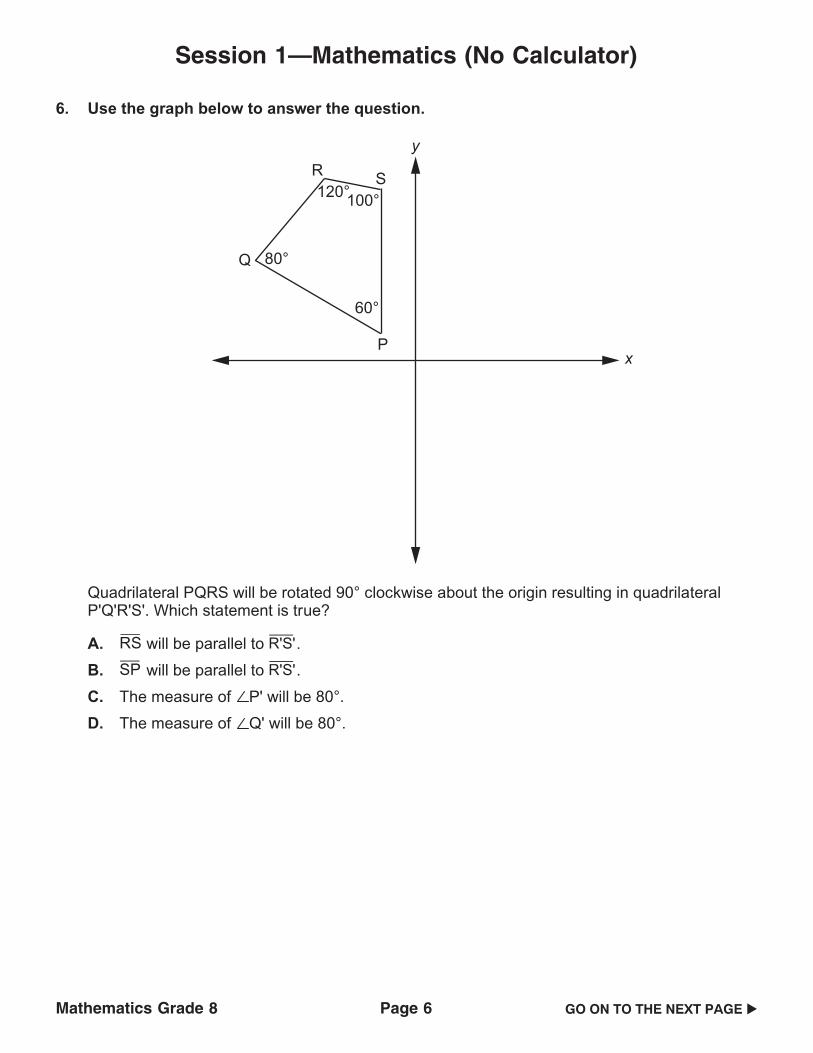
6. Use the graph below to answer the question.
P
Q
R S100°120°
80°
60°
x
y
Quadrilateral PQRS will be rotated 90° clockwise about the origin resulting in quadrilateralP'Q'R'S'. Which statement is true?
A. RS will be parallel to R'S'.
B. SP will be parallel to R'S'.
C. The measure of P' will be 80°.
D. The measure of Q' will be 80°.
Session 1—Mathematics (No Calculator)
Mathematics Grade 8 Page 6 GO ON TO THE NEXT PAGE �

7. Donna rode her bike for three miles. She traveled 18 miles per hour the first mile, 15 miles perhour the second mile, and 21 miles per hour the third mile. Which diagram shows the mostlikely landscape of Donna’s bike ride?
A.
0
Landscape of Donna’s Bike Ride
1 2 3
Distance (miles)
B.
0
Landscape of Donna’s Bike Ride
1 2 3
Distance (miles)
C.
0
Landscape of Donna’s Bike Ride
1 2 3
Distance (miles)
D.
0
Landscape of Donna’s Bike Ride
1 2 3
Distance (miles)
Session 1—Mathematics (No Calculator)
Mathematics Grade 8 Page 7 GO ON TO THE NEXT PAGE �

8. Camille placed blocks on a table in rows and columns. All the rows and columns had the samenumber of blocks in them and formed a square. Which could be the total number of blocksCamille placed on the table?
A. 111 blocks
B. 121 blocks
C. 181 blocks
D. 222 blocks
9. Use the grid below to answer the question.
43210
151413121110
987654321
5 6 7 8 x
y
9 10 11 12 13 14 15
S
R
T
U
Rectangle RSTU is rotated around point T to create rectangle R'S'T'U'. The x-coordinate ofpoint T' is less than the x-coordinate of point U', and their y-coordinates are equal. What arethe coordinates of point R'?
A. (9, 22)
B. (11, 4)
C. (13, 4)
D. (20, 15)
Session 1—Mathematics (No Calculator)
Mathematics Grade 8 Page 8 GO ON TO THE NEXT PAGE �

10. Use the picture to answer the question below.
Toy Car Race Trackstart
The picture shows the beginning of a racetrack for a toy car. Which graph models theestimated speed of the toy car as it moves through the racetrack?
A.
Toy Car Speed
Time
Spee
d
B.
Toy Car Speed
Time
Spee
d
C.
Toy Car Speed
Time
Spee
d
D.
Toy Car Speed
Time
Spee
d
11. The United States exported approximately 30,000,000 metric tons of wheat over an entireyear. What is the number of metric tons of wheat written in scientific notation?
A. 3 × 10⁴
B. 3 × 10⁵
C. 3 × 10⁶
D. 3 × 10⁷
Session 1—Mathematics (No Calculator)
Mathematics Grade 8 Page 9 GO ON TO THE NEXT PAGE �

12. Which expression is equivalent to (9-2)8?
A. –8132
B.1
916
C.1
910
D. 818
13. What is 5 × 10⁻⁴ written in standard notation?
A. 0.00005
B. 0.0005
C. 5,000
D. 50,000
14. Which statement about 2 and�
2is true?
A. Since half of 2 is 1 and half of 3 is 1.5, then 2 <�
2.
B. Since half of 2 is greater than12
of 3.14, then 2 >�
2.
C. Since 2 is slightly less than 1.5 and half of � is slightly more than 1.5, then 2 <�
2.
D. Since 2 is slightly greater than 1 and half of � is slightly less than 2, then 2 >�
2.
Session 1—Mathematics (No Calculator)
Mathematics Grade 8 Page 10 GO ON TO THE NEXT PAGE �
15. Use the number line below to answer the question.
2 3 4
W X Y Z
Which point on the number line is the best approximation for 6?
A. point W
B. point X
C. point Y
D. point Z
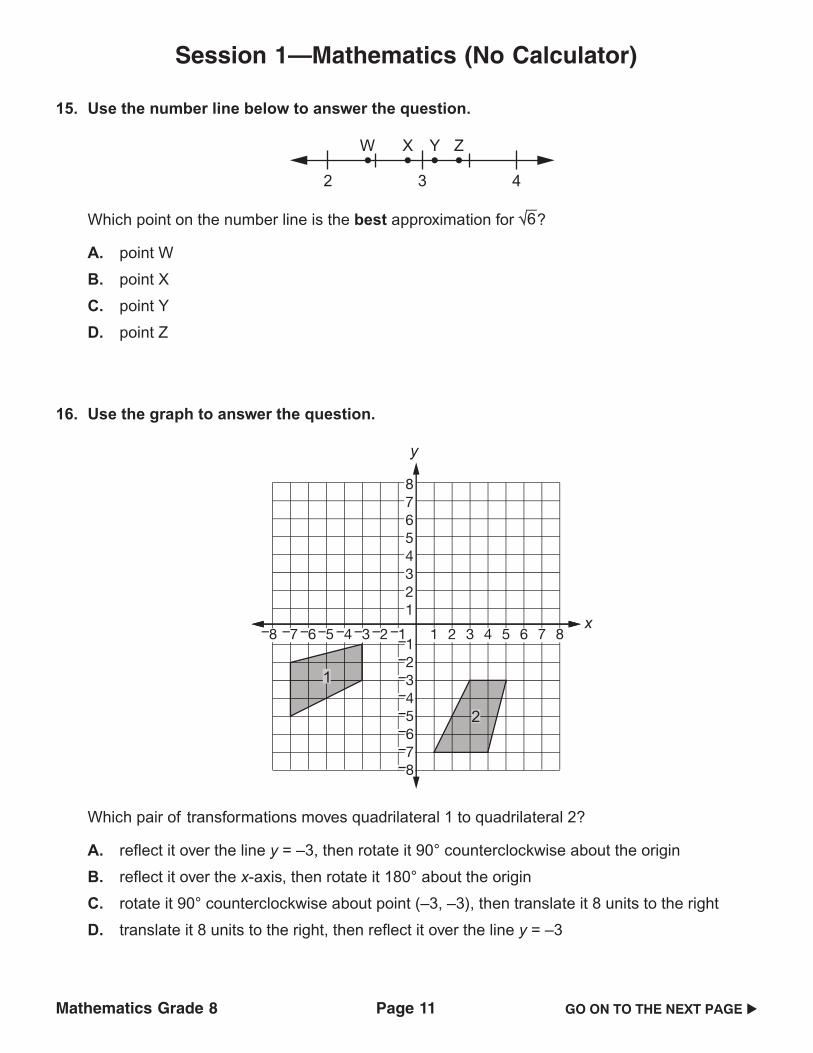
16. Use the graph to answer the question.
y
x–1 1 2 3 4 5–2–3–4–5–6–7–8 6 7 8
87654321
–1–2–3–4–5–6–7–8
1
2
Which pair of transformations moves quadrilateral 1 to quadrilateral 2?
A. reflect it over the line y = –3, then rotate it 90° counterclockwise about the origin
B. reflect it over the x-axis, then rotate it 180° about the origin
C. rotate it 90° counterclockwise about point (–3, –3), then translate it 8 units to the right
D. translate it 8 units to the right, then reflect it over the line y = –3
Session 1—Mathematics (No Calculator)
Mathematics Grade 8 Page 11 GO ON TO THE NEXT PAGE �

17. Misha asked ten different coworkers how many people and pets are living in their homes. Sheused the responses to create the scatter plot shown.
7654321
1 2 3 4 5 6
People and Pets
Num
ber o
f Pet
s
Number of People0
y
x
Which statement about the numbers of people and pets living in the homes of Misha’s tencoworkers is true?
A. As the number of people living in the home increases, the number of pets increases.
B. As the number of people living in the home increases, the number of pets decreases.
C. As the number of people living in the home decreases, the number of pets decreases.
D. There is no relationship between the numbers of people and pets living in the home.
18. What is the value of 54 × 5-6?
A. –25
B. �125
C.125
D. 25
Session 1—Mathematics (No Calculator)
Mathematics Grade 8 Page 12 GO ON TO THE NEXT PAGE �

19. The diagram below shows JKL and MNP.
2 4 6 8 10–4–8–10–12–14–16–18 12 14 16 18
8
6
4
2
y
x
18
16
14
12
10
–2–4–6–8
–10–12–14–16–18
–2
J K
L
M N
P
–6
Which statement about the slopes of JL and MP is true?
A. The slope of JL is the same as the slope of MP because JKL is similar to MNP.
B. The slope of JL is twice the slope of MP because the length of JL is twice the length of MP.
C. The slope of JL is 4 times the slope of MP because the area of JKL is 4 times the areaof MNP.
D. The slope of JL is 8 more than the slope of MP because the difference between the shortlegs of the triangles is 6 and the difference between the long legs of the triangles is 7.
Session 1—Mathematics (No Calculator)
Mathematics Grade 8 Page 13 GO ON TO THE NEXT PAGE �

20. Which comparison is true?
A. 4 < 18 < 4.5
B. 4.5 < 18 < 5
C. 8.5 < 18 < 9.5
D. 17 < 18 < 19
21. Use the coordinate grid below to answer the question.
E
F
G
H
y
x
–10
–5–10 55 1010
5
10
–5
Rectangle EFGH is dilated with its center at the origin and a scale factor of 3. The dilation isthen rotated 90° clockwise about the origin to create rectangle E'F'G'H'. What are thecoordinates of the vertices of rectangle E'F'G'H'?
A. E' (–4, 6)F' (6, –4)G' (4, –6)H' (–6, 4)
B. E' (4, –6)F' (–6, 4)G' (–4, 6)H' (6, –4)
C. E' (–3, 9)F' (9, –3)G' (3, –9)H' (–9, 3)
D. E' (3, –9)F' (–9, 3)G' (–3, 9)H' (9, –3)
Session 1—Mathematics (No Calculator)
Mathematics Grade 8 Page 14 GO ON TO THE NEXT PAGE �

22. A weather station recorded the amount of rain that fell during an 8-hour time frame using a raingauge. The findings are recorded in the graph below.
y
x
7654321
0 1 2 3 4 5 6 7 8Time (hours)
Am
ount
(inc
hes)
Amount of Rain in Rain Gauge
Between which hours was the rate at which the rain fell greater than the rate at which the rainfell between hours 0 and 1?
A. between hours 1 and 4
B. between hours 4 and 5
C. between hours 5 and 6
D. between hours 7 and 8
23. Each day of the month, Carl earns an allowance, in cents, equal to the square of that date ofthe month. Which is a number of cents Carl could earn in a single day?
A. 21
B. 31
C. 64
D. 111
Session 1—Mathematics (No Calculator)
Mathematics Grade 8 Page 15 GO ON TO THE NEXT PAGE �

24. Which set of ordered pairs models a function?
A. {(2, 9), (7, 5), (3, 14), (2, 6)}
B. {(5, 10), (5, 15), (5, 20), (5, 25)}
C. {(–12
, –13
), (12
, –14
), (–12
, –15
), (12
, –16
)}
D. {(–10, 20), (–20, 30), (–30, 40), (–40, 10)}
25. A company used about 7.4 × 10⁵ sheets of paper in a month. Of the paper used during themonth, the accounting department used about 8.9 × 10³ of the sheets. About how manysheets of paper were used by other departments during the month?
A. 1.5 × 10²
B. 1.5 × 10³
C. 7.3 × 10⁴
D. 7.3 × 10⁵
26. Which number is irrational?
A. �43
B. 121
C. 16.121314...
D. 0.0071
Session 1—Mathematics (No Calculator)
Mathematics Grade 8 Page 16 GO ON TO THE NEXT PAGE �

27. Use the graph below to answer the question.
y
x–1 1 2 3 4 5–2–3–4–5–6–7–8 6 7 8
87654321
–1–2–3–4–5–6–7–8
A
B
Which equation represents a line that passes through points A and B plotted on the graph?
A. y = �43
x
B. y = �34
x
C. y =34
x
D. y =43
x
28. For which equation is 363 the solution?
A. x3 = 36
B. x2 = 36
C. x3 = 36
D. x = 36
Session 1—Mathematics (No Calculator)
Mathematics Grade 8 Page 17 GO ON TO THE NEXT PAGE �

29. Ranee is creating a diagram to prove that a certain triangle is a right triangle. In her diagramshe uses three white quadrilaterals that are squares. Which diagram could be the one thatRanee is creating?
A.
a
b
2a + 2bB.
a
b
(a + b)2
C.
b
c
c2 – b2
D.
a
c
c2 – a2
Session 1—Mathematics (No Calculator)
Mathematics Grade 8 Page 18 GO ON TO THE NEXT PAGE �

30. Use the graphic below to answer the question.
y
x–1 1 2 3 4 5–2–3–4–5–6–7–8 6 7 8
87654321
–1–2–3–4–5–6–7–8
X
W Z
Y
Rectangle WXYZ will be transformed so that W' is located at (–3, –1) and Z' is locatedat (2, –1). Which could be the coordinates of X' and Y' so that W'X'Y'Z' is congruent to WXYZ?
A. X' is located at (–3, –6) and Y' is located at (2, –6)
B. X' is located at (3, 8) and Y' is located at (–2, 8)
C. X' is located at (–3, 6) and Y' is located at (2, 6)
D. X' is located at (2, –8) and Y' is located at (–3, –8)
Session 1—Mathematics (No Calculator)
Mathematics Grade 8 Page 19STOP

Mathematics—Sessions 1, 2, and 3GENERAL INSTRUCTIONS
The Mathematics test has three sessions, two with multiple-choice questions and one with constructed-response questions. You may not use a calculator for session 1, but you may use a calculator for sessions 2 and 3.
Mathematics Grade 8 Page 20
Write your answers for questions 31 through 60 in the spaces provided onpage 45, session 2 answer sheet. Write only one answer for each question.You may work problems in your test booklet or on scratch paper, but you mustmark your answer on your answer sheet. You may review your work in thissession, but do not work on any other session.
You MAY use a calculator for this session.
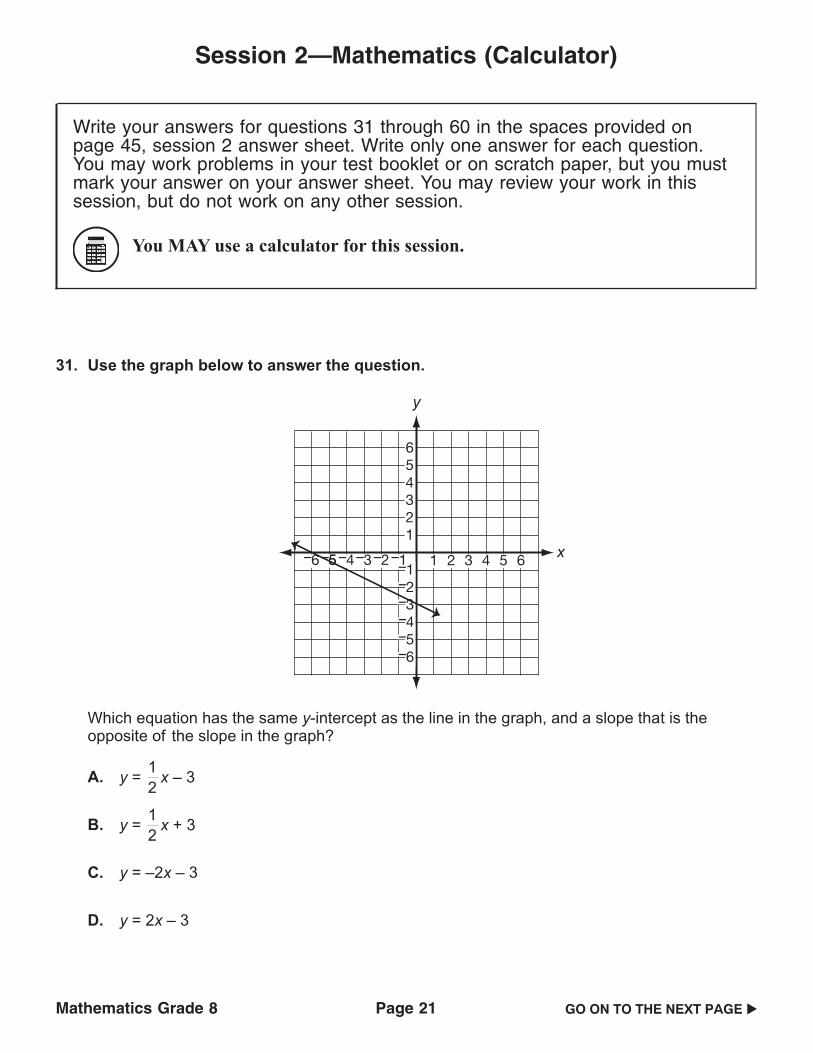
31. Use the graph below to answer the question.
y
x
654321
–1 1 2 3 4 5–2–3–4–5 –1–2–3–4–5–6
–6–5 6
Which equation has the same y-intercept as the line in the graph, and a slope that is theopposite of the slope in the graph?
A. y =12
x – 3
B. y =12
x + 3
C. y = –2x – 3
D. y = 2x – 3
Session 2—Mathematics (Calculator)
Mathematics Grade 8 Page 21 GO ON TO THE NEXT PAGE �

32. Cecil has a paper cup in the shape of a cone, as shown below.
Cecil’s Paper Cup
3 in.
5 in.
What is the volume of Cecil’s paper cup?
A. 212π cubic in.
B. 334π cubic in.
C. 15π cubic in.
D. 60π cubic in.
33. For a few months, Dexter recorded the amounts, in fluid ounces, of laundry detergentremaining, y, after he and his family washed x loads of laundry. The equation of the line ofbest fit for his data is shown below.
y = –1.6x + 50
Which statement correctly describes the slope of Dexter’s equation of the line of best fit in thecontext of the situation?
A. The bottle Dexter’s family buys holds about 50 fluid ounces of detergent.
B. For each load of laundry, Dexter’s family uses about 1.6 fluid ounces of detergent.
C. With 50 fluid ounces of detergent, Dexter’s family can wash about 1.6 loads of laundry.
D. With 1.6 bottles of laundry detergent, Dexter’s family can wash about 50 loads of laundry.
Session 2—Mathematics (Calculator)
Mathematics Grade 8 Page 22 GO ON TO THE NEXT PAGE �

34. Use the two functions below to answer the question.
Function B
x y
2468
–8–9
–10–11
Function A
y = x – 23
14
Which statement about the slopes of the functions is true?
A. The slopes of both functions are negative.
B. The slopes of both functions are positive.
C. The slope of function A is negative and the slope of function B is positive.
D. The slope of function A is positive and the slope of function B is negative.
35. Eastview Junior High students order sweatshirts and T-shirts in either purple or gold. Of thestudents who ordered a sweatshirt, the relative frequency of ordering a gold one is half of therelative frequency of ordering a purple one. Which two-way table could show the data from theorders?
A.
Sweatshirt T-Shirt
Purple
Gold
12 18
24 15
Sweatshirt and T-Shirt Orders B.
Sweatshirt T-Shirt
Purple
Gold
28 26
22 44
Sweatshirt and T-Shirt Orders
C.
Sweatshirt T-Shirt
Purple
Gold
70 17
35 93
Sweatshirt and T-Shirt Orders D.
Sweatshirt T-Shirt
Purple
Gold
45 50
25 25
Sweatshirt and T-Shirt Orders
Session 2—Mathematics (Calculator)
Mathematics Grade 8 Page 23 GO ON TO THE NEXT PAGE �

36. Caleb has a piece of rectangular paper that is 12 inches wide by 16 inches long. He drew astraight line along the diagonal of the paper. What is the length of the line Caleb drew?
A. 28 inches
B. 112 inches
C. 20 inches
D. 28 inches
37. Use the graph of the function below to answer the question.
–4 –3 –2 –1 4321
y
x
4321
–1–2–3–4
Which description of the function is true?
A. The function is linear and always increasing.
B. The function is nonlinear and always increasing.
C. The function is decreasing from negative infinity to –1 and increasing from –1 to infinity.
D. The function is decreasing from negative infinity to –2 and increasing from –2 to infinity.
Session 2—Mathematics (Calculator)
Mathematics Grade 8 Page 24 GO ON TO THE NEXT PAGE �

38. In the diagram below, lines x, y, and z are all parallel, and lines r and s intersect at line y.
r s
x
y
z
4 5
3
67
21
Which equation must be true?
A. m 1 = 180° – m 7
B. m 2 = 90° + m 5
C. m 3 + m 4 = m 7
D. m 5 + m 6 = m 7
39. Which equation is not a linear function?
A. y = xy + 2
B. y = x + 2y
C. y = – x –y2
D. y = x – y + 2
Session 2—Mathematics (Calculator)
Mathematics Grade 8 Page 25 GO ON TO THE NEXT PAGE �

40. A baseball coach places baseballs in a cart. He uses the baseballs to pitch to the playersduring practice. The number of baseballs remaining in the cart after different practice lengths,in minutes, are displayed in the scatter plot below.
504540353025201510
5
2 4 6 8 10 12 140Practice Length
(minutes)
Bas
ebal
ls in
Car
t
Baseballs Remaining in Carty
x
Which statement about the scatter plot is true?
A. The scatter plot shows a positive association because all of the points have positivecoordinates.
B. The scatter plot shows a positive association because the points on the graph go towards50 baseballs.
C. The scatter plot shows a negative association because the practice length is always lessthan the number of baseballs in the cart.
D. The scatter plot shows a negative association because as the practice length increases,the number of baseballs in the cart decreases.
Session 2—Mathematics (Calculator)
Mathematics Grade 8 Page 26 GO ON TO THE NEXT PAGE �

41. Which equation has infinitely many solutions?
A. x =14
x +34
B.13
x – 5 =23
x – 5
C.12
(1 + 4x) = 2x – 3
D. 3 – 4x = –6� 23
x �12 �
42. Curt jogged on a path that was 2 miles long, took a break, and then jogged back along thesame path to where he started. He jogged at different speeds for different distances along thepath as shown in the graph.
Curt’s Jogging Time and Distance
Dis
tanc
e fr
om S
tart
ing
Poin
t (m
iles)
1000
1
2
20 30Time (minutes)
40 50 60x
y
Between which times did Curt jog the fastest?
A. 0 minutes and 10 minutes
B. 10 minutes and 25 minutes
C. 25 minutes and 30 minutes
D. 30 minutes and 60 minutes
Session 2—Mathematics (Calculator)
Mathematics Grade 8 Page 27 GO ON TO THE NEXT PAGE �

43. Karen and Henry each sold food at the fair. The table below shows the total number of corndogs Karen sold at different times of the day.
Karen’s Corn Dog Sales
Time Total CornDogs Sold
12:00 P.M. 42
2:00 P.M. 56
4:00 P.M. 70
6:00 P.M. 84
Henry uses the equation below to show the number of hot dogs, h, he has sold after t hours.
h = 14t
Which statement about Karen and Henry is true?
A. The rate that Henry sells hot dogs is half the rate that Karen sells corn dogs.
B. The rate that Henry sells hot dogs is double the rate that Karen sells corn dogs.
C. The rate that Karen sells corn dogs is 7 times the rate that Henry sells hot dogs.
D. The rate that Karen sells corn dogs is the same as the rate that Henry sells hot dogs.
44. A group of four friends each mowed lawns after school and on the weekends for a month. Thetotal number of lawns mowed can be represented by the equation below.
x +13
x +12
x + 16 = 49
Each friend is represented by a term in the equation. How many lawns, x, did the first friendmow?
A. 11
B. 18
C. 27
D. 3116
Session 2—Mathematics (Calculator)
Mathematics Grade 8 Page 28 GO ON TO THE NEXT PAGE �

45. Use the system of two linear equations graphed below to answer the question.
54321
–1–2–3–4–5
1 2 3 4 5–5 –4 –3 –2 –1
y
x
What is the solution to the system of linear equations?
A. (–5, –4)
B. (1, 3.5)
C. y = –x + 1
D. y = 3.5x + 1
46. There were approximately 1.6 × 10¹¹ pieces of mail processed by the United States PostalService in 2012. This is about 75% of the number of pieces of mail processed in 2006.Approximately how many pieces of mail were processed by the United States Postal Service in2006?
A. 1.2 × 10¹⁰
B. 1.2 × 10¹¹
C. 2.13 × 10¹⁰
D. 2.13 × 10¹¹
Session 2—Mathematics (Calculator)
Mathematics Grade 8 Page 29 GO ON TO THE NEXT PAGE �

47. Use the figure below to answer the question.
y
x
4
3
2
1
0 1 2 3 4
R
Q
P30°
2 un
its
2 un
itsA dilation of angle PQR will make the length of line segment Q'R' equal to 6 units. What is themeasure of angle P'Q'R' after the dilation?
A. 10°
B. 30°
C. 60°
D. 90°
48. Parker states that any function written without exponents must be linear. Which functionproves Parker’s statement is incorrect?
A. y = 5x + 3
B. y = x5 + 3
C. y =x3
+ 5
D. y =3x
+ 5
Session 2—Mathematics (Calculator)
Mathematics Grade 8 Page 30 GO ON TO THE NEXT PAGE �

49. Ayan paid a $20 fee for a booth at an art fair so she could sell her ceramic bowls. She will earn$10 for every ceramic bowl she sells. The equation y = 10x – 20 represents the amount ofmoney, y, that Ayan will earn selling x ceramic bowls at the art fair. Which graph represents theamount of money Ayan could earn at the art fair?
A.
40
30
20
10
0-10
-20
-30
-40
43 6521
y
x
Ceramic Bowls Sold
Mon
ey E
arne
d ($
)
Art Fair Earnings
B.
40
30
20
10
0-10
-20
-30
-40
43 6521
y
x
Ceramic Bowls Sold
Mon
ey E
arne
d ($
)
Art Fair Earnings
C.
40
30
20
10
0-10
-20
-30
-40
43 6521
y
x
Ceramic Bowls Sold
Mon
ey E
arne
d ($
)
Art Fair Earnings
D.
40
30
20
10
0-10
-20
-30
-40
43 6521
y
x
Ceramic Bowls Sold
Mon
ey E
arne
d ($
)Art Fair Earnings
Session 2—Mathematics (Calculator)
Mathematics Grade 8 Page 31 GO ON TO THE NEXT PAGE �

50. What is the solution to the equation13
(x + 2) =23
x + 4?
A. x = –10
B. x = –3
C. x = 6
D. x = 12
51. The graph and table below show information about two landscaping companies.
Time Spent Mowing(hours)
Landscaping Company A
Gas
in L
awn
Mow
ers
(gal
lons
)
20406080
100120
20 40 60 80 100
Landscaping Company B
Time SpentMowing(hours)
Gas inLawn Mowers
(gallons)
024487288
1108050200
x
y
Which statement about the two landscaping companies is true?
A. Landscaping company A mows for 20 more hours than landscaping company B.
B. Landscaping company B mows for 20 more hours than landscaping company A.
C. Landscaping company A uses 0.25 of a gallon more gasoline per hour than landscapingcompany B.
D. Landscaping company B uses 0.25 of a gallon more gasoline per hour than landscapingcompany A.
Session 2—Mathematics (Calculator)
Mathematics Grade 8 Page 32 GO ON TO THE NEXT PAGE �

52. Marc read 9 books over the summer. He recorded the number of pages he read and thenumber of hours he spent reading each book. This information and a line of best fit are shownin the scatter plot.
y
x
16141210
8642
0 200 300 400 500 600
Books Marc Read
Pages
Hou
rs S
pent
Rea
ding
Based on the scatter plot, which statement about the time Marc spent reading would mostlikely be true?
A. Marc read at a rate of about 50 pages per hour.
B. Marc read at a rate of about 75 pages per hour.
C. It would take Marc about 2 hours to read a 150-page book.
D. It would take Marc about 12 hours to read a 470-page book.
Session 2—Mathematics (Calculator)
Mathematics Grade 8 Page 33 GO ON TO THE NEXT PAGE �

53. Rudy surveyed 80 people about whether they prefer blueberry or cherry pie and whether theyprefer the pie with or without ice cream. The results are shown in the table below.
Pie and Ice-Cream Preferences
BlueberryPie
CherryPie
WithIce CreamWithoutIce Cream
29 24
15 12
Which conclusion can be made based on the results shown in the table?
A. About13
of the people prefer pie without ice cream.
B. There are 2 times as many people who prefer blueberry pie to cherry pie.
C. Fewer people prefer cherry pie with ice cream than blueberry pie without ice cream.
D. The ratio of people who prefer blueberry pie to cherry pie is equivalent to the ratio ofpeople who prefer pie with ice cream to pie without ice cream.
54. A company puts 36 cans into each box they send to a store. Each can has a radius of1.5 inches and a height of 6 inches. What is the approximate total volume, in cubic inches, ofthe cans in each box the company sends to a store? Use 3.14 for �.
A. 42.39 cubic inches
B. 56.25 cubic inches
C. 1,526.04 cubic inches
D. 2,034.72 cubic inches
Session 2—Mathematics (Calculator)
Mathematics Grade 8 Page 34 GO ON TO THE NEXT PAGE �
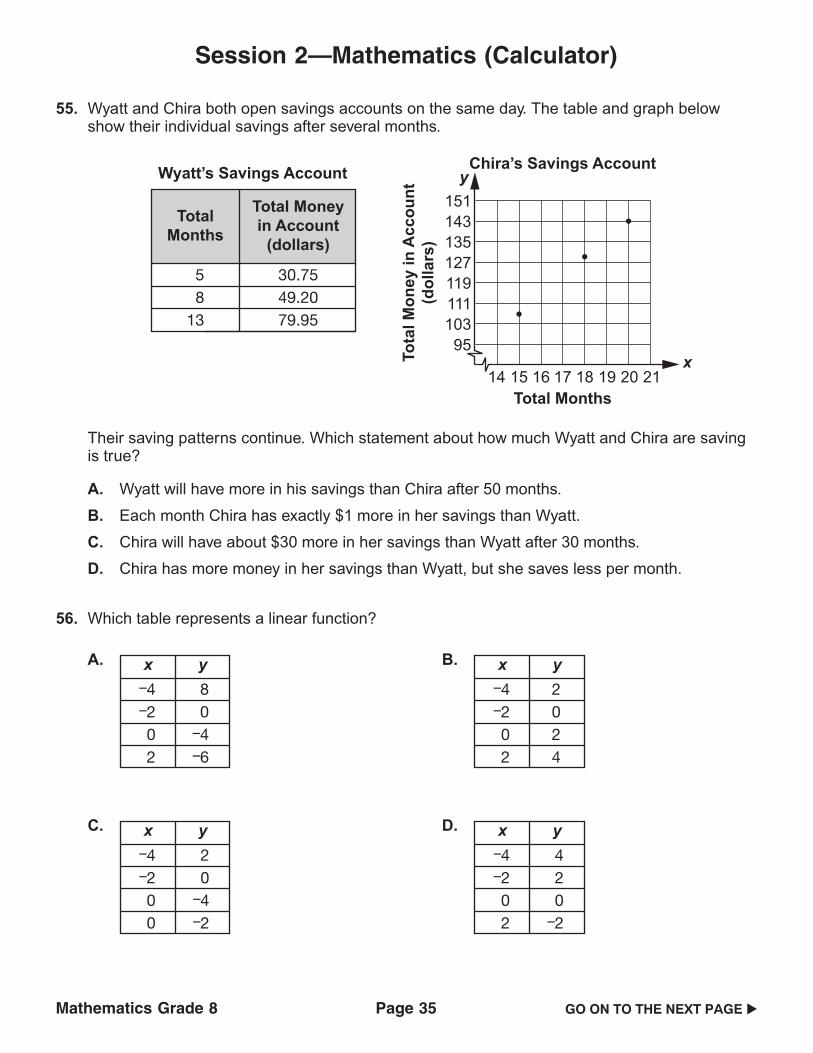
55. Wyatt and Chira both open savings accounts on the same day. The table and graph belowshow their individual savings after several months.
151143135127119111103
95
14 15 16 17 18 19 20 21Total Months
Tota
l Mon
ey in
Acc
ount
(dol
lars
)
Chira’s Savings AccountWyatt’s Savings Account
TotalMonths
Total Moneyin Account
(dollars)
58
13
30.7549.2079.95
x
y
Their saving patterns continue. Which statement about how much Wyatt and Chira are savingis true?
A. Wyatt will have more in his savings than Chira after 50 months.
B. Each month Chira has exactly $1 more in her savings than Wyatt.
C. Chira will have about $30 more in her savings than Wyatt after 30 months.
D. Chira has more money in her savings than Wyatt, but she saves less per month.
56. Which table represents a linear function?
A. x y–4–202
80
–4–6
B. x y–4–202
2024
C. x y–4–200
20
–4–2
D. x y–4–202
420
–2
Session 2—Mathematics (Calculator)
Mathematics Grade 8 Page 35 GO ON TO THE NEXT PAGE �

57. Use the linear function in the table below to answer the question.
x y
5 –6
10 –6
15 –6
20 –6
25 –6
30 –6
Which statement about the function in the table and the line represented byy = 6 is true?
A. The lines do not intersect.
B. The lines have the same y-intercept.
C. The lines both cross through the origin.
D. The lines both cross the x-axis but not the y-axis.
58. Glen spends a total of 9 hours writing a paper and finishing a project. He spends x hours on
the paper and y hours finishing the project. Glen spends 112
more hours on the paper than he
spends on the project. The equations below can be used to find how many hours he spends on
the paper and finishing the project.
x + y = 9
x – y = 112
How many hours does Glen spend writing the paper?
A. 314
hours
B. 334
hours
C. 514
hours
D. 534
hours
Session 2—Mathematics (Calculator)
Mathematics Grade 8 Page 36 GO ON TO THE NEXT PAGE �

59. Stanley marked two points on the grid below to show the locations of the fiction section,point F, and the travel section, point T, in a bookstore.
2 4 6 8 10–2–4–6–8–10T
F
Bookstorey
x
108642
–2–4–6–8
–10
What is the shortest distance, in units, between the fiction section and the travel section in thebookstore?
A. 146
B. 242
C. 16
D. 25
Session 2—Mathematics (Calculator)
Mathematics Grade 8 Page 37 GO ON TO THE NEXT PAGE �

60. Zane graphed a parallelogram on the coordinate grid shown.
y
x
141210
8642
0 2 4 6 8 10 12 14
ABC
D
Zane then translated the parallelogram up 5 units. Which coordinate grid shows the figure afterthe translation?
A.
y
x
141210
8642
0 2 4 6 8 10 12 14
ABC
DB.
y
x
141210
8642
0 2 4 6 8 10 12 14
ABC
D
C.
y
x
141210
8642
0 2 4 6 8 10 12 14
ABC
DD.
y
x
141210
8642
0 2 4 6 8 10 12 14
ABC
D
Session 2—Mathematics (Calculator)
Mathematics Grade 8 Page 38STOP
Mathematics—Sessions 1, 2, and 3GENERAL INSTRUCTIONS
The Mathematics test has three sessions, two with multiple-choice questions and one with constructed-response questions. You may not use a calculator for session 1, but you may use a calculator for sessions 2 and 3.
Mathematics Grade 8 Page 39

Write your answers for questions 61 to 64 in the spaces provided below. Thequestions have more than one part. Show all the work you do to find youranswers. Even if you cannot answer all parts, answer as many as you can. Youmay still get points for answering part of a question. Be sure to write clearly.You may review your work in this session, but do not work on any othersession.
You MAY use a calculator for this session.
61. Greg started with a certain number of quarters. He then decided on a number of quarters hewould save each day. He added the quarters he saved to the amount with which he started. Atthe end of day 2, Greg had a total of 26 quarters saved. At the end of day 5, he had a total of35 quarters saved.
A. How many quarters does Greg start with? Show or explain your work.
B. Write an equation to model the number of quarters Greg has saved, y, after x days.
C. Using the rate at which Greg is saving, explain why he can never have exactly100 quarters saved by the end of any given day.
D. Starting with day 2 and going through day 20, Greg created a graph to show the relationshipbetween the day and the total number of quarters he had saved by the end of that day.Greg plotted each of the 19 data points and then connected them. Describe whatGreg’s graph looked like.
Session 3—Mathematics (Calculator)
Mathematics Grade 8 Page 40 GO ON TO THE NEXT PAGE �

62. The standard length of a game in a basketball league is 48 minutes. For 20 basketball players,a reporter plotted the number of years each has been in the league against the averagenumber of minutes each plays per game. The scatter plot the reporter made is shown below.
Players in Basketball League
Number of Yearsin the League
Aver
age
Num
ber o
fM
inut
es P
laye
d Pe
r Gam
e 4540353025201510
5
10 2 3 4 65 7 8
A. Draw a line of best fit on the scatter plot.
B. What is one way the line of best fit would change if you removed the data point representingthe player who has been in the league for 3 years and plays an average of 6 minutes pergame?
C. Based on the line of best fit you drew, what is the average number of minutes per game aplayer who has never played in the league before could expect to play?
D. Explain why the line of best fit would not provide a valid approximation of the averagenumber of minutes per game a player who has been in the league for15 years would play.
Session 3—Mathematics (Calculator)
Mathematics Grade 8 Page 41 GO ON TO THE NEXT PAGE �

63. Consider the family of linear equations of the form shown below, where z is a rational number.
23
(3x + 2) = zx
A. Solve the equation when z = 1.
B. Find a value for z such that the equation has no solution. Explain how you know theequation has no solution for the value of z you specified.
C. Using what you know about constants and coefficients, explain why there is no value of zthat will force the equation to have infinitely many solutions.
Session 3—Mathematics (Calculator)
Mathematics Grade 8 Page 42 GO ON TO THE NEXT PAGE �

64. Olivia is shipping a baton and a few other things to a friend as a gift. The box measures8 inches, by 9 inches, by 1 foot. She places the baton in the box as shown below.
8 in.
9 in.
1 ft.
batonOlivia’s Box
A. What is the length, in inches, of the baton that she placed in the box? Show or explain yourwork.
B. Olivia thinks that the relationship between the longest diagonal in any rectangular prism,and the dimensions of length, width, and height of the rectangular dimension can bemodeled by the diagram and equation below.
d 2 = l 2 + w
2 – h 2
Olivia’s Equation
d
h
w
l
Without substituting in numbers for variables, show or explain why Olivia’s equation isincorrect.
Session 3—Mathematics (Calculator)
Mathematics Grade 8 Page 43STOP
Multiple-Choice Answer Sheet
Name:
Session 1
1.
2.
3.
4.
5.
6.
7.
8.
9.
10.
11.
12.
13.
14.
15.
16.
17.
18.
19.
20.
21.
22.
23.
24.
25.
26.
27.
28.
29.
30.
Mathematics Grade 8 Page 44

Multiple-Choice Answer Sheet
Name:
Session 2
31.
32.
33.
34.
35.
36.
37.
38.
39.
40.
41.
42.
43.
44.
45.
46.
47.
48.
49.
50.
51.
52.
53.
54.
55.
56.
57.
58.
59.
60.
Mathematics Grade 8 Page 45

Rectangular Prism
lw
h Volume 5 lwhSurfaceArea 5 2wl 1 2lh 1 2wh
Cylinder
Volume 5 �r2hSurfaceArea 5 2�r2 1 2�rh
h
r
a2 1 b2 5 c2Pythagorean Theorem:
a(leg)c(hypotenuse)
b(leg)
Cone
h
r
Volume 5 �r2h13
Sphere
Volume 5 �r343r
Mathematics Grade 8 Page 46

Multiple-Choice Answer Key
Name:
Session 1
1.
2.
3.
4.
5.
6.
7.
8.
9.
10.
11.
12.
13.
14.
15.
16.
17.
18.
19.
20.
21.
22.
23.
24.
25.
26.
27.
28.
29.
30.
C
D
B
D
B
D
D
B
C
B
D
B
B
C
A
A
D
C
A
A
C
B
C
D
D
C
A
A
D
C
Mathematics Grade 8 Page 47

Multiple-Choice Answer Key
Name:
Session 2
A
B
B
D
C
C
B
A
A
D
D
A
B
B
A
D
B
D
D
A
C
D
A
C
C
D
A
C
A
B
31.
32.
33.
34.
35.
36.
37.
38.
39.
40.
41.
42.
43.
44.
45.
46.
47.
48.
49.
50.
51.
52.
53.
54.
55.
56.
57.
58.
59.
60.
Mathematics Grade 8 Page 48

61.
Constructed-Response Scoring Rubrics
Session 3
Mathematics Grade 8 Page 49

62.
Mathematics Grade 8 Page 50

63.
Mathematics Grade 8 Page 51

64.
Mathematics Grade 8 Page 52