grade level plc’s: driving ahead with data - marin coe...
TRANSCRIPT
Bruce Wellenkamp
Mariposa Elementary School
Ontario, CA
Grade level PLC’s: Driving Ahead with Data
Data Director ConferenceOntario, CA
November 3, 2010

Data Analysis and Action Meetings
“Those DAAM Meetings!”
• Timeframe: Post benchmark (4 benchmarks per year)• Utilize SMART goals / target setting• Conduct meetings using PLC best practice
including “30 minute meeting” format• Action planning using
“Here’s What, So What, Now What” format• Determine target standards• Schedule at least one common assessment

GOAL: 4 – 6 week action plan
How do we get there?

SMART Schools
• Where do we want to be?
• Where are we now?
• How will we get there?
• What are we learning?
• Where should we focus next?

S = StrategicS = Specific
M = MeasurableA= Attainable
R = Results Based
T = Time Bound
Why Does SMART Work?
• Focused
• Based on short & long term results– School
– Grade Level
Setting SMART goals
• API
• AYP
• Grade Levels– Action Plans
• Deliberate Decisions

SCHOOL WIDE AYP GOALS: 2010Language Arts
% Proficient2009‐10
% “Un Proficient” GrowthFactor *
TARGET2010‐2011
Overall 35.2 64.8 6.5 41.7
Hispanic / Latino 33.5 66.5 6.6 40.1
Socio‐Economic 33.3 66.7 6.7 40.0
EnglishLearners 21.4 78.6 7.9 29.3
* “Un proficient” x .10

SCHOOL WIDE AYP GOALS: 2010Mathematics
% Proficient2009‐10
% “Un Proficient” Safe Harbor GrowthFactor *
TARGET2010‐2011
Overall 51.0 49.0 4.9 55.9
Hispanic / Latino 49.8 51.2 5.1 54.9
Socio‐Economic 48.4 51.6 5.2 53.6
EnglishLearners 42.5 57.5 5.7 48.2
* “Un proficient” x .10

Professional Learning Communities
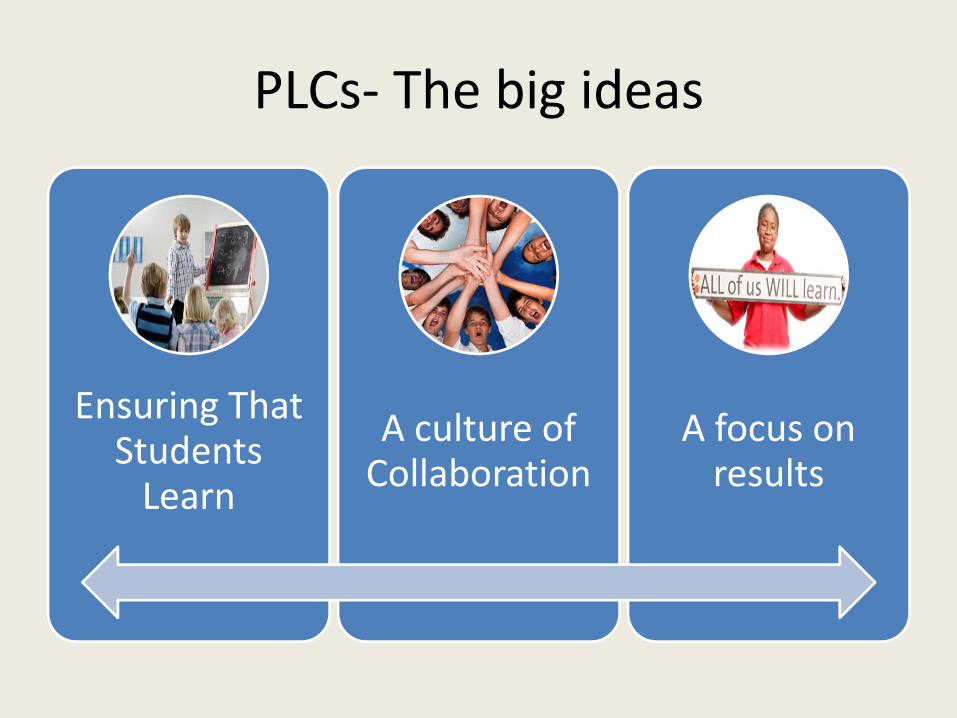
PLCs‐ The big ideas
Ensuring That Students Learn
A culture of Collaboration
A focus on results

A Culture of Collaboration
• It is a systematic process in which teachers work together to analyze and improve their classroom practice.
• Everyone belongs to a team that focus their efforts on student learning.

Focus on Results
• PLCs judge their effectiveness on the basis of results.
• It is a result oriented community that turns data into useful and relevant information.

PLC RolesLeaderFacilitatorRecorderTime keeperOther participants
PLC collaborative elementsGroundingNormsWorking Agreements
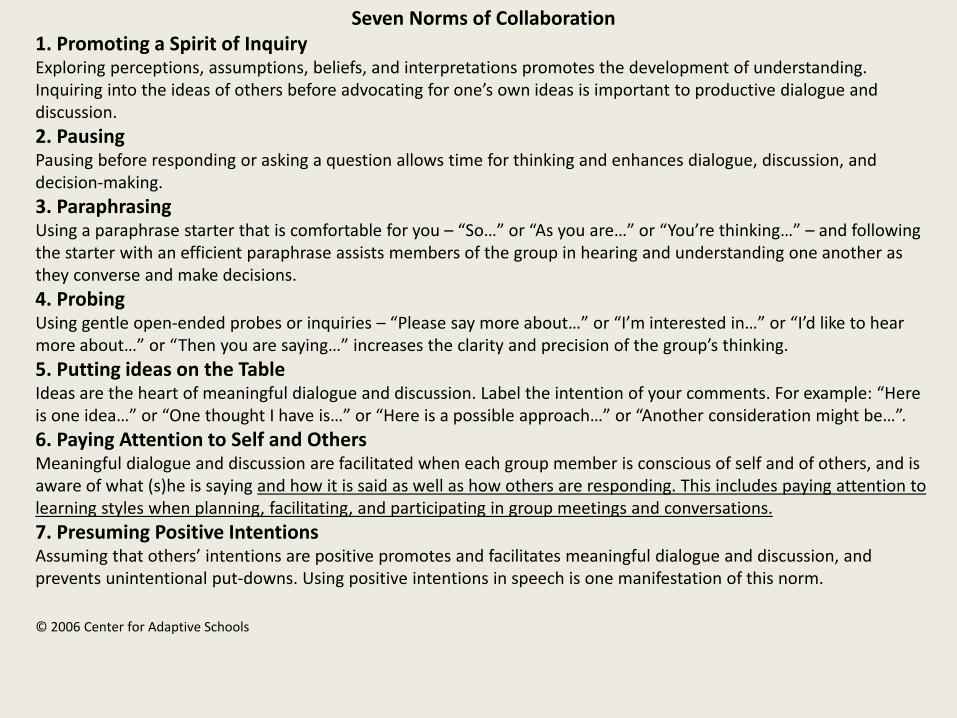
Seven Norms of Collaboration 1. Promoting a Spirit of Inquiry Exploring perceptions, assumptions, beliefs, and interpretations promotes the development of understanding. Inquiring into the ideas of others before advocating for one’s own ideas is important to productive dialogue and discussion. 2. Pausing Pausing before responding or asking a question allows time for thinking and enhances dialogue, discussion, and decision‐making. 3. Paraphrasing Using a paraphrase starter that is comfortable for you – “So…” or “As you are…” or “You’re thinking…” – and following the starter with an efficient paraphrase assists members of the group in hearing and understanding one another as they converse and make decisions. 4. Probing Using gentle open‐ended probes or inquiries – “Please say more about…” or “I’m interested in…” or “I’d like to hear more about…” or “Then you are saying…” increases the clarity and precision of the group’s thinking. 5. Putting ideas on the Table Ideas are the heart of meaningful dialogue and discussion. Label the intention of your comments. For example: “Here is one idea…” or “One thought I have is…” or “Here is a possible approach…” or “Another consideration might be…”. 6. Paying Attention to Self and Others Meaningful dialogue and discussion are facilitated when each group member is conscious of self and of others, and is aware of what (s)he is saying and how it is said as well as how others are responding. This includes paying attention to learning styles when planning, facilitating, and participating in group meetings and conversations. 7. Presuming Positive Intentions Assuming that others’ intentions are positive promotes and facilitates meaningful dialogue and discussion, and prevents unintentional put‐downs. Using positive intentions in speech is one manifestation of this norm.
© 2006 Center for Adaptive Schools
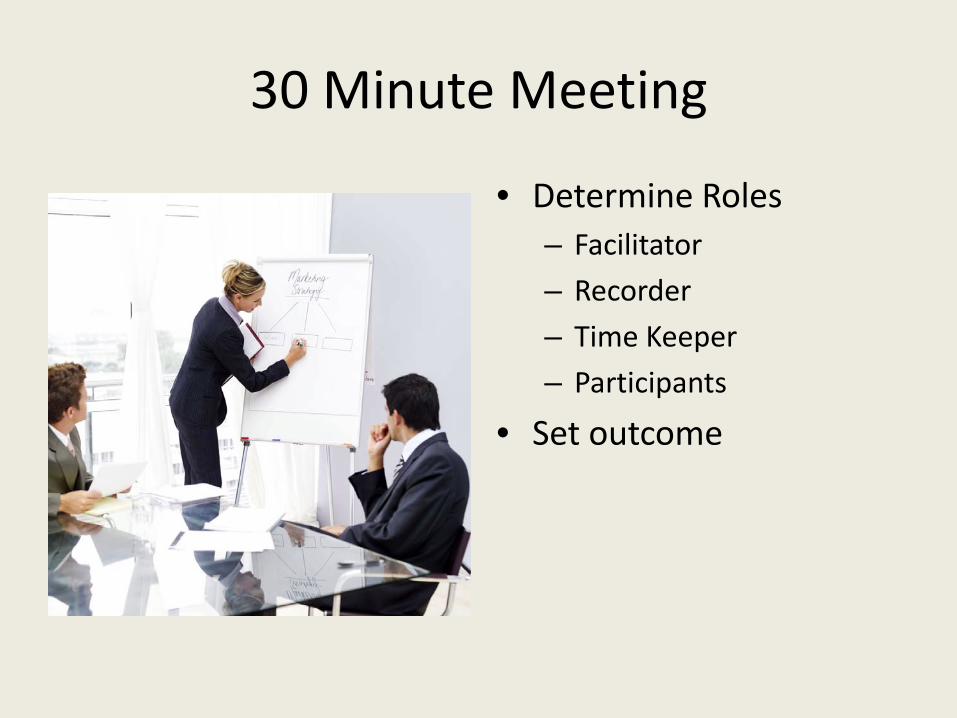
30 Minute Meeting
• Determine Roles– Facilitator
– Recorder
– Time Keeper
– Participants
• Set outcome

30 Minute Meeting Attributes
• Outcomes? (1 minute)• What is Working? (5 minutes)• What are chief challenges? (3-5 minutes)• Proposed Solutions? (8-10 minutes)• Action Plan? (10 minutes)

ACTION PLAN FORMAT
SMART Goal:
Target Goal:
Action Steps Person(s) Timeline Notes/EvidenceResponsible

Here’s What, So What, Now What?
Here’s What So What? Now What?
‐Objective, data based statements‐Avoid subjective comments‐ Try to limit “we’ve got do ‐‐‐‐, because ‐‐‐‐”‐ Try to generate the whole data picture before generating next steps
‐Identify key data statements and possible impacts‐Prioritize pieces of the data picture‐Connect data to prior efforts and priorities
‐ Statements that form the basis for an action plan.
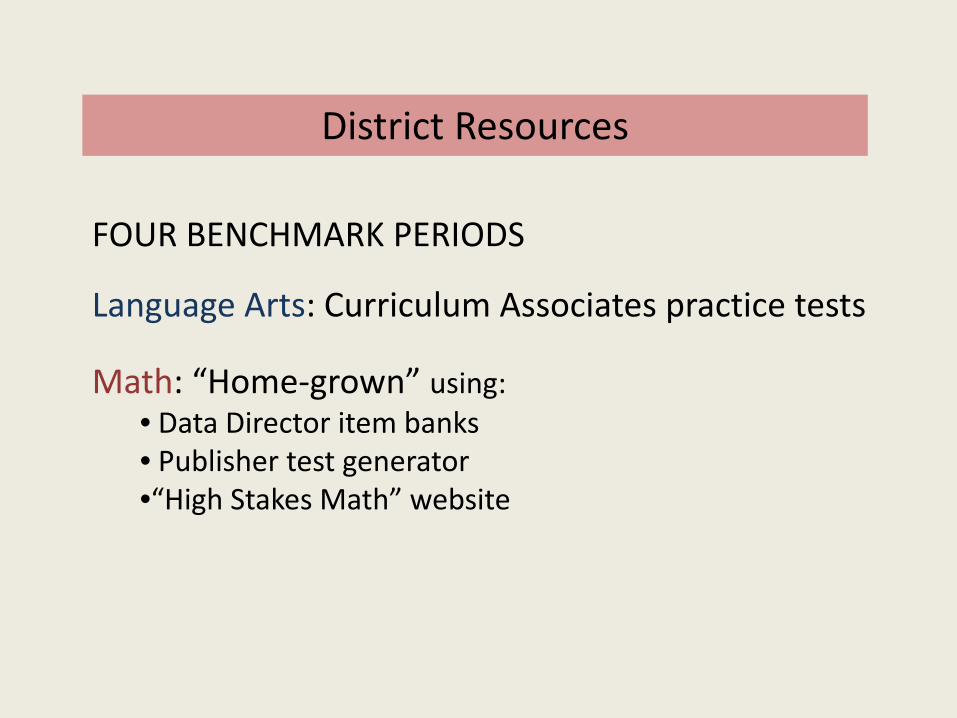
District Resources
Language Arts: Curriculum Associates practice tests
Math: “Home‐grown” using:• Data Director item banks• Publisher test generator•“High Stakes Math” website
FOUR BENCHMARK PERIODS

District Resources
Assessment Blueprints: Language Arts and Math
Lists number of questions for each standard for each assessment, including CST
District Resources


DD Support
• Reports– Cluster Reporting
– Exporting to Excel• Auto filtering
• Conditional formatting
• Monitoring of Subgroups and extended learning opportunities using programs.
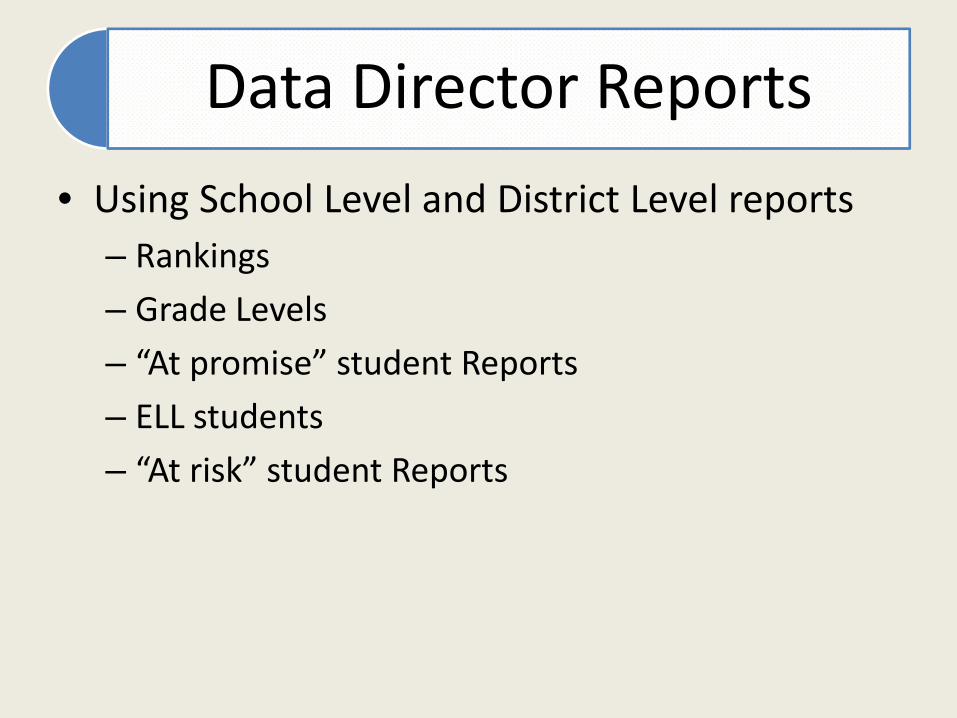
Data Director Reports
• Using School Level and District Level reports– Rankings
– Grade Levels
– “At promise” student Reports
– ELL students
– “At risk” student Reports

Cluster Reporting
• Matching SMART and CST clusters in reporting.
• DD and OMSD have created custom reporting.

Reading Reports
Clusters

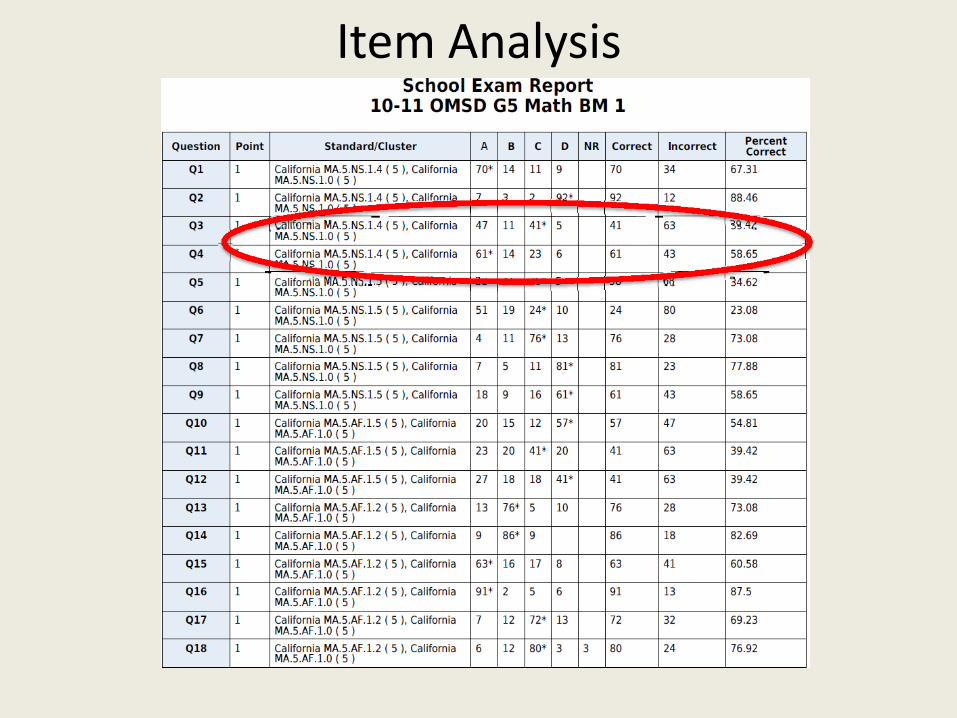
Item Analysis

Excel Reports
• Customizing reports with Excel

Benchmark results
• Math Standards
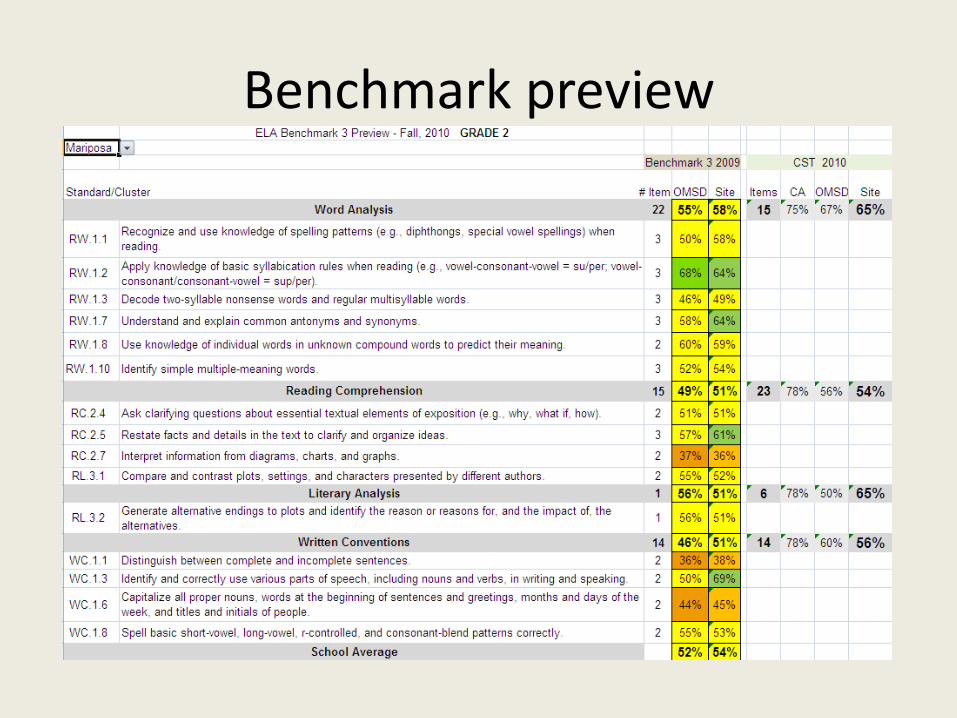
Benchmark preview

35
Tree Diagram Template
SMART Goal Indicator Measure Target

36
Grade Level SMART Goal
SMART Goal Indicator Measure Target
Compare grade level % proficient in 2009 to AYP requirement – including Safe Harbor
Select a “stretch” number to shoot for – challenging but still realistic(needs to exceed Safe Harbor target)
CST ____ % of all ____ grade students will be proficient / advanced on the 2009‐10 Language Arts CST

37
Grade Level SMART Goal
SMART Goal Indicator Measure Target
CST 60 % of all nth grade students will be proficient / advanced on the 2009‐10 Language Arts CST

38
What indicators should we focus on for our SMART Goal?
Indicators (Essential Outcomes)
The skills, knowledge or evidence of performance that comprise or lead to
proficiency in the goal.
For CST: Content Clusters

39
Grade Level SMART Goal
SMART Goal
Indicator
Word AnalysisReading CompLiterary ResponseWritten ConventionWriting Strategies
Word AnalysisReading CompLiterary ResponseWritten ConventionWriting Strategies
Word AnalysisReading CompLiterary ResponseWritten ConventionWriting Strategies
CST 60 % of all nth grade students will be proficient / advanced on the 2009‐10 Language Arts CST
40
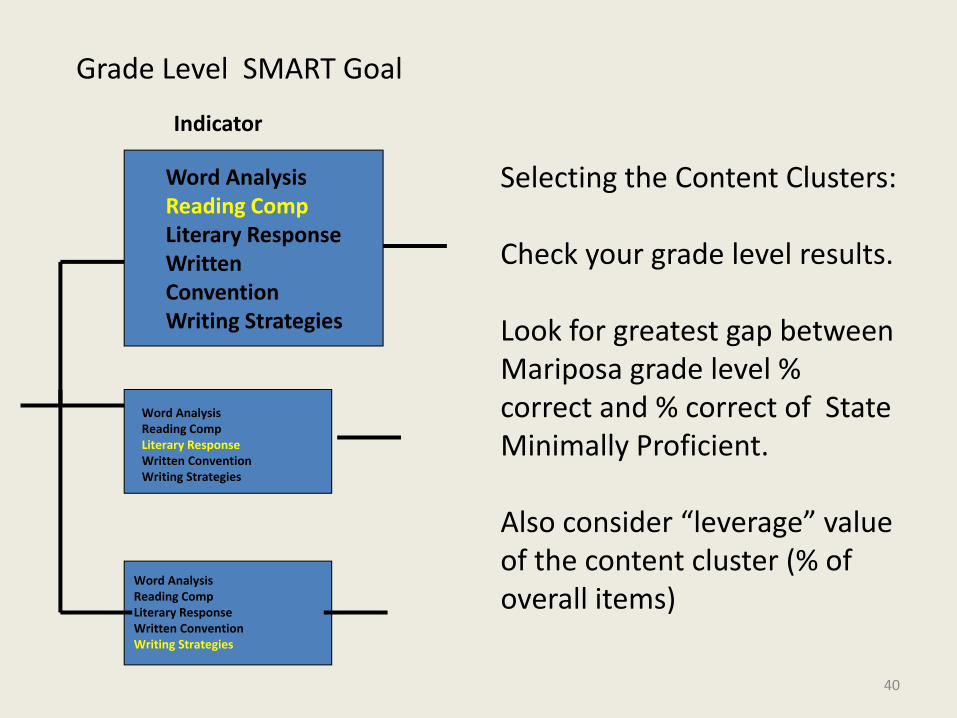
Grade Level SMART Goal
Indicator
Word AnalysisReading CompLiterary ResponseWritten ConventionWriting Strategies
Word AnalysisReading CompLiterary ResponseWritten ConventionWriting Strategies
Word AnalysisReading CompLiterary ResponseWritten ConventionWriting Strategies
Selecting the Content Clusters:
Check your grade level results.
Look for greatest gap between Mariposa grade level % correct and % correct of State Minimally Proficient.
Also consider “leverage” value of the content cluster (% of overall items)

41
How will we measure progress on our SMART Goal?
Measures:
Shorter term incremental steps toward the goal. Targets are set for each measure.
For OMSD 2010‐2011
Benchmark (or SCOE)
Common Assessment (s)

42
Grade Level SMART Goal
SMART Goal
Indicator
Word AnalysisReading CompLiterary ResponseWritten ConventionWriting Strategies
Word AnalysisReading CompLiterary ResponseWritten ConventionWriting Strategies
Word AnalysisReading CompLiterary ResponseWritten ConventionWriting Strategies
CST 60 % of all nth grade students will proficient / advanced on the 2009‐10 Language Arts CST
Measures
Benchmark
Curriculum Associates
Theme test Q
# 12 ‐ 18

43
What should our targets be?
Targets:
Shorter term incremental steps toward the goal. Targets are set for each measure.
The state minimally proficient students averaged ___ % on this cluster. Our goal for average percent correct on this cluster for BM 1 is
All: _____% EL: ______ % SWD: ______ %

44
Grade Level SMART Goal
SMART GoalIndicator
Word AnalysisReading CompLiterary ResponseWritten ConventionWriting Strategies
Word AnalysisReading CompLiterary ResponseWritten ConventionWriting Strategies
Word AnalysisReading CompLiterary ResponseWritten ConventionWriting Strategies
CST 60 % of all nth grade students will proficient / advanced on the 2009‐10 Language Arts CST
BM 1___ % #___BM2___% #___BM3___% #___BM4___% #___
Measures
Benchmark
Curriculum Associates
Team Assessments
Benchmark
Curriculum Associates
Team Assessments
Benchmark
Curriculum Associates
Team Assessments
Target
The state minimally proficient students averaged ___ % on this cluster. Our goal for average percent correct on this cluster for BM 1 is
All: _____% EL: ______ % SWD: ______ %

Smart Goal Template

The Handbook for SMART School Teams
Copyright © 2002 National Educational Service
SMART GOAL Specific + strategic,
measurable, attainable, results-oriented, timebound
INDICATOR Standards and objectives (weak areas for students)
MEASURE Tools we’ll use to determine where students are now and whether they are improving
TARGET The attainable performance
level we would like to see
Tree Diagram – OMSD Assessment SMART Goal Math – BM2
CST: _58_% of all 4th_ grade students (# _71/123_) will be proficient / advanced on the 2009-10 CST Math. BM 4 __50_% #__62___ BM 3 __39___% #__48__ BM 2 __23__% #__28___ BM 1 __39__% #__44___
Est, percents, factoring Fractions & Decimals Algebra & Functions Measurement & Geo Statistics
Operations and Factoring Fractions & Decimals Algebra & Functions Measurement & Geo Statistics
Est, percents, factoring Fractions & Decimals Algebra & Functions Measurement & Geo Statistics
Benchmark Assessments BM3
High Stakes Math
Benchmark Assessments BM 3
High Stakes Math
Benchmark Assessments Not tested on Benchmarks
High Stakes Math Study Island
The state minimally proficient students averaged ___80__% on this cluster. Our goal for average percent correct on this cluster for BM 3 is: All: __70____% EL: __70____% SED: ______%
The state minimally proficient students averaged __72___% on this cluster. Our goal for average percent correct on this cluster for BM 3 is: All: __75____% EL: __75____% SED: ______%
The state minimally proficient students averaged ___63___% on this cluster. Our goal for average percent correct on this cluster for BM 1 is: All: __63____% EL: __63_____% SED: ______%
School: Bon View Grade: 4th Grade Date: Nov 5, 2009

Bon View Elementary STPT Grade: 6 Date: November 5, 2009
Initial Reactions
Strengths Areas of Focus
BM 2
ELA: Gap between top and bottom schools. Big discrepancy. Deviation of scores is too diverse Improvement from BM1 to BM2 is almost double. Still “over testing”.
ELA: C1.0- written conventions Standards Plus Release questions
ELA: R3.5recognize the difference between first- and third-person narration R2.7Make reasonable assertions about a text through accurate, supporting citations Explicit vocabulary needs to be in students knowledge.
Math: Improvement from BM1 to 2 Still over testing
Math: Spiral DD questions
Math: AF 3.1- information wasn’t focused on

Bon View Elementary STPT Grade: Date:
Initial Reactions
Strengths Areas of Focus
SCOE Fall
More at or above percentages than below grade level. Aguilara rocks in rhyming Pleased with progress made. Kinder readiness boxes helped.
Rhyming skills Overall, a more advanced start Letter recognition Computer Skills (Star Fall) Powerpoints and chants have helped More parent involvement and support
Rhyming Skills High Frequency Working smarter-Collaboration

Results Area:
__70%___ Letter Recognition
__75%__ Sound Recognition
__75%___ Rhyming
% of students that will be
proficient (at or above
grade level).
Decision # 1 Improve letter/sound recognition. Students will recognize 10 sounds and 24 letters by mid year SCOE.
Decision # 2 Improve rhyming skills. Students will recognize 4 out of 5 words on mid year scoe.
Decision # 3 We will develop ELD groupings and target instruction based on language levels. Students will improve at least one language level by the end of the year.
Time/Resources/Strategies: Implement 5 star ELD strategies to work with ELL students. Work with Andrea to support implementation.
Grade: ___Kinder______ SCOE: ___Fall________ Previous Goal:_______ Percentage Attained: _______
STPT Meeting
Time/Resources/Strategies: Pulling students in small groups Continue SmartBoard lessons Powerpoint/highlight with uppercase letters
Time/Resources/Strategies: “Magical rhyming book” Use rhyming powerpoint-myomsd
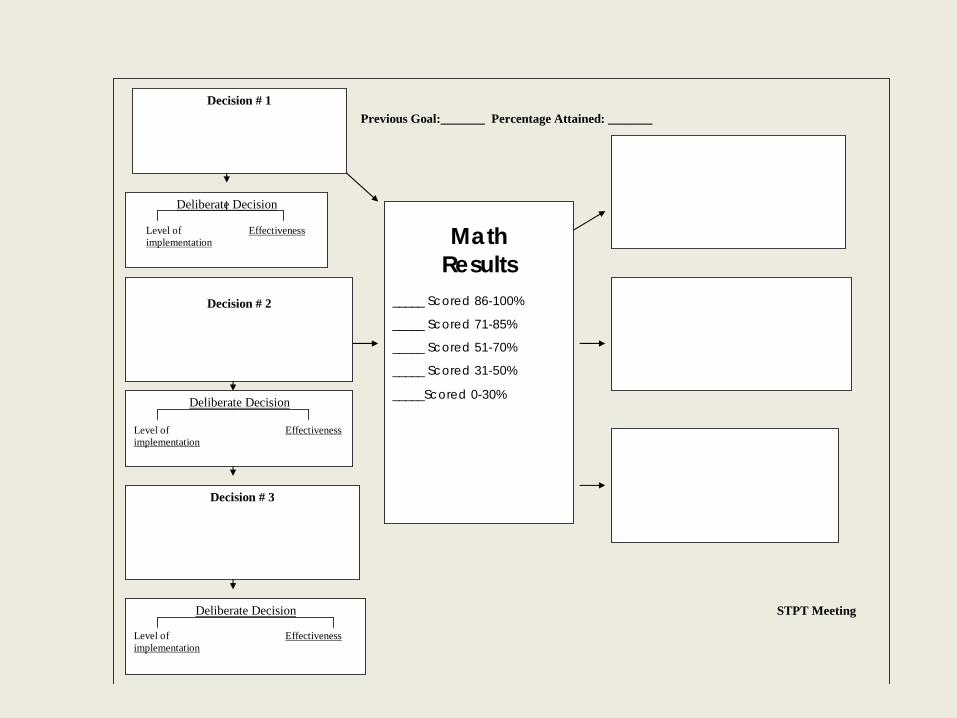
Math Results
_____ Scored 86-100%
_____ Scored 71-85%
_____ Scored 51-70%
_____ Scored 31-50%
_____Scored 0-30%
Decision # 1
Decision # 2
Decision # 3
Deliberate Decision Level of Effectiveness implementation
Previous Goal:_______ Percentage Attained: _______
STPT Meeting
Deliberate Decision
Level of implementation
Effectiveness
Deliberate Decision Level of Effectiveness implementation

Goal: # of students who will continue to achieve Adv. or Pro. on the next BM _____ Number of students who will reach Adv. or Proficient on the next BM ______
Focus Standards Grade: ELA / Math
Groups

Berlyn School

El Camino School
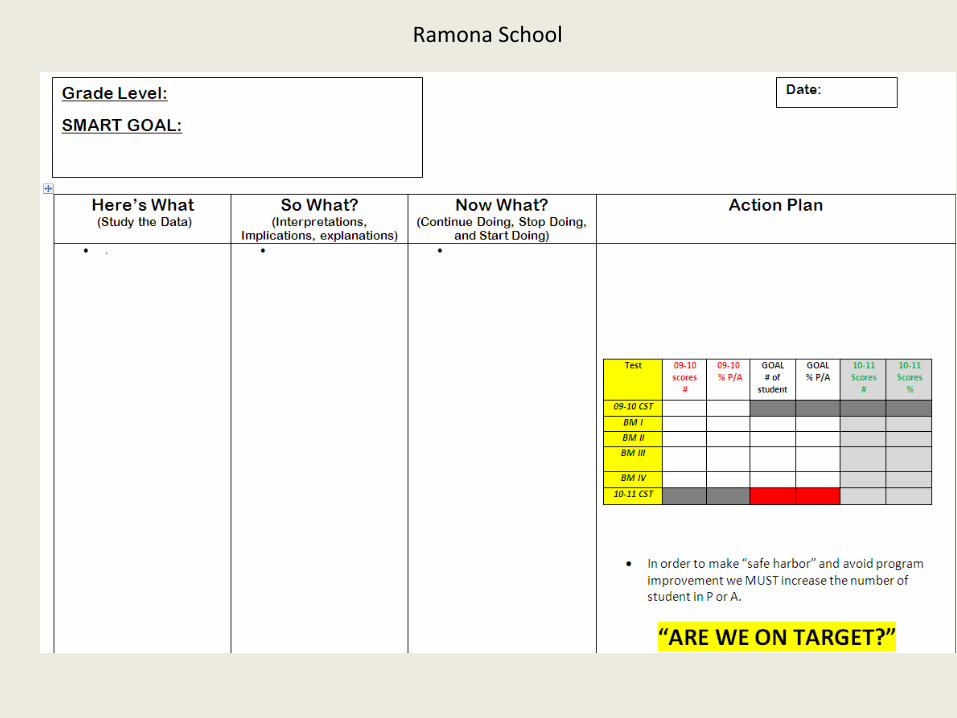
Ramona School

Ramona School

Monitoring/Response
• Extended Learning – Program groupings
– Standards Plus Integration
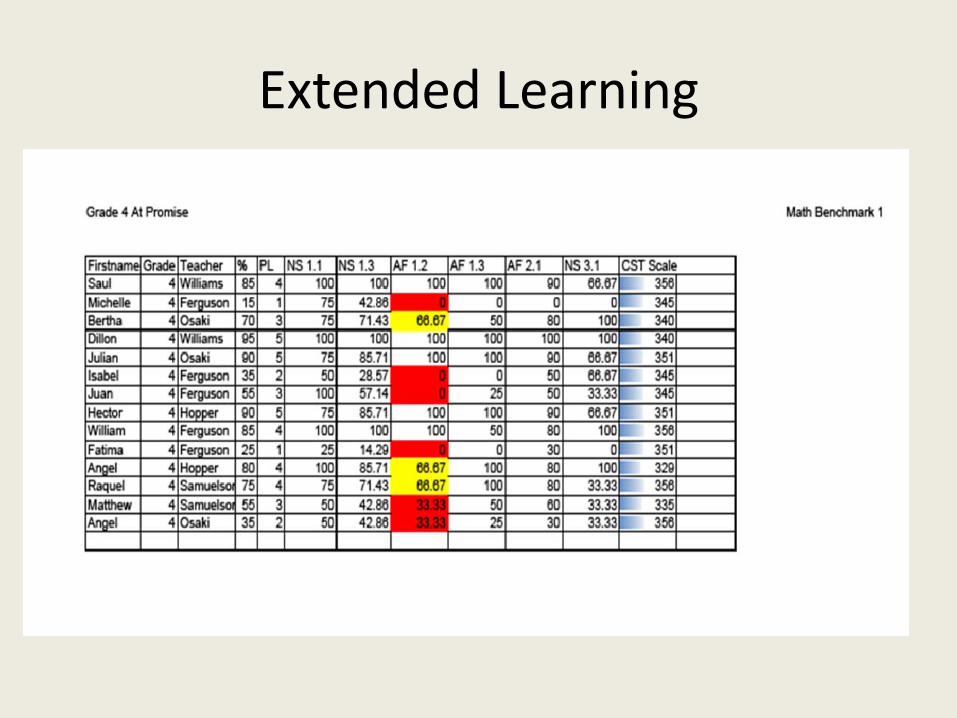
Extended Learning

Extended Learning‐Math

Extended Learning ELA
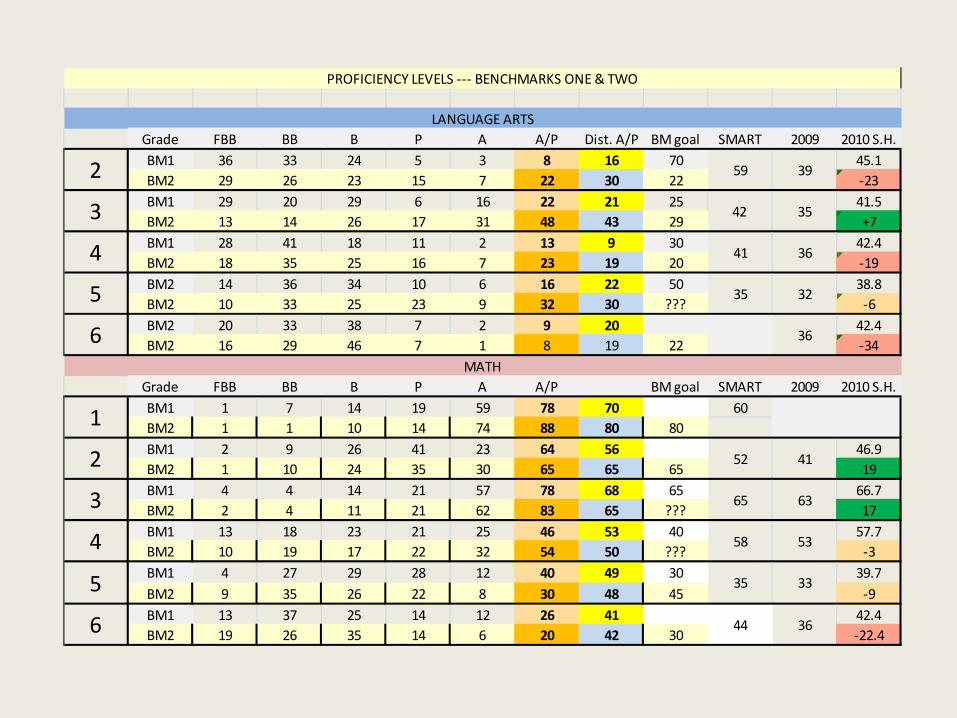
Grade FBB BB B P A A/P Dist. A/P BM goal SMART 2009 2010 S.H.BM1 36 33 24 5 3 8 16 70 45.1BM2 29 26 23 15 7 22 30 22 ‐23BM1 29 20 29 6 16 22 21 25 41.5BM2 13 14 26 17 31 48 43 29 +7BM1 28 41 18 11 2 13 9 30 42.4BM2 18 35 25 16 7 23 19 20 ‐19BM2 14 36 34 10 6 16 22 50 38.8BM2 10 33 25 23 9 32 30 ??? ‐6BM2 20 33 38 7 2 9 20 42.4BM2 16 29 46 7 1 8 19 22 ‐34
Grade FBB BB B P A A/P BM goal SMART 2009 2010 S.H.BM1 1 7 14 19 59 78 70 60BM2 1 1 10 14 74 88 80 80BM1 2 9 26 41 23 64 56 46.9BM2 1 10 24 35 30 65 65 65 19BM1 4 4 14 21 57 78 68 65 66.7BM2 2 4 11 21 62 83 65 ??? 17BM1 13 18 23 21 25 46 53 40 57.7BM2 10 19 17 22 32 54 50 ??? ‐3BM1 4 27 29 28 12 40 49 30 39.7BM2 9 35 26 22 8 30 48 45 ‐9BM1 13 37 25 14 12 26 41 42.4BM2 19 26 35 14 6 20 42 30 ‐22.4
44
59 39
42 35
36
53
PROFICIENCY LEVELS ‐‐‐ BENCHMARKS ONE & TWO
LANGUAGE ARTS
41 36
35 32
2
3
4
5
6MATH
6
1
2
3
4
5 35 33
36
52 41
65 63
58
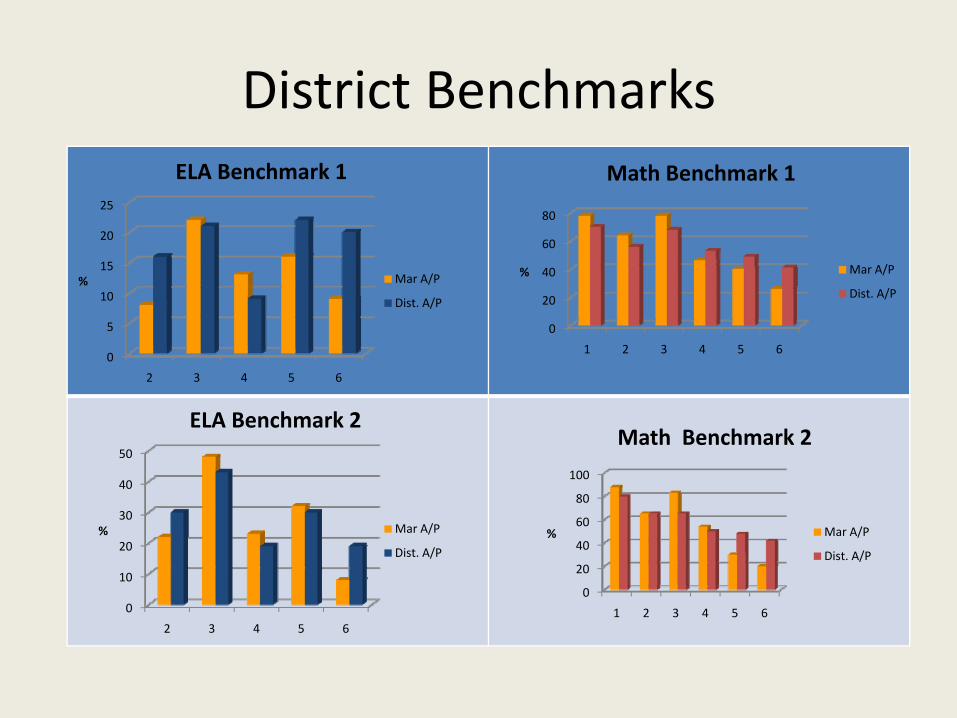
District Benchmarks
0
5
10
15
20
25
2 3 4 5 6
%
ELA Benchmark 1
Mar A/P
Dist. A/P
0
10
20
30
40
50
2 3 4 5 6
%
ELA Benchmark 2
Mar A/P
Dist. A/P
0
20
40
60
80
1 2 3 4 5 6
%
Math Benchmark 1
Mar A/P
Dist. A/P
0
20
40
60
80
100
1 2 3 4 5 6
%
Math Benchmark 2
Mar A/P
Dist. A/P

Safe Harbor
0
10
20
30
40
50
2 3 4 5 6
%
ELA Benchmark 1
Mar A/P
Safe Harbor
0
10
20
30
40
50
2 3 4 5 6
%
ELA Benchmark 2
Mar A/P
Safe Harbor
01020304050607080
2 3 4 5 6
%
Math Benchmark 1
Mar A/P
0102030405060708090
2 3 4 5 6
%
Math Benchmark 2
Mar A/P
Safe Harbor