grade level/course: math 6 and math 7 · grade level/course: math 6 and math 7 lesson/unit plan...
TRANSCRIPT

Page 1 of 14 MCC@WCCUSD 03/06/2015
Grade Level/Course: Math 6 and Math 7
Lesson/Unit Plan Name: Mean Absolute Deviation (MAD)
Rationale/Lesson Abstract: The objective of this lesson is to give students an understanding of Mean Absolute Deviation (MAD) as a single value of variability. Students will be able to calculate the MAD from data and know when and why to do so.
Timeframe: 1-2 60 minute periods
Common Core Standard(s): Develop understanding of statistical variability. 6.SP.2 Understand that a set of data collected to answer a statistical question has a distribution which can be described by its center, spread, and overall shape. 6.SP.3 Recognize that a measure of center for a numerical data set summarizes all of its values with a single number, while a measure of variation describes how its values vary with a single number. Summarize and describe distributions. 6.SP.5 Summarize numerical data sets in relation to their context, such as by: c. Giving quantitative measures of center (median and/or mean) and variability (interquartile range and/or mean absolute deviation), as well as describing any overall pattern and any striking deviations from the overall pattern with reverence to the context in which the data were gathered.
Instructional Resources/Materials: Warm-up (p.9), one deck of playing cards or dice per pair of students, paper, pencil, student note taking guide (p.11-14) and Exit Ticket (p.7)
Page 2 of 14 MCC@WCCUSD 03/06/2015
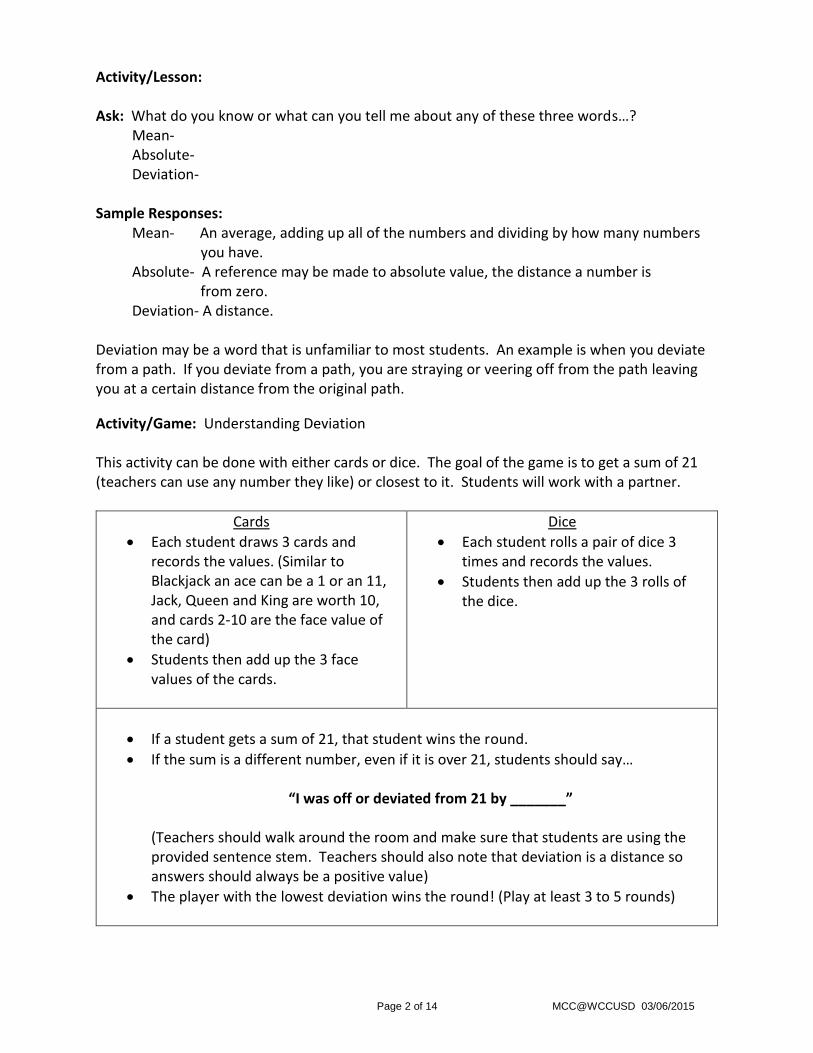
Activity/Lesson: Ask: What do you know or what can you tell me about any of these three words…? Mean- Absolute- Deviation- Sample Responses: Mean- An average, adding up all of the numbers and dividing by how many numbers you have. Absolute- A reference may be made to absolute value, the distance a number is from zero. Deviation- A distance. Deviation may be a word that is unfamiliar to most students. An example is when you deviate from a path. If you deviate from a path, you are straying or veering off from the path leaving you at a certain distance from the original path.
Activity/Game: Understanding Deviation This activity can be done with either cards or dice. The goal of the game is to get a sum of 21 (teachers can use any number they like) or closest to it. Students will work with a partner.
Cards
Each student draws 3 cards and records the values. (Similar to Blackjack an ace can be a 1 or an 11, Jack, Queen and King are worth 10, and cards 2-10 are the face value of the card)
Students then add up the 3 face values of the cards.
Dice
Each student rolls a pair of dice 3 times and records the values.
Students then add up the 3 rolls of the dice.
If a student gets a sum of 21, that student wins the round.
If the sum is a different number, even if it is over 21, students should say…
“I was off or deviated from 21 by _______”
(Teachers should walk around the room and make sure that students are using the provided sentence stem. Teachers should also note that deviation is a distance so answers should always be a positive value)
The player with the lowest deviation wins the round! (Play at least 3 to 5 rounds)

Page 3 of 14 MCC@WCCUSD 03/06/2015
Activity/Lesson continued: Pass out the Student Note-Taking Guide Students at this point have looked at measures of central tendency (mean median and mode) and some measures of variation or spread (range and interquartile range). Another measure of variation is mean absolute deviation. Definition: The mean absolute deviation (aka MAD) of a set of data is the average distance between each data value and the mean. Example 1: The boy’s basketball team recorded their scores from 10 games this season. The scores are shown in the table below. Find the mean absolute deviation of the set of data. Describe what the mean absolute deviation represents in this situation.
Basketball Scores
41 37 50 38 46 54 42 56 49 47
Step 1: Find the mean.
41 37 50 38 46 54 42 56 49 47
10
460
10
46
The mean of the data is 46 points.
Step 2: Find the absolute value of the difference between each value in the data set and the mean.
41 46
5
5
37 46
9
9
50 46
4
4
38 46
8
8
46 46
0
0
54 46
8
8
42 46
4
4
56 46
10
10
49 46
3
3
47 46
1
1

Page 4 of 14 MCC@WCCUSD 03/06/2015
Step 3: Find the average of the absolute values of the differences between each value in the data set and the mean.
5 8 4 1 9 0 10 4 8 3
10
52
10
5.2
The mean absolute deviation is 5.2. This means that the average
distance each data value is from the mean is 5.2 points.
Example 2 (You try!): The number of runs allowed by a pitcher on the baseball team was recorded for his last 9 starts in a game. The results are shown in the table below. Find the mean absolute deviation of the set of data. Describe what the mean absolute deviation represents in this situation.
Number of Runs Allowed
0 8 6 4 5 5 2 6 0
Step 1: Find the mean.
0 8 6 4 5 5 2 6 0
9
36
9
4
The mean of the data is 4 runs allowed per game.
Step 2: Find the absolute value of the difference between each value in the data set and the mean.
0 4
4
4
8 4
4
4
6 4
2
2
4 4
0
0
5 4
1
1
5 4
1
1
2 4
2
2
6 4
2
2
0 4
4
4

Page 5 of 14 MCC@WCCUSD 03/06/2015
Step 3: Find the average of the absolute values of the differences between each value in the data set and the mean.
4 4 2 0 1 1 2 2 4
9
20
9
2.2
2.2
The mean absolute deviation is 2.2. This means that the average
distance each data value is from the mean is 2.2 runs.
(Teachers should mention that the smaller
the MAD, the more
consistant the pitcher is because they do not stray far from their mean)
Example 3 (You try!): The table below shows the high temperatures in the Bay Area for one week during the Month of March. Find the mean absolute deviation of the set of data. Describe what the mean absolute deviation represents in this situation.
High Temperatures (°F)
60 64 62 68 70 72 66
Step 1: Find the mean.
60 64 62 68 70 72 66
7
462
7
66
The mean of the data is 66 F.
Step 2: Find the absolute value of the difference between each value in the data set and the mean.
60 66
6
6
64 66
2
2
62 66
4
4
68 66
2
2
70 66
4
4
72 66
6
6
66 66
0
0

Page 6 of 14 MCC@WCCUSD 03/06/2015
Step 3: Find the average of the absolute values of the differences between each value in the data set and the mean.
6 2 4 2 4 6 0
7
24
7
3.43
The mean absolute deviation is approximately 3.43. This means that the average
distance each data value is from the mean is about 3.43 F.
After doing all of this work you might ask yourself when and why you would take the time to find the Mean Absolute Deviation of a data set! This answer is made clear in the Common Core Progression Documents in statistics and probability for 6-8th grade mathematics.
Look at a set of data and choose
the best measure of center.
If the median is a more useful
measure of center (there are
extreme values) then the
interquartile range (IQR) is a more
meaningful measure of spread.
If the mean is a more useful
measure of center (there are no
extreme values) then the mean
absolute deviation (MAD) is a more
meaningful measure of spread.

Page 7 of 14 MCC@WCCUSD 03/06/2015
Exit Ticket/Assessment:
1) In your own words describe the steps for finding the mean absolute deviation of a data set. ________________________________________________________________________________________________________________________________________________________________________________________________________________________________________________________________________________________________________________________________________________________________________________________________________________________________________________________________________________________________________________________
2) What is the mean absolute deviation of the data: 10, 17, 20, 12 and 16 ?
3) Challenge Problem From the list of numbers below, write one number in each box. You may use each number exactly once.
3
4
7
8
9
14
Three unique numbers with
mean = 8 and MAD = 4
Three unique numbers with
mean = 7 and MAD = 2
Page 8 of 14 MCC@WCCUSD 03/06/2015
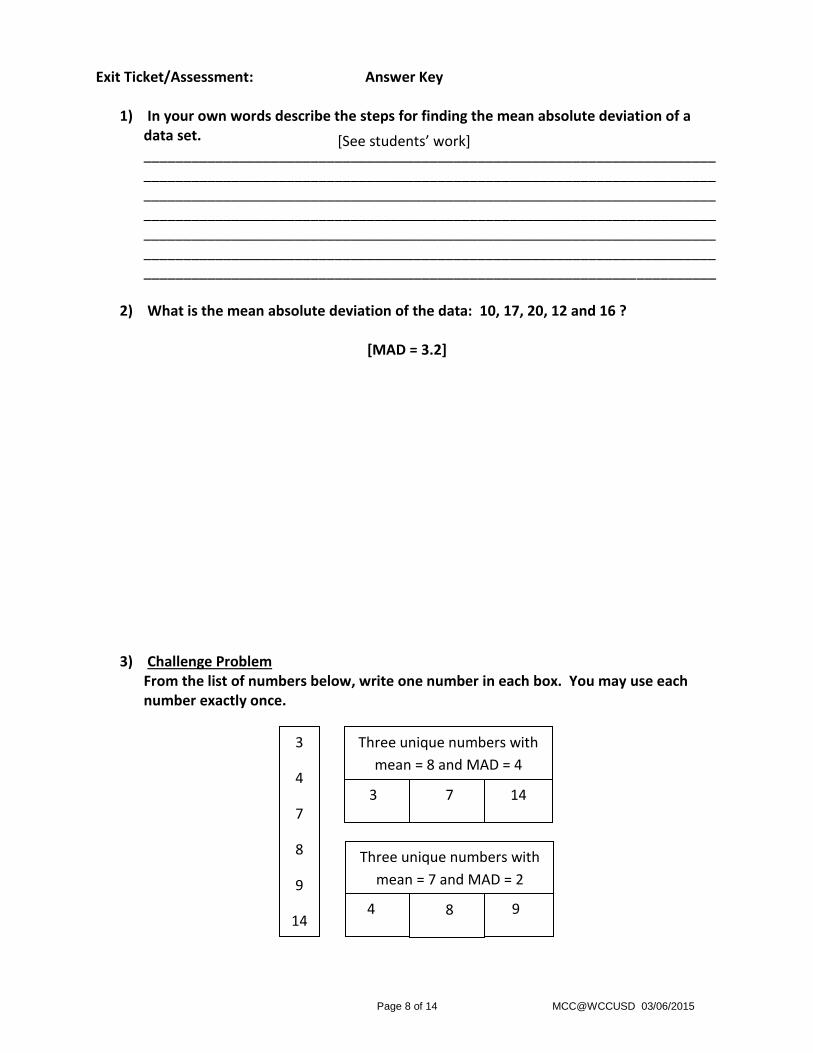
Exit Ticket/Assessment: Answer Key
1) In your own words describe the steps for finding the mean absolute deviation of a data set. ________________________________________________________________________________________________________________________________________________________________________________________________________________________________________________________________________________________________________________________________________________________________________________________________________________________________________________________________________________________________________________________
2) What is the mean absolute deviation of the data: 10, 17, 20, 12 and 16 ?
[MAD = 3.2]
3) Challenge Problem From the list of numbers below, write one number in each box. You may use each number exactly once.
3
4
7
8
9
14
Three unique numbers with
mean = 8 and MAD = 4
3 14 7
4 9 8
Three unique numbers with
mean = 7 and MAD = 2
[See students’ work]
Page 9 of 14 MCC@WCCUSD 03/06/2015
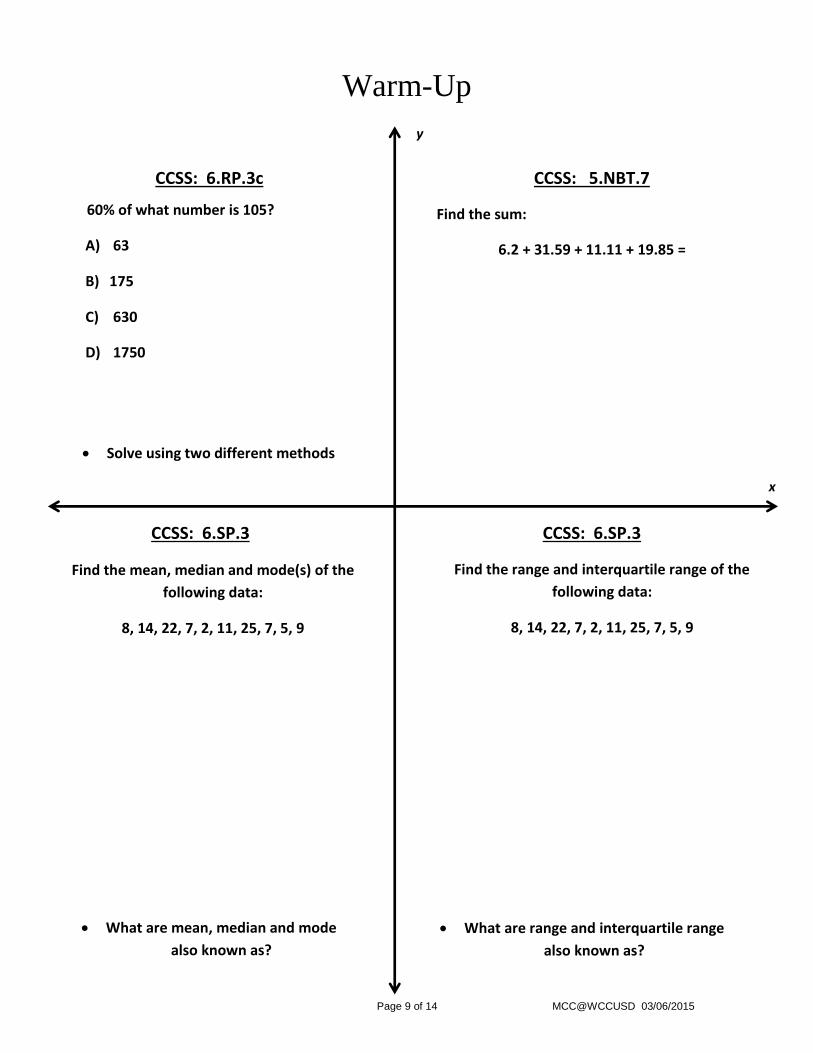
Warm-Up
CCSS: 6.RP.3c CCSS: 5.NBT.7
CCSS: 6.SP.3 CCSS: 6.SP.3
y
x
Find the mean, median and mode(s) of the
following data:
8, 14, 22, 7, 2, 11, 25, 7, 5, 9
Find the range and interquartile range of the
following data:
8, 14, 22, 7, 2, 11, 25, 7, 5, 9
60% of what number is 105?
A) 63
B) 175
C) 630
D) 1750
Find the sum:
6.2 + 31.59 + 11.11 + 19.85 =
What are mean, median and mode
also known as?
What are range and interquartile range
also known as?
Solve using two different methods

Page 10 of 14 MCC@WCCUSD 03/06/2015
Warm-Up: Answer Key
CCSS: 6.RP.3c CCSS: 5.NBT.7
CCSS: 6.SP.3 CCSS: 6.SP.3
y
x
Find the mean, median and mode(s) of the
following data:
8, 14, 22, 7, 2, 11, 25, 7, 5, 9
Find the range and interquartile range of the
following data:
8, 14, 22, 7, 2, 11, 25, 7, 5, 9
60% of what number is 105?
A) 63
B) 175
C) 630
D) 1750
Find the sum:
6.2 + 31.59 + 11.11 + 19.85 =
What are mean, median and mode
also known as?
[measures of center]
What are range and interquartile range
also known as?
[measures of variability]
Solve using two different methods
[B) 175] [68.75]
[mean = 11]
[median = 8.5]
[mode = 7]
[range = 23]
[IQR = 7]

Page 11 of 14 MCC@WCCUSD 03/06/2015
Mean Absolute Deviation: Note-Taking Guide
Definition: The mean absolute deviation (aka MAD) __________________________________ ____________________________________________________________________ ____________________________________________________________________ Example 1: The boy’s basketball team recorded their scores from 10 games this season. The scores are shown in the table below. Find the mean absolute deviation of the set of data. Describe what the mean absolute deviation represents in this situation.
Basketball Scores
41 37 50 38 46 54 42 56 49 47
Step 1: Find the mean. Step 2: Find the absolute value of the difference between each value in the data set and the mean.
Step 3: Find the average of the absolute values of the differences between each value in the data set and the mean.

Page 12 of 14 MCC@WCCUSD 03/06/2015
Example 2 (You try!): The number of runs allowed by a pitcher on the baseball team was recorded for his last 9 starts in a game. The results are shown in the table below. Find the mean absolute deviation of the set of data. Describe what the mean absolute deviation represents in this situation.
Number of Runs Allowed
0 8 6 4 5 5 2 6 0
Step 1: Find the mean.
Step 2: Find the absolute value of the difference between each value in the data set and the mean.
Step 3: Find the average of the absolute values of the differences between each value in the data set and the mean.
Page 13 of 14 MCC@WCCUSD 03/06/2015
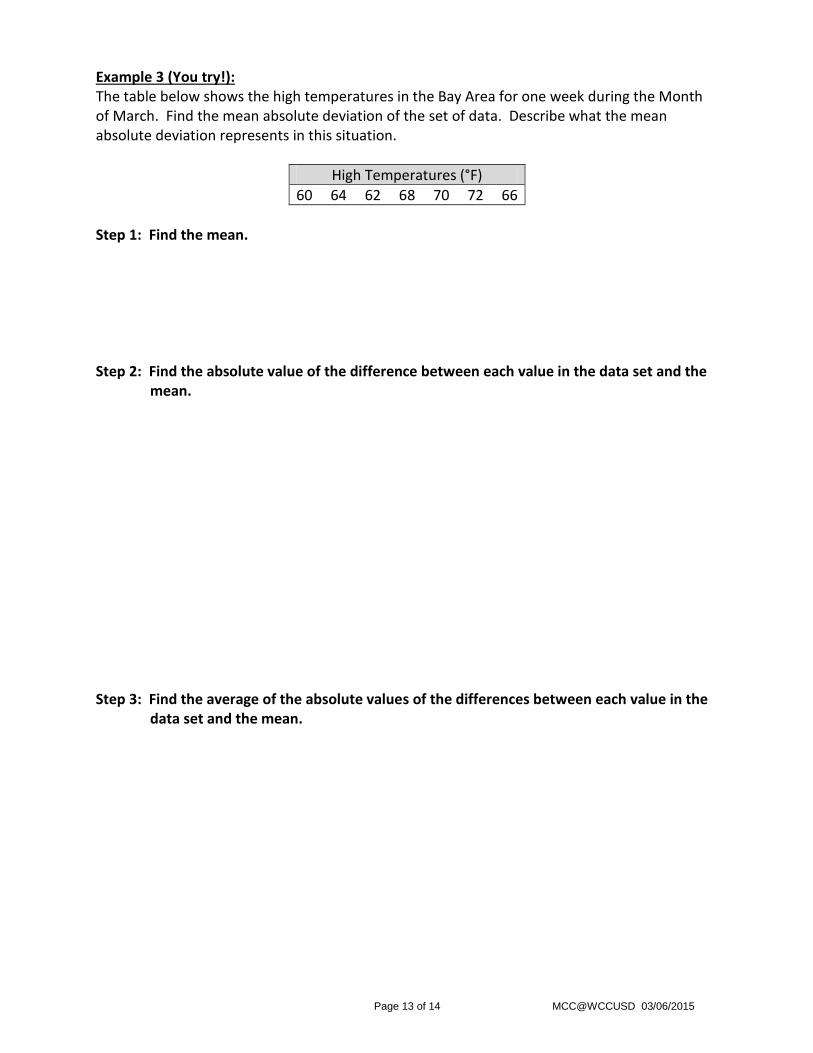
Example 3 (You try!): The table below shows the high temperatures in the Bay Area for one week during the Month of March. Find the mean absolute deviation of the set of data. Describe what the mean absolute deviation represents in this situation.
High Temperatures (°F)
60 64 62 68 70 72 66
Step 1: Find the mean. Step 2: Find the absolute value of the difference between each value in the data set and the mean.
Step 3: Find the average of the absolute values of the differences between each value in the data set and the mean.
Page 14 of 14 MCC@WCCUSD 03/06/2015
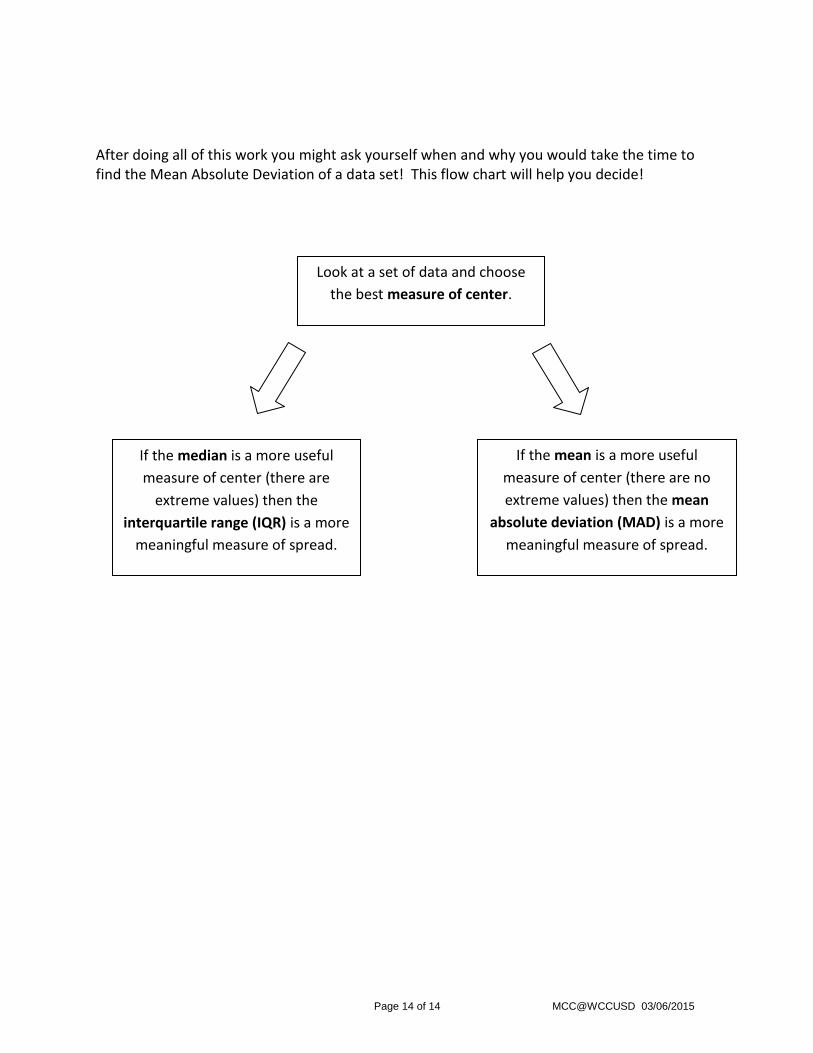
After doing all of this work you might ask yourself when and why you would take the time to find the Mean Absolute Deviation of a data set! This flow chart will help you decide!
Look at a set of data and choose
the best measure of center.
If the median is a more useful
measure of center (there are
extreme values) then the
interquartile range (IQR) is a more
meaningful measure of spread.
If the mean is a more useful
measure of center (there are no
extreme values) then the mean
absolute deviation (MAD) is a more
meaningful measure of spread.