grade toni tan, centre for clinical practice. grade the grading of recommendations assessment,...
TRANSCRIPT

GRADE
Toni Tan, Centre for Clinical Practice
GRADE
The Grading of Recommendations Assessment, Development and
Evaluation
GRADE“A systematic and explicit approach to making
judgements about the quality of evidence, and
the strength of recommendations can help to
prevent errors, facilitate critical appraisal of these
judgements, and can help to improve
communication of this information.”
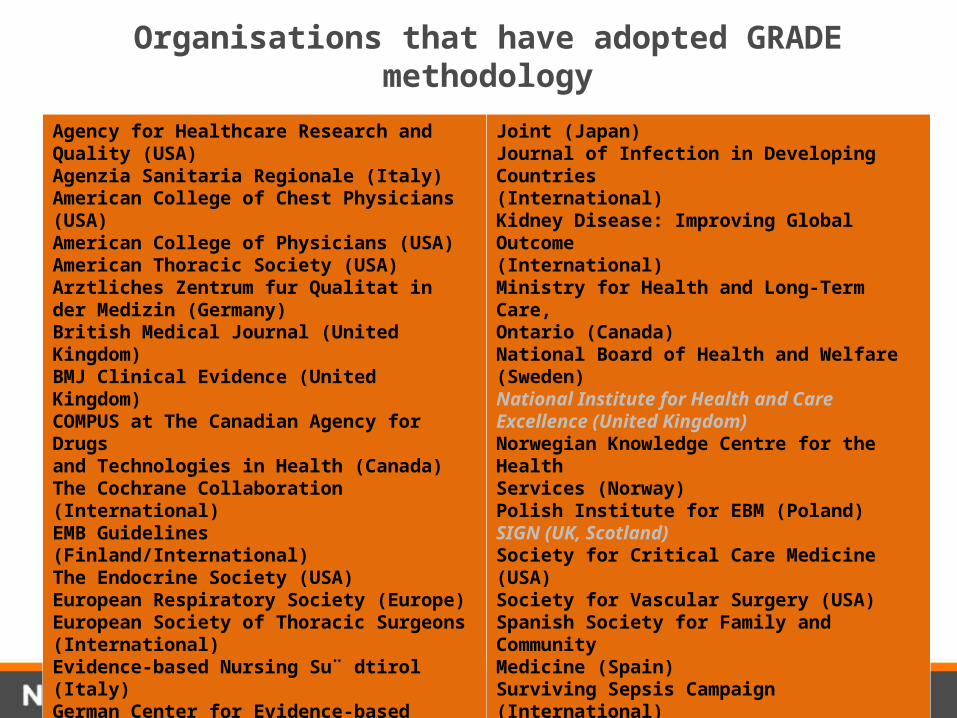
Organisations that have adopted GRADE methodology
Agency for Healthcare Research and Quality (USA)Agenzia Sanitaria Regionale (Italy)American College of Chest Physicians (USA)American College of Physicians (USA)American Thoracic Society (USA)Arztliches Zentrum fur Qualitat in der Medizin (Germany)British Medical Journal (United Kingdom)BMJ Clinical Evidence (United Kingdom)COMPUS at The Canadian Agency for Drugsand Technologies in Health (Canada)The Cochrane Collaboration (International)EMB Guidelines (Finland/International)The Endocrine Society (USA)European Respiratory Society (Europe)European Society of Thoracic Surgeons(International)Evidence-based Nursing Su¨ dtirol (Italy)German Center for Evidence-based Nursing‘‘sapere aude’’ (Germany)Infectious Diseases Society of America (USA)Japanese Society for Temporomandibular
Joint (Japan)Journal of Infection in Developing Countries(International)Kidney Disease: Improving Global Outcome(International)Ministry for Health and Long-Term Care,Ontario (Canada)National Board of Health and Welfare (Sweden)National Institute for Health and CareExcellence (United Kingdom)Norwegian Knowledge Centre for the HealthServices (Norway)Polish Institute for EBM (Poland)SIGN (UK, Scotland)Society for Critical Care Medicine (USA)Society for Vascular Surgery (USA)Spanish Society for Family and CommunityMedicine (Spain)Surviving Sepsis Campaign (International)University of Pennsylvania Health SystemCenter for Evidence-Based Practice (USA)UpToDate (USA)World Health Organization (International)

‘Traditional’ approachChecklist system
• Selection bias: randomisation, concealment of allocation, comparable at baseline
• Performance bias: blinding (patients & care providers), the comparison groups received the same care apart from the intervention studied.
• Attrition bias: systematic differences between the comparison groups with respect to participants lost
• Detection bias: appropriate length of follow-up, definition of outcome, blinding (investigators)
++ All or most of the criteria have been fulfilled. Where they have not been fulfilled the conclusions of the study or review are thought very unlikely to alter.
+ Some of the criteria have been fulfilled. Those criteria that have not been fulfilled or not adequately described are thought unlikely to alter the conclusions.
Few or no criteria fulfilled. The conclusions of the study are thought likely or very likely to alter.

‘Traditional’ approach Narrative summary
For example, AIP guidelineMortality rates
One cluster RCT from the UK investigated the effectiveness of CCOT on hospital mortality using PAR score……found a significant reduction in hospital mortality in patients in the intervention wards at cluster level (OR = 0.523, 95% CI 0.322 to 0.849). The cluster RCT from Australia found no difference in unexpected death (without do-not-resuscitate order) (secondary outcome) between control group and intervention group (per 1000 admissions: control = 1.18, intervention = 1.06, difference = −0.093 [−0.423 to 0.237], 95% CI: −0.423 to 0.237; adjusted p = 0.752, adjusted OR = 1.03, 95% CI 0.84 to 1.28).
Evidence statement:(1+) There were conflicting findings in the two included studies on mortality
rates: the Priestley and coworkers study found a significant reduction in mortality (but failed to report do-not-resuscitate orders), but MERIT found no difference between the two arms of the study for this outcome.

GRADE
• Interventional studies of effectiveness• Currently in development for diagnostic accuracy studies,
prognostic and qualitative studies• Makes sequential appraisal about:
– The quality of evidence across studies for each critical/important outcome (instead of individual study)
– Which outcomes are critical to a decision– The overall quality of evidence across these critical outcomes– The balance between benefits and harms
• Result is an assessment of:– quality of the evidence for an outcome– strength of the recommendations
• Perspective of guideline developers

GRADE profile
Quality assessment No of patients Effect
Quality Importance No of studies Design Ris
k o
f b
ias
Inc
on
sis
ten
cy
Ind
irec
tne
ss
Imp
rec
isio
n
Oth
er
co
nsid
era
tio
ns
SMBG SMUG
Relative (95% CI) Absolute
Change in Hba1c (%; Better indicated by lower values)
3 (Allen 1990, Lu 2011, Fontbonne 1989*)
RCTs S1 N N S2 none 61 63 - MD 0.15 higher (0.37 lower to 0.67 higher). See figure 14
Low CRITICAL
Change in Fasting Blood Glucose (FBG mmol/L; Better indicated by lower values)
2 (Allen 1990, Lu 2011)
RCTs N N N S2 none 61 63 - MD 0.35 lower (1.45 lower to 0.74 higher). See figure 15
Moderate CRITICAL
Change in weight (Kg; Better indicated by lower values)
1 (Allen 1990) RCT S1 NA N S2 none 27 27 - MD 2 higher (0.3 to 3.7 higher)
Low IMPORTANT
1 Downgrade by one level: studies conducted before 1995 when the management of diabetes and other related condit ions may have differed compared with current practice 2 Downgrade by one level: The 95% confidence interval passes through the minimal important difference (MID) which is 0.5% for change in Hba1c levels, 1 mmol/L for fasting blood glucose, 1 mmol/L for postprandial blood glucose, 5kg for body weight, 3 BMI point and 3 cm for waist circumference. For all other outcomes a change of 0.5 for continuous outcomes or a relative risk reduction or increase of 25% or more for binary outcomes were considered clinically important.

Why do we use GRADE in NICE clinical guidelines?
• Concerns about the sometimes inappropriate direct link between study design and recommendation strength
• Anecdotal evidence that recommendations not based on evidence from trials were being ignored
• WHO evaluation of the NICE clinical guidelines programme
• Just being explicit about what we had been doing anyway!

How GRADE works?
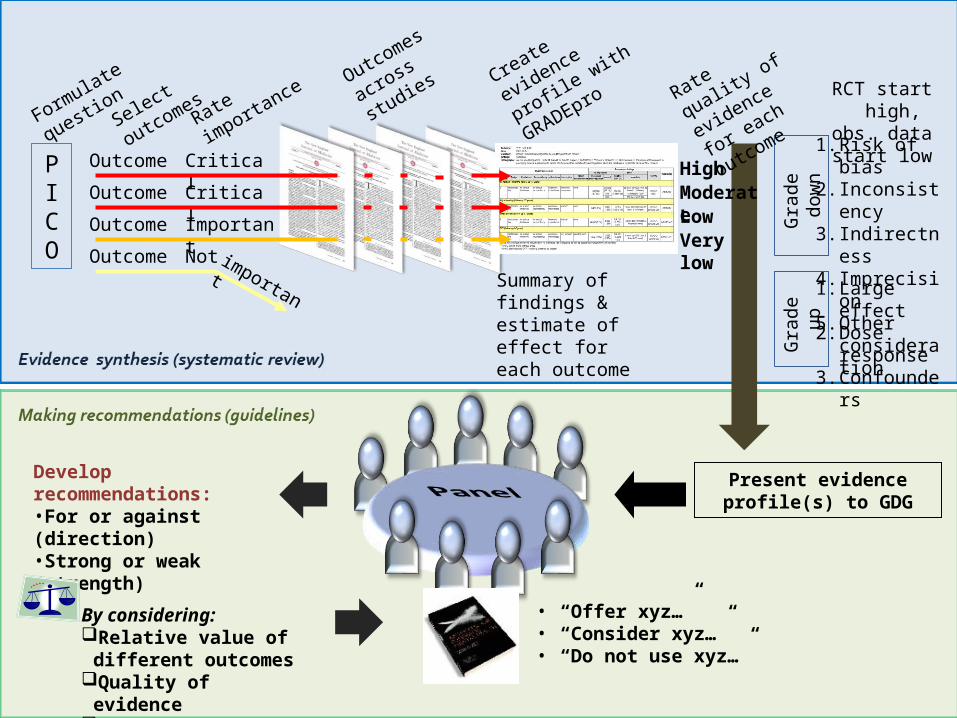
PICO
OutcomeOutcomeOutcomeOutcome
Formulate
question
Rate
importa
nce
Critical
Important
Critical
Not important
Create
evidence
profile with
GRADEpro
Summary of findings & estimate of effect for each outcome
Present evidence profile(s) to GDG
RCT start high, obs. data start
low1. Risk of bias2. Inconsisten
cy3. Indirectnes
s4. Imprecision5. Other
consideration
Gra
de d
own
Gra
de u
p 1. Large effect
2. Dose response
3. Confounders
Rate quality
of evidence
for each
outcomeSelect
outcomes
Very low
LowModerate
High
Develop recommendations:•For or against (direction)•Strong or weak (strength)
By considering:Relative value of different
outcomesQuality of evidenceTrade off - benefits/harmsHealth economicsOther considerations
• “Offer xyz…”• “Consider xyz…”• “Do not use xyz…”
Outcomes
across
studies

GRADE concept of quality of evidence
– The quality of evidence reflects the extent to which our confidence (certainty) in an estimate of the effect is adequate to support a particular recommendation.
– Guideline panels must make judgements about the quality of evidence relative to the specific context for which they are using the evidence.
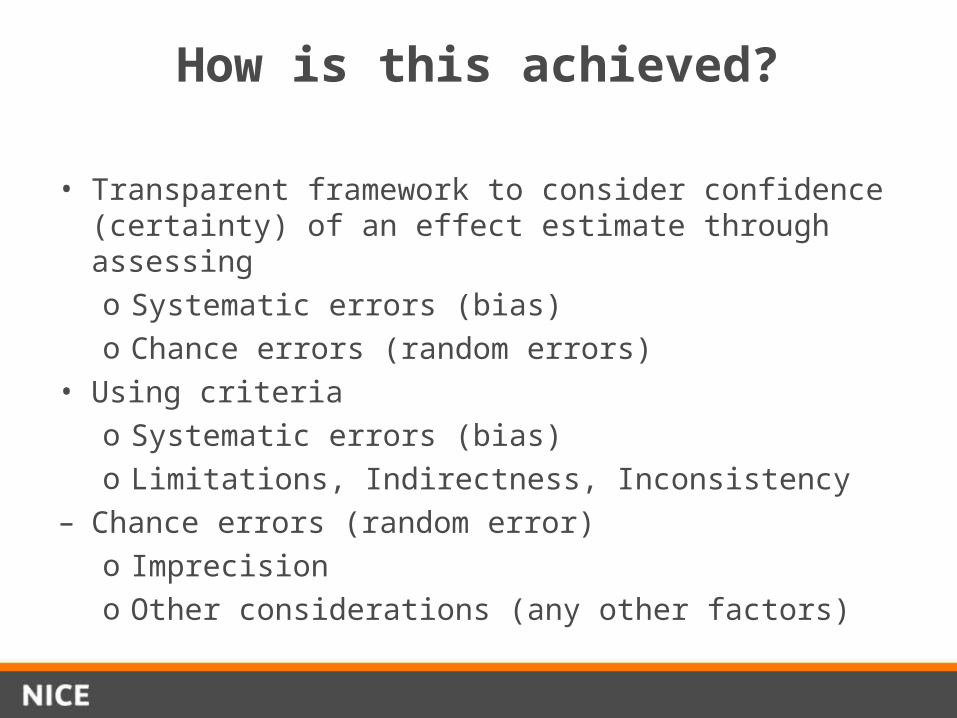
How is this achieved?
• Transparent framework to consider confidence (certainty) of an effect estimate through assessingo Systematic errors (bias)o Chance errors (random errors)
• Using criteriao Systematic errors (bias)o Limitations, Indirectness, Inconsistency
– Chance errors (random error)o Imprecisiono Other considerations (any other factors)

GRADE Definitions
High Further research is very unlikely to change our confidence in the estimate of effect.
Moderate Further research is likely to have an important impact on our confidence in the estimate of effect and may change the estimate.
Low Further research is very likely to have an important impact on our confidence in the estimate of effect and is likely to change the estimate.
Very low Any estimate of effect is very uncertain.

GRADE diagram
Grading quality of evidence
What is the methodology of the best available evidence?
RCT Uncontrolled studiesObservational study
Assume “high quality”
Assume “low quality” “very low quality”
Factors lowering the quality present?
Factors lowering the quality present?
If NO –Factors increasing the
quality?
If NO –Stay “low quality”
If YES –Upgrades
Become “moderate or high quality”
If YES –Downgrades
If NO –Stay “high quality”
Become “moderate, low or very low quality”
If YES – downgrade to“very low quality”

Determining the quality of evidence
• Limitations• Inconsistent results• Indirectness• Imprecision• Other considerations
– Large or very large effect
– Plausible biases underestimate true effect
– Dose-response gradient
– All of above can upgrade 1 level (2 for large magnitude of effect)

Limitations or ‘risk of bias’ - RCTslimitation explanation
Lack of allocation concealment
Those enrolling patients are aware of the group to which the next enrolled patient will be allocated (major problem in “pseudo” or “quasi” randomized trials with allocation by day of week, birth date, chart number etc.)
Lack of blinding Patient, caregivers, those recording outcomes, those adjudicating outcomes, or data analysts are aware of the arm to which patients are allocated
Incomplete accounting of patients and outcome events
Loss to follow-up and failure to adhere to the intention to treat principle when indicated
Selective outcome reporting Reporting of some outcomes and not others on the basis of the results
Other limitations For example:stopping early for benefit observed in randomized trials, in particular in the absence of adequate stopping rules use of unvalidated patient-reported outcomes carry-over effects in cross-over trials recruitment bias in cluster-randomized trials

Risk of bias – observational studieslimitation explanation
Failure to develop and apply appropriate eligibility criteria (inclusion of control population)
under- or over-matching in case-control studies selection of exposed and unexposed in cohort
studies from different populations
Flawed measurement of both exposure and outcome
differences in measurement of exposure (e.g. recall bias in case- control studies)
differential surveillance for outcome in exposed and unexposed in cohort studies
Failure to adequately control confounding
failure of accurate measurement of all known prognostic factors
failure to match for prognostic factors and/or adjustment in statistical analysis
Incomplete or inadequately short follow-up

Inconsistency• When heterogeneity exists, but no plausible explanation is
identified, the quality of evidence should be downgraded by one or two levels, depending on the magnitude of the inconsistency in the results.
• Inconsistency may arise from differences in:
– populations (e.g. drugs may have larger relative effects in sicker populations)
– interventions (e.g. larger effects with higher drug doses)
– outcomes (e.g. diminishing treatment effect with time).
• Account for this where possible

IndirectnessIndirect Question of interest Source of indirectness
Comparison
Relative effectiveness of alendronate and risedronate in osteoporosis.
Randomized trials compared alendronate to placebo and risedronate to placebo, but trials comparing alendronate to risedronate are unavailable.
Population Oseltamivir for prophylaxis of avian flu caused by influenza A (H5N1) virus.
Randomized trials of oseltamivir are available for patients with seasonal influenza, but not for avian influenza.
Intervention Sigmoidoscopic screening for prevention of colon cancer mortality.
Randomized trials of fecal occult blood screening provide indirect evidence bearing on the potential effectiveness of sigmoidoscopy.
Comparator Choice of medication for schizophrenia.
A series of trials comparing newer generation neuroleptic agents to fixed doses of 20 mg of haloperidol provide indirect evidence of how the newer agents would compare to the lower, flexible doses of haloperidol clinicians typically use.

IndirectnessCondition Patient-important outcome(s) Surrogate outcome(s)
Diabetes Diabetic symptoms, admission, complications (cardiovascular, eye, renal, neuropathic etc.)
Glucose, HbA1C
Dementia Patient function, behaviour, caregiver burden
Cognitive function
Osteoporosis Fractures Bone density
ARDS Mortality Oxygenation
End-stage renal disease
Quality of life, mortality Hemoglobin
Venous thrombosis Symptomatic venous thrombosis Asymptomatic venous thrombosis
Chronic respiratory disease
Quality of life, exacerbations, mortality
Pulmonary function, exercise capacity
Cardiovascular disease/risk
Vascular events, mortality Serum lipids
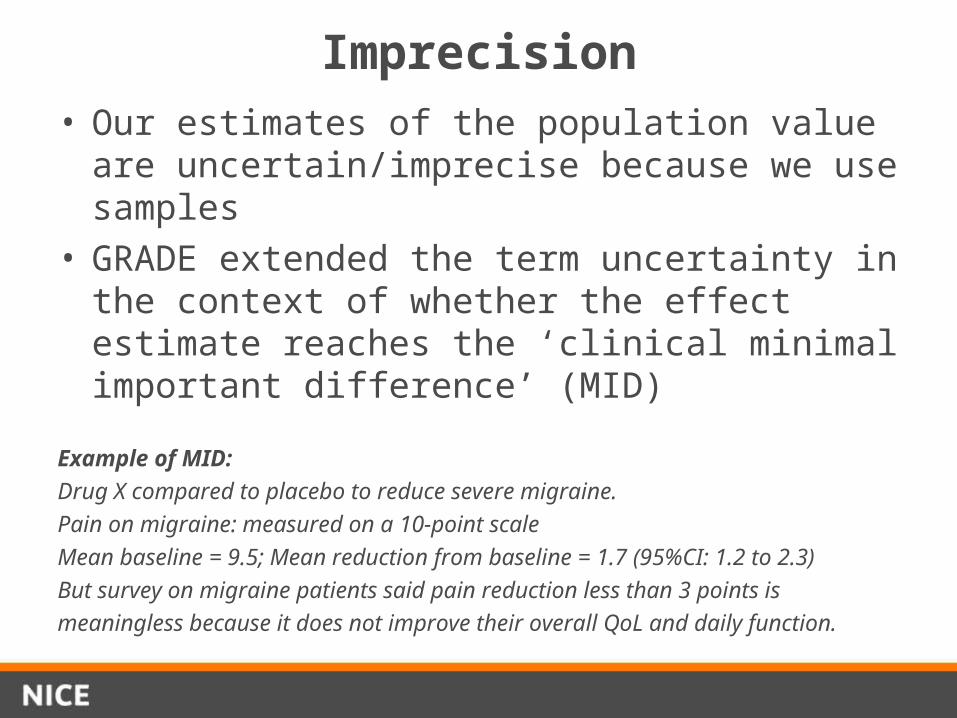
Imprecision• Our estimates of the population value are
uncertain/imprecise because we use samples• GRADE extended the term uncertainty in the
context of whether the effect estimate reaches the ‘clinical minimal important difference’ (MID)
Example of MID:
Drug X compared to placebo to reduce severe migraine.
Pain on migraine: measured on a 10-point scale
Mean baseline = 9.5; Mean reduction from baseline = 1.7 (95%CI: 1.2 to 2.3)
But survey on migraine patients said pain reduction less than 3 points is
meaningless because it does not improve their overall QoL and daily function.

Confidence intervals - summary
• Easiest way to approach effect of random error on evidence quality
• In frequentist approach, 95% CI represents– A range constructed so that in repeated
experiments 95% would include the population value
– Usually interpreted as p=0.95 that the population value is in the CI

Confidence interval width• Wide confidence intervals imply uncertainty over whether
our observed effect is close to or far away from the real effect
• Examples– An RCT of supervised exercise for patellofemoral pain– Self reported recovery at 12 months– T: 9/500 vs SC: 2/500 RR=4.50 (1.00 to 20.77)– We’d probably agree that’s imprecise
– An RCT of drug A for patellofemoral pain– Self reported recovery at 12 months– T: 350/500 vs PC: 150/500 RR=2.33 (2.20 to 2.72)– We’d probably agree that’s precise

What affects imprecision?
• Having larger samples, but particularly where there is more ‘information’– Complex relationship between sample size,
numbers of events
• Easiest to play with an exampleControl event rate
Treatment event rate
RR, % RRR, % Calculated 95%CI
2/4 10/20 20/40 50/100 500/1000
1/4 5/20 10/40 25/100 250/1000
50 50 50 50 50
50 50 50 50 50
-174 to 92 -14 to 79.5 9.5 to 73.4
26.8 to 66.4 43.5 to 55.9

Remember CIs can mislead
• True values will be outside a 95%CI 5/100 times• CI based on small numbers of events are
unstable• Early trials tend to be more positive• Trials stopped early likely to be biased• So, if you have small trials with a positive effect
and apparently narrow CI, be sceptical• It would be helpful to have an objective idea of
when we have ‘enough’ information

Control group event rate
Tot
al s
ampl
e si
ze r
equi
red
0.2 0.4 0.6 0.8 1.0
010
0020
0030
0040
0050
0060
00
RRR=30%
RRR=25%
RRR=20%
Figure 4: Optimal information size given alpha of 0.05 and beta of 0.2
for varying control event rates and RRR of 20%, 25% and 30%
For any chosen line, evidence meets
optimal information size criterion if
above the line
Optimal information size (OIS)• We want at least as many observations in a trial as we
would calculate in a sample size calculation
Warning – ‘Power-based’ sample size calculation is for ‘hypothesis
testing’ using p-value, not for estimation of true effect

Control group event rate
Tota
l nu
mb
er
of
eve
nts
re
qu
ire
d
0.0 0.2 0.4 0.6 0.8 1.0
02
00
40
06
00
RRR=30%
RRR=25%
RRR=20%
300 events
Figure 5: Optimal information size presented as number of eventsgiven alpha of 0.05 and beta of 0.2
for varying control event rates and RRR of 20%, 25% and 30%
For any chosen line, evidence meetsoptimal information size criterion if above the line
OIS continued• Thinking of numbers of events may be easier, and could just
use arbitrarynumber if don’t have resources to calculate OIS

Summary of suggested approach to imprecision
Red: mean -1 as MID
1 = ‘no effect’ and precise; 2 = ‘no effect’ but not precise; 3 = ‘effective’ and precise
Green: mean -2 as MID
1 = ‘no effect’ and precise; 2 = ‘no effect’ and precise; 3 = ‘effective’ and precise
Blue: mean -3 as MID
1 = ‘no effect’ and precise; 2 = ‘no effect’ and precise; 3 = ‘effective’ and not precise
-4 -3 -2 -1 0 +1 +2 +3 +4
Mean pain reduction
Mean pain increase
1
2
3
What if we don’t know a threshold?
• Can use an arbitrary threshold– For example, GRADE suggests RRR or RRI
of 25%– Often used in NICE guidelines

Two things to remember about GRADE
• Many judgements are made in appraising evidence, and there will always be disagreement. The important thing is to make the areas of disagreement transparent.
• The concepts we are judging e.g. imprecision are continuous, and dichotomising it (downgrade or not) can be a close call. Where it is, the evidence to recommendations section should discuss it

PDE-5 inhibitor vs. placeboQuality assessment Number of patients
No of studies Design
Ris
k o
f b
ias
Inc
on
sis
ten
cy
Ind
ire
ctn
es
s
Imp
rec
isio
n
Oth
er
co
ns
ide
rati
on
s Intervention Placebo Effect/ outcome Quality Importance
Erectile Function-International Index of Erectile Function [IIEF] mean score on EF domain (better efficacy is indicated by higher values)
9 (Goldstein 2003, Ishii 2006, Zieglar 2006, Boulton 2001, Rendell 1999, Safarinejad 2004, Stuckey 2003, Hatzichristou 2008, Saenz 2002)
RCTs S5 N* S
1,2 S3 none 1855 1006 Pooled MD 5.82 higher at endpoint (95% CI 4.75 to 6.89).
Very low
Critical
Adverse events (headache)
8 (Boulton 2001, Goldstein 2003, Ishii 2006, Rendell 1999, Saenz 2002, Safarinejad 2004, Stuckey 2003, Ziegler 2006)
RCTs S5 S4 S
2 N none 160/1763
(9.1%) 41/948 (4.3%)
Pooled RR 2.70 (1.16 to 6.28)
Very low
Important
(Discontinuation for AE)
8 (Goldstein 2003, Hatzichristou 2008, Ishii 2006, Rendell 1999, Saenz 2002, Safarinejad 2004, Stuckey 2003, Ziegler 2006)
RCTs S5 N S1,2 N none 42/1753
(2.4%) 14/1037 (1.4%)
Pooled RR 1.59 (0.84 to 3.02)
Very low
Important
Abbreviations: 95%CI, 95% confidence interval; IIEF, International Index of Erectile Function questionnaire; EF, Erectile function domain of IIEF; SEP, Sexual Encounter Profile (diary questions regarding sexual encounter); GEQ, Global Efficacy Question; QoL Quality of Life; RR, risk ratio 1 Downgrade by 1 level: 1 study (Hatzichristou 2008) used low doses (2.5mg and 5mg) of tadalafil, which are licensed for use but are recommended in people who anticipate frequent use of the drug. 10mg is generally recommended (but not for continuous daily use). The other study examining Tadalafil (Saenz 2002) used 10mg and 20mg, therefore these arms combined represent a wide range of different doses. 2 Downgrade by 1 level: 2 studies (Stuckey 2003, Zieglar 2006) were conducted solely in men with type 1 diabetes and the mean age in these studies were generally lower in comparison to the other included studies. One study (Ishii 2006) did not report the proportion of men with type 2 diabetes. 3 Downgrade by 1 level: SDs were not reported in the paper and were calculated using p-values 4 Downgrade by 1 level: pairwise comparisons of the included studies (direct comparisons) showed an I² of 75% (p=0.0002) for headaches, 68% (p=0.009) for upper respiratory tract infection and 58% (p<0.00001) for any adverse event. These values indicate substantial heterogeneity which cannot be fully accounted for 5 Downgrade by 1 level: 2 studies (Saenz 2002, Ishii 2006) do not report allocation concealment to determine if performance bias was present * pairwise comparisons of the included studies (direct comparisons) showed an I² of 46%. Although this may indicate moderate heterogeneity, this inconsistency was not considered to be important as overall the effect estimates and the confidence intervals were favouring the PDE-5 group

PICO
OutcomeOutcomeOutcomeOutcome
Formulate
question
Rate
importa
nce
Critical
Important
Critical
Not important
Create
evidence
profile with
GRADEpro
Summary of findings & estimate of effect for each outcome
Present evidence profile(s) to GDG
RCT start high, obs. data start
low1. Risk of bias2. Inconsisten
cy3. Indirectnes
s4. Imprecision5. Other
consideration
Gra
de d
own
Gra
de u
p 1. Large effect
2. Dose response
3. Confounders
Rate quality
of evidence
for each
outcomeSelect
outcomes
Very low
LowModerate
High
Develop recommendations:•For or against (direction)•Strong or weak (strength)
By considering:Relative value of different
outcomesQuality of evidenceTrade off - benefits/harmsHealth economicsOther considerations
• “Offer xyz…”• “Consider xyz…”• “Do not use xyz…”
Outcomes
across
studies

Evidence to recommendations
• Structured discussion of– Relative value placed on outcomes– Trade off between clinical benefits and harms– Trade off between net health benefits and resource use– Quality of the evidence– Other considerations
• Place within pathway of care• Equalities issues• Practicalities of implementation e.g. need for training

Strength of recommendation
• Stronger: ‘the GDG is confident that the desirable effects of adherence to a recommendation outweigh the undesirable effects’
‘Should do ...’
• Weaker: the GDG concludes that the desirable effects of adherence to a recommendation probably outweigh the undesirable effects, but is not confident’
‘Should consider ...’

Further information
• http://www.gradeworkinggroup.org/
• Ongoing series of papers in Journal of Clinical Epidemiology addressing all of these issues