grades 7-8 mean, median, and mode
TRANSCRIPT

Pace UniversityDigitalCommons@Pace
Math Middle School
8-1-2009
Grades 7-8 Mean, Median, and ModeRich Miller IIIPace University
Follow this and additional works at: http://digitalcommons.pace.edu/middle_mathPart of the Analysis Commons
This Lesson Plan is brought to you for free and open access by the Middle School at DigitalCommons@Pace. It has been accepted for inclusion in Mathby an authorized administrator of DigitalCommons@Pace. For more information, please contact [email protected].
Recommended CitationMiller III, Rich, "Grades 7-8 Mean, Median, and Mode" (2009). Math. Paper 1.http://digitalcommons.pace.edu/middle_math/1

Differentiated Lesson Plan: Mean, Median, and Mode
by
Rich Miller III
Subject: Central Tendency/Statistics (Mean, Median, and Mode)
Grade: 7th
Standards: 7.S.1, 7.S.3, 7.S.4, 7.S.6, 7.S.7
Hook:
1. Playing Jeopardy in groups, boys versus girls. A fun way to get them going. Definitely not something that would we would do very often in order to keep it unique and more of a special activity.
2. Bringing in a guest speaker, a mathematician or someone from the real world who works with statistics (i.e. the business world). I never remember having a guest speaker in math class, and hearing another voice when they have to hear yours 180 days a year is refreshing. Speaker will be directly related with the topic at hand.
Essential Questions:
• What are the measures of central tendency? • What are their definitions? • How do you calculate them (steps involved)? • How do they relate to real life? • How can they be used in or with real life numbers?
Pre-Assessment: Worksheet included, Journal entries from the students
Implementation:
Task 1: Choose any three activities below. Make sure that you get three in a row, column, or diagonal to
successfully complete this task! (Hint: measures are defined as either mean, median, and/ or mode)
Choose one of the measures and write a poem which would help to explain them to a non-math person.
Choose one of the measures and make a drawing or cartoon identifying the measure you chose to a non-math person.
Choose one of the measures and depict it using a slogan.
Choose 2 measures and create a story (written or verbal) with any differences and similarities.
Choose 2 measures and create a poster about them.
Choose 2 measures and create a rap or song.
Using all 3 measures, Using all 3 measures, go Using all 3 measures, have

debate which is the best for measuring central tendency within your group.
online and use the Smart Board to present the class w/ real life stats and their measures of central tendency.
create an interview in which one person plays the role of interviewer, and the other is a measure of central tendency.
Task 1 Anchor Activity: Create challenge questions of varying degrees of toughness. They must be associated with the concepts of mean, median, or mode. They will be used for class review before the unit exam. Review will consist of typical review and the possibility of a few rounds of Math Millionaire.
Task 2: Choose the interest that best fits you: sports, music, or cars! Then complete the task(s) that follow in
pairs. Assignment will be started in class and completed at home if need be. Presentations will begin the next
day. Reflections will be due the day following the last presentation.
Sports:
• Teacher will provide a list of the top players in baseball over the last few years. • Students will choose two baseball players of their choice. • Students will access their statistics from the past 6 years (via the internet:
http://sports.yahoo.com/mlb/stats or reference books provided by the teacher depending on number of available computers/availability of computer lab), more specifically homeruns, hits, RBI’s, and batting average.
• Students will make charts of each player, year, and stats. • Students will graph results on the same graph for each stat, using different colors to differentiate
between the two players. • Students will calculate measures of central tendency. • Students will calculate the range for each player’s stats for that period of time. • Students will gather all their information and present to class their findings briefly. • Students will briefly present their findings to the entire class. • They will discuss:
o The players they chose, the references used. o The statistics. o The charts and the graphs. o Their calculations of central tendency and range. o Their conclusions (i.e. forecast of future)
• Students will also comment on any reasons for discrepancies in the numbers. • Students are required to present and encouraged to do a multimedia presentation.
o In the case of the sports interest group, the student will assume the role of a sportscaster to deliver his stats, results, conclusions, etc. to the class.
o They may use also the Smart board, PowerPoint, handouts, or any way they feel comfortable presenting.
• Students will begin this in class and have time to work on it today, finish at home if necessary, and be presenting it tomorrow.
• A brief 1-2 paragraph reflection on another student’s presentation and what you learned, due day after presentations are complete.
Music:
• Teacher will provide a list of the top songs over the last few years. • Students will choose at least 2 songs of their choice.
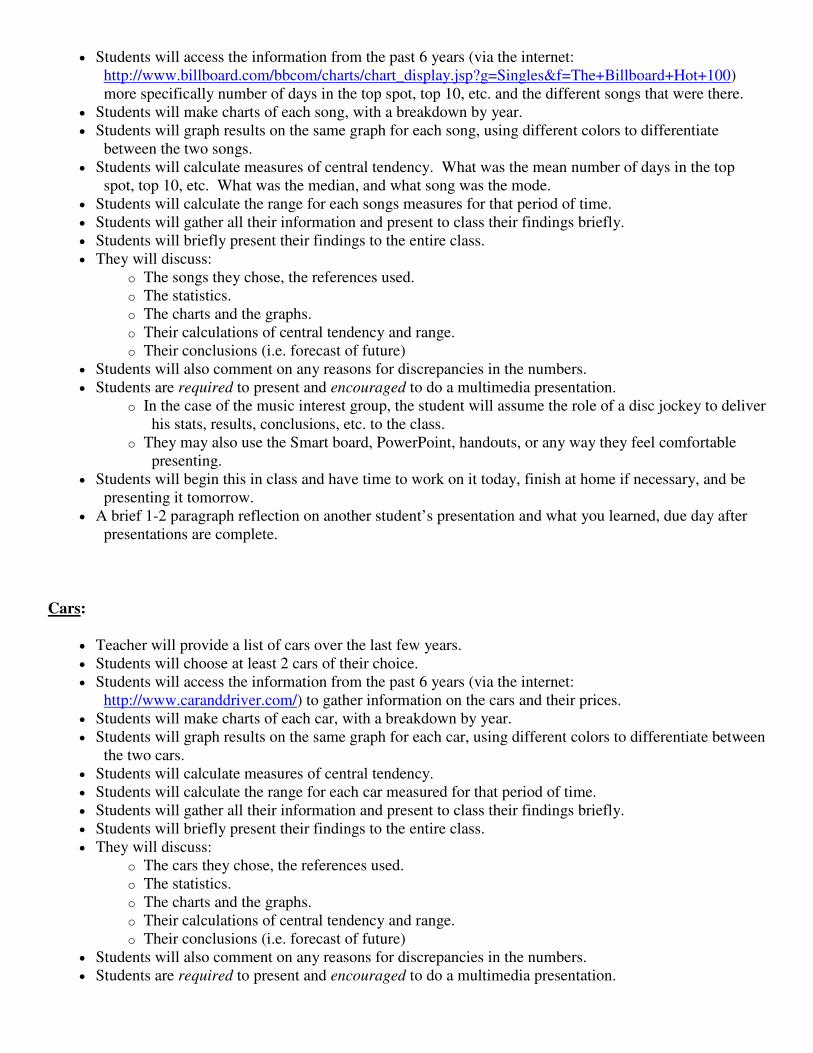
• Students will access the information from the past 6 years (via the internet: http://www.billboard.com/bbcom/charts/chart_display.jsp?g=Singles&f=The+Billboard+Hot+100) more specifically number of days in the top spot, top 10, etc. and the different songs that were there.
• Students will make charts of each song, with a breakdown by year. • Students will graph results on the same graph for each song, using different colors to differentiate
between the two songs. • Students will calculate measures of central tendency. What was the mean number of days in the top
spot, top 10, etc. What was the median, and what song was the mode. • Students will calculate the range for each songs measures for that period of time. • Students will gather all their information and present to class their findings briefly. • Students will briefly present their findings to the entire class. • They will discuss:
o The songs they chose, the references used. o The statistics. o The charts and the graphs. o Their calculations of central tendency and range. o Their conclusions (i.e. forecast of future)
• Students will also comment on any reasons for discrepancies in the numbers. • Students are required to present and encouraged to do a multimedia presentation.
o In the case of the music interest group, the student will assume the role of a disc jockey to deliver his stats, results, conclusions, etc. to the class.
o They may also use the Smart board, PowerPoint, handouts, or any way they feel comfortable presenting.
• Students will begin this in class and have time to work on it today, finish at home if necessary, and be presenting it tomorrow.
• A brief 1-2 paragraph reflection on another student’s presentation and what you learned, due day after presentations are complete.
Cars:
• Teacher will provide a list of cars over the last few years. • Students will choose at least 2 cars of their choice. • Students will access the information from the past 6 years (via the internet:
http://www.caranddriver.com/) to gather information on the cars and their prices. • Students will make charts of each car, with a breakdown by year. • Students will graph results on the same graph for each car, using different colors to differentiate between
the two cars. • Students will calculate measures of central tendency. • Students will calculate the range for each car measured for that period of time. • Students will gather all their information and present to class their findings briefly. • Students will briefly present their findings to the entire class. • They will discuss:
o The cars they chose, the references used. o The statistics. o The charts and the graphs. o Their calculations of central tendency and range. o Their conclusions (i.e. forecast of future)
• Students will also comment on any reasons for discrepancies in the numbers. • Students are required to present and encouraged to do a multimedia presentation.

o In the case of the car interest group, the student will assume the role of a car salesman to deliver his stats, results, conclusions, etc. to the class.
o They may also use the Smart board, PowerPoint, handouts, or any way they feel comfortable presenting.
• Students will begin this in class and have time to work on it today, finish at home if necessary, and be presenting it tomorrow.
• A brief 1-2 paragraph reflection on another student’s presentation and what you learned, due day after presentations are complete.
Task 2 Anchor Activity: Think of another interest (i.e. another sport) you may be interested in. Perform some of the same calculations and looks for trends in the numbers across different sports (i.e. players in their prime, players in contract years, etc.)
Task 3: In pairs using bags of M & M’s, calculate the measures of central tendency.
1. Calculate the mean number of M & M’s in each bag (total). 2. Calculate the mean number of each color of M & M’s in each bag. 3. Calculate the median number of M & M’s based on color totals. 4. Calculate the mode for the M & M’s based on color. 5. Calculate the range of M & M’s.
Green Groups: Students are obligated to use regular, peanut, and crispy M & M’s.
Red Groups: Students are obligated to use regular and peanut M & M’s.
Blue Groups: Students are obligated to use regular M & M’s.
After making calculations, work with other members of your color to combine your answers and get final number for each. Each group will then have a final set of numbers which will be presented to the class as a whole. The teacher will then tally the total numbers together on the Smart Board to see the differences.
Task 3 Anchor Activity: Research M&M’s online on the website: http://www.m-ms.com/us/
See if you can find any information on how they are packaged and if there truly is a set way that the company determines how man y go in each bag, how many of each color, etc. Comment in your journals.
Other Anchor Activities:
� Read up on the history of mean, median and mode online or via a reference book in the classroom library.
� Use exploringleanrning.com and use its gizmos. � Do more journal writing. � Help out another group that may be struggling.
Conclusion: Student journal reflection for benefit of both the student and the teacher to gain valuable feedback
on these activities and the overall progress and readiness for the upcoming exam on these topics.

Warm-Up
Complete the following worksheet.
1. What is the mean of the following data set? {105, 223, 458, 1,016, 557)
2. What is the mode of the following set of test scores achieved by Steve? {98, 97, 85, 84, 98, 97, 97}
3. What is the median of the following set of points scored in a game by Brian? {12, 5, 31, 17, 14}
4. What is the range of the following set of SAT scores for Cindy? {1250, 900, 1600, 1850, 1375}
5. Jackie has six brothers. There are two sets of twins. Their ages are: 21, 15, 15 7, 7, and 2. Calculate the mean, median, and mode of their ages. Is there anything special about the mode? What?
6. What is the most common measure of central tendency? {hint, we talked about this yesterday}
a. Mean b. Median c. Mode d. Range

Task 1
Task 1: Choose any three activities below. Make sure that you get three in a row, column, or diagonal to
successfully complete this task! It’s just like playing tic-tac-toe! (Hint: measures are defined as either mean,
median, and/ or mode)
Choose one of the measures and write a poem which would help to explain them to a non-math person.
Choose one of the measures and make a drawing or cartoon identifying the measure you chose to a non-math person.
Choose one of the measures and depict it using a slogan.
Choose 2 measures and create a story (written or verbal) with any differences and similarities.
Choose 2 measures and create a poster about them.
Choose 2 measures and create a rap or song.
Using all 3 measures, debate which is the best for measuring central tendency within your group.
Using all 3 measures, go online and use the Smart Board to present the class w/ real life stats and their measures of central tendency.
Using all 3 measures, have create an interview in which one person plays the role of interviewer, and the other is a measure of central tendency.
Don’t be afraid to be creative!!

Task 2
1. Using the handouts or the internet, pick two baseball players and locate their stats over the past 3 years. Use the chart below to organize your data.
2005 2006 2007
Homeruns
Hits
RBI
AVG
2. Then graph your results, having a separate graph for each statistic (i.e. both players homerun totals on the same graph, using different colors to tell them apart)
3. Calculate the following measures of central tendency for the statistics that you find over the past 3 years for each of the two players:
1. Mean for each statistic
2. Mode for each statistic

3. Median for each statistic
4. Range for each statistic
4) Comment on any discrepancies in the numbers.
5) Prepare a brief presentation for tomorrow in the role of a sportscaster. You are encouraged to use multimedia equipment, but it is not required.
Task 2
4. Using the handouts or the internet, pick at least two cars and locate prices for at least 3 different years. Use the chart below to organize your data.
Cars
2005 2006 2007
Car 1
Car 2
Car 3

5. Then graph your results, having a separate graph for each statistic (using different colors to tell them apart)
6. Calculate the following measures of central tendency for the statistics that you find over the past 3 years for each of the cars:
5. Mean for each statistic
6. Mode for each statistic 7. Median for each statistic
8. Range for each statistic
4) Comment on any discrepancies in the numbers.
5) Prepare a brief presentation for tomorrow in the role of a car salesman. You are encouraged to use multimedia equipment, but it is not required.
Task 2
7. Using the handouts or the internet, pick at least two popular songs and locate their stats over the past 3 years. Use the chart below to organize your data.

Song “X”
2005 2006 2007
Top Song
Top 5
Top 10
Top 100
8. Then graph your results, having a separate graph for each statistic (using different colors to tell them apart)
9. Calculate the following measures of central tendency for the statistics that you find over the past 3 years for each of the songs:
9. Mean for each statistic
10. Mode for each statistic 11. Median for each statistic
12. Range for each statistic
4) Comment on any discrepancies in the numbers.
5) Prepare a brief presentation for tomorrow in the role of a disc jockey. You are encouraged to use multimedia equipment, but it is not required.
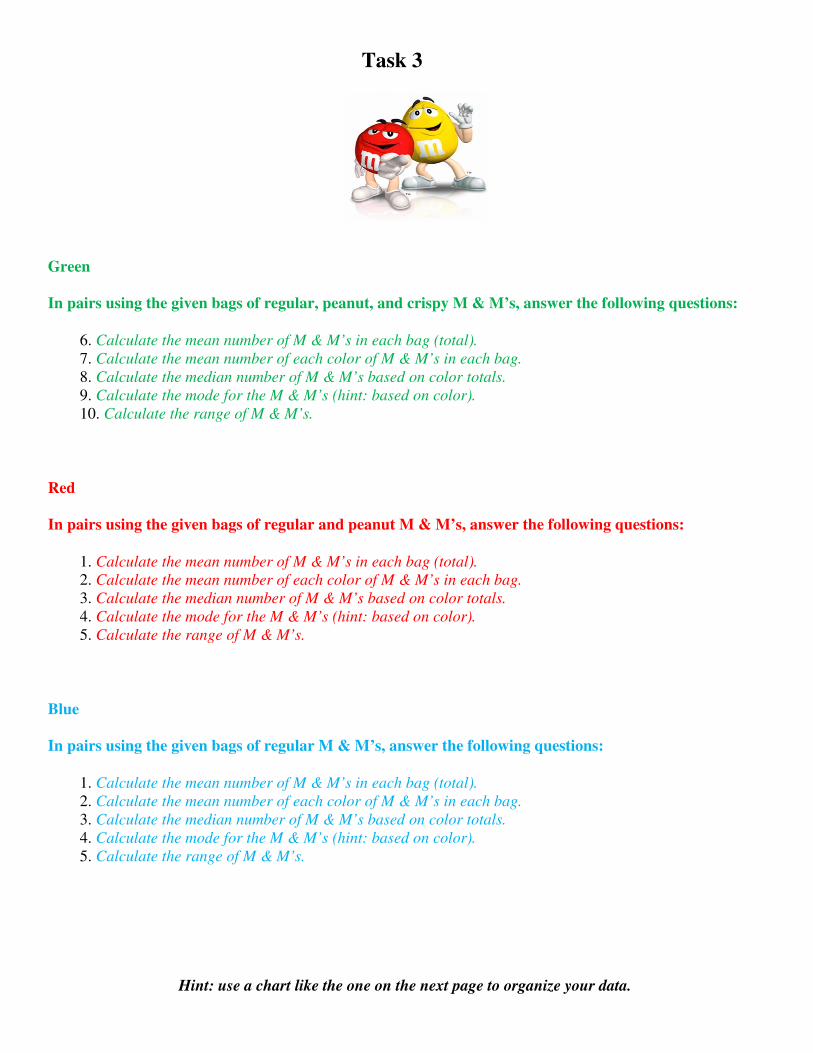
Task 3
Green
In pairs using the given bags of regular, peanut, and crispy M & M’s, answer the following questions:
6. Calculate the mean number of M & M’s in each bag (total). 7. Calculate the mean number of each color of M & M’s in each bag. 8. Calculate the median number of M & M’s based on color totals. 9. Calculate the mode for the M & M’s (hint: based on color). 10. Calculate the range of M & M’s.
Red
In pairs using the given bags of regular and peanut M & M’s, answer the following questions:
1. Calculate the mean number of M & M’s in each bag (total). 2. Calculate the mean number of each color of M & M’s in each bag. 3. Calculate the median number of M & M’s based on color totals. 4. Calculate the mode for the M & M’s (hint: based on color). 5. Calculate the range of M & M’s.
Blue
In pairs using the given bags of regular M & M’s, answer the following questions:
1. Calculate the mean number of M & M’s in each bag (total). 2. Calculate the mean number of each color of M & M’s in each bag. 3. Calculate the median number of M & M’s based on color totals. 4. Calculate the mode for the M & M’s (hint: based on color). 5. Calculate the range of M & M’s.
Hint: use a chart like the one on the next page to organize your data.

Color Regular Peanut Crispy
Green
Red
Blue
Orange
Yellow
Brown
Tally
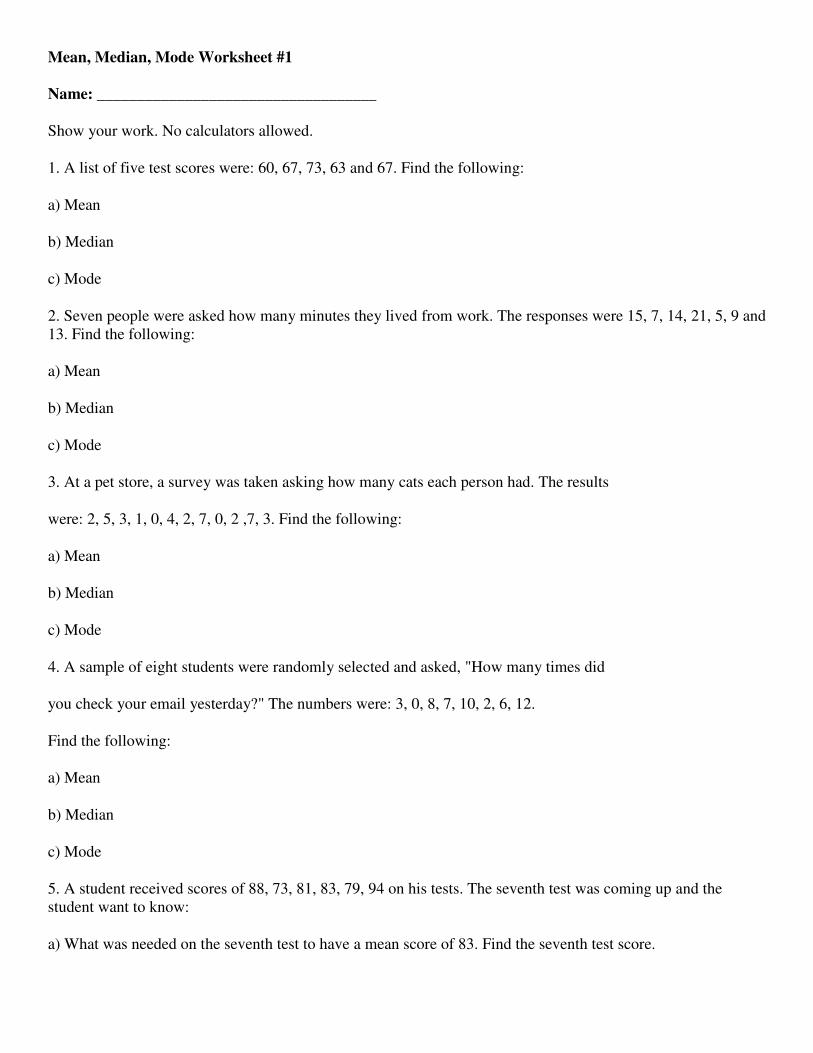
Mean, Median, Mode Worksheet #1
Name: ___________________________________
Show your work. No calculators allowed.
1. A list of five test scores were: 60, 67, 73, 63 and 67. Find the following:
a) Mean
b) Median
c) Mode
2. Seven people were asked how many minutes they lived from work. The responses were 15, 7, 14, 21, 5, 9 and 13. Find the following:
a) Mean
b) Median
c) Mode
3. At a pet store, a survey was taken asking how many cats each person had. The results
were: 2, 5, 3, 1, 0, 4, 2, 7, 0, 2 ,7, 3. Find the following:
a) Mean
b) Median
c) Mode
4. A sample of eight students were randomly selected and asked, "How many times did
you check your email yesterday?" The numbers were: 3, 0, 8, 7, 10, 2, 6, 12.
Find the following:
a) Mean
b) Median
c) Mode
5. A student received scores of 88, 73, 81, 83, 79, 94 on his tests. The seventh test was coming up and the student want to know:
a) What was needed on the seventh test to have a mean score of 83. Find the seventh test score.

b) What the median and mode would be using the seventh test score from part a.

Mean, Median, Mode Worksheet #2
Name: ___________________________________
Find the mean, median, mode, and range.
1. 233, 430, 508, 127
2. 31, 55, 88, 9, 30, 73, 12, 67, 88, 74
3. 35.9, 21.5, 20, 83.7, 66.9, 35.9, 20
4. 73.2, 42.61, 48.4, 32.8, 218
5. 27.89, 27.39, 12.73, 49.80, 27.89, 311.91, 37.01, 311.91
6. 0.4, 0.03, 0.2, 0.043, 0.015, 0.045, 0.081, 0.076, 0.015
7. A hockey team recorded attendance for its 7 home games.
22,329 81,875 60,312 101,698 22,243 67,415 55,702
Would you use mean, median, mode, or range for each situation? Explain.
1. Kevin noticed that half of the cereal brands in the store cost more than $3.33.
2. The average score on the last Pre-Algebra test was 85.
3. The most common height on the basketball team is 6 ft 11 in.
4. The heights of players on the basketball team vary by 6 inches.
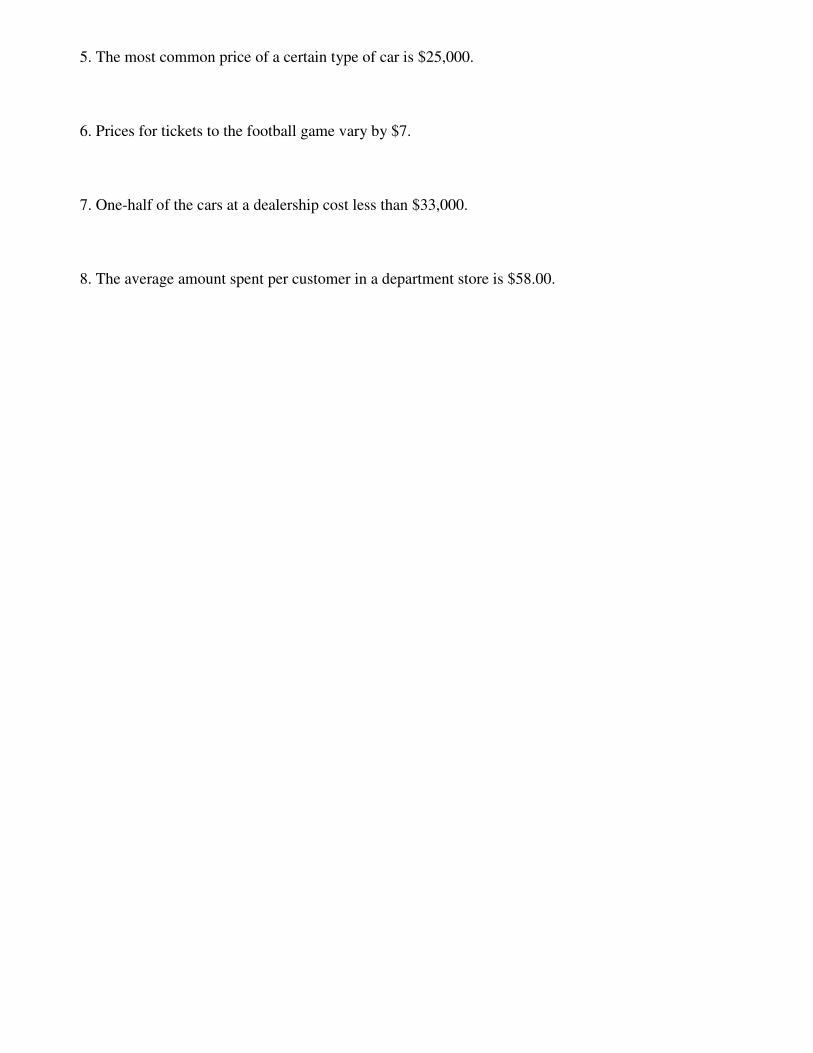
5. The most common price of a certain type of car is $25,000.
6. Prices for tickets to the football game vary by $7.
7. One-half of the cars at a dealership cost less than $33,000.
8. The average amount spent per customer in a department store is $58.00.

Mean, Median, Mode Worksheet #3
Name: ___________________________________
Directions: Determine the mean, median, and mode for each data set.
1) 18, 18, 15, 18, 18, 24, 21, 21, 24, 14
mean =
median =
mode =
2) 94, 69, 84, 69, 90, 75, 94, 90, 90, 9, 5
mean =
median =
mode =
3) 4, 18, 18, 23, 23, 19, 8, 8, 8, 8, 28
mean =
median =
mode =
4) 12, 15, 16, 17, 15, 17, 17, 17, 18,
mean =
median =
mode =

17
5) 16, 3, 3, 3, 8, 24, 16, 9, 11, 11
mean =
median =
mode =
6) 22, 5, 22, 13, 12, 24, 24, 9, 24, 19
mean =
median =
mode =
7) 23, 1, 1, 18, 1, 3, 18, 10, 7, 3
mean =
median =
mode =
8) 23, 10, 2, 6, 10, 14, 1, 19, 8, 19
mean =
median =
mode =
9) 8, 21,
mean =
median =
13, 8, 18, 15, 8, 8, 11, 15
mode =
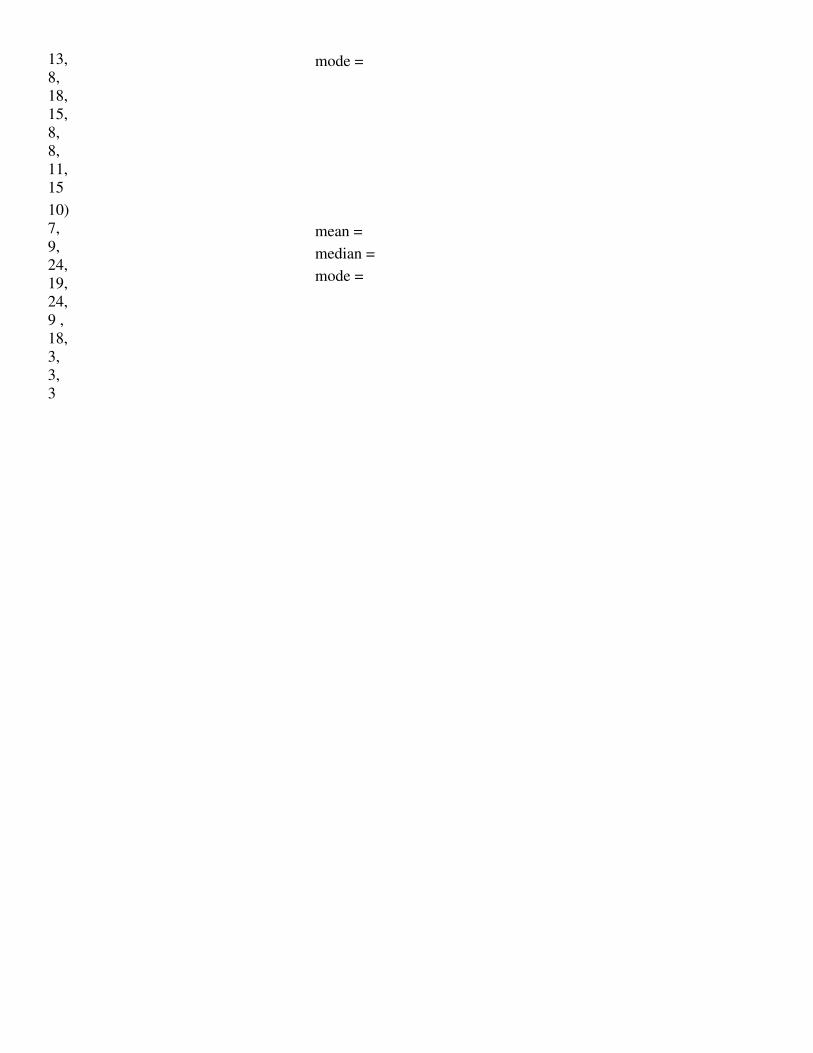
10) 7, 9, 24, 19, 24, 9 , 18, 3, 3, 3
mean =
median =
mode =

Task 1: Mean, Median, and Mode
Student Name: ________________________________________
CATEGORY 4 3 2 1
Mathematical
Concepts
Explanation
shows complete
understanding
of the
mathematical
concepts used
to solve the
problem(s).
Explanation
shows
substantial
understanding
of the
mathematical
concepts used
to solve the
problem(s).
Explanation
shows some
understanding
of the
mathematical
concepts
needed to solve
the problem(s).
Explanation
shows very
limited
understanding
of the
underlying
concepts
needed to solve
the problem(s)
OR is not
written.
Explanation Explanation is
detailed and
clear.
Explanation is
clear.
Explanation is a
little difficult to
understand, but
includes critical
components.
Explanation is
difficult to
understand and
is missing
several
components OR
was not
included.
Working with
Others
Student was an
engaged
partner,
listening to
suggestions of
others and
working
cooperatively
throughout
lesson.
Student was an
engaged
partner but had
trouble listening
to others and/or
working
cooperatively.
Student
cooperated
with others, but
needed
prompting to
stay on-task.
Student did not
work effectively
with others.
Completion All measures
are used.
All but 1 of the
measures are
used.
All but 2 of the
measures are
used.
None of the
measures are
used.
Creativity Showed a high
level of
creativity.
Showed some
level of
creativity.
Showed a
limited level of
creativity.
Showed no
level of
creativity.

Task 2: Sports, Music, and Cars
Student Name: ________________________________________
CATEGORY 4 3 2 1
Mathematical
Concepts
Explanation
shows complete
understanding
of the
mathematical
concepts used
to solve the
problem(s).
Explanation
shows
substantial
understanding
of the
mathematical
concepts used
to solve the
problem(s).
Explanation
shows some
understanding
of the
mathematical
concepts
needed to solve
the problem(s).
Explanation
shows very
limited
understanding
of the
underlying
concepts
needed to solve
the problem(s)
OR is not written.
Mathematical
Errors
90-100% of the
steps and
solutions have
no
mathematical
errors.
Almost all (85-
89%) of the
steps and
solutions have
no
mathematical
errors.
Most (75-84%) of
the steps and
solutions have
no
mathematical
errors.
More than 75%
of the steps and
solutions have
mathematical
errors.
Diagrams and
Sketches
Diagrams
and/or sketches
are clear and
greatly add to
the reader's
understanding
of the
procedure(s).
Diagrams
and/or sketches
are clear and
easy to
understand.
Diagrams
and/or sketches
are somewhat
difficult to
understand.
Diagrams
and/or sketches
are difficult to
understand or
are not used.
Neatness and
Organization
The work is
presented in a
neat, clear,
organized
fashion that is
easy to read.
The work is
presented in a
neat and
organized
fashion that is
usually easy to
read.
The work is
presented in an
organized
fashion but may
be hard to read
at times.
The work
appears sloppy
and
unorganized. It is
hard to know
what
information
goes together.
Working with
Others
Student was an
engaged
partner,
listening to
suggestions of
others and
working
Student was an
engaged
partner but had
trouble listening
to others and/or
working
cooperatively.
Student
cooperated
with others, but
needed
prompting to
stay on-task.
Student did not
work effectively
with others.

cooperatively
throughout
lesson.
Presentation The
presentation is
delivered
entirely in said
role with no
missing
components.
The
presentation is
delivered
somewhat in
said role with 1-
2 components
missing.
The
presentation is
delivered in a
limited said role
with 3-4
components
missing.
The presentation
is not delivered
in said role with
more than 4
components
missing.
Task 3 : M&M's
Student Name: ________________________________________
CATEGORY 4 3 2 1
Mathematical
Errors
90-100% of the
steps and
solutions have
no
mathematical
errors.
Almost all (85-
89%) of the
steps and
solutions have
no
mathematical
errors.
Most (75-84%) of
the steps and
solutions have
no
mathematical
errors.
More than 75%
of the steps and
solutions have
mathematical
errors.
Mathematical
Terminology
and Notation
Correct
terminology
and notation
are always
used, making it
easy to
understand
what was done.
Correct
terminology
and notation
are usually
used, making it
fairly easy to
understand
what was done.
Correct
terminology
and notation
are used, but it
is sometimes not
easy to
understand
what was done.
There is little use,
or a lot of
inappropriate
use, of
terminology
and notation.
Working with
Others
Student was an
engaged
partner,
listening to
suggestions of
others and
working
cooperatively
throughout
lesson.
Student was an
engaged
partner but had
trouble listening
to others and/or
working
cooperatively.
Student
cooperated
with others, but
needed
prompting to
stay on-task.
Student did not
work effectively
with others.

Neatness and
Organization
The work is
presented in a
neat, clear,
organized
fashion that is
easy to read.
The work is
presented in a
neat and
organized
fashion that is
usually easy to
read.
The work is
presented in an
organized
fashion but may
be hard to read
at times.
The work
appears sloppy
and
unorganized. It
is hard to know
what
information
goes together.
Prediction Students used
data and their
educated
guesses were
extremely close
to the actual
amount in next
bag.
Students mostly
used data and
their educated
guesses were
somewhat close
to the actual
amount in next
bag.
Students may
have used data
and their
educated
guesses were
fairly close to
the actual
amount in next
bag.
Students did not
use data and
their educated
guesses were
not close to the
actual amount
in next bag.