graduate admissions statistics - university of cambridge · 2 notes for information: 1. these...
TRANSCRIPT

P a g e | 0
0
Graduate Admissions Office Statistics
For Admissions in 2015/2016

1
Contents
Notes .........................................................................................................................2 Summary ....................................................................................................................3 Admissions statistics by School and Fee Status .........................................................4 Admissions statistics by School and HESA status ......................................................5 Admissions data by Citizenship ..................................................................................6 Admissions data by Part Time Studies .......................................................................8 Admissions data for continuing students ....................................................................9 Admissions data by Gender ..................................................................................... 10 Admissions data by Disability ................................................................................... 11 Admissions data by Ethnicity .................................................................................... 12 Admissions data by College Membership ................................................................. 13 Appendix Applications, Offers and Confirmations by Department or Faculty ............................ 14 Historical admissions data 2010/11 – 2015/16 by fee status .................................... 16
Cover photo: “ Cover photo: “Happy in class?” by Reut C is Licenced under CC BY-NC-ND 2.0

2
Notes for Information:
1. These statistics refer to applications for admission in the academic year 2015/2016, as of the 8 December 2015. The only courses relevant to these Graduate Admissions Office Statistics are the courses listed in the table below. For application data on other University of Cambridge graduate courses please contact the relevant admitting authority:
Institute of Continuing Education (MSt) www.ice.cam.ac.uk/ Judge Business School (MBA, eMBA and MFin) www.jbs.cam.ac.uk/home/ Faculty of Education (PGCE) www.educ.cam.ac.uk/
Statistics on student numbers can be found here: www.admin.cam.ac.uk/offices/planning/sso/studentnumbers/
2. The application cycle for each term ends on the Division of Term:
Admit Term Division of Term date
Michaelmas 2015 9th November 2015
Lent 2016 13th February 2016
Easter 2016 14th May 2016
3. Confirmation figures show those applicants who received confirmation of their place after
satisfying all their conditions set out in the offer stage, and who then subsequently took up their places on the course. Applicants who were confirmed but subsequently did not take up their University place are excluded.1
4. Home/EU/Overseas fee status is defined only at the point of offer as this classification is dependent on a variety of factors that require independent assessment based on the UKCISA guidelines. For the purpose of estimating numbers of applicants within fee status categories who did not receive an offer, the fee status has been assessed based on primary citizenship only. Applicants with islands or refugee fee status have been included for this broad reporting purpose as Overseas.
5. Research and 1 Year programmes are categorised as follows:
6. Research 1 Year Courses
Certificate of Postgraduate Studies (CPGS) Graduate Diplomas
Doctor of Education (EdD) Master in Law (LLM)
Doctor of Engineering Doctorate (EngD) Master of Corporate Law (MCL)
Doctor of Medicine (MD) Master of Advanced Study (MASt)
Masters of Letters (MLitt) Master of Education (Med)
Masters of Research (MRes) Master of Music (MMUS)
Masters of Science (MSC) Master of Philosophy (MPhil)2
PhD Probationary (NOTAF)
Not To Be Registered programme (NTBR)
Doctor of Philosophy (PhD)
1 As of 8
th December 2015 there were 81 applicants confirmed for admission who did not subsequently
arrive at the start of term. 2 A small number of MPhil courses are research MPhils. For the purposes of this report they are
classified as one year courses.

3
Summary
The data has been prepared by Graduate Admissions Office for the Board of Graduate Studies (BGS) and Post-Graduate Admissions Committee (PAC) and are intended to provide a statistical analysis of applications, offers and confirmations2
Table 1.1 Applications, offers and confirmations by School and Fee Status
The total number of applications is 16,456 (16,052)3, a 2.5% increase
The total number of conditional offers is 6,498 (6,490), a 0.1% increase
The total number of confirmation is 3,556 (3,530), an increase of 0.7%
The research/1 year programmes application ratio is 1: 2
For applications by Fee Status4: Overseas: 9,914 (60%) Home: 3,491 (21%) EU: 3,051 (19%)
For offers by Fee Status: Overseas: 3,290 (50%) Home: 1,784 (28%) EU: 1,424 (22%)
For confirmations by Fee Status: Overseas: 1,472 (41%) Home: 1,228 (35%) EU: 856 (24%)
Table 1.2 Applications and Confirmations by HESA classification ‘Research’ and ‘Taught’
Research: 10,019 applications, 44% offers made and 25% were confirmed
Taught: 6,437 applications, 33% offers made and 17% were confirmed. Table 1.3-1.4 Applications and Confirmations by Citizenship
The largest number of applications come from UK citizens, followed by Chinese and American citizens
The top 25 citizenships made up 81% of total confirmations and UK citizens alone made up 21% down from 31% in 2013/14 but the same as 2014/15.
Table 1.5 Applications, offers and confirmations for continuing students
351 applicants applied to continue at the graduate level 72% received conditional offers and 59% were confirmed.
Table 2.1-2.3 Applicants by Gender, Disability and Ethnicity
55% of applications were from males – the same percentage as the previous two academic years.
54% of total confirmations were male.
53% of applicants declared non-white ethnicity.
2 Applications withdrawn within the terms of the 14 day cancellation policy are excluded from these
statistics. 3 Figures in Italics are for Graduate Admission in 2014/2015.
4 See Note 3 on page 2 - Fee Status classification.

P a g e | 4
4
Admissions data in terms of School and Fee Status
Table 1.1 Applications, Offers and Confirmations by School and Fee Status5 for 2015/16 admission
More detailed information on Applications and Confirmations by Departments or Faculties can be found in the Appendix.
5 See Note 3 on page 2 - Fee Status classification.
School Success Rates Success Rates
Research Home EU Overseas Total Home EU Overseas Total Apps to Offers Home EU Overseas Total Offers to Conf
Arts & Humanities 218 124 326 668 123 71 126 320 47.90% 51 34 56 141 44.06%
Biological Science 239 183 275 697 114 86 134 334 47.92% 82 59 43 184 55.09%
Clinical Medicine 160 110 205 475 89 50 47 186 39.16% 77 42 27 146 78.49%
Humanities & Social Sciences 286 275 863 1,424 170 131 333 634 44.52% 87 57 152 296 46.69%
Physical Sciences 383 330 530 1,243 156 128 188 472 37.97% 125 67 77 269 56.99%
Technology 195 190 714 1,099 131 123 265 519 47.22% 104 76 97 277 53.37%
University Partner Institutions 101 109 127 337 38 37 29 104 30.86% 36 32 23 91 87.50%
Sub-Total (Research) 1,582 1,321 3,040 5,943 821 626 1,122 2,569 43.23% 562 367 475 1,404 54.65%
(In percentages) 27% 22% 51% 32% 24% 44% 40% 26% 34%
1 Year Courses
Arts & Humanities 446 198 681 1,325 217 79 213 509 38.42% 132 53 100 285 55.99%
Biological Science 58 64 150 272 16 18 55 89 32.72% 14 16 22 52 58.43%
Clinical Medicine 57 41 275 373 28 16 51 95 25.47% 19 10 28 57 60.00%
Humanities & Social Sciences 1004 834 3487 5,325 551 384 1192 2,127 39.94% 383 213 532 1,128 53.03%
Physical Sciences 157 269 670 1,096 71 160 288 519 47.35% 56 105 125 286 55.11%
Technology 185 324 1603 2,112 79 141 368 588 27.84% 62 92 189 343 58.33%
University Partner Institutions 2 0 8 10 1 0 1 2 20.00% 0 0 1 1 50.00%
Sub-Total (1 Year Course) 1,909 1,730 6,874 10,513 963 798 2,168 3,929 37.37% 666 489 997 2,152 54.77%
(In percentages) 18% 16% 65% 25% 20% 55% 31% 23% 46%
Grand Total 3,491 3,051 9,914 16,456 1,784 1,424 3,290 6,498 1,228 856 1,472 3,556
Applicat ions Offers Conf irmat ions

P a g e | 5
5
Admissions data in terms of School and HESA definition
Table 1.2 Applications, Offers and Confirmations by Research and Taught HESA definition for 2015/16 admission
School
Research Taught Research Taught Research Taught
Arts & Humanities 1,855 138 786 43 395 31
Biological Science 969 0 423 0 236 0
Clinical Medicine 629 219 239 42 177 26
Humanities & Social Sciences 3,364 3,385 1,648 1,113 926 498
Physical Sciences 1,452 887 553 438 320 235
Technology 1,403 1,808 619 488 325 295
University Partner Institutions 347 0 106 0 92 0
Sub-Total 10,019 6,437 4,374 2,124 2,471 1,085
Grand Total
Applicat ions Offers Conf irmat ions
16,456 6,498 3,556

6
Admissions data in terms of Citizenship
Table 1.3 Applications, Offers and Confirmations by declared citizenship6 for 2015/16
admission
This table lists the country of declared primary citizenship with the 25 highest numbers of applications, and their corresponding confirmation rates. This year, there is very marginal change to the list of top 25 countries with only South Africa joining the top 25 and Egypt leaving. There is a significant drop in the success rate of applications to offers for Nigeria, Poland and Malaysia.
6 Figures based on declared primary citizenship only.
Number % Number % Number % Apps to of fers
% change f rom
14/15 for apps
to of fers
success rate Offers to conf
United Kingdom 3521 21% 1818 28% 1243 35% 51.63% -0.85% 68.37%
China 2652 16% 578 9% 267 8% 21.79% -1.78% 46.19%
USA 1676 10% 850 13% 378 11% 50.72% -0.45% 44.47%
India 840 5% 241 4% 85 2% 28.69% 2.68% 35.27%
Germany 656 4% 325 5% 201 6% 49.54% -7.08% 61.85%
Canada 394 2% 186 3% 75 2% 47.21% 2.00% 40.32%
Italy 385 2% 163 3% 88 2% 42.34% -8.73% 53.99%
France 316 2% 155 2% 90 3% 49.05% -2.09% 58.06%
Australia 311 2% 172 3% 94 3% 55.31% -4.76% 54.65%
Korea 221 1% 58 1% 19 1% 26.24% 0.87% 32.76%
Nigeria 216 1% 36 1% 20 1% 16.67% -44.71% 55.56%
Pakistan 214 1% 43 1% 24 1% 20.09% 3.07% 55.81%
Greece 213 1% 86 1% 46 1% 40.38% 9.47% 53.49%
Singapore 205 1% 108 2% 42 1% 52.68% 5.60% 38.89%
Spain 175 1% 75 1% 46 1% 42.86% -4.97% 61.33%
Malaysia 175 1% 66 1% 38 1% 37.71% 10.55% 57.58%
Hong Kong 172 1% 54 1% 30 1% 31.40% -6.44% 55.56%
Ireland 166 1% 86 1% 52 1% 51.81% 3.17% 60.47%
Netherlands 165 1% 85 1% 52 1% 51.52% -5.03% 61.18%
Poland 148 1% 59 1% 30 1% 39.86% -13.73% 50.85%
Taiwan 141 1% 35 1% 16 0% 24.82% 0.93% 45.71%
South Africa 130 1% 54 1% 28 1% 41.54% - 51.85%
Brazil 109 1% 47 1% 26 1% 43.12% 6.05% 55.32%
Russia 104 1% 37 1% 16 0% 35.58% 0.67% 43.24%
Thailand 96 1% 29 0% 18 1% 30.21% 9.02% 62.07%
Rest of EU 819 5% 381 6% 227 6% 46.52% - 59.58%
Other Overseas 2,236 14% 671 10% 305 9% 30.01% - 45.45%
Totals 16,456 6,498 3,556 -
Country
Applicat ions Offers Conf irmat ions Success Rates
7
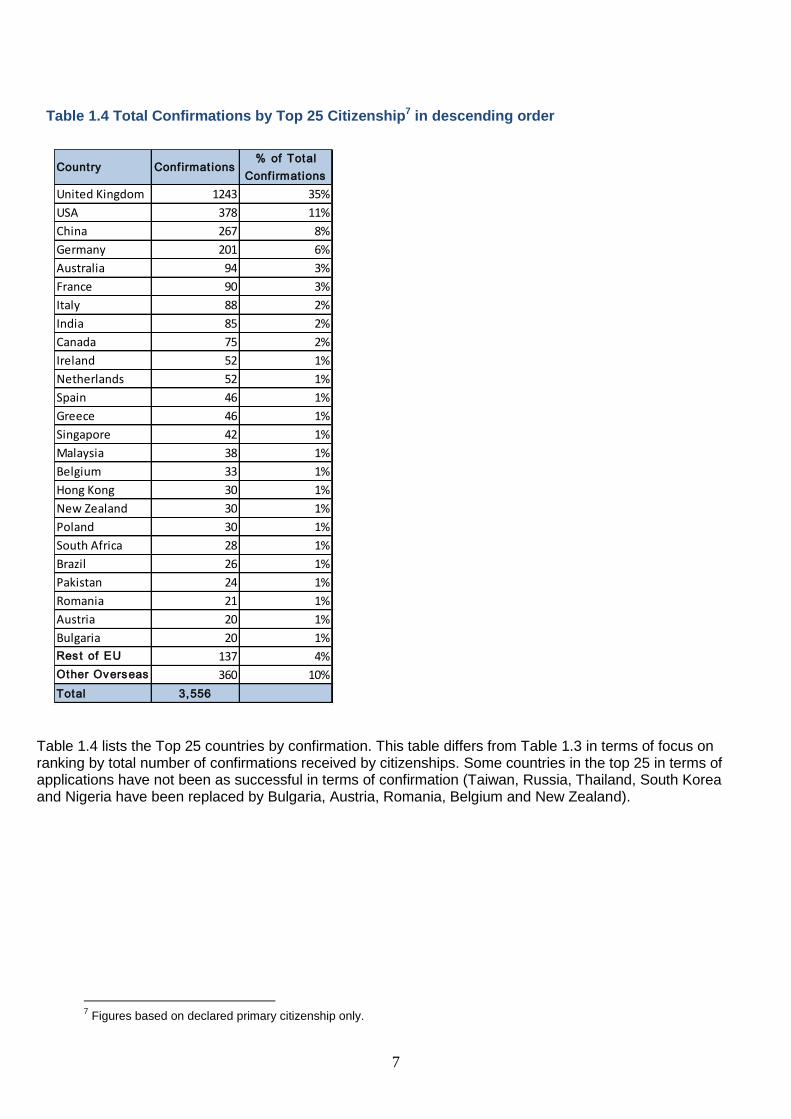
Table 1.4 Total Confirmations by Top 25 Citizenship7 in descending order
Table 1.4 lists the Top 25 countries by confirmation. This table differs from Table 1.3 in terms of focus on ranking by total number of confirmations received by citizenships. Some countries in the top 25 in terms of applications have not been as successful in terms of confirmation (Taiwan, Russia, Thailand, South Korea and Nigeria have been replaced by Bulgaria, Austria, Romania, Belgium and New Zealand).
7 Figures based on declared primary citizenship only.
Country Conf irmat ions% of Total
Conf irmat ions
United Kingdom 1243 35%
USA 378 11%
China 267 8%
Germany 201 6%
Australia 94 3%
France 90 3%
Italy 88 2%
India 85 2%
Canada 75 2%
Ireland 52 1%
Netherlands 52 1%
Spain 46 1%
Greece 46 1%
Singapore 42 1%
Malaysia 38 1%
Belgium 33 1%
Hong Kong 30 1%
New Zealand 30 1%
Poland 30 1%
South Africa 28 1%
Brazil 26 1%
Pakistan 24 1%
Romania 21 1%
Austria 20 1%
Bulgaria 20 1%
Rest of EU 137 4%
Other Overseas 360 10%
Total 3,556

8
Admissions data in terms of Part-Time Studies
Table 1.5 Applications, Offers, and Confirmations for Part-time Studies for 2015/16 admission
The total number of part time applicants is up by 12% from the previous academic year and the number of confirmations has increased by 11%.
Schools Applicat ions Offers Conf irmat ions
Arts & Humanities 20 8 7
Biological Science 7 4 4
Clinical Medicine 22 16 10
Humanities & Social Sciences 294 220 185
Physical Sciences 1 1 1
Technology 6 1 0
University Partner Institutions 1 1 1
Total 351 251 208

9
Admissions data in terms of continuing students8
Table 1.6 Applications, Offers, and Confirmations for continuing students for 2015/16 admission
8 A continuing student is an applicant who is currently, or has previously been, registered as a graduate student at
Cambridge on a PhD, MPhil, MRes, MSt, MASt, LLM, MCL, MMus, MEd, or Graduate Diploma and is continuing
on to further graduate study.
Success Rate Success Rate
School Applicat ions Offers Apps to of fers Conf irmat ions Offers to conf
Arts & Humanities 166 133 80% 63 47%
Biological Science 104 77 74% 53 69%
Clinical Medicine 38 25 66% 21 84%
Humanities & Social Sciences 472 342 72% 178 52%
Physical Sciences 202 102 50% 59 58%
Technology 194 122 63% 82 67%
University Partner Institutions 15 7 47% 6 86%
Grand Total 1,191 808 68% 462 57%

P a g e | 10
10
Admissions data in terms of Gender9
Table 2.1 Applications, Offers and Confirmations by Gender for 2015/16 admission
9 1 HSS applicant entered their gender as other. This applicant subsequently received and conditional offer and confirmation.
Female Male Total Female Male Total Female Male Female Male Total Female Male
Arts & Humanities 1,075 918 1,993 427 402 829 40% 44% 216 210 426 51% 52%
Biological Science 529 440 969 219 204 423 41% 46% 123 113 236 56% 55%
Clinical Medicine 456 392 848 152 129 281 33% 33% 113 90 203 74% 70%
Humanities & Social Sciences 3,449 3,299 6,748 1,424 1,336 2,760 41% 40% 776 657 1,433 54% 49%
Physical Sciences 665 1,674 2,339 278 713 991 42% 43% 147 408 555 53% 57%
Technology 1,010 2,201 3,211 324 783 1,107 32% 36% 192 408 600 59% 52%
University Partner Institutions 178 169 347 56 50 106 31% 30% 48 44 92 86% 88%
Total 7,362 9,093 16,455 2,880 3,617 6,497 39% 49% 1,615 1,930 3,545 56% 53%
Success Rate Success Rate
SchoolApplicat ions Offers Conf irmat ions Offers to confApps to of fers

11
Admissions data in terms of Disability
Table 2.2 Applications, Offers and Confirmations by Disability for 2015/16 admission
Success Rate Success Rate
Disability Applicat ions Offers Apps to of fers Conf irmat ions Offers to conf
A disability, impairment or medical condition that is not
otherwise listed133 53 40% 31 58%
A long standing illness or health condition such as
cancer, HIV, diabetes, chronic heart disease, or epilepsy91 42 46% 29 69%
A mental health condition, such as depression,
schizophrenia or anxiety disorder194 91 47% 55 60%
A physical impairment or mobility issues, such as
difficulty using arms or using a wheelchair or crutches31 12 39% 8 67%
A social/communication impairment such as Asperger's
syndrome/other autistic spectrum disorder26 12 46% 6 50%
A specific learning difficulty such as dyslexia, dyspraxia
or AD(H)D291 152 52% 108 71%
Blind or a serious visual impairment uncorrected by
glasses21 8 38% 4 50%
Deaf or a serious hearing impairment 13 5 38% 2 40%
Information refused 95 49 52% 32 65%
No disability 15,179 5,972 39% 3,251 54%
Not known 316 77 24% 14 18%
Two or more impairments and/or disabling medical
conditions66 25 38% 16 64%
Total 16,456 6,498 3,556

12
Applications and Confirmations in terms of Ethnicity
Table 2.3 Applications, Offers and Confirmations by Ethnicity for 2015/16 admission
Success Rate Success Rate
Ethnic ity Applicat ions Offers Apps to of fers Conf irmat ions Offers to conf
Arab 133 59 44% 37 63%
Asian or Asian British - Bangladeshi 75 23 31% 10 43%
Asian or Asian British - Indian 1,061 335 32% 134 40%
Asian or Asian British - Pakistani 287 68 24% 39 57%
Black or Black British - African 541 105 19% 51 49%
Black or Black British - Caribbean 59 19 32% 12 63%
Chinese 3,516 940 27% 464 49%
Gypsy or Traveller 8 2 25% 1 50%
Information Refused 801 328 41% 163 50%
Mixed - White and Asian 200 91 46% 50 55%
Mixed - White and Black African 80 22 28% 10 45%
Mixed - White and Black Caribbean 40 17 43% 8 47%
Not known 64 12 19% 3 25%
Other Asian background 1,050 327 31% 162 50%
Other Black background 107 25 23% 11 44%
Other Ethnic background 374 110 29% 55 50%
Other Mixed background 396 168 42% 99 59%
White 7,664 3,847 50% 2,247 58%
Total 16,456 6,498 39% 3,556 55%

P a g e | 13
13
Admissions data in terms of College membership10
Table 3.1 College Membership distribution for 2015/16 Michaelmas Term admission
10
These statistics only show those applicants who had their admission confirmed.
CollegeResearch
Programmes
One Year
ProgrammesTotal
Christ's College 38 56 94
Churchill College 66 61 127
Clare College 50 60 110
Clare Hall 33 62 95
Corpus Christi College 40 60 100
Darwin College 105 150 255
Downing College 38 46 84
Emmanuel College 22 52 74
Fitzwilliam College 39 98 137
Girton College 38 55 93
Gonville and Caius College 48 40 88
Homerton College 39 152 191
Hughes Hall 60 144 204
Jesus College 69 76 145
King's College 45 30 75
Lucy Cavendish College 26 77 103
Magdalene College 36 34 70
Murray Edwards College 31 46 77
Newnham College 46 82 128
Pembroke College 45 37 82
Peterhouse 29 33 62
Queens' College 51 120 171
Robinson College 33 33 66
Selwyn College 28 35 63
Sidney Sussex College 33 43 76
St Catharine's College 51 45 96
St Edmund's College 41 116 157
St John's College 51 57 108
Trinity College 68 54 122
Trinity Hall 35 37 72
Wolfson College 70 161 231
Total 1,404 2,152 3,556

P a g e | 14
14
Appendix
Applications, Offers and Confirmations by Department or Faculty for 2015/16 Admission
Arts and Humanit ies Div is ion Research 1 Year Research 1 Year Research 1 Year
Department of Anglo-Saxon, Norse and Celtic 18 35 11 24 4 17
Department of Architecture 47 176 23 44 16 32
Department of French 33 0 26 0 6 0
Department of German and Dutch 10 0 6 0 4 0
Department of History of Art 28 44 15 18 9 9
Department of Italian 16 0 12 0 5 0
Department of Slavonic Studies 6 0 2 0 2 0
Department of Spanish and Portuguese 11 0 8 0 5 0
Department of Theoretical & Applied Linguistics 42 121 26 50 12 21
Faculty of Asian and Middle Eastern Studies 57 94 29 30 15 19
Faculty of Classics 46 78 28 52 11 22
Faculty of Divinity 75 76 38 35 16 25
Faculty of English 178 355 59 106 12 59
Faculty of Modern and Medieval Languages 0 135 0 69 0 43
Faculty of Music 40 72 23 42 13 25
Faculty of Philosophy 61 139 14 39 11 13
Sub-Total 668 1,325 320 509 141 285
Humanit ies and Soc ial Sc ience
Archaeology Section 67 77 41 54 24 34
Biological Anthropology Section 16 33 10 19 3 10
Centre of African Studies 0 55 0 20 0 12
Centre of Development Studies 108 467 42 133 25 52
Centre of Latin American Studies 12 36 7 20 2 11
Centre of South Asian Studies 0 25 0 21 0 12
Department of History and Philosophy of Science 30 74 14 45 5 32
Department of Land Economy 60 486 34 162 15 84
Department of Sociology 95 122 40 51 24 30
Dept of Politics & Int.Studies 218 653 46 209 15 105
Faculty of Economics 126 1,041 41 348 15 131
Faculty of Education 229 568 121 340 65 259
Faculty of History 189 378 120 225 47 122
Faculty of Law 147 1,114 54 375 24 176
Institute of Criminology 53 93 31 61 14 35
Social Anthropology Section 74 103 33 44 18 23
Sub-Total 1,424 5,325 634 2,127 296 1,128
Biological Sc iences
Department of Biochemistry 82 26 57 12 31 7
Department of Genetics 28 27 19 9 8 3
Department of Pathology 37 10 20 5 14 3
Department of Pharmacology 37 11 22 5 9 2
Department of Plant Sciences 251 11 81 5 54 3
Department of Psychology 73 63 32 24 13 16
Department of Veterinary Medicine 29 9 22 8 10 7
Department of Zoology 58 13 37 7 14 3
Dept of Physiology, Development and Neuroscience 64 102 37 14 26 8
Wellcome Trust - MRC Cambridge Stem Cell Institute 38 0 7 0 5 0
Sub-Total 697 272 334 89 184 52
Applicat ion Offer Conf irmat ion

15
Applications, Offers and Confirmations by Department or Faculty for 2015/16 Admission cont’d
Clinical Medic ine Research 1 Year Research 1 Year Research 1 Year
Camb Inst for Medical Research 62 12 20 4 16 3
Cancer Research UK Cambridge Institute 20 10 14 1 13 1
Department of Clinical Biochemistry 21 5 12 3 12 3
Department of Clinical Neurosciences 112 33 30 7 19 5
Department of Haematology 7 0 7 0 4 0
Department of Medical Genetics 2 5 2 2 2 0
Department of Medicine 80 58 35 23 32 11
Department of Obstetrics and Gynaecology 2 1 1 0 0 0
Department of Oncology 7 7 1 3 1 2
Department of Paediatrics 2 0 1 0 0 0
Department of Psychiatry 25 9 11 6 8 3
Department of Public Health and Primary Care 33 227 16 45 14 28
Department of Radiology 8 1 6 0 2 0
Department of Surgery 10 2 9 1 7 1
Faculty of Clinical Medicine 52 0 8 0 5 0
MRC Cancer Unit 14 3 8 0 6 0
MRC Epidemiology Unit 18 0 5 0 5 0
Sub-Total 475 373 186 95 146 57
Phys ical Sc ience
Department of Chemistry 190 59 101 22 57 14
Department of Earth Sciences 85 7 22 2 15 2
Department of Geography 51 77 26 43 12 27
Department of Materials Science and Metallurgy 89 87 59 25 29 14
Department of Physics 380 197 160 65 89 43
Dept of Applied Mathematics & Theoretical Physics 198 334 47 218 36 113
Dept of Pure Mathematics & Mathematical Statistics 148 287 36 121 15 60
Institute of Astronomy 92 29 16 10 13 4
Scott Polar Research Institute 10 19 5 13 3 9
Sub-Total 1,243 1,096 472 519 269 286
Technology
Department of Chemical Engineering & Biotechnology 141 179 89 54 49 40
Department of Engineering 810 825 358 252 193 151
Faculty of Computer Science and Technology 100 176 55 68 28 31
The Judge Business School 48 932 17 214 7 121
Sub-Total 1,099 2,112 519 588 277 343
Univers ity Partner Ins t itut ions
Animal Health Trust, Newmarket 2 0 1 0 1 0
BBSRC Babraham Institute 21 0 12 0 9 0
British Antarctic Survey, NERC 22 0 7 0 7 0
European Bioinformatics Institute 7 0 6 0 6 0
MRC Biostatistics Unit 15 0 8 0 7 0
MRC Cognition and Brain Sciences Unit 51 7 13 1 8 0
MRC Human Nutrition Research 3 0 0 0 0 0
MRC Laboratory of Molecular Biology 177 0 28 0 26 0
MRC Mitochondrial Biology Unit 8 0 7 0 6 0
National Institute of Agricultural Botany 1 0 1 0 1 0
Wellcome Trust Sanger Institute 30 3 21 1 20 1
Sub-Total 337 10 104 2 91 1
Total 5,943 10,513 2,569 3,929 1,404 2,152
Applicat ion Offer Conf irmat ion

P a g e | 16
16
Applications, Offers and Confirmations from academic year 2010/11 – 2015/16 by fee status
The % column shows the percentage difference with the previous year.
Home EU Overseas Total % Home EU Overseas Total % Home EU Overseas Total %
2010/11 1,693 3,387 8,460 13,540 - 1,627 1,370 3,133 6,130 - 1,051 851 1,433 3,335 -
2011/12 2,876 2,733 8,720 14,329 5.8% 1,610 1,294 2,986 5,890 -3.9% 1,058 810 1,395 3,263 -2.2%
2012/13 3,059 2,920 9,394 15,373 7.3% 1,602 1,285 3,237 6,124 4.0% 1,039 808 1,500 3,347 2.6%
2013/14 3,227 2,801 9,769 15,797 2.8% 1,716 1,356 3,257 6,329 3.3% 1,184 797 1,606 3,587 7.2%
2014/15 3,351 2,986 9,715 16,052 1.6% 1,762 1,501 3,227 6,490 2.5% 1,137 876 1,517 3,530 -1.6%
2015/16 3,491 3,051 9,914 16,456 2.5% 1,784 1,424 3,290 6,498 0.1% 1,228 856 1,472 3,556 0.7%
YearApplicat ions Condit ional Of fers Conf irmat ions