grain & biofuel markets in 2015 matthew c. roberts [email protected]
TRANSCRIPT


www.matthewcroberts.com 2

Chinese Meat Consumption 90-13
3
19901992
19941996
19982000
20022004
20062008
20102012
0
10,000
20,000
30,000
40,000
50,000
60,000
70,000
80,000
Beef and Veal Swine Broiler
Thou
sand
Met
ric
Tonn
es

Chinese Oilseed Consumption Growing by 9.8%/yr since 1990
www.matthewcroberts.com 4
1990/1991
1991/1992
1992/1993
1993/1994
1994/1995
1995/1996
1996/1997
1997/1998
1998/1999
1999/2000
2000/2001
2001/2002
2002/2003
2003/2004
2004/2005
2005/2006
2006/2007
2007/2008
2008/2009
2009/2010
2010/2011
2011/2012
2012/2013
0
20,000
40,000
60,000
80,000
100,000
120,000
140,000
Sunflowerseed Peanut Rapeseed Cottonseed Soybean
Thou
sand
Met
ric
Tonn
es

Chinese Grain Consumption Climbing by 4%/year since 2006.
www.matthewcroberts.com 51990/1
991
1991/1992
1992/1993
1993/1994
1994/1995
1995/1996
1996/1997
1997/1998
1998/1999
1999/2000
2000/2001
2001/2002
2002/2003
2003/2004
2004/2005
2005/2006
2006/2007
2007/2008
2008/2009
2009/2010
2010/2011
2011/2012
2012/2013
0
50,000
100,000
150,000
200,000
250,000
300,000
350,000
400,000
450,000
500,000Barley Millet Rice, Milled Sorghum Wheat Corn

Global food demand growth is still explosive
• Biofuel growth has stopped in the US.– Largely true globally, too.
• Not just meal, but oil• Global instability:
– Hurts economic growth, hurts food demand
www.matthewcroberts.com 6

Oil Prices Continue to Fall
www.matthewcroberts.com 7
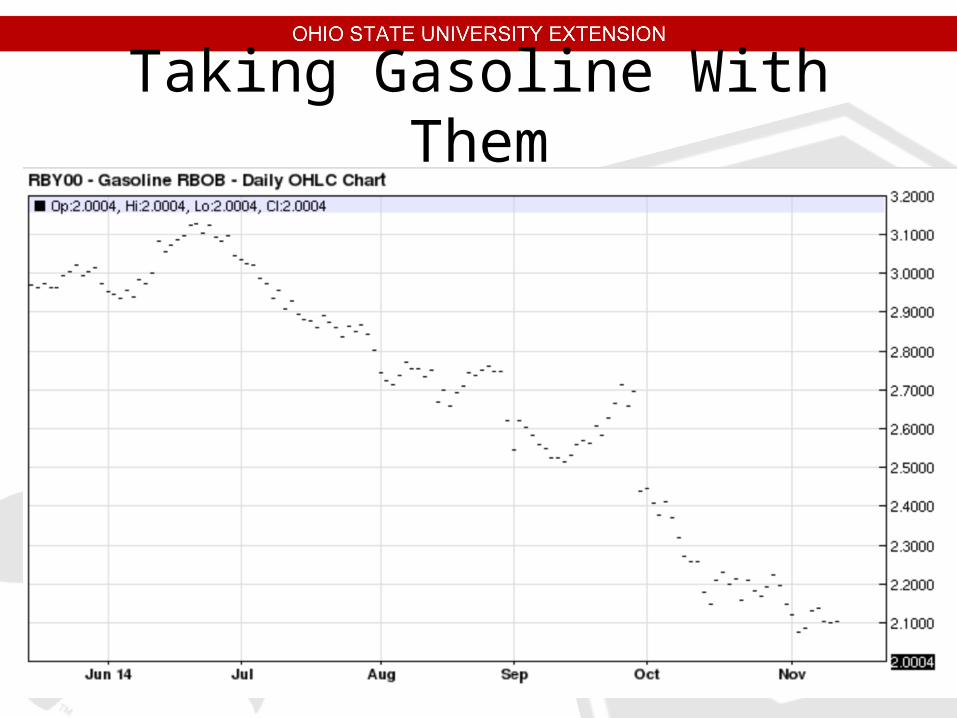
Taking Gasoline With Them
www.matthewcroberts.com 8

www.matthewcroberts.com 9

www.matthewcroberts.com 10

The Long Term Price of Oil
• Demand growth is slowing– Europe– China – US Power Generation
• Supply is increasing– Libya– United States
• Increases in US Production are already slowing
www.matthewcroberts.com 11

Energy Independence and Security Act of 2007Renewable Fuels Standards
Calendar Year
Total Convent’l Biofuel
(min 20% GHG reduc after 2010)
Advanced Biofuel
(min 50% GHG reduction)
Cellulosic Biofuel
(min 60% GHG reduction)
Biobased Diesel
2008 9.00 9.00 - - -
2009 11.10 10.50 0.60 - 0.50
2010 12.95 12.00 0.95 0.10 0.65
2011 13.95 12.60 1.35 0.25 0.80
2012 15.20 13.20 2.00 0.50 1.00
2013 16.55 13.80 2.75 1.00 1.28
2014 18.15 14.40 3.75 1.75 1.28
2015 20.50 15.00 5.50 3.00 1.28
12
0.006
0.0172.2015.21 13.00
0.003
0.001
0.001


How Fast Will Feed Use Recover?
71 74 77 80 83 86 89 92 95 98 '01 '04 '07 '10 '133000
4000
5000
6000
7000
8000Million Bushels
Year
5537
6150
3876 3941
55635375
63506646

Corn Exports Extremely Strong in 13/14, especially given price & competition
70
75
80
85
90
1992
1993
1994
951996
971998
99
'00
'01
'02
'03
'04
'05
'06
'07
'08
'09
'10
'11
'12
'13
'14
0
500
1000
1500
2000
2500
3000 Chart Title
Mil
lion
Bu
shel
s
2420
1220 1328
2350
700
Year
510
2436
1750

Global Corn Exports
17
2000/2001
2001/2002
2002/2003
2003/2004
2004/2005
2005/2006
2006/2007
2007/2008
2008/2009
2009/2010
2010/2011
2011/2012
2012/2013
2013/2014
0
10
20
30
40
50
60
70
Argentina Brazil China
European Union Ukraine United States
Mill
ion
Met
ric T
onne
s

Domestic Production Record Means Much Higher Corn Inventories
0
10
20
30
40
50
60
70
80
90
100
0
2
4
6
8
10
12
14
Year
Percent
Bil
lio
n B
ush
els
Production 14.4
Use 13.66
Stocks-to-Use Ratio (%)

2014: Record Yields
www.matthewcroberts.com 19
19601964
19681972
19761980
19841988
19921996
20002004
20082012
020406080
100120140160180200
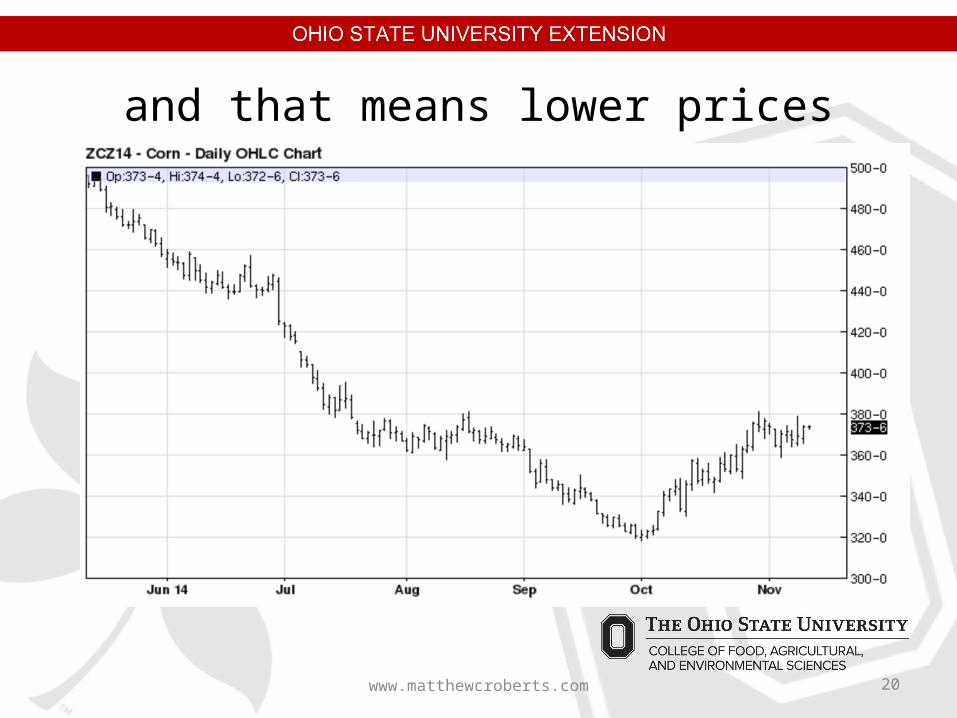
and that means lower prices
www.matthewcroberts.com 20
Old Crop:
• Lows should be in. Seems that pessimism has started to leave the market.
• Still large harvest & large carries.• Booking now for remainder of year
probably good bet.• Few big downside risks, exports a real
upside risk
www.matthewcroberts.com 21
New Crop:
• Current Dec 2015 price (4.19) unlikely to pull 2m more acres in compared to this year…
• Will ration consumption some compared to this year, but probably not enough.
• Futures probably need to be a bit higher for 2015.
www.matthewcroberts.com 22

Soybeans: Domestic Demand Flat
1970
71
72
73
74
1975
76
77
78
79
1980
81
82
83
84
1985
86
87
88
89
1990
91
92
93
94
1995
96
97
98
99
'00
'01
'02
'03
'04
'05
'06
'07
'08
'09
'10
'11
'12
'13
'14
0
500
1,000
1,500
2,000
2,500 Chart Title
Year
Mill
ion
Bu
she
ls 1895
1956
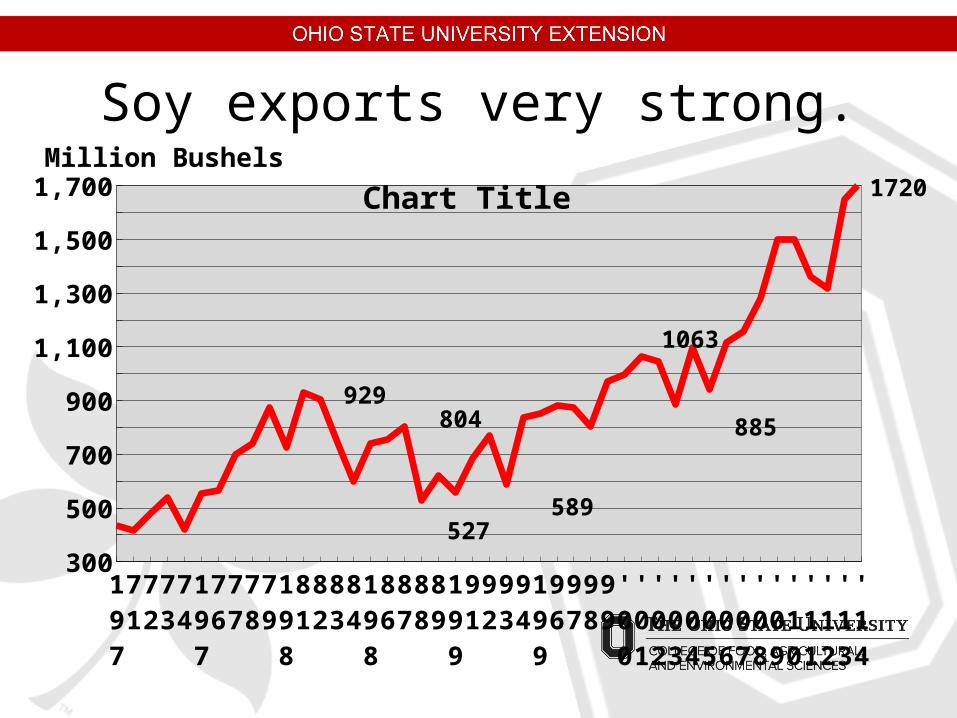
Soy exports very strong.
1970
71
72
73
74
1975
76
77
78
79
1980
81
82
83
84
1985
86
87
88
89
1990
91
92
93
94
1995
96
97
98
99
'00
'01
'02
'03
'04
'05
'06
'07
'08
'09
'10
'11
'12
'13
'14
300
500
700
900
1,100
1,300
1,500
1,700 Chart TitleMillion Bushels
929804 885
589527
1063
1720
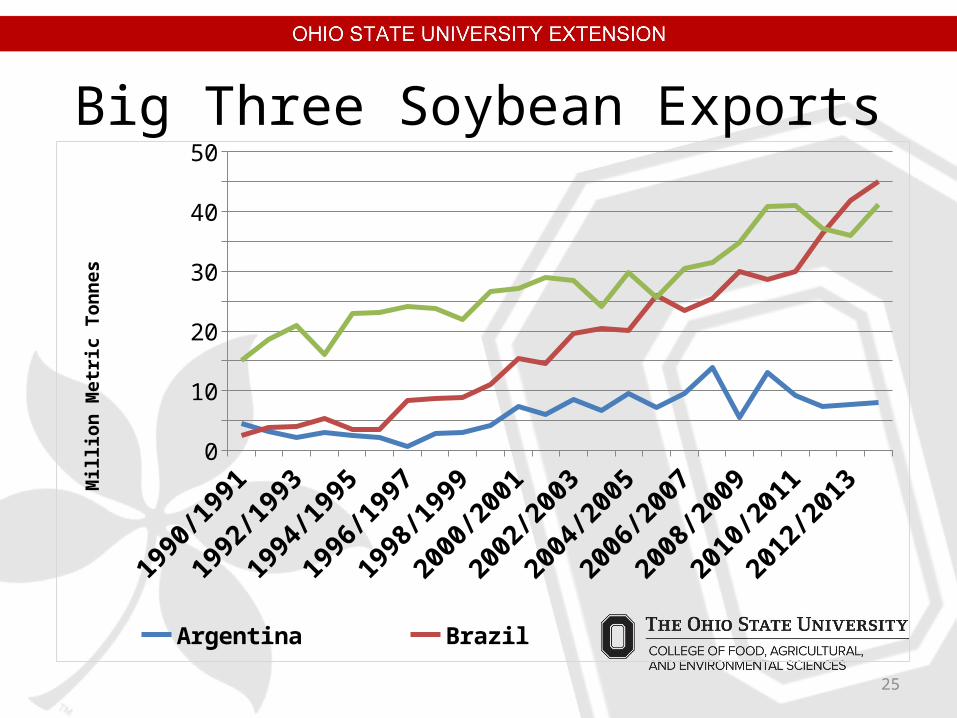
Big Three Soybean Exports
25
1990/1991
1992/1993
1994/1995
1996/1997
1998/1999
2000/2001
2002/2003
2004/2005
2006/2007
2008/2009
2010/2011
2012/2013
05
101520253035404550
Argentina Brazil United States
Mill
ion
Met
ric
Tonn
es

Bean Inventories Jump
85 87 89 91 93 95 97 99 '01 '03 '05 '07 '09 '11 '130
102030405060708090
100
1
1.5
2
2.5
3
3.5
28.0
21.0
15.0
11.0
13.0 18
.013
.613
.410
.714
.07.
85.
4 7.6 13
.410
.78.
87.
16.
44.
4 8.6 15
.618
.66.
74.
54.
5 6.6
5.4
4.5
2.6
12.4
Year
Per
cen
t
Bn
Bu
sh
els
Production 3.96
Use 3.61
Stocks-to-Use Ratio (%)

Global Soybean Production 600m bu Higher in ‘13/14
0
10
20
30
40
50
60
70
50
100
150
200
250
300
19
25
19191820191717
1418
139
15161718172120
232528
2319
2527
232327
Year
Percent
Production 287
Use 271
Million Metric Tons
Stocks-to-Use Ratio (%)
Bean Outlook
• Much larger inventories• Weak case for higher consumption
– Crushing consumption & exports already high.
• Beans can give 3m acres next year, but will producers prefer corn to beans?
www.matthewcroberts.com 28
www.matthewcroberts.com 29
Matt Roberts(614) 688-8686
[email protected]://aede.osu.edu/people/roberts.628
Twitter: @YourEconProf
Questions?