grain sorting on a coastal dune of orissa, bay of bengal ... · pdf filegrain sorting on a...
TRANSCRIPT

International Research Journal of Earth Sciences______________________________________ ISSN 2321–2527 Vol. 3(8), 14-31, August (2015) Int. Res. J. Earth Sci.
International Science Congress Association 14
Grain Sorting on a Coastal dune of Orissa, Bay of Bengal and a comparison with the Desert Dune of Rajasthan, India
Barendra Purkait1*, Dipanjan Das Majumdar2 and Ashis Kumar Paul3 1Department of Geology, University of Calcutta, 35 B. C. Road, Kolkata- 700 019 INDIA
2Department of Remote Sensing and GIS, Vidyasagar University, Midnapore, West-Bengal – 721102, INDIA 3Department of Geography and Environment Management, Vidyasagar University, Midnapore, West-Bengal – 721102, INDIA
Available online at: www.isca.in, www.isca.me Received 13th July 2015, revised 15th August 2015, accepted 23rd August 2015
Abstract Grain sorting patterns and textural parameters of a coastal dune of Konark, Orissa has been compared with the desert dune of Thar, Rajasthan, India. Sand samples were collected from the stoss, crest and the lee sides of the dunes. Grain-size distribution patterns were critically studied and compared with three hypothesized model distributions: log-normal, log-hyperbolic and the log-skew-Laplace to discriminate the coastal sands from the desert sands. In general, it is observed that the coastal dune sands are coarser and poorly sorted than the desert dune sands. Almost all the coastal and the desert dune sands, are positively skewed. Coastal dune sands are platy to leptokurtic distributed and desert sands are leptokurtic distributed. In terms of symmetry index, coastal dune sands exhibit a narrow range of symmetry index as compared to the desert dune sands. The log-skew-Laplace is the best-fit grain-size distribution model for coastal dune sands for stoss and crest samples whereas log-hyperbolic is the best-fit statistical model for lee samples; for desert sands, log-hyperbolic is the best-fit grain-size distribution model of the stoss and crest sands whereas log-normal is the best-fit statistical model for lee sands. The results of ANOVA and Tukey test signify the variance between coastal and desert dune sands. Finally, the canonical discriminant function yielded two distinctly separate spaces for coastal and desert dunes. Keywords: Coastal and desert dune sands, grain-size distribution, log-normal, log-hyperbolic, log-skew-Laplace, discriminant analysis.
Introduction A considerable effort has been undertaken to determine the grain-size characteristics of aeolian sediments in order to elucidate the aeolian processes on coastal and desert dunes1-3 and to distinguish different depositional environments based on grain-size characteristics4. Kar4 in his earlier research made an attempt to discriminate the sands of desert dune from the coastal dune based on the granulometric characteristics. Kasper-Zubillaga and Dickinson5 made an attempt to differentiate beach, dune and river environments in terms of their mineralogical components by using simple bar charts. Kasper-Zubillaga and Carranza Edwards1 conducted grain-size discrimination from the slip face and crest of linear and sand sheet from the desert and coastal zone of the Altar Desert, Northwestern Mexico. They observed that the textural attributes of the dune fields are affected by their proximity to the sediment sources, tidal transport, long shore driftand wind direction. Coastal dune sands are coarser than the desert dune sands. They suggested that the linear discriminant analysis and ANOVA test are useful tools to discriminate between desert and coastal dune sands. Kasper-Zubillaga et al.,2 carried out sedimentological, compositional and geochemical determinations on desert and coastal dune sands of the Altar Desert.
According to Livingstone et al.7, grain-size variations between dunes are related to the height of the dune. Although there is progressive fining of sand from dune base to dune crest8-9, this relationship cannot be adopted as a general rule, since grain-size distributions in the dune may be controlled by different modes of transport and wind pattern. The experimental study of Lancaster et al.10 on a small reversing dune shows that particle size and sorting characteristics of surface sand samples at any point in time and space are highly dependent on wind competency and resultant sand transport rates. It is observed from the aeolian research that the coarser fractions of a grain-size population usually move near the bed because of their least susceptibility to lifting10-15. Therefore, it is assumed that grain-size should decrease with elevation from the bed surface. Contradictory evidence from field experiments16-21 and wind tunnel experiments21-22 suggest that this simple size decay concept may not be typical. Farrell et al.,23 studied the vertical distribution of grain-size for wind-blown sand and observed that a reverse in grain-size trends occurs at an inflection zone above the bed. Below this inflection zone, mean grain-size decreases steeply with elevation in the near bed region. There is a coarsening of grain-size with elevation occurs just above the inflection zone. Zhu et al.24 studied the grain-size characteristics of aeolian dune and Gobi sands at different sections and observed that sorting improves with decreasing grain-size. A clear relationship occurs between skewness and sorting being

International Research Journal of Earth Sciences____________________________________________________ ISSN 2321–2527 Vol. 3(8), 14-31, August (2015) Int. Res. J. Earth Sci.
International Science Congress Association 15
progressively zero-skewed as sorting improves, suggesting that improved sorting is accomplished by loss of both relatively coarser and finer grains in the desert. Grain-size distributions can be described by fitting a variety of mathematical functions such as log-normal25, log-hyperbolic26-
27, and log-Laplace28. Various authors29-32 suggested that the grain-size distributions are better regarded as log-hyperbolic rather than log-normal in different sedimentary environments. Extensive research on the dynamics of desert dunes has been carried out. A few studies have explored the linkage between secondary flow and surface transport in the lee of a dune33-34. Many investigators elucidated the aeolian processes on desert dune20,35,36,1,2,3. Purkait3 studied the grain-size distribution pattern and the mechanism of grain sorting separately at different sections i.e. stoss, crest and lee of a desert dune of the Thar. It was observed that the log-hyperbolic distribution is the best-fit statistical model for desert aeolian sands. However, the lognormal distribution fits best in the lee side of dune whereas in the crest and stoss side of the dune, the log-hyperbolic distribution fits best. Therefore, it is vital to assess the sector-wise grain sorting pattern of a specific geomorphic unit and also to recognize the pattern of grain sorting using the best-fit statistical model for distinguishing different sedimentary environments.
The objectives of this research are to study the grain sorting pattern on i) a coastal dune of the Konark, Orissa, Bay of Bengal and ii) to compare the findings with the desert dune sands of the Thar desert, Rajasthan, India as studied earlier3. Such a study was undertaken to make an attempt to differentiate this two types of dune systems of different geomorphic and climatic set-ups. The results can be compared toother studied sites as worked out by previous investigators at different parts of the world in different climatic set-ups. Regional Setting: Geographically, Konark is in the Puri district of the state of Orissa at the sea front of the Bay of Bengal (figure-1). The coastal area of Konark is characterized by tropical climate with temperature ranges between 35-40˚C during summer and 12-14˚C during winter. There are three major seasons - summer (March-June), rainy (monsoon) (July-September) and winter (October-February). As a whole the climate of the area is equable with highly humid and sticky. Onshore wind speed normally varies within 4-5 m/s. Rainfall in this area is mostly contributed by the monsoon depression during the southwest monsoon season (June-September) and cyclonic storms during post-monsoon (October-November) and pre-monsoon (March-May). The study area is surrounded by different land uses and land covers such as crop land, forest land, fallow land and settlement in the landward side, and sandy beach-dune complex along the seaward side.
Figure-1
Location of map of the study area showing the position of the coastal dune

International Research Journal of Earth Sciences____________________________________________________ ISSN 2321–2527 Vol. 3(8), 14-31, August (2015) Int. Res. J. Earth Sci.
International Science Congress Association 16
The fore-dune ridge of the Konark shore line runs parallel to the beach irrespective of the prevailing or dominant wind direction. The beach-dune profile of the study area is the basic sand sharing system whose components respond to variation in energy levels and to mobilization of sand from one portion to another. The exchange of sediments from each component of the profile makes it a classic closed system. The fore-dune has accumulated sand in association with the pioneer vegetation ‘Ipomoea pes-capra’ locallycalled ‘Halkalmi’37 to create a positive landform perched above the sandy beach system. Morphologically, the dune is of ~10 m height and~ 75 m length and maintains its shape like a curve from which three different parts- stoss, crest and lee can be clearly identified. The windward (stoss) slope varies from 50-100 and the leeward slope varies from 250-300. Absence of the dune cliff is the indication of prevailing low wave energy regime. The total wave energy (E) per unit area of the wave is 634.84 J/m2,37. Vegetation is sparse throughout the fore-dune body, mainly in the crestal part, where due to low vegetative cover amount of free flowing sand is high. Sand deposition on the dune is high on the stoss side than on the crest and lee sides. The Thar Desert is situated in the Jaisalmer district of the western part of Rajasthan in north-western India. The study area is characterized by a typical arid climate with temperatures as high as 500 C during the daytime in summer and nights have temperatures ranging from 150-200C. During winter the temperatures can fall below 00C but the days remain warm and
comfortable. Generally, high velocity strong wind/dust storms (18-20 m/s) are common during summer. The rain is very scanty and highly irregular. Most of the area is covered by thick brown sands. The dunes are very mobile and devoid almost of any binding vegetation. Details have been described elsewhere37 (Purkait, 2010). A transverse dune was selected for study. The height of the dune is approximately 10m. The lee slope varies from 240 to 300 and the windward slope is about 50 to 100. Material and Methods A series of similar type of transverse dune developed at Thar Desert and at the coastal belt of Konark. Of these two contrasting climatic set-ups, in each case one representative dune having well preserved stoss, crest and lee, was selected. From the coastal dune of Konark, a total of 23 sand samples were collected along a fixed transect on the fore-dune, both from the surface (<1cm depth) and 15 cm below surface, of which 10 samples from the stoss, eight from the crest and five from the lee. Further, out of 10 samples from the stoss, five samples were taken from the surface and the five from the subsurface; out of eight samples from the crest, four samples from the surface and the four from the subsurface; out of five samples from the lee, two from the surface and the three from the subsurface. Such a scheme of sampling from the surface and the subsurface on the individual location points was followed to study the grain-size variation separately on the surface and subsurface (figure-2). A calm period prevailed in the afternoon during sample collection.
Figure-2
Schematic diagram of the coastal sand dune showing the sampling points from stoss to crest to lee

International Research Journal of Earth Sciences____________________________________________________ ISSN 2321–2527 Vol. 3(8), 14-31, August (2015) Int. Res. J. Earth Sci.
International Science Congress Association 17
From the desert dune of Thar, a total of 51 samples were collected along a single transect on the transverse dune surface (<1cm depth) of which 15 were from the stoss side, 12 were from the crest and 24 from the lee. Details have been described elsewhere3. As the samples were mostly medium to fine grained sands, all the samples were oven dried to 800C and 30g of samples were separated by conning and quartering and subjected to mechanical sieving for 15 minutes in a Ro-Tap sieve shaker using ASTM (American Society for Testing Material) sieves of one phi/half phi size interval. Each sieve fraction was weighed using an electronic balance and cumulative weight frequency percentage (probability density) was calculated and converted to log scale as the size classes were taken in log scale (phi scale). Values corresponding to percentile values of φ 5, φ 16, φ 25, φ 50, φ 75, φ 84, and φ 95 were also obtained from the cumulative frequency curve. The graphic method of Folk and Ward38 has been used to calculate the mean, sorting (standard deviation), skewness, and kurtosis from the percentile values. Mode values and the grain roughness (D65) were also calculated to study the nature of shifting of mode values from the stoss to crest to lee of the dune. D65 is that particular size by which 65% is finer and 35% is coarser in weight frequency39 and is equivalent to φ 35 percenttile value. Statistical modeling of grain-size data: The grain-size distribution patterns were compared with three model distributions: i) Log-normal, ii) Log-hyperbolic and iii) Log-skew-Laplace. The log-normal and the log-skew-Laplace are the limiting distributions of the log-hyperbolic family. Moreover, as some of the samples are bi/polymodal in nature, hyperbolic distribution cannot be fitted in those cases due to its limitation in computing the scale parameter δ as shown in the following section. Normal distribution: The density functions for normal distribution: g (x; µ, σ) = 1/ σ√ (2π) exp {−1/2(x − µ) 2/ σ2} (1) where σ=standard deviation and >0, µ=mean size, and x=observed variable, π=3.143 (constant). The log probability function is a parabola. Hyperbolic distribution: Denoting the size variable by ø and the density function S (ø), the equation of the hyperbolic curve is of the form 29: Loge S (ø) = V − 1/2(γ1 + γ2) √[δ2 + (ø− µ)2] + 1/2(γ1− γ2) (ø − µ) (2) Four parameters are utilised to calculate it: γ1, γ2, µ and δ where γ1 and γ2 represent the slopes of the left and right asymptotes of the hyperbola respectively, µ is the abscissa of the intersecting point of these two asymptotes, the ordinate V equals the logarithm of the norming constant, which is adjusted to agree with the observed frequency and is obtained by putting the value of µ in the equation of either of the two asymptotes for the corresponding ordinate values. The scale parameter δ (>0) can be expressed as:
δ = 2(µ ∗ −µ) √(γ1γ2) / (γ1− γ 2) (3) where µ* is the observed mode of the distribution and µ is the mean size. Graphically, the logarithm of the hyperbolic distribution is a hyperbola. Following Christiansen and Hartmann32, the normal and the Laplace distributions are the limiting distributions of the hyperbolic family. For normal distribution, the left slope = right slope of the two asymptotes; γ1and γ2 correspond to the coarser and finer grades respectively, and δ→ ∞ while σ > √ (γ1γ2) → σ2. σ = standard deviation (sorting), δ = scale parameter which is a measure of spread (sorting); for the Laplace distribution δ→o. Laplace distribution: Following Fieller and Flenley42, the skew-Laplace distribution can be written as: g (x; α, β, µ) = (α + β)− 1 exp {(x− µ)/ α} … . . for x ≤ µ = (α + β)− 1 exp {(x− µ)/ β} … . . for x > µ (4) Where x indicates observed variable; α, β, µ are parameters. α = slope of the left asymptote i.e., coarser fractions, β = slope of the right asymptote i.e., finer fractions, µ = point of intersection of the two asymptotes. Graphically, the logarithm of Laplace distribution is a pair of intersecting lines. Test of significance: To obtain a quantitative idea of the discrepancies, the weighted relative errors (E) between the computed and the observed values were calculated by the following formula 41,42 Error (E) = √∑ [(Sc-So) 2/SoT] (5) Where Sc= computed values i.e., wt % of calculated amount in each sieve fraction, So = observed values i.e., wt% of observed amount in each sieve fraction, T= total value observed, here T=100 as the wt freq. is in %.
One may consider comparing the different models using a chi-squared test of goodness-of-fit. But unfortunately the size classes are not very large. Moreover, in the tail size classes weight frequencies are less than five and hence these classes need to be amalgamated with the adjacent classes to conduct a chi-squared test. After amalgamation, the number of size classes becomes even smaller. In the hyperbolic model, four parameters are estimated, so with such a small number of classes we cannot in many situations perform the goodness-of-fit test, as no degrees of freedom will be left for testing purposes. A one way analysis of variance (ANOVA) test has been performed to assess significant differences in the mean values between the sands of desert and coastal dunes. Tukey multiple means comparison test has also been applied as a post-hoc study of ANOVA to compare all the possible pairs of factor means to determine which one is significantly different. Previously, the Post-hoc analysis (Scheffe's multiple mean comparison test) has been done to identify the level of significant differences among the sedimentary environments in terms of their textural parameters4.Finally, canonical discriminant analysis has been

International Research Journal of Earth Sciences____________________________________________________ ISSN 2321–2527 Vol. 3(8), 14-31, August (2015) Int. Res. J. Earth Sci.
International Science Congress Association 18
performed to discriminate the coastal dune and desert dune on the basis of the four textural parameters (mean size, sorting, skewness and kurtosis). Results and Discussion Textural characteristics of coastal dune sands: The analytical results of textural parameters are given in table-1. It is observed that there is no appreciable change of mean grain-size in surface samples from stoss to crest to lee. At stoss, mean size is 1.25 φ, at crest 1.26φ and at lee 1.24 φ. Mode value for surface samples at stoss is 0.76 φ, at crest 1.24 φ and at lee 1.16φ indicating an irregular pattern i.e. from coarse to fine and again to coarse. There is no appreciable change of sorting from stoss to crest to lee. At stoss sorting is 0.93 φ, at crest 0.91 φ and at lee 0.92 φ. This pattern, however, changes and sorting improves gradually
from stoss (0.87 φ) to crest (0.78 φ) to lee (0.76 φ) for subsurface samples of’15cm depth. When the results of analysis of surface and the subsurface samples are combined, the mean grain-size gradually becomes finer from the stoss to the crest of the dune (table-2). Average mean grain-size, sorting and the mode at stoss are 1.15 φ, 0.90 φ and 0.97 φ respectively and at the crest 1.17 φ, 0.84 φ and 1.07 φ respectively whereas at the lee it becomes finer with mean size 1.31 φ, sorting 0.85 φ and mode value 1.18 φ. Mode value also shifted towards finer side (figure-3). Out of 10 samples of the coastal dune sands, at stoss except one, all samples show positive skewness; out of eight samples at crest, all positive; and out of five samples at lee, three positive, and two negative.
Figure-3
Histograms showing the grain size variation at different sections of the dune

International Research Journal of Earth Sciences____________________________________________________ ISSN 2321–2527 Vol. 3(8), 14-31, August (2015) Int. Res. J. Earth Sci.
International Science Congress Association 19

International Research Journal of Earth Sciences____________________________________________________ ISSN 2321–2527 Vol. 3(8), 14-31, August (2015) Int. Res. J. Earth Sci.
International Science Congress Association 20
Figure-4
Cumulative weight frequency percent plotted on arithmetic probability paper showing the grain size variation on the dune. Log-probability plots (in black) compared with log-normal (in red), log-hyperbolic (in blue) and log-skew-Laplace (in
magenta) plots. a) SA- Stoss surface samples, b) SB- Stoss sub-surface samples, c) CA- Crest surface samples, d) CB- Crest sub-surface samples, e) LA- Lee surface samples and LB- Lee sub-surface samples.

International Research Journal of Earth Sciences____________________________________________________ ISSN 2321–2527 Vol. 3(8), 14-31, August (2015) Int. Res. J. Earth Sci.
International Science Congress Association 21
Again out of these 10 samples at stoss, four platykurtic and six leptokurtic; all the eight at crest and all the five at lee are leptokurtic. The grain-size distribution pattern has been shown in figure-4 and table-3. It is observed that out of 23 samples, twelve (52.17%) samples fit best to log-skew-Laplace, eight (34.78%) to log-hyperbolic and only three (13.04%) to log-normal, although section-wise five (50%) fits best to log-skew-Laplace in stoss, five (62.5%) skew-Laplace in crest but three (60%) fits best to hyperbolic in lee side. The symmetry index (γ1~ γ2), a new parameter introduced here; at stoss is 1.58, at crest 2.19 and at lee 1.45. Here γ1 represents the slope of the left asymptote and γ2 represents the slope of the right asymptote of the hyperbolic model. The difference in slope values of the two asymptotes is the symmetry index. In general, it is observed that lower the symmetry index as in coastal dune, higher is the chance of attaining Laplace distribution. The weight percentages of three different size fractions (coarse, intermediate and the fine) on the dune surface at different positions from the stoss to crest to lee have been critically studied to interpret how the symmetry index changes gradually due to selective elimination of different size fractions (table-3).
Textural characteristics of desert dune sands: From the analysis of textural parameters of the desert sands (table-4), it is observed that the mean grain-size (Mz) and sorting (σ) at stoss are 2.80 φ and 0.33φ; at crest 2.73φ and 0.31 φ; and at lee 2.86 φ and 0.29 φ respectively. All samples from the stoss, crest and lee are positively skewed and leptokurtic distributed.
Figure-5
Canonical bi-plots showing two distinct fields based on textural parameters for coastal and desert dunes. Star
marks indicate group means of different sectors of both types of dune fields
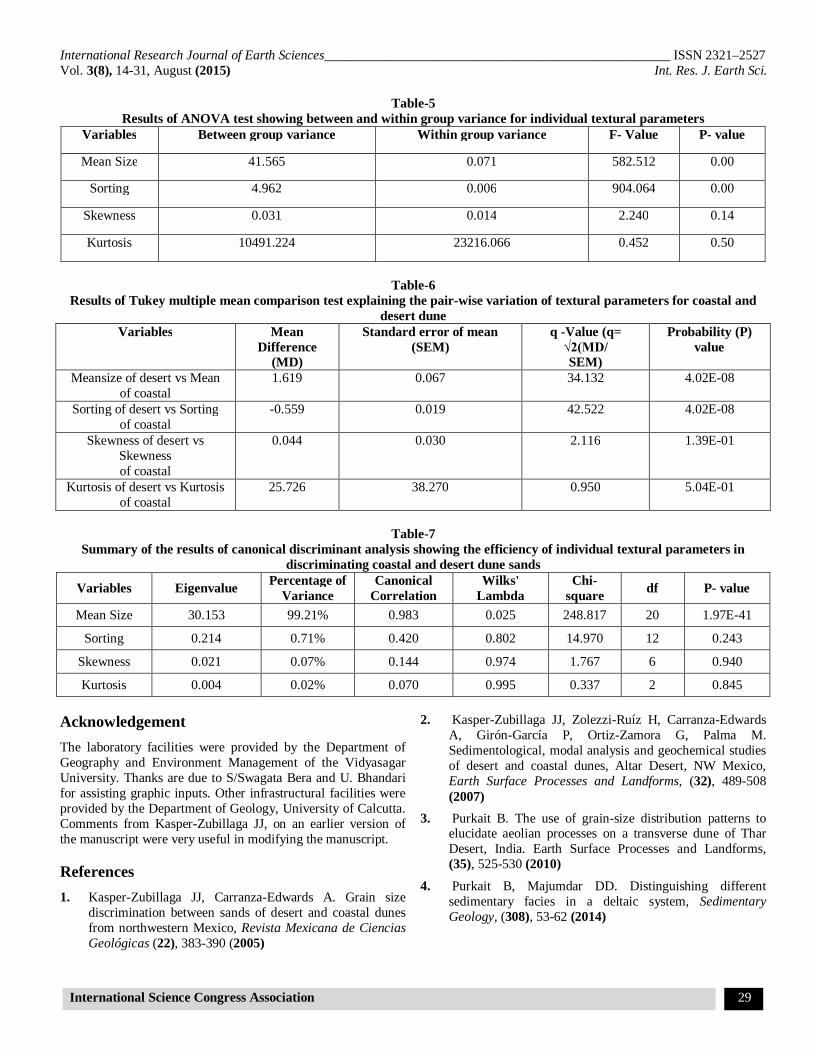
Out of 51 desert sand samples, 33 (64.70%) fits to log-hyperbolic, 14 (27.45%) to log-normal and only four (7.84%) to log-skew-Laplace; although section-wise, at stoss, 14 (93.33%) fits to log-hyperbolic, only one (6.67%) to log-normal but none to log-skew-Laplace, at crest 11 (91.67%) to log-hyperbolic, one (8.33) to log-skew-Laplace but none to log-normal; at lee 13 (54.17%) to log-normal, eight (33.33%) to log-hyperbolic and three (12.5%) to log-skew-Laplace. There is a wide range of symmetry index. The symmetry index (γ1~ γ2) at stoss is 6.01, at crest 6.20 and at lee 2.02. ANOVA and Post-hoc analysis between desert and coastal dunes: The one way ANOVA (analysis of variance) test (table-5) indicates that mean and sorting values are significant (p-value zero) to differentiate the sands of the two groups but skewness and kurtosis have no role in differentiating the two groups. The ANOVA test determined that at least one of the population means is significantly different. The multiple means comparison subsequently compares all possible pairs of factor level means to determine which mean is significantly different. The Tukey multiple means comparison analysis (table-6) indicates that the differences of grain-size and sorting between coastal and desert dune sands are significant at the 0.05 level because of low p-value which in turn also signifies the rejection of the null hypothesis (H0) that the grain-size behaviour between the coastal and desert dunes are same. Canonical discriminant analysis between coastal and desert dune sands: The canonical discriminant analysis derives a linear combination of the variables that has the highest possible multiple correlation with the groups. This maximal multiple correlation is called the first canonical correlation. The coefficients of the linear combination are the canonical coefficients. The variable defined by the linear combination is the first canonical variable or canonical component. The second canonical correlation is obtained by finding the linear combination uncorrelated with the first canonical variable with highest possible multiple correlation with the groups. The canonical discriminant analysis shows that the variables that better discriminate coastal and desert dune sands are mean size which is similar to the findings of Purkait and Majumdar4. Table 7 provides the outputs of the eigenvalues as well as canonical correlation of the discriminant function. The eigenvalue is an indication of how well a variable differentiates the groups. The larger the eigenvalue, the better the function differentiates. The high eigenvalue and canonical correlation of mean size reveal that those share maximum amount of variance (99.21%) in the linear combination of variables. The next important variable is sorting. Mean size and sorting jointly explain a total of 99.92% of variance between the desert and coastal dune sands. Mean size and skewnesscan also explain 99.28% of variance which is similar to the observation of Kasper-Zubillaga et al1 that mean size and skewness are the prime variables for the discrimination of coastal and desert dune sand. But in the present study due to the maximum percent of variance as well as significant canonical correlation, mean size and sorting have been

International Research Journal of Earth Sciences____________________________________________________ ISSN 2321–2527 Vol. 3(8), 14-31, August (2015) Int. Res. J. Earth Sci.
International Science Congress Association 22
considered as the prime variables for the group discrimination. On the other hand Wilks' Lambda test is to verify which variable contributes significantly in discriminant function. The closer the Wilks' lambda to zero, the more the variable contributes to the discriminant function. According to the test result, at the 0.05 level two significant dimensions for the linear discriminations are mean size and sorting. Finally, the bi-plot between canonical variable 1 and canonical variable 2 visually represents the two distinct fields - Coastal dune and Desert dune (figure- 5). Discussion: Coastal dune of Konark: In case of coastal dune, the coarsening of grain-size at lee can be attributed to the selective elimination and winnowing of finer grains from the lee, as the finer fractions are removed, the mean size shifted to the coarser side leading to the coarsening of the mean size. The irregular pattern of the mode value from the stoss to crest to lee can also be attributed to the selective elimination of different size fractions while on transport. Coastal dune sands are platy to leptokurtic distributed and desert sands are leptokurtic distributed which can probably be attributed to bimodality of sediment input supply that makes the coastal dune less leptokurtic and moderately well sorted although Kasper-Zubillaga et al 2 found moderately well sorted and leptokurtic coastal dune sands in north-western Mexico. The grain-size distribution pattern has been shown (table-3). From the computed error in three model distributions, it is observed that out of 23 samples, 12 (52.17%) samples fit best to log-skew-Laplace, eight (34.78%) to log-hyperbolic and only three (13.04%) to log-normal, although section-wise five (50%) fits best to log-skew-Laplace on stoss, five (62.5%) skew-Laplace on crest but three (60%) fits best to hyperbolic on lee side. Therefore, while critically examining the grain-size distribution pattern on coastal dune, it is more logical to take different sections from the stoss to crest to lee of the dune because of the different sorting pattern vis-à-vis selective elimination of the size fraction during the transporting process. The weight percentages of three different size fractions chosen arbitrarily (coarse, intermediate and the fine) on the dune surface at different positions from the stoss to crest to lee have been critically studied to interpret how the symmetry index changes gradually due to selective elimination of different size fractions (table -3). Desert dune of Thar: In case of the desert sands of the Thar, there is a slight narrow range of the intermediate size fraction as compared to the coarser and finer fractions, although the overall grain-size variation is within a narrow range. In the crest, finer fractions are comparatively wider in size variation than its coarser fractions having poor sorting than it’s coarser and intermediate size fractions. This pattern of grain-size variation gradually changes from the coarser to intermediate to finer fractions.
Comparative study: A comparative study was made based on grain-size variation curves (Figures 6a and 6b) to elucidate the influence of both the marine and the aeolian processes operative on the coastal dune sands and only the aeolian processes on the desert dune sands. For the sands of the coastal dune (figure- 6a), it appears that there is a wide range of size variation at the stoss side as compared to the crest and lee side. Sorting is poor on stoss side whereas at crest and lee, sorting improves with a relatively narrow range of size variation and best sorting develops on the crest. When the frequency distribution curves of the three sections i.e., stoss, crest and lee, are superposed, it clearly indicates the deposition of coarser fractions at the stoss side by selective segregation and winnowing of the finer fractions from the crest. This, in turn, reflects the dynamics of size sorting process of the coastal dune sands. In case of the desert sands (figure- 6b), there is a slight narrow range of the intermediate size fraction as compared to the coarser and finer fractions, although the overall grain-size variation is within a narrow range. This reflects probably a relatively higher energy condition operating on the desert environmental set-up than that of the coastal zone. In the crest, finer fractions are comparatively wider in size variation than its coarser fractions having poor sorting. This pattern of grain-size variation gradually changes from the coarser to intermediate to finer fractions being better sorted in the intermediate size fractions as observed both in the stoss and lee sides. The preponderance of finer fractions in the desert sands reflects relatively longer distance of transport of the finer materials in the desert environmental set-up than that of coastal dunes. This, in turn, reflects the dynamics of the size-sorting process of the desert sands. The total mean and mode sizes of the 15 stoss side samples are 2.80φ and 2.79φ respectively, with sorting of 0.33φ, skewness 0.17 and kurtosis 1.24. The 12 samples from the crest have a mean of 2.73 φ and mode of 2.73φ, the sorting is 0.31 φ, skewness is 0.13 and kurtosis 1.26. The mean and mode for the 24 lee samples was 2.86 φ and 2.76φ respectively, sorting was 0.29, skewness 0.15 and kurtosis 1.24. This demonstrates that the sediment of the lee side is finer and better sorted than that of the stoss and crests. Desert dune sands are slightly positively skewed indicating the preponderance of the finer sands and the slightly leptokurtic distribution (kurtosis value > 1) is probably suggestive of reworking of sediments in a high energy regime. It is observed that overall the log-hyperbolic distribution is the best-fit statistical model for desert dune sands, although the lognormal distribution fits best in the lee side and the log-hyperbolic distribution fits best both on the crest and stoss sides. Thus, from the angle of distribution models, it can be said that the log-skew-Laplace is the best-fit statistical model for coastal dune sands and the log-hyperbolic is the best-fit statistical model for desert dune sands (figure-7a, 7b)

International Research Journal of Earth Sciences____________________________________________________ ISSN 2321–2527 Vol. 3(8), 14-31, August (2015) Int. Res. J. Earth Sci.
International Science Congress Association 23
Figure-6 Superposition of grain-size frequency curves to identify the grain size variation on the dune surface at different sectors from
stoss to crest to lee: a) coastal dune, b) desert dune
Figure-7 Bar diagrams showing the % of occurrences of different model distributions: a) for individuel sector from stoss to crest to
leesides, b) for the entire coastal and desert dunes Thus, while examining the grain-size distribution pattern of dune sands, it is more logical to take different sections from the stoss to crest to lee of the dune because of the different sorting pattern vis-à-vis selective elimination of the size fraction during the aeolian transport process. The Thar Desert exhibits a dry arid climate in contrast to a humid and sticky coastal climate of the Konark. Sand dunes in hot deserts are generally devoid of vegetation and therefore more active, while the dunes along the coasts of humid areas are vegetated and stabilized. Coastal dune sands are influenced by aeolian and marine processes whereas desert sands are influenced only by the aeolian processes. The longer fetch of transport from the source sediment caused the desert sands to be relatively finer than the coastal dune sands.
The mechanism of grain-sorting has been studied (figure-8). In case of coastal dune sands, initially all the three size fractions of coarse, intermediate and fine sands are deposited on the stoss side showing a balance in three size fractions which leads to a symmetric pattern between the left (coarser) and the right (finer) asymptotes developing a narrow range of symmetry index of 1.58. Due to the gradual elimination of coarse materials from the stoss during transportation, an imbalance in the three size fractions takes place causing an increase in the symmetry index (2.19) i.e. more asymmetric in size distribution at the crest. Here the intermediate and fine fractions dominate leading to more asymmetric pattern. Due to the selective elimination of the coarser fraction and winnowing effect of the finer fractions, % of the intermediate size fraction increases leading to the decrease of the symmetry index to 1.45 i.e generating improvement of symmetric pattern between the two asymptotes.

International Research Journal of Earth Sciences____________________________________________________ ISSN 2321–2527 Vol. 3(8), 14-31, August (2015) Int. Res. J. Earth Sci.
International Science Congress Association 24
When the results of analysis of surface and the subsurface samples of the coastal dune are combined, the mean grain-size gradually becomes finer from the stoss to the crest of the dune. Average mean grain-size, sorting and the mode at stoss are 1.15 φ, 0.90 φ and 0.97 φ respectively and at the crest 1.17 φ, 0.84 φ and 1.07 φ respectively whereas at the lee it becomes finer with mean size 1.31 φ, sorting 0.85φ and mode value 1.18φ. This can be attributed to the selective elimination of coarser grain gradually while on transport from the stoss to crest with the height of the dune. Successively this finer trend persisted to the lee sides. The mode value also shifted towards finer side. Almost all the samples show positive skewness value indicating of preponderance of finer fractions vis-s-vis relatively low energy of deposition. Many investigators studied the sensitivity of skewness to several sedimentary environments43-45. Negative skewness can be produced and equated to high energy environment due to winnowing of finer materials. Areas
characterized by no particular dominance of either positive or negative skewness are regions where winnowing may be effective intermittently. In contrast, where energy levels are low, positive skewness develops. In other ways, negatively skewed curves are indicative of areas of erosion or non-deposition, whereas positively skewed curves indicate deposition. A mixture of positive and negatively skewed curves would then indicate a region in a state of flux 45. In this study, some of the samples at the stoss side show platykurtic distribution of grain-size but all the samples at crest to lee show leptokurtic distribution indicating a narrow range of size variation and better sorting within the intermediate size fractions. The results of the present study provide a comprehensive picture of the mechanism of grain-sorting on the coastal and desert dunes sands vis-à-vis environmental implication and discrimination. Such a hypothesis of size-sorting can possibly be generalized to other depositional sedimentary environments where similar mechanism prevails.
Figure-8 Schematic diagram showing the different stages of the mechanism of grain

International Research Journal of Earth Sciences____________________________________________________ ISSN 2321–2527 Vol. 3(8), 14-31, August (2015) Int. Res. J. Earth Sci.
International Science Congress Association 25
Table-1 Textural parameters of coastal dune sands
Position on dune
Sample No
Mode
(φ)
Mean
(φ)
Sorting (φ)
Median (φ)
D65 (φ)
Skewness Kurtosis Platykurtic Mesokurtic Leptokurtic
+ve -ve zero > 0 <1 1 >1-2 >2-3
>3
Stoss surface No of samples (n1)= 5
DS1A 1.41 1.39 0.80 1.39 1.09 -0.003 0.96 DS2A 0.53 2.19 0.98 2.13 1.75 0.01 0.83 DS3A 1.25 0.68 0.82 0.65 0.35 0.13 1.05 DS4A 0.08 0.77 1.16 0.65 0.25 0.25 1.11 DS5A 0.55 1.22 0.92 1.20 0.86 0.11 1.13
Average 0.76 1.25 0.93 1.20 0.86 0.13 -0.003 0.89 1.10
Stoss Sub-surface No of samples (n2)= 5
DS1B 1.71 1.87 0.85 1.78 1.53 0.12 1.07 DS2B 0.44 0.42 0.93 0.31 0.06 0.24 1.05 DS3B 1.65 0.39 0.75 0.35 0.10 0.16 1.16 DS4B 0.36 0.61 0.81 0.59 0.23 0.05 0.85
DS5B 1.78 1.96 1 1.91 1.58 0.06 0.98
Average 1.18 1.05 0.87 0.98 0.70 0.12 0.92 1.09 Total no of samples (N= n1+n2)
0.97 1.15 0.90 1.09 0.78 0.12 -0.003 0.91 1.09
Crest surface No of samples (n1)= 4
DC1A 1.11 1.25 0.92 1.28 0.85 0.05 1.18\ DC2A 1.24 1.19 1.01 1.11 0.78 0.19 1.54 DC3A 1.38 1.31 0.96 1.25 0.91 0.13 1.09
DC4A 1.26 1.27 0.74 1.26 0.98 0.08 1.23
Average 1.24 1.26 0.91 1.23 0.88 0.11 1.26
Crest Sub-Surface No of samples (n2)= 4
DC1B 1.08 0.86 0.86 0.82 0.68 0.15 1.04 DC2B 0.70 1.38 0.92 1.36 1.05 0.06 1.26 DC3B 1.18 1.19 0.78 1.18 0.89 0.09 1.11
DC4B 0.68 0.91 0.58 0.82 0.54 0.32 1.26
Average 0.91 1.09 0.78 1.04 0.79 0.15 1.16
Total no of samples (N= n1+n2)
1.08 1.17 0.85 1.14 0.84 0.13 1.22
Lee Surface No of samples (n1)= 2
DL1A 1.25 1.38 1.05 1.30 0.91 0.13 1.13
DL2A 1.06 1.09 0.80 1.02 0.77 0.23 1.13
Average 1.16 1.24 0.92 1.16 0.84 0.18 1.13 Lee Sub-surface No of samples (n2)= 3
DL1B 0.86 1.09 0.77 1.17 0.79 -0.0871 1.15
DL2B 1.26 1.27 0.74 1.26 0.98 0.08 1.234
DL3B 1.53 1.80 0.75 1.67 1.45 0.28 1.317
Average 1.22 1.38 0.76 1.37 1.07 0.18 -0.087 1.232 Total no of samples (N= n1+n2)
1.18 1.31 0.85 1.26 0.96 0.18 -0.087 1.179

International Research Journal of Earth Sciences____________________________________________________ ISSN 2321–2527 Vol. 3(8), 14-31, August (2015) Int. Res. J. Earth Sci.
International Science Congress Association 26
Table-2 Parameter estimates in three hypothesized model distributions for the Coastal dune sands with corresponding error (E) in
each distribution
Section Sample no
Log-normal Log-hyperbolic Log-skew-Laplace
Computed error (E) in three hypothesized distribution
Log-normal
Log-hyperbolic
Log-skew-
Laplace μN σ μH γ1 γ2 δ μL α β
STO
SS (N
= 10
)
DS1A 1.39 0.80 1.61 4.71 2.99 -0.89 1.33 0.47 1 0.62 0.43 0.39 *
DS1B 1.87 0.85 2.30 2.78 2.68 -37.44 1.09 0.23 1.49 0.61* 2.1 0.96
DS2A 2.19 0.98 1.89 4.42 2.20 -0.49 1.05 0.24 1.87 0.55* 0.79 1.13
DS2B 0.42 0.93 0.69 3.66 2.31 -2.64 0.55 0.62 1.03 0.72 0.53 0.32*
DS3A 0.68 0.82 0.72 5.85 2.78 -0.50 0.30 0.32 1.19 1 0.68* 0.69
DS3B 0.39 0.74 0.56 5.10 2.49 -0.53 0.39 0.41 0.95 1.04 0.46 0.36*
DS4A 0.77 1.16 3.96 0.55 1.78 5.67 0.45 0.49 1.31 0.96 1.74 0.32*
DS4B 0.61 0.81 0.77 4.57 2.81 -0.93 0.39 0.42 1.14 0.71 0.58 0.43*
DS5A 1.22 0.92 1.13 5.34 1.75 0.18 0.14 0.14 1.74 1.69 0.56* 0.69
DS5B 1.96 1 2.18 2.57 2.01 -3.26 1.17 0.32 1.60 0.47 0.39* 0.60
Out of 10 no of samples, no of times won; Average error 2(20%) 0.91 3(30%) 0.95 5(50%)
0.81
CR
EST
(N=8
)
DC1A 1.25 0.92 1.17 5.90 1.94 -0.09 0.15 0.15 1.74 2.25 0.57 0.44*
DC1B 0.86 0.86 0.78 5.76 2.52 -0.20 0.22 0.25 1.40 0.90 0.89 0.71*
DC2A 1.19 1 1.14 5.38 1.74 -0.10 0.18 0.17 1.74 2.70 0.61 0.56*
DC2B 1.38 0.92 1.63 4.40 2.89 -1.21 0.11 0.12 1.88 0.81 0.38* 1.09
DC3A 1.31 0.95 1.60 4.17 2.42 -1.31 0.13 0.13 1.17 0.46* 0.48 0.80
DC3B 1.19 0.78 1.78 3.03 3.10 51.13 1.47 0.58 0.81 0.68 3.52 0.29*
DC4A 1.27 0.74 1.74 3.48 2.99 -6.34 1.43 0.52 0.86 0.69 1.36 0.30*
DC4B 0.91 0.58 1.12 5.24 2.16 -0.97 1.72 0.74 0.49 1.54 0.50* 0.74
Out of 8 no of samples, no of times won; Average error 1
(12.5%) 1.36
2 (25%) 1.23
5 (62.5%)
0.88
LEE
(N=5
)
DL1A 1.38 1.04 1.29 5.28 1.94 -0.07 0.16 0.16 1.88 2.07 0.50* 0.64
DL1B 1.09 0.77 1.56 4.98 3.79 -3.63 0.11 0.12 1.57 0.88 0.87* 1.64
DL2A 1.09 0.80 1.57 2.78 2.44 -10.87 1.60 0.73 0.74 0.66 1.98 0.26*
DL2B 1.27 0.74 1.74 3.48 2.99 -6.38 1.43 0.52 0.86 0.69 1.36 0.30*
DL3B 1.39 0.80 1.88 4.12 2.23 -1.13 1.11 0.17 1.31 0.62 0.39* 0.87
Out of 5 no of samples, no of times won; Average error 0
(0%) 0.99
3 (60%) 1.67
2 (40%) 1.05

International Research Journal of Earth Sciences____________________________________________________ ISSN 2321–2527 Vol. 3(8), 14-31, August (2015) Int. Res. J. Earth Sci.
International Science Congress Association 27
Table-3 Weight frequency % of three size classes with symmetry index and the best-fit
Dune Environment
and character
Total no. of
samples
Position on dune
Weight % in three size classes Symmetry
Index (γ1˜γ2)
No of times won
Coarse (1.5-2.5
φ)
Intermediate (2.5-3.5 φ)
Fine (3.5-5
φ)
Log-normal
Log-hyperbolic
Log-Laplace
Desert transverse-
dune 15 Stoss 15.35 79.72 4.92 5.82 1
(6.66%) 14
(93.33%) Nil
12 Crest 21.07 75.18 3.77 6.20 Nil 11 (91.67%)
1 (8.33%)
24 Lee 8.45 87.57 3.98 1.16 13 (54.17%)
8 (33.33%)
3 (12.5%)
Coarse
(-1 to +1 φ)
Intermediate (2 to 3 φ)
Fine (4 to 5
φ
Coastal fore-dune 10 Stoss 15.63 22.84 3.71 1.58 2
(20%) 3
(30%) 5
(50%)
8 Crest 14.95 25.20 2.36 2.19 1 (12.5%) 2 (25%)
5 (62.5%)
5 Lee 12.32 28.56 2.96 1.45 0 (0%)
3 (60%)
2 (40%)
Conclusion Coastal dune sands exhibit a wide range of size variation within the intermediate size fraction as compared to the coarser and finer fractions of the stoss side. Sorting is poor in the stoss side. Both on lee and stoss sides, sorting improve with a relatively narrow range of size variation. In case of the desert sands, there is a slight narrow range of the intermediate size fraction as compared to the coarser and finer fractions, although the overall grain-size variation is within a narrow range. In the crest, finer fractions are comparatively wider in size variation than its coarser fractions having poor sorting than it’s coarser and intermediate size fractions. For coastal dune sands, out of 10 samples at stoss except one, skewness is positive for all samples; out of eight samples at crest, all positive; and out of five samples at lee, three positive, and two negative. Out of 10 samples at stoss, four platykurtic and six leptokurtic; all the eight at crest are leptokurtic and all the five at lee are also leptokurtic The frequent change of skewness from positive to negative probably suggestive of the fluctuation of energy level from low to high. The simultaneous change of kurtosis value from the platy to leptokurtic is possibly indicative of the occasional reworking of sediments.
Desert dune sands are all positively skewed and leptokurtic. The slightly positively skewed distribution indicates the preponderance of the finer sands and the slightly leptokurtic distribution (kurtosis value > 1) is probably suggestive of reworking of sediments in a high energy regime. The log-skew-Laplace distribution is the best-fit statistical model for coastal dune sands whereas the log-hyperbolic distribution is the best-fit statistical model for desert dune sands. There is a narrow range of symmetry index for the coastal dune sands whereas for desert dune sands a wider range of symmetry index is observed. This can be attributed to the poorer sorting pattern within the two end members i.e. coarser and the finer fractions of the desert sands than the coastal sands. Statistical tests indicate that mean and sorting are the most significant parameters to differentiate the sands of desert and the coastal dunes but skewness and kurtosis do not have any role in such differentiation. Therefore, it can be said that skewness and kurtosis are not totally an environmental sensitive parameters, rather they reflect the hydrodynamic conditions of the depositional regimes.

International Research Journal of Earth Sciences____________________________________________________ ISSN 2321–2527 Vol. 3(8), 14-31, August (2015) Int. Res. J. Earth Sci.
International Science Congress Association 28
Table-4 Comparison of textural parameters between coastal and desert dune sands
Textural parameters at different positions Coastal dune of Orissa Desert dune of Thar (Rajasthan)
Mean size (φ)
Stoss 1.25 (No of samples, n=5) 2.80 (n=15)
Crest 1.26 (n=4) 2.73(n=12)
Lee 1.16 (n=2) 2.86(n=24)
Sorting (φ)
Stoss 0.93 0.33
Crest 0.91 0.31
Lee 0.92 0.29
Skewness
Stoss Four (+ve), One ( –ve) All +ve (0.17)
Crest Four (+ve) All +ve (0.13)
Lee Two (+ve) All +ve (0.15)
Kurtosis
Stoss Mostly leptokurtic except two platykurtic All leptokurtic (KG=1.24)
Crest All leptokurtic All leptokurtic (KG=1.26)
Lee All leptokurtic All leptokurtic (KG=1.24)
γ1
Stoss 4.18 11.78
Crest 4.73 12.12
Lee 4.04 7.93
γ2
Stoss 2.30 5.95
Crest 2.28 5.92
Lee 2.19 6.77
Symmetry index
(γ1~ γ2)
Stoss 1.87 6.014
Crest 2.45 6.206
Lee 1.84 2.020
Best-fit distribution
model
Stoss (surface samples)
Out of five, log-normal-one, log-hyperbolic- two, log-skew-Laplace- two
Out of 15, log-normal-one, log-hyperbolic-14, log-Laplace-nil
Crest ( surface samples)
Out of four, log-normal-one, log-hyperbolic-nil,
log-skew-Laplace-three
Out of 12, log-normal-nil, log-hyperbolic-11, log-Laplace-one
Lee (surface samples)
Out of two, log-normal-nil, log-hyperbolic-one,
log-skew-Laplace-one
Out of 24, log-normal-13, log-hyperbolic-eight, log-Laplace-three
For entire dune Log-skew- Laplace Log-hyperbolic
International Research Journal of Earth Sciences____________________________________________________ ISSN 2321–2527 Vol. 3(8), 14-31, August (2015) Int. Res. J. Earth Sci.
International Science Congress Association 29
Table-5 Results of ANOVA test showing between and within group variance for individual textural parameters
Variables Between group variance Within group variance F- Value P- value
Mean Size 41.565 0.071 582.512 0.00
Sorting 4.962 0.006 904.064 0.00
Skewness 0.031 0.014 2.240 0.14
Kurtosis 10491.224 23216.066 0.452 0.50
Table-6
Results of Tukey multiple mean comparison test explaining the pair-wise variation of textural parameters for coastal and desert dune
Variables Mean Difference
(MD)
Standard error of mean (SEM)
q -Value (q= √2(MD/ SEM)
Probability (P) value
Meansize of desert vs Mean of coastal
1.619 0.067 34.132 4.02E-08
Sorting of desert vs Sorting of coastal
-0.559 0.019 42.522 4.02E-08
Skewness of desert vs Skewness of coastal
0.044 0.030 2.116 1.39E-01
Kurtosis of desert vs Kurtosis of coastal
25.726 38.270 0.950 5.04E-01
Table-7
Summary of the results of canonical discriminant analysis showing the efficiency of individual textural parameters in discriminating coastal and desert dune sands
Variables Eigenvalue Percentage of Variance
Canonical Correlation
Wilks' Lambda
Chi-square df P- value
Mean Size 30.153 99.21% 0.983 0.025 248.817 20 1.97E-41
Sorting 0.214 0.71% 0.420 0.802 14.970 12 0.243
Skewness 0.021 0.07% 0.144 0.974 1.767 6 0.940
Kurtosis 0.004 0.02% 0.070 0.995 0.337 2 0.845 Acknowledgement The laboratory facilities were provided by the Department of Geography and Environment Management of the Vidyasagar University. Thanks are due to S/Swagata Bera and U. Bhandari for assisting graphic inputs. Other infrastructural facilities were provided by the Department of Geology, University of Calcutta. Comments from Kasper-Zubillaga JJ, on an earlier version of the manuscript were very useful in modifying the manuscript. References 1. Kasper-Zubillaga JJ, Carranza-Edwards A. Grain size
discrimination between sands of desert and coastal dunes from northwestern Mexico, Revista Mexicana de Ciencias Geológicas (22), 383-390 (2005)
2. Kasper-Zubillaga JJ, Zolezzi-Ruíz H, Carranza-Edwards A, Girón-García P, Ortiz-Zamora G, Palma M. Sedimentological, modal analysis and geochemical studies of desert and coastal dunes, Altar Desert, NW Mexico, Earth Surface Processes and Landforms, (32), 489-508 (2007)
3. Purkait B. The use of grain-size distribution patterns to elucidate aeolian processes on a transverse dune of Thar Desert, India. Earth Surface Processes and Landforms, (35), 525-530 (2010)
4. Purkait B, Majumdar DD. Distinguishing different sedimentary facies in a deltaic system, Sedimentary Geology, (308), 53-62 (2014)

International Research Journal of Earth Sciences____________________________________________________ ISSN 2321–2527 Vol. 3(8), 14-31, August (2015) Int. Res. J. Earth Sci.
International Science Congress Association 30
5. Kar A. Cluster analysis of grain size information for possible linkages between geomorphic environments: some case studies studies from Indian arid zone (with 6 figures and 5 tables), Zeitschrift fur Geomorphologie, (43), 27-40 (1999)
6. Kasper-Zubillaga J J, Dickinson W W. Discriminating depositional environments of sands from modern source terranes using modal analysis, Sedimentary Geology, (143), 149-167 (2001)
7. Livingstone I, Bullard JE, Wiggs GF, Thomas DS. Grain-size variation on dunes in the Southwest Kalahari, Southern Africa, Journal of sedimentary research, (69), 546-552 (1999)
8. Lancaster N. Grain size characteristics of Namib Desert linear dunes, Sedimentology, (28) 115-122 (1981)
9. Livingstone I. Grain-size variation on a ‘complex’linear dune in the Namib Desert. Geological Society, London, Special Publications, (35), 281-291 (1987)
10. Lancaster N, Nickling W, McKenna Neuman C. Particle size and sorting characteristics of sand in transport on the stoss slope of a small reversing dune, Geomorphology, (43), 233-242 (2002)
11. Bagnold R A. The physics of blown sand and desert dunes, Courier Dover Publications (2012)
12. Willetts B, Rice M. Collision in aeolian transport: the saltation/creep link, Aeolian geomorphology, 1-17 (1986a)
13. Willetts B, Rice M. Collisions in aeolian saltation, Acta Mechanica, (63), 255-265 (1986b)
14. Anderson RS, Hallet B., Sediment transport by wind: toward a general model, Geological Society of America Bulletin, (97), 523-535 (1986)
15. Shao Y. Physics and modelling of wind erosion, Springer (2008)
16. Draga M. Eolian activity as a consequence of beach nourishment-observations at Westerland (Sylt), German North Sea coast, Zeitschrift für Geomorphologie, 303-319 (1983)
17. Van Dijk P. Wind erosion measurements on Schiermonnikoog: A study with acoustic sensors and sediment catchers, Report, (1990)
18. Greeley R, Blumberg DG and Williams SH, Field measurements of the flux and speed of wind‐blown sand, Sedimentology, (43), 41-52 (1996)
19. Van der Wai D. Grain-size-selective aeolian sand transport on a nourished beach, Journal of Coastal Research, 896-908 (2000)
20. Arens SM, Van Boxel JH and Abuodha JOZ, Changes in grain size of sand in transport over a foredune, Earth Surface Processes and Landforms, (27), 1163-1175 (2002)
21. Xing M, The harmonious character in equilibrium aeolian transport on mixed sand bed, Geomorphology, (86), 230-242 (2007)
22. Williams G., Some aspects of the eolian saltation load, Sedimentology, 3, 257-287 (1964)
23. Farrell EJ, Sherman DJ, Ellis JT and Li B, Vertical distribution of grain size for windblown sand, Aeolian Research, (7), 51-61 (2012)
24. Zhu BQ, Yu JJ, Rioual P, Ren X Z. Particle size variation of aeolian dune deposits in the lower reaches of the Heihe River basin, China, Sedimentary Geology, (301), 54-69 (2014)
25. Krumbein WC, Size frequency distributions of sediments and the normal phi curve, Journal of Sedimentary Research, (8), 84-90 (1938)
26. Bagnold RA and Barndorff‐Nielsen O., The pattern of natural size distributions, Sedimentology, (27), 199-207 (1980)
27. Hartmann D., The Goodness-of-Fit to Ideal Gauss and Rosin Distributions: A New Grain-size Parameter: DISCUSSION, Journal of Sedimentary Research, (58), 913-917 (1988)
28. Fieller N, Gilbertson D and Olbricht W., A new method for environmental analysis of particle size distribution data from shoreline sediments, Nature, (311), 648-651 (1984)
29. Barndorff-Nielsen O., Exponentially decreasing distributions for the logarithm of particle size, Proceedings of the Royal Society of London, A Mathematical and Physical Sciences, (353), 401-419 (1977)
30. Barndorff‐Nielsen O, Dalsgaard K, Halgreen C, Kuhlman H, Møller JT, Schou G., Variation in particle size distribution over a small dune, Sedimentology, (29), 53-65 (1982)
31. Wyrwoll KH, Smyth G., On using the log-hyperbolic distribution to describe the textural characteristics of eolian sediments, Journal of Sedimentary Research, (55), 471-478 (1985)
32. Christiansen C and Hartmann D., The hyperbolic distribution. Principles, Methods and Application of Particle Size Analysis, Cambridge: Cambridge University Press (1991)
33. Walker IJ. Secondary airflow and sediment transport in the lee of a reversing dune, Earth Surface Processes and Landforms, (24), 437-448 (1999)
34. Neuman CM, Lancaster N, Nickling W. The effect of unsteady winds on sediment transport on the stoss slope of a transverse dune, Silver Peak, NV, USA, Sedimentology, (47), 211-226 (2000)
35. Abuodha JOZ, Grain size distribution and composition of modern dune and beach sediments, Malindi Bay coast,

International Research Journal of Earth Sciences____________________________________________________ ISSN 2321–2527 Vol. 3(8), 14-31, August (2015) Int. Res. J. Earth Sci.
International Science Congress Association 31
Kenya, Journal of African Earth Sciences, (36), 41-54 (2003)
36. Bishop M A. A distribution‐free statistical method for the spatial characterization of dune granulometry: an example from the Strzelecki Desert, South Australia, Earth Surface Processes and Landforms, (29), 125-131 (2004)
37. Purkait B., Coastal erosion in response to wave dynamics operative in Sagar Island, Sundarban delta, India, Frontiers of Earth Science in China, (3), 21-33 (2009)
38. Folk RL and Ward WC, Brazos River bar: a study in the significance of grain size parameters, Journal of Sedimentary Research, (27), 3-26 (1957)
39. Einstein HA, The bed-load function for sediment transportation in open channel flows, US Department of Agriculture, (1950)
40. Fieller N, Flenley E and Olbricht W, Statistics of particle size data, Applied Statistics, 127-146 (1992)
41. Ghosh JK, Mazumder B, Saha M and Sengupta S, Deposition of sand by suspension currents: experimental and theoretical studies, Journal of Sedimentary Research, (56), 57-66 (1986)
42. Purkait B, Patterns of grain-size distribution in some point bars of the Usri River, India, Journal of Sedimentary Research, (72), 367-375 (2002)
43. Mason CC, Folk RL. Differentiation of beach, dune, and aeolian flat environments by size analysis, Mustang Island, Texas, Journal of Sedimentary Petrology, (28), 211-226 (1958)
44. Friedman GM, Distinction between dune, beach, and river sands from their textural characteristics, Journal of Sedimentary Research, (31), 514-529 (1961)
45. Duane DB, Significance of skewness in recent sediments, western Pamlico Sound, North Carolina, Journal of Sedimentary Research, (34), 864-874 (1964)