grain transportation report - ams.usda.gov · transportation modernization act (bill c-49),...
TRANSCRIPT
A weekly publication of the Agricultural Marketing Service www.ams.usda.gov/GTR
June 14, 2018
Contents
Article/ Calendar
Grain
Transportation Indicators
Rail
Barge
Truck
Exports
Ocean
Brazil
Mexico
Grain Truck/Ocean Rate Advisory
Datasets
Specialists
Subscription Information
--------------
The next release is
June 21, 2018
Preferred citation: U.S. Dept. of Agriculture, Agricultural Marketing Service. Grain Transportation Report. June 14, 2018. Web: http://dx.doi.org/10.9752/TS056.06-14-2018
Grain Transportation Report
WEEKLY HIGHLIGHTS
Total Grain Inspections Continue to Slide…
For the week ending June 7, total inspections of grain (corn, wheat, and soybeans) for export from all major U.S. export regions
reached 2.5 million metric tons (mmt), down 2 percent from the previous week, unchanged from last year, and 33 percent above the 3-
year average. Although total grain inspections continued to decrease, wheat and soybean inspections increased 6 and 12 percent,
respectively, from the previous week. In the Pacific Northwest (PNW), inspections of grain dropped 7 percent, but inspections
increased 5 percent in the Mississippi Gulf. Outstanding export sales are up from the previous week for wheat, but down for corn and
soybeans.
…but Atlantic and Great Lakes Exports Above-Average
Year-to-date inspections of grain (corn, wheat, soybeans) for export, from the Great Lakes and Atlantic export regions, are up notably
from the same time last year. Total year-to-date inspections of grain are up 21 percent from last year in the Atlantic, and up 13 percent
in the Great Lakes. During the last four weeks, Atlantic grain inspections were 148 percent above last year and 104 percent above the
3-year average. During the last four weeks, Great Lakes inspections increased 22 percent from last year and 63 percent from the 3-
year average. About 88 percent of Atlantic grain inspections were soybeans, with over half of these shipments destined to Asia. Great
Lakes inspections were mostly corn and wheat, destined primarily for Europe and Africa.
Canadian Pacific Announces Purchase of Grain Hopper Cars According to a June 7 press release, Canadian Pacific Railway (CP) announced plans to invest more than $500 million on new high-
capacity grain hopper cars. This translates into approximately 5,900 hopper cars over the next four years, of which 500 are expected to
enter service in 2018. The new hopper cars can hold 15 percent more volume and 10 percent more weight than existing cars, adding
16 percent more overall capacity to its grain unit trains. CP has operations in the U.S., originating about 98,000 carloads of grain and
oilseeds in 2017 (about 7 percent of all Class I operations in the U.S.). The CP announcement follows the passage of Canada’s
Transportation Modernization Act (Bill C-49), reported in last week’s GTR, which encouraged similar new investment by Canadian
National Railway in its grain hopper fleet.
Snapshots by Sector
Export Sales
For the week ending May 31, unshipped balances of wheat, corn, and soybeans totaled 26.6 mmt, up 34 percent from the same time
last year. As the marketing year ended, net weekly wheat export sales were negative .019 mmt from the previous week. Net corn
export sales were .836 mmt, down 16 percent from the previous week. Net soybean export sales were .165 mmt, down 40 percent
from the previous week.
Rail
U.S. Class I railroads originated 22,537 grain carloads for the week ending June 2, down 13 percent from the previous week and 1
percent from last year, but up 13 percent from the 3-year average.
Average June shuttle secondary railcar bids/offers, per car, were $163 above tariff for the week ending June 7, down $117 from last
week, and $342 higher than last year. There were no non-shuttle bids/offers this week.
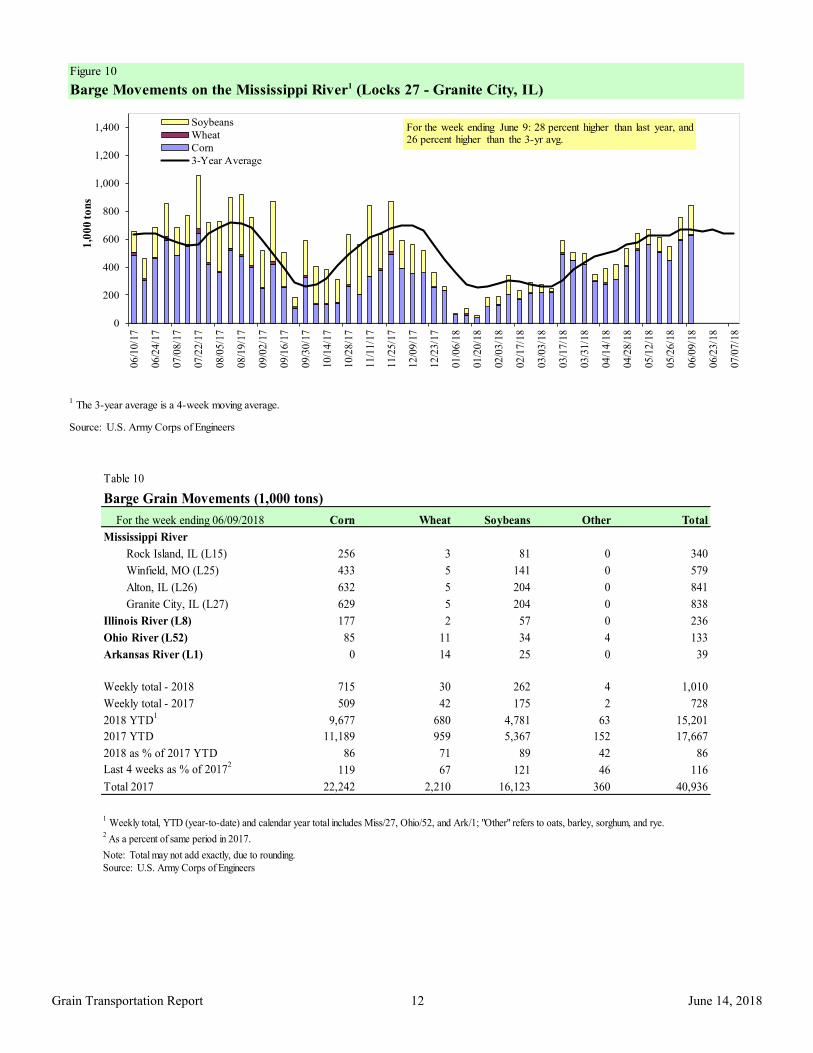
Barge For the week ending June 9, barge grain movements totaled 1,009,831 tons, 3 percent higher than the previous week, and up 39
percent from the same period last year.
For the week ending June 9, 649 grain barges moved down river, 34 barges more than the previous week. There were 843 grain
barges unloaded in New Orleans, 24 percent higher than the previous week.
Ocean
For the week ending June 7, 31 ocean-going grain vessels were loaded in the Gulf, 3 percent less than the same period last year.
Forty-two vessels are expected to be loaded within the next 10 days, 24 percent less than the same period last year.
For the week ending June 7, the ocean freight rate for shipping bulk grain, from the Gulf to Japan, was $43.00 per metric ton, 2
percent more than the previous week. The cost of shipping, from the PNW to Japan, was $24.50 per metric ton, 1 percent more than
the previous week.
Fuel
For the week ending June 11, the U.S. average diesel fuel price decreased 2 cents from the previous week to $3.27 per gallon, 74
cents higher than the same week last year.
Contact Us
June 14, 2018
Grain Transportation Report 2
Feature Article/Calendar
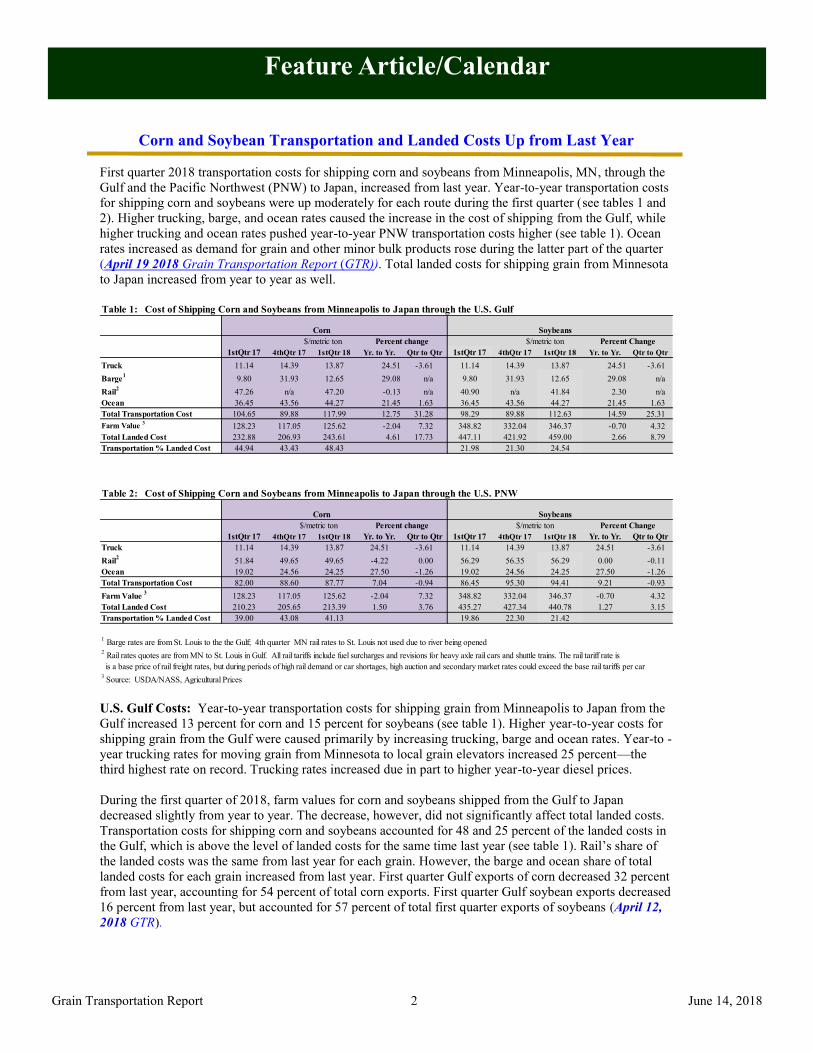
Corn and Soybean Transportation and Landed Costs Up from Last Year
First quarter 2018 transportation costs for shipping corn and soybeans from Minneapolis, MN, through the
Gulf and the Pacific Northwest (PNW) to Japan, increased from last year. Year-to-year transportation costs
for shipping corn and soybeans were up moderately for each route during the first quarter (see tables 1 and
2). Higher trucking, barge, and ocean rates caused the increase in the cost of shipping from the Gulf, while
higher trucking and ocean rates pushed year-to-year PNW transportation costs higher (see table 1). Ocean
rates increased as demand for grain and other minor bulk products rose during the latter part of the quarter
(April 19 2018 Grain Transportation Report (GTR)). Total landed costs for shipping grain from Minnesota
to Japan increased from year to year as well.
U.S. Gulf Costs: Year-to-year transportation costs for shipping grain from Minneapolis to Japan from the
Gulf increased 13 percent for corn and 15 percent for soybeans (see table 1). Higher year-to-year costs for
shipping grain from the Gulf were caused primarily by increasing trucking, barge and ocean rates. Year-to -
year trucking rates for moving grain from Minnesota to local grain elevators increased 25 percent—the
third highest rate on record. Trucking rates increased due in part to higher year-to-year diesel prices.
During the first quarter of 2018, farm values for corn and soybeans shipped from the Gulf to Japan
decreased slightly from year to year. The decrease, however, did not significantly affect total landed costs.
Transportation costs for shipping corn and soybeans accounted for 48 and 25 percent of the landed costs in
the Gulf, which is above the level of landed costs for the same time last year (see table 1). Rail’s share of
the landed costs was the same from last year for each grain. However, the barge and ocean share of total
landed costs for each grain increased from last year. First quarter Gulf exports of corn decreased 32 percent
from last year, accounting for 54 percent of total corn exports. First quarter Gulf soybean exports decreased
16 percent from last year, but accounted for 57 percent of total first quarter exports of soybeans (April 12,
2018 GTR).
Table 1: Cost of Shipping Corn and Soybeans from Minneapolis to Japan through the U.S. Gulf
Corn Soybeans
1stQtr 17 4thQtr 17 1stQtr 18 Yr. to Yr. Qtr to Qtr 1stQtr 17 4thQtr 17 1stQtr 18 Yr. to Yr. Qtr to Qtr
Truck 11.14 14.39 13.87 24.51 -3.61 11.14 14.39 13.87 24.51 -3.61
Barge1
9.80 31.93 12.65 29.08 n/a 9.80 31.93 12.65 29.08 n/a
Rail2
47.26 n/a 47.20 -0.13 n/a 40.90 n/a 41.84 2.30 n/a
Ocean 36.45 43.56 44.27 21.45 1.63 36.45 43.56 44.27 21.45 1.63
Total Transportation Cost 104.65 89.88 117.99 12.75 31.28 98.29 89.88 112.63 14.59 25.31
Farm Value 3
128.23 117.05 125.62 -2.04 7.32 348.82 332.04 346.37 -0.70 4.32
Total Landed Cost 232.88 206.93 243.61 4.61 17.73 447.11 421.92 459.00 2.66 8.79
Transportation % Landed Cost 44.94 43.43 48.43 21.98 21.30 24.54
Table 2: Cost of Shipping Corn and Soybeans from Minneapolis to Japan through the U.S. PNW
Corn Soybeans
1stQtr 17 4thQtr 17 1stQtr 18 Yr. to Yr. Qtr to Qtr 1stQtr 17 4thQtr 17 1stQtr 18 Yr. to Yr. Qtr to Qtr
Truck 11.14 14.39 13.87 24.51 -3.61 11.14 14.39 13.87 24.51 -3.61
Rail2
51.84 49.65 49.65 -4.22 0.00 56.29 56.35 56.29 0.00 -0.11
Ocean 19.02 24.56 24.25 27.50 -1.26 19.02 24.56 24.25 27.50 -1.26
Total Transportation Cost 82.00 88.60 87.77 7.04 -0.94 86.45 95.30 94.41 9.21 -0.93
Farm Value 3
128.23 117.05 125.62 -2.04 7.32 348.82 332.04 346.37 -0.70 4.32
Total Landed Cost 210.23 205.65 213.39 1.50 3.76 435.27 427.34 440.78 1.27 3.15
Transportation % Landed Cost 39.00 43.08 41.13 19.86 22.30 21.42
1 Barge rates are from St. Louis to the the Gulf; 4th quarter MN rail rates to St. Louis not used due to river being opened
2 Rail rates quotes are from MN to St. Louis in Gulf. All rail tariffs include fuel surcharges and revisions for heavy axle rail cars and shuttle trains. The rail tariff rate is
is a base price of rail freight rates, but during periods of high rail demand or car shortages, high auction and secondary market rates could exceed the base rail tariffs per car3
Source: USDA/NASS, Agricultural Prices
$/metric ton Percent change $/metric ton Percent Change
$/metric ton Percent change $/metric ton Percent Change

June 14, 2018
Grain Transportation Report 3
Pacific Northwest Costs: Total transportation costs from Minneapolis, MN, via the PNW to Japan,
decreased 1 percent for corn and soybeans from quarter to quarter (see table 2). Quarter-to-quarter rates
were down slightly for trucking and ocean shipping. Due to higher trucking and ocean rates, year-to-year
transportation costs for shipping grain from the PNW to Japan increased 7 percent for corn and 9 percent
for soybeans. Compared to last year, PNW rail rates were unchanged for corn and soybeans.
First quarter total landed costs in the PNW increased 4 percent for corn and 3 percent for soybeans from
quarter to quarter, due to higher farm values. Higher transportation costs pushed year-to-year landed costs
up 2 percent for corn and 1 percent for soybeans (see table 2). First quarter transportation costs for grain
shipped through the PNW accounted for 41 percent of the total landed costs for corn and 21 percent for
soybeans, which is a slight decrease from the previous quarter for each Total first quarter corn exports in
the PNW reached a record 4.5 mmt, up 24 percent from last year and accounting for about 33 percent of
total corn exports (April 12, 2018 GTR). PNW soybean exports increased 10 percent from last year as
demand from Asia remained steady. Soybean exports through the PNW accounted for approximately 27
percent of total soybean exports during the first quarter. [email protected]

June 14, 2018
Grain Transportation Report 4
Grain Transportation Indicators
The grain bid summary illustrates the market relationships for commodities. Positive and negative adjustments in differential be-
tween terminal and futures markets, and the relationship to inland market points, are indicators of changes in fundamental market
supply and demand. The map may be used to monitor market and time differentials.
Table 2
Market Update: U.S. Origins to Export Position Price Spreads ($/bushel)
Commodity Origin--Destination 6/8/2018 6/1/2018
Corn IL--Gulf -0.84 -0.83
Corn NE--Gulf -0.88 -0.93
Soybean IA--Gulf -1.20 -1.24
HRW KS--Gulf -1.67 -1.67
HRS ND--Portland -2.11 -2.06
Note: nq = no quote; n/a = not available
Source: Transportation & Marketing Programs/AMS/USDA
Table 1
Grain Transport Cost Indicators1
Truck Barge Ocean
For the week ending Unit Train Shuttle Gulf Pacific
06/13/18 219 276 221 316 192 174-1% -10 0 % 6 % 2 % 1%
06/06/18 220 296 226 297 188 172
Source: Transportation & Marketing Programs/AMS/USDA
Rail
1Indicator: Base year 2000 = 100; Weekly updates include truck = diesel ($/gallon); rail = near-month secondary rail market bid and
monthly tariff rate with fuel surcharge ($/car); barge = Illinois River barge rate (index = percent of tariff rate); and ocean = routes to Japan ($/metric ton)
Figure 1 Grain Bid Summary
June 14, 2018
Grain Transportation Report 5
Rail Transportation
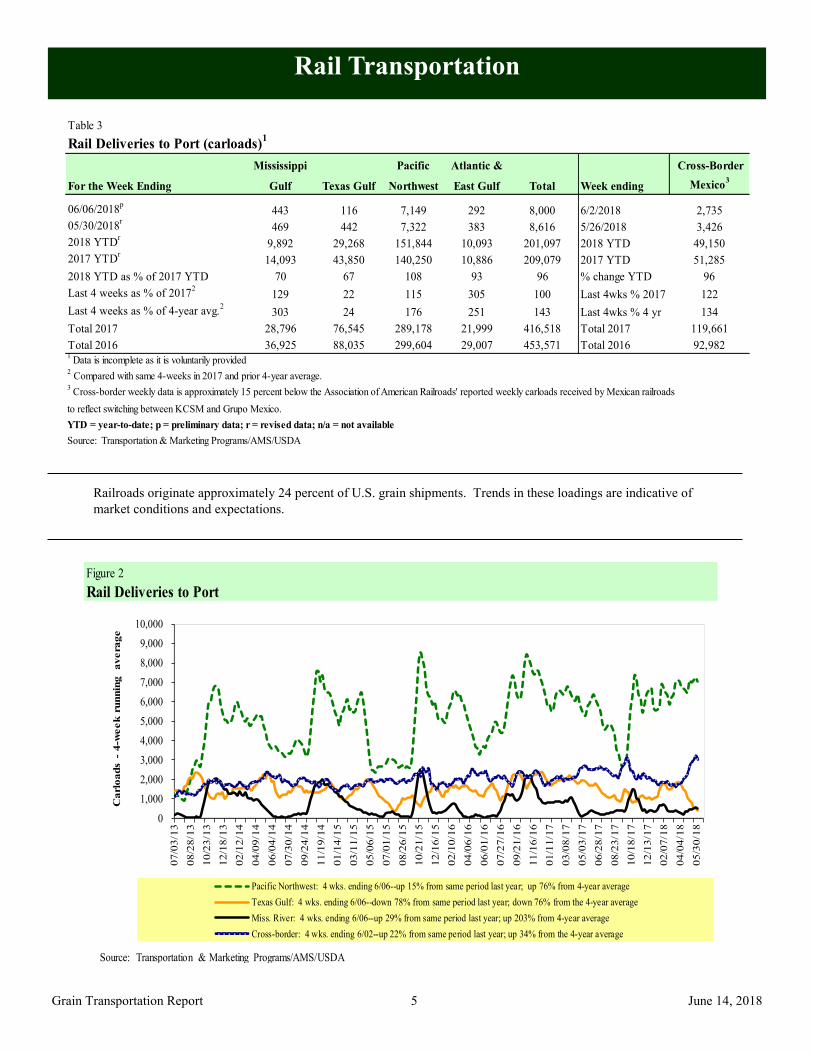
Railroads originate approximately 24 percent of U.S. grain shipments. Trends in these loadings are indicative of
market conditions and expectations.
Figure 2
Rail Deliveries to Port
0
1,000
2,000
3,000
4,000
5,000
6,000
7,000
8,000
9,000
10,000
07
/03
/13
08/2
8/1
3
10
/23
/13
12
/18
/13
02
/12
/14
04
/09
/14
06
/04
/14
07
/30
/14
09/2
4/1
4
11
/19
/14
01/1
4/1
5
03
/11
/15
05/0
6/1
5
07
/01
/15
08
/26
/15
10
/21
/15
12
/16
/15
02/1
0/1
6
04
/06
/16
06/0
1/1
6
07
/27
/16
09/2
1/1
6
11
/16
/16
01
/11
/17
03
/08
/17
05
/03
/17
06
/28
/17
08
/23
/17
10/1
8/1
7
12
/13
/17
02/0
7/1
8
04
/04
/18
05/3
0/1
8
Ca
rlo
ad
s -
4-w
eek
ru
nn
ing
a
vera
ge
Pacific Northwest: 4 wks. ending 6/06--up 15% from same period last year; up 76% from 4-year average
Texas Gulf: 4 wks. ending 6/06--down 78% from same period last year; down 76% from the 4-year average
Miss. River: 4 wks. ending 6/06--up 29% from same period last year; up 203% from 4-year average
Cross-border: 4 wks. ending 6/02--up 22% from same period last year; up 34% from the 4-year average
Source: Transportation & Marketing Programs/AMS/USDA
Table 3
Rail Deliveries to Port (carloads)1
Mississippi Pacific Atlantic & Cross-Border
For the Week Ending Gulf Texas Gulf Northwest East Gulf Total Week ending Mexico3
06/06/2018p
443 116 7,149 292 8,000 6/2/2018 2,735
05/30/2018r
469 442 7,322 383 8,616 5/26/2018 3,426
2018 YTDr
9,892 29,268 151,844 10,093 201,097 2018 YTD 49,150
2017 YTDr
14,093 43,850 140,250 10,886 209,079 2017 YTD 51,285
2018 YTD as % of 2017 YTD 70 67 108 93 96 % change YTD 96
Last 4 weeks as % of 20172
129 22 115 305 100 Last 4wks % 2017 122
Last 4 weeks as % of 4-year avg.2
303 24 176 251 143 Last 4wks % 4 yr 134
Total 2017 28,796 76,545 289,178 21,999 416,518 Total 2017 119,661
Total 2016 36,925 88,035 299,604 29,007 453,571 Total 2016 92,9821
Data is incomplete as it is voluntarily provided2 Compared with same 4-weeks in 2017 and prior 4-year average.
3 Cross-border weekly data is approximately 15 percent below the Association of American Railroads' reported weekly carloads received by Mexican railroads
to reflect switching between KCSM and Grupo Mexico.
YTD = year-to-date; p = preliminary data; r = revised data; n/a = not available
Source: Transportation & Marketing Programs/AMS/USDA
June 14, 2018
Grain Transportation Report 6
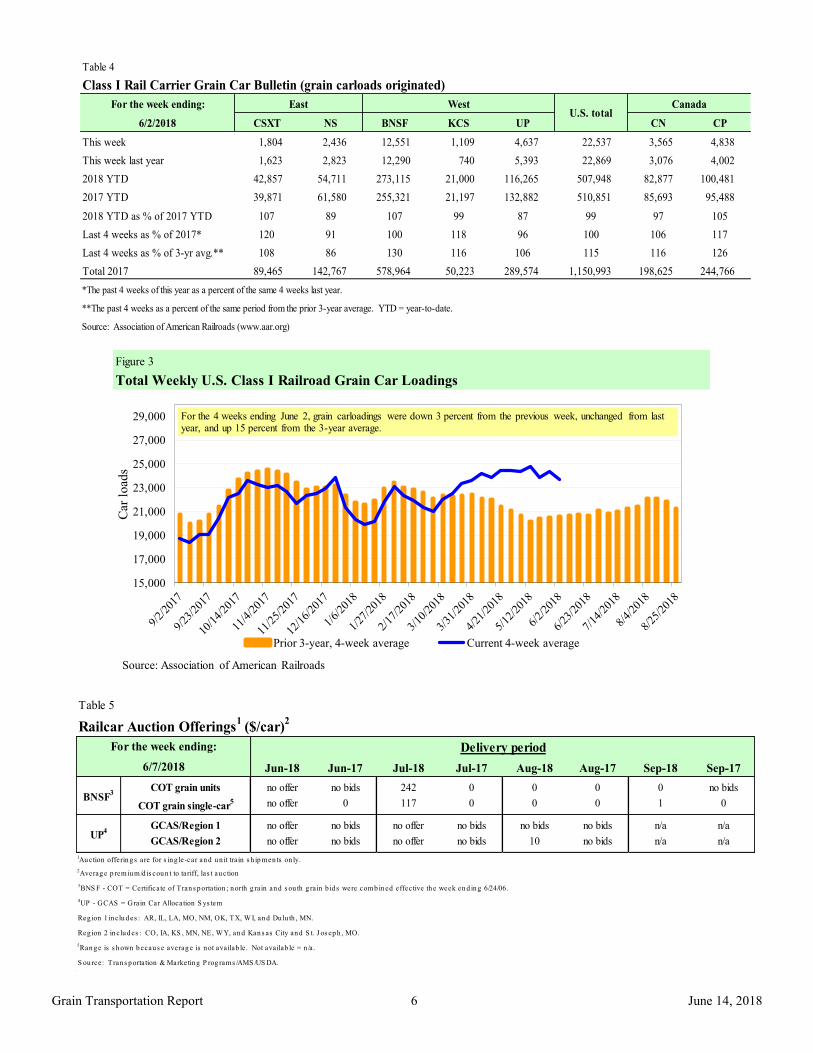
Table 4
Class I Rail Carrier Grain Car Bulletin (grain carloads originated)
For the week ending:
6/2/2018 CSXT NS BNSF KCS UP CN CP
This week 1,804 2,436 12,551 1,109 4,637 22,537 3,565 4,838
This week last year 1,623 2,823 12,290 740 5,393 22,869 3,076 4,002
2018 YTD 42,857 54,711 273,115 21,000 116,265 507,948 82,877 100,481
2017 YTD 39,871 61,580 255,321 21,197 132,882 510,851 85,693 95,488
2018 YTD as % of 2017 YTD 107 89 107 99 87 99 97 105
Last 4 weeks as % of 2017* 120 91 100 118 96 100 106 117
Last 4 weeks as % of 3-yr avg.** 108 86 130 116 106 115 116 126
Total 2017 89,465 142,767 578,964 50,223 289,574 1,150,993 198,625 244,766
*The past 4 weeks of this year as a percent of the same 4 weeks last year.
**The past 4 weeks as a percent of the same period from the prior 3-year average. YTD = year-to-date.
Source: Association of American Railroads (www.aar.org)
East WestU.S. total
Canada
Table 5
Railcar Auction Offerings1
($/car)2
Jun-18 Jun-17 Jul-18 Jul-17 Aug-18 Aug-17 Sep-18 Sep-17
COT grain units no offer no bids 242 0 0 0 0 no bids
COT grain single-car5 no offer 0 117 0 0 0 1 0
GCAS/Region 1 no offer no bids no offer no bids no bids no bids n/a n/a
GCAS/Region 2 no offer no bids no offer no bids 10 no bids n/a n/a
1Au ction offerin g s are for s in g le-car an d u n it train s h ip m en ts on ly.
2Averag e p rem iu m /d is cou n t to tariff, las t au ction
3BNS F - COT = Certificate of Tran s p ortation ; n orth g rain an d s ou th g rain b id s were com b in ed effective th e week en d in g 6/24/06.
4UP - GCAS = Grain Car Allocation S ys tem
Reg ion 1 in clu d es : AR, IL, LA, MO, NM, OK, TX, W I, an d Du lu th , MN.
Reg ion 2 in clu d es : CO, IA, KS , MN, NE, W Y, an d Kan s as City an d S t. J os ep h , MO.
5Ran g e is s h own b ecau s e averag e is n ot availab le . Not availab le = n /a .
S ou rce: Tran s p ortation & Marketin g P rog ram s /AMS /US DA.
UP4
Delivery period
BNSF3
For the week ending:
6/7/2018
Figure 3
Total Weekly U.S. Class I Railroad Grain Car Loadings
15,000
17,000
19,000
21,000
23,000
25,000
27,000
29,000
Car
loads
Prior 3-year, 4-week average Current 4-week average
For the 4 weeks ending June 2, grain carloadings were down 3 percent from the previous week, unchanged from last year, and up 15 percent from the 3-year average.
Source: Association of American Railroads
June 14, 2018
Grain Transportation Report 7
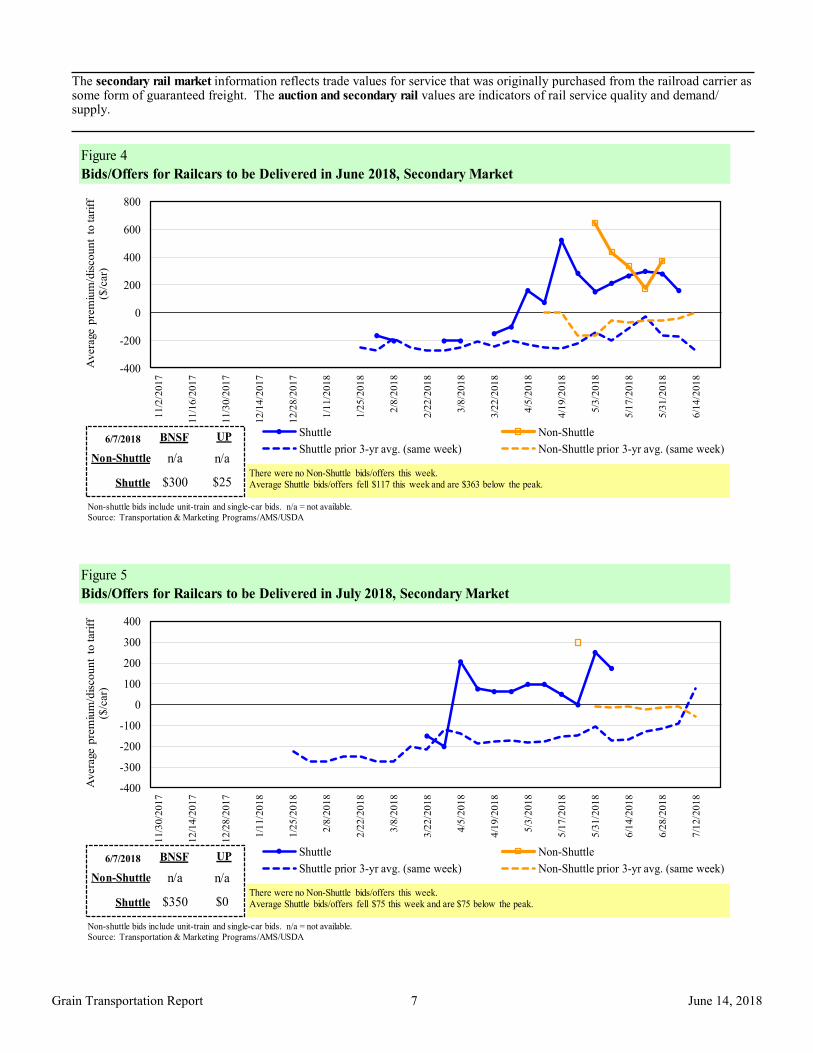
The secondary rail market information reflects trade values for service that was originally purchased from the railroad carrier as some form of guaranteed freight. The auction and secondary rail values are indicators of rail service quality and demand/supply.
Figure 4
Bids/Offers for Railcars to be Delivered in June 2018, Secondary Market
-400
-200
0
200
400
600
800
11/2
/201
7
11/1
6/2
017
11/3
0/2
01
7
12/1
4/2
017
12/2
8/2
017
1/1
1/2
018
1/2
5/2
018
2/8
/20
18
2/2
2/2
018
3/8
/20
18
3/2
2/2
018
4/5
/20
18
4/1
9/2
018
5/3
/20
18
5/1
7/2
018
5/3
1/2
01
8
6/1
4/2
018
Av
era
ge p
rem
ium
/dis
co
un
t to
tari
ff
($/c
ar)
Shuttle Non-Shuttle
Shuttle prior 3-yr avg. (same week) Non-Shuttle prior 3-yr avg. (same week)6/7/2018
Non-shuttle bids include unit-train and single-car bids. n/a = not available.
Source: Transportation & Marketing Programs/AMS/USDA
n/a
UPBNSF
$300
n/a
$25Shuttle
Non-Shuttle
There were no Non-Shuttle bids/offers this week.Average Shuttle bids/offers fell $117 this week and are $363 below the peak.
Figure 5
Bids/Offers for Railcars to be Delivered in July 2018, Secondary Market
-400
-300
-200
-100
0
100
200
300
400
11/3
0/2
01
7
12/1
4/2
017
12/2
8/2
01
7
1/1
1/2
018
1/2
5/2
018
2/8
/20
18
2/2
2/2
018
3/8
/20
18
3/2
2/2
018
4/5
/20
18
4/1
9/2
018
5/3
/20
18
5/1
7/2
018
5/3
1/2
01
8
6/1
4/2
018
6/2
8/2
01
8
7/1
2/2
018
Av
era
ge p
rem
ium
/dis
co
un
t to
tari
ff
($/c
ar)
Shuttle Non-Shuttle
Shuttle prior 3-yr avg. (same week) Non-Shuttle prior 3-yr avg. (same week)6/7/2018
Non-shuttle bids include unit-train and single-car bids. n/a = not available.
Source: Transportation & Marketing Programs/AMS/USDA
n/a
UPBNSF
$350
n/a
$0Shuttle
Non-Shuttle
There were no Non-Shuttle bids/offers this week.Average Shuttle bids/offers fell $75 this week and are $75 below the peak.
June 14, 2018
Grain Transportation Report 8
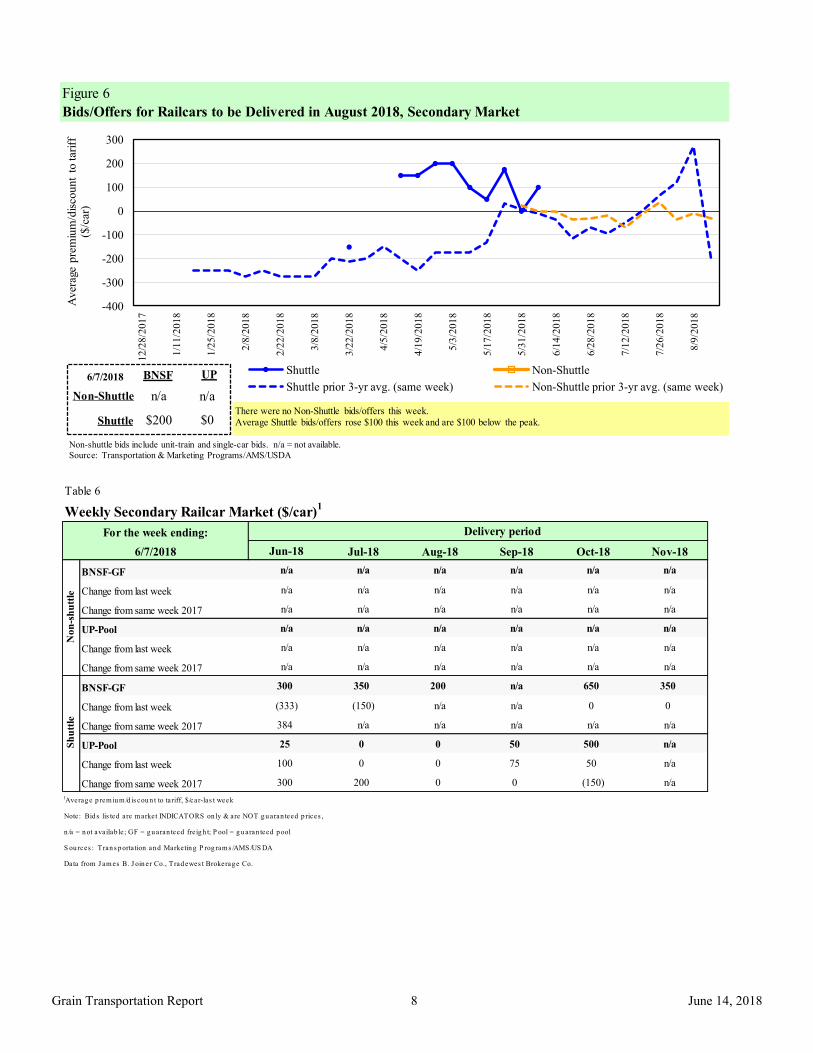
Figure 6
Bids/Offers for Railcars to be Delivered in August 2018, Secondary Market
-400
-300
-200
-100
0
100
200
3001
2/2
8/2
01
7
1/1
1/2
01
8
1/2
5/2
01
8
2/8
/2018
2/2
2/2
01
8
3/8
/2018
3/2
2/2
01
8
4/5
/2018
4/1
9/2
01
8
5/3
/2018
5/1
7/2
01
8
5/3
1/2
01
8
6/1
4/2
01
8
6/2
8/2
01
8
7/1
2/2
01
8
7/2
6/2
01
8
8/9
/2018
Aver
age
pre
miu
m/d
isco
unt
to tar
iff
($/c
ar)
Shuttle Non-Shuttle
Shuttle prior 3-yr avg. (same week) Non-Shuttle prior 3-yr avg. (same week)6/7/2018
Non-shuttle bids include unit-train and single-car bids. n/a = not available.
Source: Transportation & Marketing Programs/AMS/USDA
n/a
UPBNSF
$200
n/a
$0Shuttle
Non-Shuttle
There were no Non-Shuttle bids/offers this week.Average Shuttle bids/offers rose $100 this week and are $100 below the peak.
Table 6
Weekly Secondary Railcar Market ($/car)1
Jun-18 Jul-18 Aug-18 Sep-18 Oct-18 Nov-18
BNSF-GF n/a n/a n/a n/a n/a n/a
Change from last week n/a n/a n/a n/a n/a n/a
Change from same week 2017 n/a n/a n/a n/a n/a n/a
UP-Pool n/a n/a n/a n/a n/a n/a
Change from last week n/a n/a n/a n/a n/a n/a
Change from same week 2017 n/a n/a n/a n/a n/a n/a
BNSF-GF 300 350 200 n/a 650 350
Change from last week (333) (150) n/a n/a 0 0
Change from same week 2017 384 n/a n/a n/a n/a n/a
UP-Pool 25 0 0 50 500 n/a
Change from last week 100 0 0 75 50 n/a
Change from same week 2017 300 200 0 0 (150) n/a
1Averag e p rem iu m /d is cou n t to tariff, $/car-las t week
Note: Bid s lis ted are m arket INDICATORS on ly & are NOT g u aran teed p rices ,
n /a = n ot availab le; GF = g u aran teed freig h t; P ool = g u aran teed p ool
S ou rces : Tran s p ortation an d Marketin g P rog ram s /AMS /US DA
Data from J am es B. J oin er Co., Trad ewes t Brokerag e Co.
Non
-sh
utt
le
For the week ending:
6/7/2018
Sh
utt
le
Delivery period
June 14, 2018
Grain Transportation Report 9
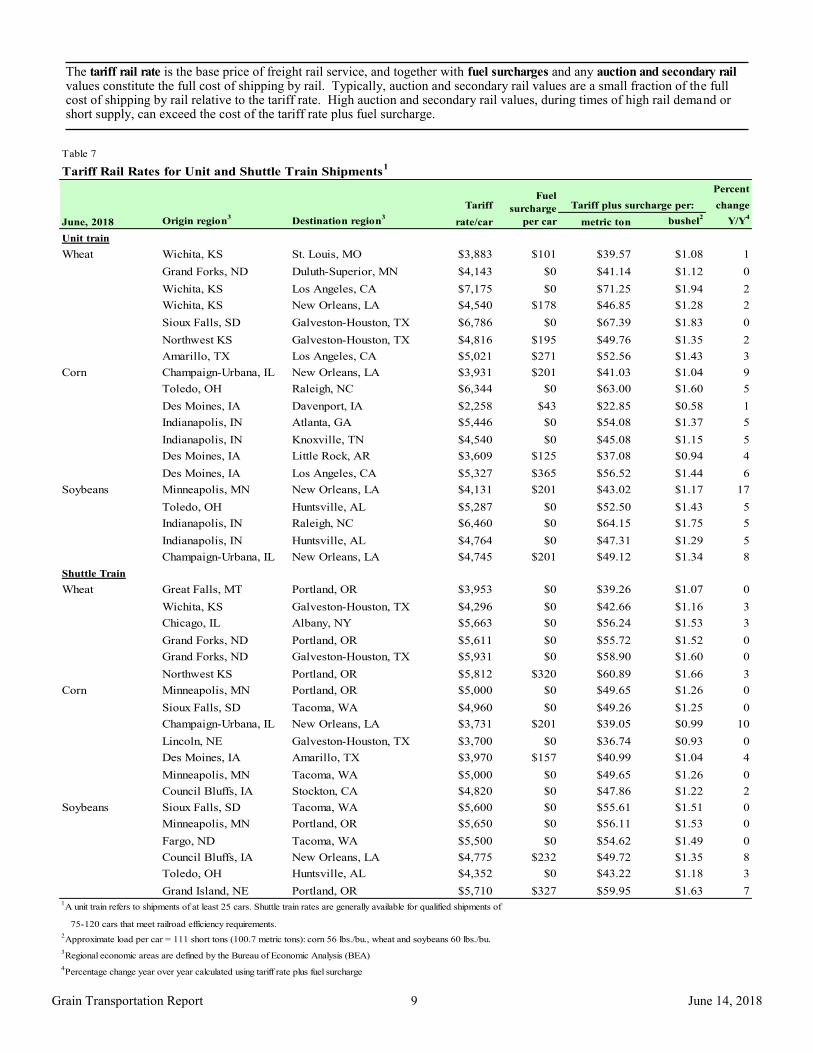
The tariff rail rate is the base price of freight rail service, and together with fuel surcharges and any auction and secondary rail values constitute the full cost of shipping by rail. Typically, auction and secondary rail values are a small fraction of the full cost of shipping by rail relative to the tariff rate. High auction and secondary rail values, during times of high rail demand or short supply, can exceed the cost of the tariff rate plus fuel surcharge.
Table 7
Tariff Rail Rates for Unit and Shuttle Train Shipments1
Percent
Tariff change
June, 2018 Origin region3
Destination region3
rate/car metric ton bushel2
Y/Y4
Unit train
Wheat Wichita, KS St. Louis, MO $3,883 $101 $39.57 $1.08 1
Grand Forks, ND Duluth-Superior, MN $4,143 $0 $41.14 $1.12 0
Wichita, KS Los Angeles, CA $7,175 $0 $71.25 $1.94 2
Wichita, KS New Orleans, LA $4,540 $178 $46.85 $1.28 2
Sioux Falls, SD Galveston-Houston, TX $6,786 $0 $67.39 $1.83 0
Northwest KS Galveston-Houston, TX $4,816 $195 $49.76 $1.35 2
Amarillo, TX Los Angeles, CA $5,021 $271 $52.56 $1.43 3
Corn Champaign-Urbana, IL New Orleans, LA $3,931 $201 $41.03 $1.04 9
Toledo, OH Raleigh, NC $6,344 $0 $63.00 $1.60 5
Des Moines, IA Davenport, IA $2,258 $43 $22.85 $0.58 1
Indianapolis, IN Atlanta, GA $5,446 $0 $54.08 $1.37 5
Indianapolis, IN Knoxville, TN $4,540 $0 $45.08 $1.15 5
Des Moines, IA Little Rock, AR $3,609 $125 $37.08 $0.94 4
Des Moines, IA Los Angeles, CA $5,327 $365 $56.52 $1.44 6
Soybeans Minneapolis, MN New Orleans, LA $4,131 $201 $43.02 $1.17 17
Toledo, OH Huntsville, AL $5,287 $0 $52.50 $1.43 5
Indianapolis, IN Raleigh, NC $6,460 $0 $64.15 $1.75 5
Indianapolis, IN Huntsville, AL $4,764 $0 $47.31 $1.29 5
Champaign-Urbana, IL New Orleans, LA $4,745 $201 $49.12 $1.34 8
Shuttle Train
Wheat Great Falls, MT Portland, OR $3,953 $0 $39.26 $1.07 0
Wichita, KS Galveston-Houston, TX $4,296 $0 $42.66 $1.16 3
Chicago, IL Albany, NY $5,663 $0 $56.24 $1.53 3
Grand Forks, ND Portland, OR $5,611 $0 $55.72 $1.52 0
Grand Forks, ND Galveston-Houston, TX $5,931 $0 $58.90 $1.60 0
Northwest KS Portland, OR $5,812 $320 $60.89 $1.66 3
Corn Minneapolis, MN Portland, OR $5,000 $0 $49.65 $1.26 0
Sioux Falls, SD Tacoma, WA $4,960 $0 $49.26 $1.25 0
Champaign-Urbana, IL New Orleans, LA $3,731 $201 $39.05 $0.99 10
Lincoln, NE Galveston-Houston, TX $3,700 $0 $36.74 $0.93 0
Des Moines, IA Amarillo, TX $3,970 $157 $40.99 $1.04 4
Minneapolis, MN Tacoma, WA $5,000 $0 $49.65 $1.26 0
Council Bluffs, IA Stockton, CA $4,820 $0 $47.86 $1.22 2
Soybeans Sioux Falls, SD Tacoma, WA $5,600 $0 $55.61 $1.51 0
Minneapolis, MN Portland, OR $5,650 $0 $56.11 $1.53 0
Fargo, ND Tacoma, WA $5,500 $0 $54.62 $1.49 0
Council Bluffs, IA New Orleans, LA $4,775 $232 $49.72 $1.35 8
Toledo, OH Huntsville, AL $4,352 $0 $43.22 $1.18 3
Grand Island, NE Portland, OR $5,710 $327 $59.95 $1.63 71A unit train refers to shipments of at least 25 cars. Shuttle train rates are generally available for qualified shipments of
75-120 cars that meet railroad efficiency requirements.
2Approximate load per car = 111 short tons (100.7 metric tons): corn 56 lbs./bu., wheat and soybeans 60 lbs./bu.
3Regional economic areas are defined by the Bureau of Economic Analysis (BEA)
4Percentage change year over year calculated using tariff rate plus fuel surcharge
Tariff plus surcharge per:Fuel
surcharge
per car

June 14, 2018
Grain Transportation Report 10
Figure 7
Railroad Fuel Surcharges, North American Weighted Average1
-$0.10
$0.00
$0.10
$0.20
$0.30
$0.40
$0.50
$0.60
$0.70
Dolla
rs p
er r
ailc
ar m
ile
3-Year Monthly Average
Fuel Surcharge* ($/mile/railcar)
June, 2018: $0.15, up 2 cents from last month's surcharge of $0.13/mile; up 10 cents from the June 2017 surcharge of $0.05/mile; and up 11 cents from the June prior 3-year average of $0.04/mile.
1 Weighted by each Class I railroad's proportion of grain traffic for the prior year. * Beginning January 2009, the Canadian Pacific fuel surcharge is computed by a monthly average of the bi-weekly fuel surcharge.
**CSX strike price changed from $2.00/gal. to $3.75/gal. starting January 1, 2015.Sources: www.bnsf.com, www.cn.ca, www.cpr.ca, www.csx.com, www.kcsi.com, www.nscorp.com, www.uprr.com
Table 8
Tariff Rail Rates for U.S. Bulk Grain Shipments to Mexico
Date: Percent
Tariff change4
Commodity Destination region rate/car1
metric ton3
bushel3
Y/Y
Wheat MT Chihuahua, CI $7,459 $0 $76.21 $2.07 0
OK Cuautitlan, EM $6,631 $139 $69.17 $1.88 1
KS Guadalajara, JA $7,309 $338 $78.13 $2.12 1
TX Salinas Victoria, NL $4,292 $85 $44.72 $1.22 1
Corn IA Guadalajara, JA $8,313 $307 $88.08 $2.24 3
SD Celaya, GJ $7,700 $0 $78.68 $2.00 2
NE Queretaro, QA $8,013 $291 $84.85 $2.15 3
SD Salinas Victoria, NL $6,743 $0 $68.90 $1.75 2
MO Tlalnepantla, EM $7,379 $284 $78.30 $1.99 3
SD Torreon, CU $7,300 $0 $74.59 $1.89 2
Soybeans MO Bojay (Tula), HG $8,134 $286 $86.03 $2.34 -5
NE Guadalajara, JA $8,692 $312 $92.00 $2.50 -2
IA El Castillo, JA $8,960 $0 $91.55 $2.49 0
KS Torreon, CU $7,489 $230 $78.86 $2.14 1
Sorghum NE Celaya, GJ $7,345 $284 $77.95 $1.98 4
KS Queretaro, QA $7,819 $174 $81.67 $2.07 4
NE Salinas Victoria, NL $6,452 $140 $67.35 $1.71 5
NE Torreon, CU $6,790 $221 $71.63 $1.82 41Rates are based upon published tariff rates for high-capacity shuttle trains. Shuttle trains are available for qualified
shipments of 75--110 cars that meet railroad efficiency requirements.2Fuel surcharge adjusted to reflect the change in Ferrocarril Mexicano, S.A. de C.V railroad fuel surcharge policy as of 10/01/2009
3Approximate load per car = 97.87 metric tons: Corn & Sorghum 56 lbs/bu, Wheat & Soybeans 60 lbs/bu
4Percentage change calculated using tariff rate plus fuel surchage
Sources: www.bnsf.com, www.uprr.com, www.kcsouthern.com
Fuel
surcharge
per car2
Tariff plus surcharge per:Origin
state
June, 2018

June 14, 2018
Grain Transportation Report 11
Barge Transportation
Figure 9 Benchmark tariff rates Calculating barge rate per ton: (Rate * 1976 tariff benchmark rate per ton)/100
Select applicable index from market quotes included in tables on this page. The 1976 benchmark rates per ton are provided in map.
Twin Cities 6.19
Mid-Mississippi 5.32
St. Louis 3.99
Cairo-Memphis 3.14
Illinois 4.64 Cincinnati 4.69
Lower Ohio 4.04
Figure 8
Illinois River Barge Freight Rate1,2
1Rate = percent of 1976 tariff benchmark index (1976 = 100 percent);
24-week moving average of the 3-year average.
Source: Transportation & Marketing Programs/AMS/USDA
0
200
400
600
800
1000
12000
6/1
3/1
7
06/2
7/1
7
07/1
1/1
7
07/2
5/1
7
08/0
8/1
7
08/2
2/1
7
09/0
5/1
7
09/1
9/1
7
10/0
3/1
7
10/1
7/1
7
10/3
1/1
7
11/1
4/1
7
11/2
8/1
7
12/1
2/1
7
12/2
6/1
7
01/0
9/1
8
01/2
3/1
8
02/0
6/1
8
02/2
0/1
8
03/0
6/1
8
03/2
0/1
8
04/0
3/1
8
04/1
7/1
8
05/0
1/1
8
05/1
5/1
8
05/2
9/1
8
06/1
2/1
8
Perc
en
t o
f ta
riff
Weekly rate
3-year avg. forthe week
For the week ending June 12: 6 percent higher than last week, 123 percent higher than last year, and 88 percent higher than the 3-year average.
Table 9
Weekly Barge Freight Rates: Southbound Only
Twin
Cities
Mid-
Mississippi
Lower
Illinois
River St. Louis Cincinnati
Lower
Ohio
Cairo-
Memphis
Rate1
6/12/2018 593 573 568 424 410 410 368
6/5/2018 575 558 535 438 413 413 375
$/ton 6/12/2018 36.71 30.48 26.36 16.92 19.23 16.56 11.56
6/5/2018 35.59 29.69 24.82 17.48 19.37 16.69 11.78
Current week % change from the same week:
Last year 87 120 123 132 113 113 119
3-year avg. 2
61 82 88 99 94 94 91-2 6 6
Rate1
July 539 485 485 375 360 360 323
September 536 525 525 460 525 525 450
Source: Transportation & Marketing Programs/AMS/USDA
1Rate = percent of 1976 tariff benchmark index (1976 = 100 percent);
24-week moving average; ton = 2,000 pounds; "-" = no quote
June 14, 2018
Grain Transportation Report 12
Figure 10
Barge Movements on the Mississippi River1 (Locks 27 - Granite City, IL)
1 The 3-year average is a 4-week moving average.
Source: U.S. Army Corps of Engineers
0
200
400
600
800
1,000
1,200
1,40006/1
0/1
7
06/2
4/1
7
07/0
8/1
7
07/2
2/1
7
08/0
5/1
7
08/1
9/1
7
09/0
2/1
7
09/1
6/1
7
09/3
0/1
7
10/1
4/1
7
10/2
8/1
7
11/1
1/1
7
11/2
5/1
7
12/0
9/1
7
12/2
3/1
7
01/0
6/1
8
01/2
0/1
8
02/0
3/1
8
02/1
7/1
8
03/0
3/1
8
03/1
7/1
8
03/3
1/1
8
04/1
4/1
8
04/2
8/1
8
05/1
2/1
8
05/2
6/1
8
06/0
9/1
8
06/2
3/1
8
07/0
7/1
8
1,0
00
to
ns
Soybeans
Wheat
Corn
3-Year Average
For the week ending June 9: 28 percent higher than last year, and26 percent higher than the 3-yr avg.
Table 10
Barge Grain Movements (1,000 tons)
For the week ending 06/09/2018 Corn Wheat Soybeans Other Total
Mississippi River
Rock Island, IL (L15) 256 3 81 0 340
Winfield, MO (L25) 433 5 141 0 579
Alton, IL (L26) 632 5 204 0 841
Granite City, IL (L27) 629 5 204 0 838
Illinois River (L8) 177 2 57 0 236
Ohio River (L52) 85 11 34 4 133
Arkansas River (L1) 0 14 25 0 39
Weekly total - 2018 715 30 262 4 1,010
Weekly total - 2017 509 42 175 2 728
2018 YTD1
9,677 680 4,781 63 15,201
2017 YTD 11,189 959 5,367 152 17,667
2018 as % of 2017 YTD 86 71 89 42 86
Last 4 weeks as % of 20172
119 67 121 46 116
Total 2017 22,242 2,210 16,123 360 40,936
2 As a percent of same period in 2017.
Source: U.S. Army Corps of Engineers
Note: Total may not add exactly, due to rounding.
1 Weekly total, YTD (year-to-date) and calendar year total includes Miss/27, Ohio/52, and Ark/1; "Other" refers to oats, barley, sorghum, and rye.
June 14, 2018
Grain Transportation Report 13
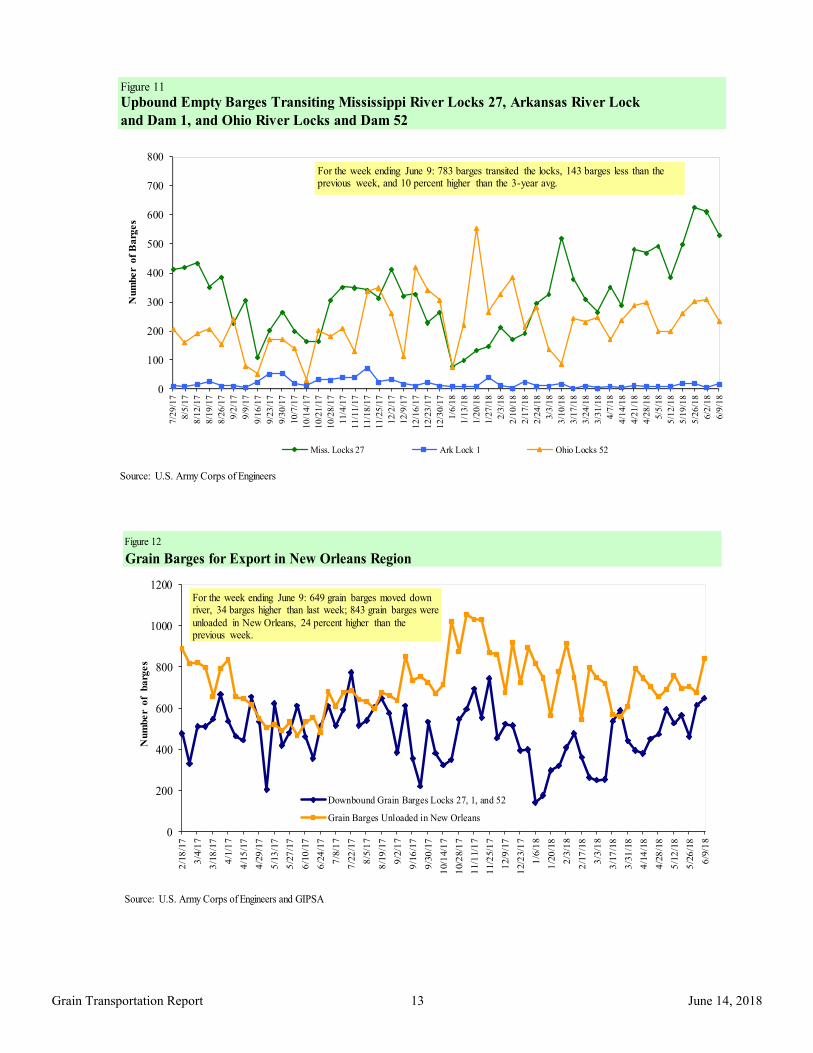
Figure 12
Grain Barges for Export in New Orleans Region
Source: U.S. Army Corps of Engineers and GIPSA
0
200
400
600
800
1000
1200
2/1
8/1
7
3/4
/17
3/1
8/1
7
4/1
/17
4/1
5/1
7
4/2
9/1
7
5/1
3/1
7
5/2
7/1
7
6/1
0/1
7
6/2
4/1
7
7/8
/17
7/2
2/1
7
8/5
/17
8/1
9/1
7
9/2
/17
9/1
6/1
7
9/3
0/1
7
10/1
4/1
7
10/2
8/1
7
11/1
1/1
7
11/2
5/1
7
12/9
/17
12/2
3/1
7
1/6
/18
1/2
0/1
8
2/3
/18
2/1
7/1
8
3/3
/18
3/1
7/1
8
3/3
1/1
8
4/1
4/1
8
4/2
8/1
8
5/1
2/1
8
5/2
6/1
8
6/9
/18
Downbound Grain Barges Locks 27, 1, and 52
Grain Barges Unloaded in New Orleans
Nu
mb
er
of
ba
rge
s
For the week ending June 9: 649 grain barges moved down river, 34 barges higher than last week; 843 grain barges were
unloaded in New Orleans, 24 percent higher than the previous week.
Figure 11
Source: U.S. Army Corps of Engineers
Upbound Empty Barges Transiting Mississippi River Locks 27, Arkansas River Lock
and Dam 1, and Ohio River Locks and Dam 52
0
100
200
300
400
500
600
700
800
7/2
9/1
7
8/5
/17
8/1
2/1
7
8/1
9/1
7
8/2
6/1
7
9/2
/17
9/9
/17
9/1
6/1
7
9/2
3/1
7
9/3
0/1
7
10/7
/17
10/1
4/1
7
10/2
1/1
7
10/2
8/1
7
11/4
/17
11/1
1/1
7
11/1
8/1
7
11/2
5/1
7
12/2
/17
12/9
/17
12/1
6/1
7
12/2
3/1
7
12/3
0/1
7
1/6
/18
1/1
3/1
8
1/2
0/1
8
1/2
7/1
8
2/3
/18
2/1
0/1
8
2/1
7/1
8
2/2
4/1
8
3/3
/18
3/1
0/1
8
3/1
7/1
8
3/2
4/1
8
3/3
1/1
8
4/7
/18
4/1
4/1
8
4/2
1/1
8
4/2
8/1
8
5/5
/18
5/1
2/1
8
5/1
9/1
8
5/2
6/1
8
6/2
/18
6/9
/18
Num
ber
of
Barg
es
Miss. Locks 27 Ark Lock 1 Ohio Locks 52
For the week ending June 9: 783 barges transited the locks, 143 barges less than the previous week, and 10 percent higher than the 3-year avg.

June 14, 2018
Grain Transportation Report 14
The weekly diesel price provides a proxy for trends in U.S. truck rates as diesel fuel is a significant expense for truck grain move-
ments.
Truck Transportation
Table 11
Change from
Region Location Price Week ago Year ago
I East Coast 3.264 -0.018 0.695
New England 3.292 -0.010 0.678
Central Atlantic 3.420 -0.022 0.709
Lower Atlantic 3.148 -0.018 0.689
II Midwest2 3.199 -0.025 0.745
III Gulf Coast3 3.037 -0.018 0.669
IV Rocky Mountain 3.344 -0.015 0.700
V West Coast 3.769 -0.015 0.964
West Coast less California 3.489 -0.019 0.808
California 3.990 -0.013 1.084
Total U.S. 3.266 -0.019 0.7421Diesel fuel prices include all taxes. Prices represent an average of all types of diesel fuel.
2Same as North Central
3Same as South Central
Source: Energy Information Administration/U.S. Department of Energy (www.eia.doe.gov)
Retail on-Highway Diesel Prices, Week Ending 6/11/2018 (US $/gallon)
Figure 13
Weekly Diesel Fuel Prices, U.S. Average
Source: Retail On-Highway Diesel Prices, Energy Information Administration, Dept. of Energy
$3.27 $2.52
$2.00
$2.10
$2.20
$2.30
$2.40
$2.50
$2.60
$2.70
$2.80
$2.90
$3.00
$3.10
$3.20
$3.30
12/1
1/20
17
12/1
8/20
17
12/2
5/20
17
1/1/
2018
1/8/
2018
1/15
/201
8
1/22
/201
8
1/29
/201
8
2/5/
2018
2/12
/201
8
2/19
/201
8
2/26
/201
8
3/5/
2018
3/12
/201
8
3/19
/201
8
3/26
/201
8
4/2/
2018
4/9/
2018
4/16
/201
8
4/23
/201
8
4/30
/201
8
5/7/
2018
5/14
/201
8
5/21
/201
8
5/28
/201
8
6/4/
2018
6/11
/201
8
$ pe
r ga
llon
Last Year Current YearFor the week ending June 11, the U.S. average diesel fuel price decreased 2 cents from the previous week at $3.27 per gallon, 74 cents above the same week last year.
June 14, 2018
Grain Transportation Report 15
Grain Exports
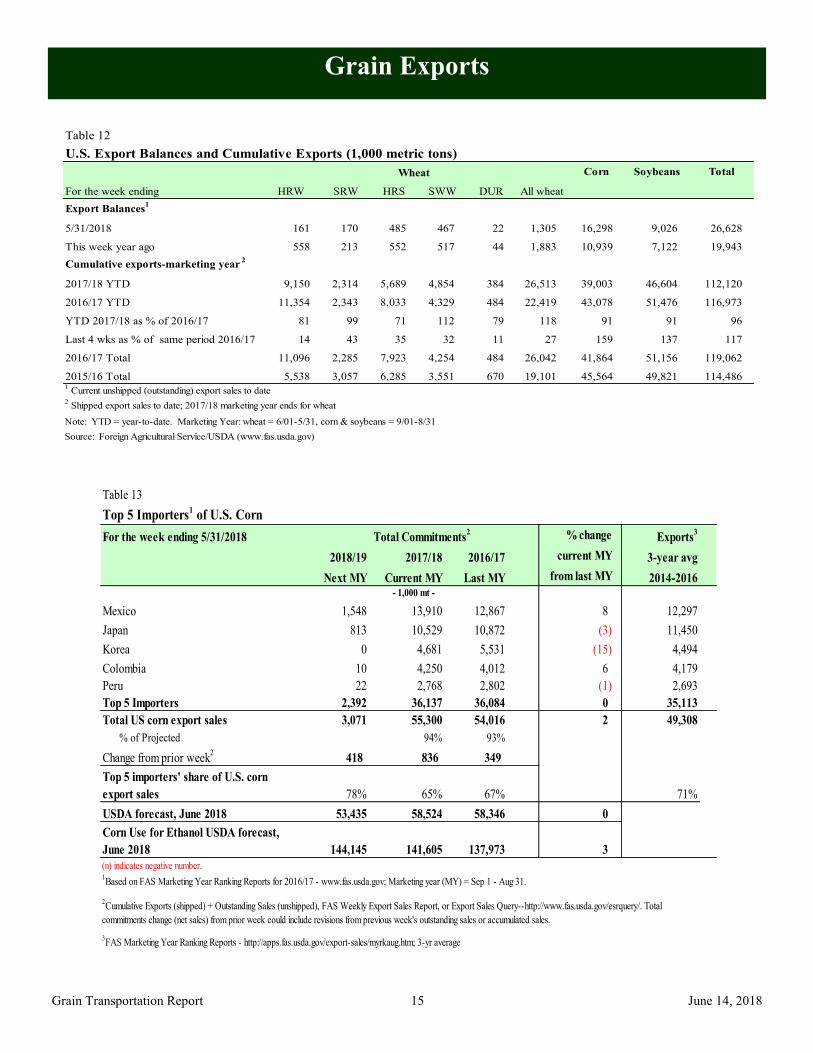
Table 12
U.S. Export Balances and Cumulative Exports (1,000 metric tons)
Wheat Corn Soybeans Total
For the week ending HRW SRW HRS SWW DUR All wheat
Export Balances1
5/31/2018 161 170 485 467 22 1,305 16,298 9,026 26,628
This week year ago 558 213 552 517 44 1,883 10,939 7,122 19,943
Cumulative exports-marketing year 2
2017/18 YTD 9,150 2,314 5,689 4,854 384 26,513 39,003 46,604 112,120
2016/17 YTD 11,354 2,343 8,033 4,329 484 22,419 43,078 51,476 116,973
YTD 2017/18 as % of 2016/17 81 99 71 112 79 118 91 91 96
Last 4 wks as % of same period 2016/17 14 43 35 32 11 27 159 137 117
2016/17 Total 11,096 2,285 7,923 4,254 484 26,042 41,864 51,156 119,062
2015/16 Total 5,538 3,057 6,285 3,551 670 19,101 45,564 49,821 114,4861 Current unshipped (outstanding) export sales to date
2 Shipped export sales to date; 2017/18 marketing year ends for wheat
Note: YTD = year-to-date. Marketing Year: wheat = 6/01-5/31, corn & soybeans = 9/01-8/31
Source: Foreign Agricultural Service/USDA (www.fas.usda.gov)
Table 13
Top 5 Importers1 of U.S. Corn
For the week ending 5/31/2018 % change Exports3
2018/19 2017/18 2016/17 current MY 3-year avg
Next MY Current MY Last MY from last MY 2014-2016
Mexico 1,548 13,910 12,867 8 12,297
Japan 813 10,529 10,872 (3) 11,450
Korea 0 4,681 5,531 (15) 4,494
Colombia 10 4,250 4,012 6 4,179
Peru 22 2,768 2,802 (1) 2,693
Top 5 Importers 2,392 36,137 36,084 0 35,113
Total US corn export sales 3,071 55,300 54,016 2 49,308
% of Projected 94% 93%
Change from prior week2
418 836 349
Top 5 importers' share of U.S. corn
export sales 78% 65% 67% 71%
USDA forecast, June 2018 53,435 58,524 58,346 0
Corn Use for Ethanol USDA forecast,
June 2018 144,145 141,605 137,973 3
1Based on FAS Marketing Year Ranking Reports for 2016/17 - www.fas.usda.gov; Marketing year (MY) = Sep 1 - Aug 31.
Total Commitments2
- 1,000 mt -
3FAS Marketing Year Ranking Reports - http://apps.fas.usda.gov/export-sales/myrkaug.htm; 3-yr average
2Cumulative Exports (shipped) + Outstanding Sales (unshipped), FAS Weekly Export Sales Report, or Export Sales Query--http://www.fas.usda.gov/esrquery/. Total
commitments change (net sales) from prior week could include revisions from previous week's outstanding sales or accumulated sales.
(n) indicates negative number.

June 14, 2018
Grain Transportation Report 16
Table 14
Top 5 Importers1 of U.S. Soybeans
For the week ending 5/31/2018 % change
Exports3
2018/19 2017/18 2016/17 current MY 3-yr avg.
Next MY Current MY Last MY from last MY 2014-2016
- 1,000 mt - - 1,000 mt -
China 1,458 28,652 35,896 (20) 31,881
Mexico 505 4,261 3,499 22 3,452
Indonesia 70 2,165 1,982 9 1,987
Japan 120 2,038 2,077 (2) 2,067
Netherlands 0 1,698 1,553 9 2,098
Top 5 importers 2,152 38,814 45,008 (14) 41,486
Total US soybean export sales 6,363 55,630 58,597 (5) 52,919
% of Projected 10% 99% 99%
Change from prior week2
35 165 159
Top 5 importers' share of U.S.
soybean export sales 34% 70% 77% 78%
USDA forecast, June 2018 62,398 56,267 59,237 95
1Bas ed on FAS Marketin g Year Ran kin g Rep orts for 2016/17 - www.fas .u s d a.g ov; Marketin g year (MY) = S ep 1 - Au g 31.
3 FAS Marketin g Year Fin al Rep orts - www.fas .u s d a.g ov/exp ort-s ales /m yfi_rp t.h tm . (Carryover p lu s Accu m u lated Exp orts )
(n) indicates negative number.
2Cu m u lative Exp orts (s h ip p ed ) + Ou ts tan d in g S ales (u n s h ip p ed ), FAS W eekly Exp ort S ales Rep ort, or Exp ort S ales Qu ery--h ttp ://www.fas .u s d a.g ov/es rq u ery/. Th e total com m itm en ts ch an g e (n et s ales ) from p rior
week cou ld in clu d e reivis ion s from p reviou s week's ou ts tan d in g s ales an d /or accu m u lated s ales
Total Commitments2
Table 15
Top 10 Importers1 of All U.S. Wheat
For the week ending 5/31/2018 % change Exports3
2018/19 2017/18 2016/17 current MY 3-yr avg
Next MY Current MY Last MY from last MY 2014-2016
- 1,000 mt -
Japan 603 2,931 2,864 2 2,620
Mexico 349 2,972 3,304 (10) 2,743
Philippines 445 2,604 2,786 (7) 2,395
Brazil 60 128 1,237 (90) 862
Nigeria 110 1,171 1,642 (29) 1,254
Korea 463 1,603 1,429 12 1,104
China 0 902 1,663 (46) 1,623
Taiwan 181 1,141 1,097 4 768
Indonesia 100 1,141 1,204 (5) 726
Colombia 25 685 858 (20) 635
Top 10 importers 2,335 15,277 18,085 (16) 14,729
Total US wheat export sales 4,224 23,724 28,396 (16) 22,804
% of Projected 16% 97% 99%
Change from prior week2
1,556 (19) 27
Top 10 importers' share of U.S.
wheat export sales 55% 64% 64% 65%
USDA forecast, June 2018 25,886 24,523 28,747 (15)
1 Based on FAS Marketing Year Ranking Reports for 2016/17 - www.fas.usda.gov; Marketing year = Jun 1 - May 31.
outstanding and/or accumulated sales
Total Commitments2
3 FAS Marketing Year Final Reports - www.fas.usda.gov/export-sales/myfi_rpt.htm.
(n) indicates negative number.
2 Cumulative Exports (shipped) + Outstanding Sales (unshipped), FAS Weekly Export Sales Report, or Export Sales Query--http://www.fas.usda.gov/esrquery/. Total commitments change (net
sales) from prior week could include revisions from the previous week's
- 1,000 mt -

June 14, 2018
Grain Transportation Report 17
The United States exports approximately one-quarter of the grain it produces. On average, this includes nearly 45 percent of U.S.-grown wheat, 50 percent of U.S.-grown soybeans, and 20 percent of the U.S.-grown corn. Approximately 55 percent of the U.S. export grain ship-ments departed through the U.S. Gulf region in 2017.
Table 16
Grain Inspections for Export by U.S. Port Region (1,000 metric tons)
For the Week Ending Previous Current Week 2018 YTD as
06/07/18 Week* as % of Previous 2017 YTD* % of 2017 YTD Last Year Prior 3-yr. avg.
Pacific Northwest
Wheat 254 167 152 5,342 6,895 77 70 95 14,805
Corn 449 595 76 9,765 7,381 132 122 193 10,928
Soybeans 132 139 95 4,816 4,379 110 191 559 13,246
Total 835 901 93 19,923 18,655 107 109 169 38,978
Mississippi Gulf
Wheat 98 51 191 1,910 2,260 85 46 62 4,198
Corn 678 724 94 15,399 16,110 96 144 121 28,690
Soybeans 333 283 118 10,497 11,198 94 177 224 32,911
Total 1,109 1,058 105 27,806 29,568 94 137 132 65,800
Texas Gulf
Wheat 2 95 2 1,780 3,229 55 27 41 6,354
Corn 38 73 52 375 376 100 548 257 733
Soybeans 12 12 100 23 0 n/a n/a n/a 292
Total 51 179 29 2,178 3,605 60 52 71 7,379
Interior
Wheat 16 38 41 703 809 87 108 152 1,727
Corn 196 114 172 3,750 3,665 102 113 125 8,758
Soybeans 165 142 116 2,897 2,301 126 159 222 5,508
Total 376 293 128 7,350 6,774 109 127 154 15,993
Great Lakes
Wheat 20 16 129 241 253 95 72 107 711
Corn 23 23 100 155 83 187 162 140 192
Soybeans 31 21 151 104 104 99 201 336 890
Total 74 59 125 499 441 113 122 163 1,793
Atlantic
Wheat 0 0 n/a 64 37 172 0 0 46
Corn 0 0 n/a 67 5 n/a n/a 723 32
Soybeans 6 7 84 969 866 112 160 153 2,001
Total 6 7 84 1,100 908 121 248 204 2,079
U.S. total from ports*
Wheat 389 366 106 10,039 13,483 74 58 80 27,841
Corn 1,384 1,528 91 29,511 27,620 107 134 142 49,333
Soybeans 678 603 112 19,306 18,848 102 178 268 54,847
Total 2,452 2,497 98 58,857 59,951 98 118 143 132,021
*Data includes revisions from prior weeks; some regional totals may not add exactly due to rounding.
Source: Grain Inspection, Packers and Stockyards Administration/USDA (www.gipsa.usda.gov); YTD= year-to-date; n/a = not applicable
Last 4-weeks as % of:
Port Regions 2017 Total*2018 YTD*
June 14, 2018
Grain Transportation Report 18
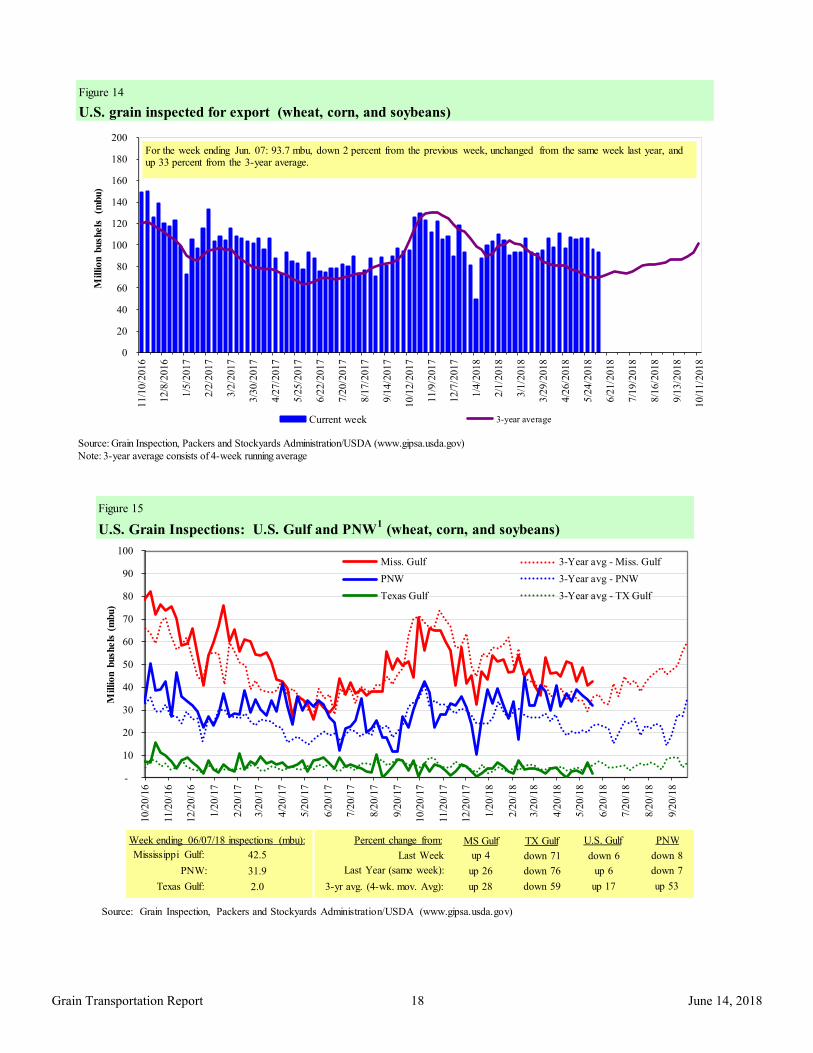
Figure 14
U.S. grain inspected for export (wheat, corn, and soybeans)
Source: Grain Inspection, Packers and Stockyards Administration/USDA (www.gipsa.usda.gov)
Note: 3-year average consists of 4-week running average
0
20
40
60
80
100
120
140
160
180
20011/1
0/2
016
12/8
/2016
1/5
/20
17
2/2
/20
17
3/2
/20
17
3/3
0/2
01
7
4/2
7/2
01
7
5/2
5/2
017
6/2
2/2
017
7/2
0/2
01
7
8/1
7/2
01
7
9/1
4/2
01
7
10
/12
/20
17
11/9
/2017
12/7
/2017
1/4
/20
18
2/1
/20
18
3/1
/20
18
3/2
9/2
01
8
4/2
6/2
018
5/2
4/2
018
6/2
1/2
01
8
7/1
9/2
01
8
8/1
6/2
01
8
9/1
3/2
01
8
10
/11
/20
18
Million b
ush
els
(m
bu)
Current week 3-year average
For the week ending Jun. 07: 93.7 mbu, down 2 percent from the previous week, unchanged from the same week last year, and up 33 percent from the 3-year average.
Figure 15
U.S. Grain Inspections: U.S. Gulf and PNW1 (wheat, corn, and soybeans)
-
10
20
30
40
50
60
70
80
90
100
10/2
0/1
6
11/2
0/1
6
12/2
0/1
6
1/2
0/1
7
2/2
0/1
7
3/2
0/1
7
4/2
0/1
7
5/2
0/1
7
6/2
0/1
7
7/2
0/1
7
8/2
0/1
7
9/2
0/1
7
10/2
0/1
7
11/2
0/1
7
12/2
0/1
7
1/2
0/1
8
2/2
0/1
8
3/2
0/1
8
4/2
0/1
8
5/2
0/1
8
6/2
0/1
8
7/2
0/1
8
8/2
0/1
8
9/2
0/1
8
Million b
ush
els
(m
bu)
Miss. Gulf 3-Year avg - Miss. Gulf
PNW 3-Year avg - PNW
Texas Gulf 3-Year avg - TX Gulf
Source: Grain Inspection, Packers and Stockyards Administration/USDA (www.gipsa.usda.gov)
Last Week:
Last Year (same week):
3-yr avg. (4-wk. mov. Avg):
MS Gulf TX Gulf U.S. Gulf PNW
up 4
up 26
up 28
down 71
down 76
down 59
down 6
up 6
up 17
down 8
down 7
up 53
Percent change from:Week ending 06/07/18 inspections (mbu):
Mississippi Gulf:
PNW:
Texas Gulf:
42.5
31.9
2.0

June 14, 2018
Grain Transportation Report 19
Ocean Transportation
Figure 16
U.S. Gulf Vessel Loading Activity
0
10
20
30
40
50
60
70
80
01
/18
/20
18
01
/25
/20
18
02
/01
/20
18
02
/08
/20
18
02
/15
/20
18
02
/22
/20
18
03
/01
/20
18
03
/08
/20
18
03
/15
/20
18
03
/22
/20
18
03
/29
/20
18
04
/05
/20
18
04
/12
/20
18
04
/19
/20
18
04
/26
/20
18
05
/03
/20
18
05
/10
/20
18
05
/17
/20
18
05
/24
/20
18
05
/31
/20
18
06
/07
/20
18
Nu
mb
er
of
vess
els
Loaded Last 7 Days Due Next 10 days Loaded 4 Year Average
Source:Transportation & Marketing Programs/AMS/USDA1U.S. Gulf includes Mississippi, Texas, and East Gulf.
For the week ending June 7 Loaded Due
Change from last year -3.1% -23.6%
Change from 4-year avg. -3.9% -7.7%
Table 17
Weekly Port Region Grain Ocean Vessel Activity (number of vessels)
Pacific
Gulf Northwest
Loaded Due next
Date In port 7-days 10-days In port
6/7/2018 31 31 42 24
5/31/2018 29 28 48 18
2017 range (25..66) (28..54) (37..87) (5..44)
2017 avg. 46 38 56 20
Source: Transportation & Marketing Programs/AMS/USDA
June 14, 2018
Grain Transportation Report 20
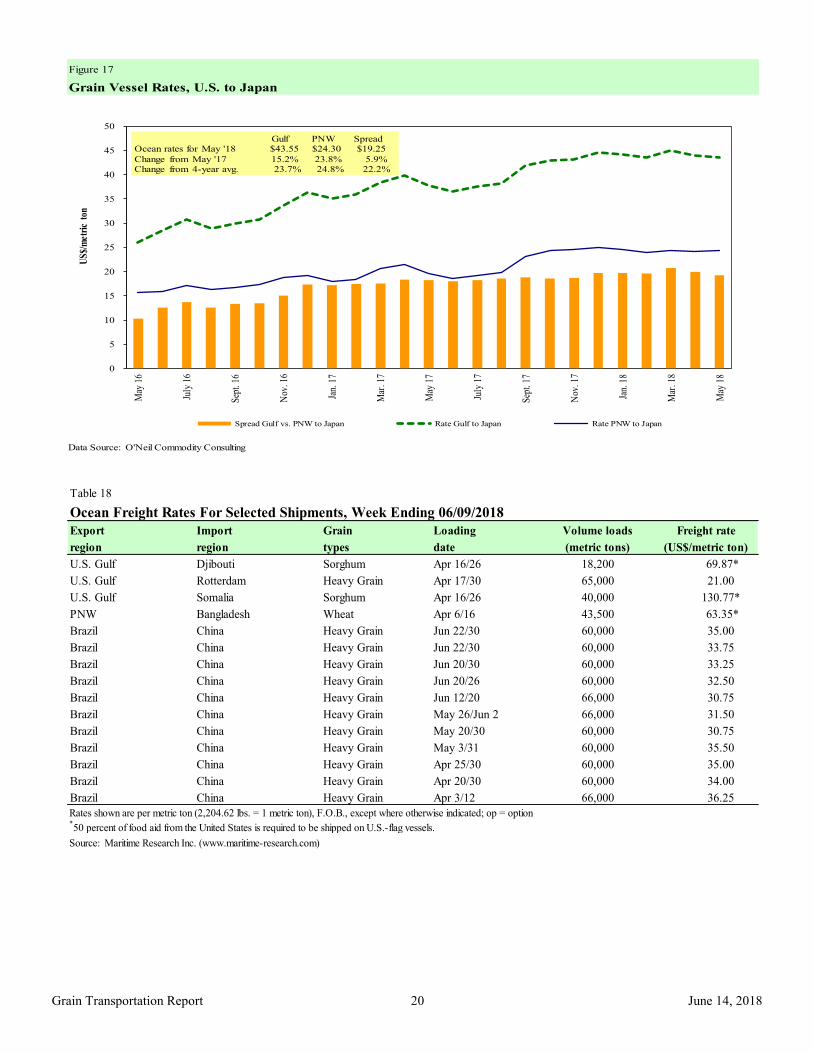
Figure 17
Grain Vessel Rates, U.S. to Japan
Data Source: O'Neil Commodity Consulting
0
5
10
15
20
25
30
35
40
45
50
May
16
July
16
Sep
t. 16
Nov
. 16
Jan.
17
Mar
. 17
May
17
July
17
Sep
t. 17
Nov
. 17
Jan.
18
Mar
. 18
May
18
US
$/m
etri
c to
n
Spread Gulf vs. PNW to Japan Rate Gulf to Japan Rate PNW to Japan
Gulf PNW Spread Ocean rates for May '18 $43.55 $24.30 $19.25
Change from May '17 15.2% 23.8% 5.9% Change from 4-year avg. 23.7% 24.8% 22.2%
Table 18
Ocean Freight Rates For Selected Shipments, Week Ending 06/09/2018
Export Import Grain Loading Volume loads Freight rate
region region types date (metric tons) (US$/metric ton)
U.S. Gulf Djibouti Sorghum Apr 16/26 18,200 69.87*
U.S. Gulf Rotterdam Heavy Grain Apr 17/30 65,000 21.00
U.S. Gulf Somalia Sorghum Apr 16/26 40,000 130.77*
PNW Bangladesh Wheat Apr 6/16 43,500 63.35*
Brazil China Heavy Grain Jun 22/30 60,000 35.00
Brazil China Heavy Grain Jun 22/30 60,000 33.75
Brazil China Heavy Grain Jun 20/30 60,000 33.25
Brazil China Heavy Grain Jun 20/26 60,000 32.50
Brazil China Heavy Grain Jun 12/20 66,000 30.75
Brazil China Heavy Grain May 26/Jun 2 66,000 31.50
Brazil China Heavy Grain May 20/30 60,000 30.75
Brazil China Heavy Grain May 3/31 60,000 35.50
Brazil China Heavy Grain Apr 25/30 60,000 35.00
Brazil China Heavy Grain Apr 20/30 60,000 34.00
Brazil China Heavy Grain Apr 3/12 66,000 36.25
Rates shown are per metric ton (2,204.62 lbs. = 1 metric ton), F.O.B., except where otherwise indicated; op = option *50 percent of food aid from the United States is required to be shipped on U.S.-flag vessels.
Source: Maritime Research Inc. (www.maritime-research.com)
June 14, 2018
Grain Transportation Report 21
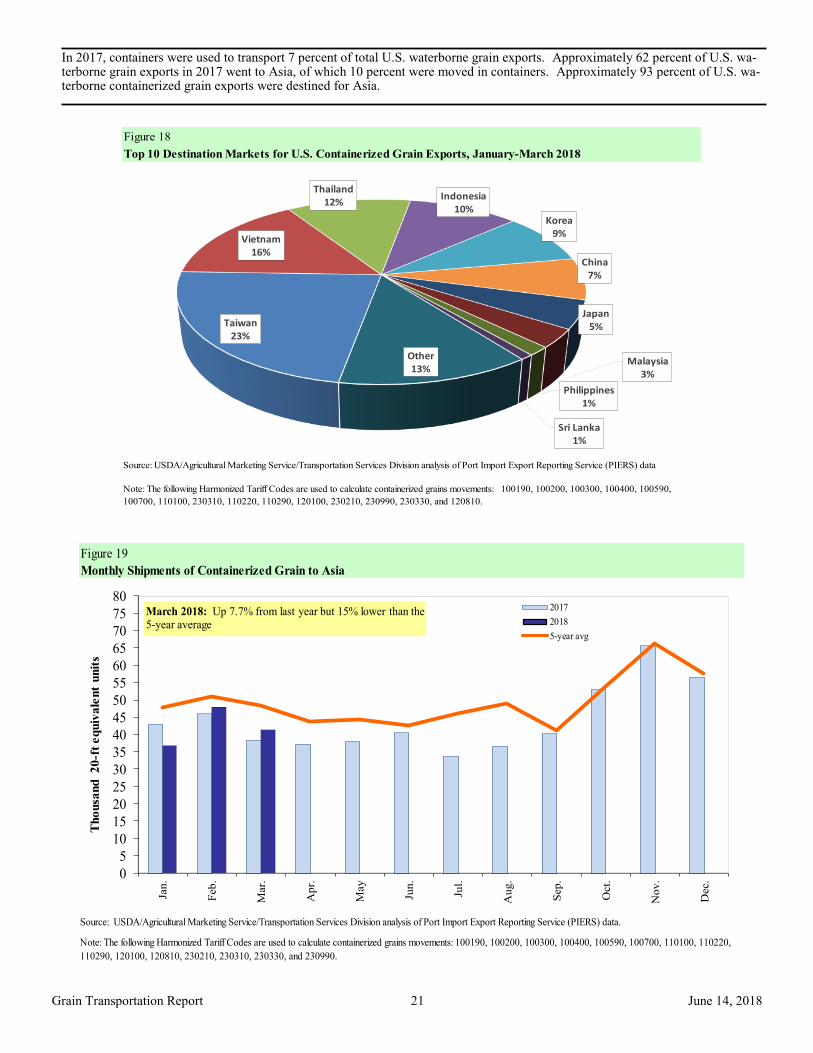
In 2017, containers were used to transport 7 percent of total U.S. waterborne grain exports. Approximately 62 percent of U.S. wa-terborne grain exports in 2017 went to Asia, of which 10 percent were moved in containers. Approximately 93 percent of U.S. wa-terborne containerized grain exports were destined for Asia.
Figure 18
Top 10 Destination Markets for U.S. Containerized Grain Exports, January-March 2018
Source: USDA/Agricultural Marketing Service/Transportation Services Division analysis of Port Import Export Reporting Service (PIERS) data
Note: The following Harmonized Tariff Codes are used to calculate containerized grains movements: 100190, 100200, 100300, 100400, 100590,
100700, 110100, 230310, 110220, 110290, 120100, 230210, 230990, 230330, and 120810.
Taiwan23%
Vietnam16%
Thailand12%
Indonesia10%
Korea9%
China7%
Japan5%
Malaysia3%
Philippines1%
Sri Lanka1%
Other13%
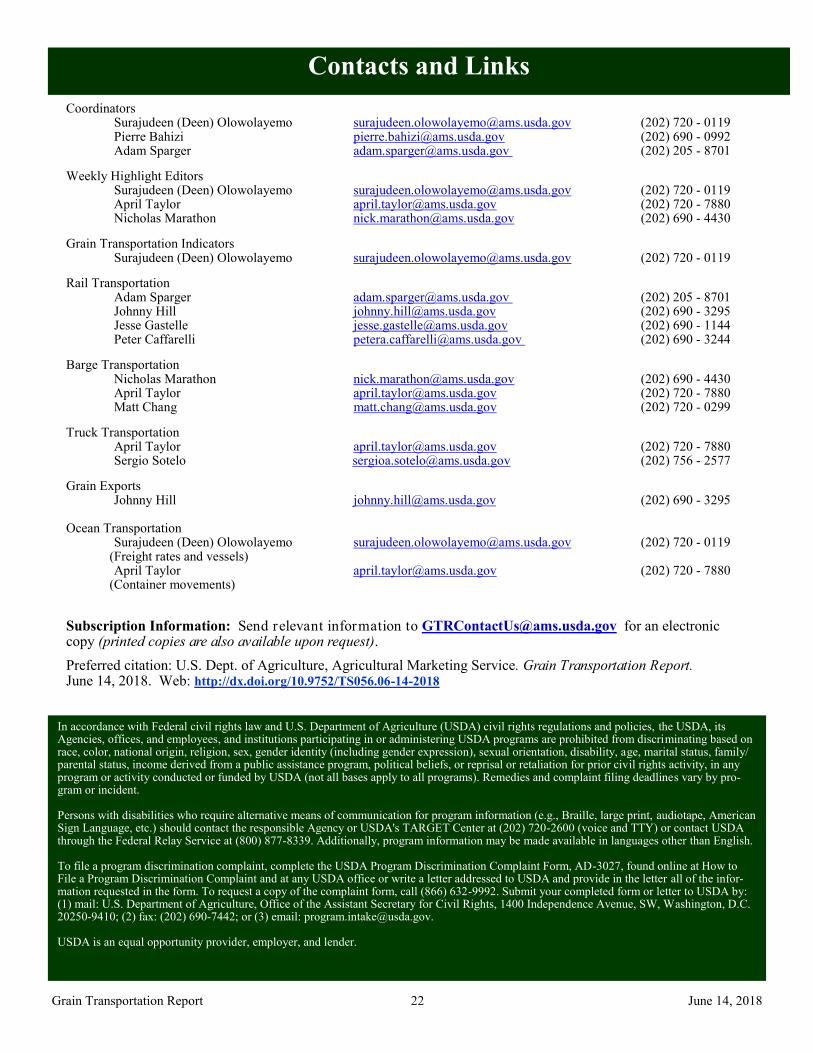
Figure 19
Monthly Shipments of Containerized Grain to Asia
Source: USDA/Agricultural Marketing Service/Transportation Services Division analysis of Port Import Export Reporting Service (PIERS) data.
Note: The following Harmonized Tariff Codes are used to calculate containerized grains movements: 100190, 100200, 100300, 100400, 100590, 100700, 110100, 110220,
110290, 120100, 120810, 230210, 230310, 230330, and 230990.
0
5
10
15
20
25
30
35
40
45
50
55
60
65
70
75
80
Jan.
Feb.
Mar.
Ap
r.
May
Jun.
Jul.
Aug.
Sep.
Oct.
Nov.
Dec.
Tho
usa
nd 20
-ft
equiv
ale
nt
unit
s
2017
2018
5-year avg
March 2018: Up 7.7% from last year but 15% lower than the 5-year average
June 14, 2018
Grain Transportation Report 22
Coordinators Surajudeen (Deen) Olowolayemo [email protected] (202) 720 - 0119 Pierre Bahizi [email protected] (202) 690 - 0992 Adam Sparger [email protected] (202) 205 - 8701
Weekly Highlight Editors Surajudeen (Deen) Olowolayemo [email protected] (202) 720 - 0119 April Taylor [email protected] (202) 720 - 7880 Nicholas Marathon [email protected] (202) 690 - 4430
Grain Transportation Indicators Surajudeen (Deen) Olowolayemo [email protected] (202) 720 - 0119
Rail Transportation Adam Sparger [email protected] (202) 205 - 8701 Johnny Hill [email protected] (202) 690 - 3295 Jesse Gastelle [email protected] (202) 690 - 1144 Peter Caffarelli [email protected] (202) 690 - 3244
Barge Transportation Nicholas Marathon [email protected] (202) 690 - 4430 April Taylor [email protected] (202) 720 - 7880 Matt Chang [email protected] (202) 720 - 0299
Truck Transportation April Taylor [email protected] (202) 720 - 7880 Sergio Sotelo [email protected] (202) 756 - 2577
Grain Exports Johnny Hill [email protected] (202) 690 - 3295 Ocean Transportation Surajudeen (Deen) Olowolayemo [email protected] (202) 720 - 0119 (Freight rates and vessels) April Taylor [email protected] (202) 720 - 7880 (Container movements)
Subscription Information: Send relevant information to [email protected] for an electronic copy (printed copies are also available upon request).
Preferred citation: U.S. Dept. of Agriculture, Agricultural Marketing Service. Grain Transportation Report. June 14, 2018. Web: http://dx.doi.org/10.9752/TS056.06-14-2018
Contacts and Links
In accordance with Federal civil rights law and U.S. Department of Agriculture (USDA) civil rights regulations and policies, the USDA, its Agencies, offices, and employees, and institutions participating in or administering USDA programs are prohibited from discriminating based on race, color, national origin, religion, sex, gender identity (including gender expression), sexual orientation, disability, age, marital status, family/parental status, income derived from a public assistance program, political beliefs, or reprisal or retaliation for prior civil rights activity, in any program or activity conducted or funded by USDA (not all bases apply to all programs). Remedies and complaint filing deadlines vary by pro-gram or incident. Persons with disabilities who require alternative means of communication for program information (e.g., Braille, large print, audiotape, American Sign Language, etc.) should contact the responsible Agency or USDA's TARGET Center at (202) 720-2600 (voice and TTY) or contact USDA through the Federal Relay Service at (800) 877-8339. Additionally, program information may be made available in languages other than English. To file a program discrimination complaint, complete the USDA Program Discrimination Complaint Form, AD-3027, found online at How to File a Program Discrimination Complaint and at any USDA office or write a letter addressed to USDA and provide in the letter all of the infor-mation requested in the form. To request a copy of the complaint form, call (866) 632-9992. Submit your completed form or letter to USDA by: (1) mail: U.S. Department of Agriculture, Office of the Assistant Secretary for Civil Rights, 1400 Independence Avenue, SW, Washington, D.C. 20250-9410; (2) fax: (202) 690-7442; or (3) email: [email protected]. USDA is an equal opportunity provider, employer, and lender.