graph-based modeling of information flow evolution and ...peeta/data/disseminate/disseminated... ·...
TRANSCRIPT
Graph-based Modeling of Information Flow Evolution and Propagation under V2V Communications based Advanced
Traveler Information Systems
1
Graph-based Modeling of Information Flow Evolution
and Propagation under V2V Communications based
Advanced Traveler Information Systems
Yong Hoon Kim & Srinivas Peeta*
Purdue University, 550 Stadium Mall Drive, West Lafayette, IN 47907, USA
Abstract: A vehicle equipped with a vehicle-to-vehicle
(V2V) communications capability can continuously update
its knowledge on traffic conditions using its own experience
and anonymously obtained travel experience data from
other such equipped vehicles without any central
coordination. In such a V2V communications based
advanced traveler information system (ATIS), the dynamics
of traffic flow and inter-vehicle communication lead to the
time-dependent vehicle knowledge on the traffic network
conditions. In this context, this study proposes a graph-
based multi-layer network framework to model the V2V-
based ATIS as a complex system which is comprised of
three coupled network layers: a physical traffic flow
network, and virtual inter-vehicle communication and
information flow networks. To determine the occurrence of
V2V communication, the inter-vehicle communication layer
is first constructed using the time-dependent locations of
vehicles in the traffic flow layer and inter-vehicle
communication related constraints. Then an information
flow network is constructed based on events in the traffic
and inter-vehicle communication networks. The graph
structure of this information flow network enables the
efficient tracking of the time-dependent vehicle knowledge
of the traffic network conditions using a simple graph-
based reverse search algorithm and the storage of the
information flow network as a single graph database.
Further, the proposed framework provides a retrospective
modeling capability to articulate explicitly how information
flow evolves and propagates. These capabilities are critical
to develop strategies for the rapid flow of useful
information and traffic routing to enhance network
performance. It also serves as a basic building block for the
design of V2V-based route guidance strategies to manage
traffic conditions in congested networks. Synthetic
experiments are used to compare the graph-based
approach to a simulation-based approach, and illustrate
both memory usage and computational time efficiencies.
1 INTRODUCTION
Communications technologies enable technological
advances to be integrated into the transportation system and
vehicles to foster objectives such as congestion mitigation,
safety improvement, and traffic network performance
enhancement. In this context, vehicle-to-vehicle (V2V)
communications can be leveraged in an advanced traveler
information system (ATIS) to allow vehicles to accumulate
their own travel experience data and communicate with
other vehicles within communication range to exchange
travel experience data without any central coordination.
Hence, V2V communications capabilities in an ATIS can
provide a data-rich environment for travelers based on
information transmitted anonymously from vehicles
without the requirement of additional infrastructure.
Thereby, it can potentially provide an enhanced range of
awareness of traffic conditions to travelers.
The dynamics of vehicular traffic flow, inter-vehicle
communication, and traffic information flow are the three
underlying factors that shape a V2V-based ATIS. A
complex characteristic of this system is that these factors
themselves interact with each other. Due to these
interactions, a V2V-based ATIS can be viewed as
consisting of coupled layers involving traffic flow, inter-
vehicle communication, and information flow, in which
events in the different layers are interdependent. In this
study, we use the term “information flow” to denote the
flow of the information on the time-dependent link travel
time experienced by a vehicle, and refer it as “a unit of
information”. This information is not processed for
congestion or an incident detection (Yang and Recker,
2008), and/or other applications through data fusion/update.
The analysis of the propagation of a single unit of
descriptive information has been proposed by various
analytical approaches (Wu et al., 2005; Wang, 2007; Kim et
al., 2014). By contrast, as vehicles generate their own link
travel time experience data over time and space, a V2V-
based ATIS entails the propagation of multiple units of

Kim and Peeta 2
information. The set of travel experience data on an
equipped vehicle, based on own experience or obtained
through inter-vehicle communication, is referred to as the
“vehicle knowledge.”
Due to the highly decentralized nature of the V2V-based
ATIS in the absence of centralized coordination of
information provision, and the dynamics associated with the
traffic and information flows, different vehicles may have
different time-dependent knowledge of the network traffic
conditions. In this context, this study focuses on modeling
the information flow evolution and propagation that lead to
the dynamics of vehicle knowledge in V2V-based ATIS as
a building block to develop coordinated information
provision strategies that additionally would require an
understanding of how the vehicle knowledge would affect
the driver actions. This is because the estimated network
traffic conditions based on a vehicle’s time-dependent
knowledge can be used by its driver for route choice
decisions. The route choice decisions of V2V-equipped
vehicles would then lead to the traffic network flow
evolution and influence the dynamics of the information
flow due to their interactions. To reiterate, this study does
not intend to determine the driver route choices based on
the information content in the time-dependent vehicle
knowledge. Thus, the identification of the time-dependent
vehicle knowledge addressed here is a subproblem of the
broader V2V-based ATIS that seeks to address user/system
objectives in congested traffic networks, possibly in
coordinated control settings. This aspect is reinforced
further when discussing the conceptual framework in Fig.1.
Several studies (Li et al., 2001; Gupta and Kumar, 2000;
Vuyyuru and Oguchi, 2007) originating from the
communications domain primarily focus on how the vehicle
dynamics affect the inter-vehicle communication
effectiveness between vehicles; for example, at different
speeds. Hence, these studies have sought to address the
integration of the dynamics of the traffic flow and the inter-
vehicle communication. Other studies (Wu et al., 2005;
Fitzgibbons et al., 2004; Schroth et al., 2006) propose
frameworks that incorporate a traffic flow simulator (such
as Paramics and CORSIM) and a wireless (inter-vehicle
communication) network simulator (such as NS-2 and
Qualnet, or a simple analytical model) to derive some
descriptive insights on the interactions between the traffic
flow movement and the inter-vehicle communication.
However, the aforementioned studies focus primarily on
the feasibility and the reliability of the V2V communication
system for practical applications, and do not explicitly
address the modeling of the dynamics of the traffic
information flow in the V2V-based ATIS context. Thereby,
they address only two of the three coupled layers identified
heretofore.
Motivated by the need to analyze the dynamics of the
interactions among the traffic flow, inter-vehicle
communication, and information flow at the network level,
recent simulation-based studies (Eichler et al., 2005; Wu et
al., 2005; Kim, 2010; Schmidt-Eisenlohr et al., 2007) in the
transportation domain seek to estimate the dynamic traffic
conditions through simple data update mechanisms so that
travelers can use this information to make routing decisions
under V2V communication systems. They incorporate a
microscopic traffic flow model and a set of inter-vehicle
communication constraints to determine vehicle knowledge.
Thereby, these simulation-based approaches entail a
descriptive capability to identify the time-dependent
knowledge of each vehicle in terms of their own travel
experience data and such data obtained from other vehicles
through V2V communication. However, these approaches
do not have a retrospective capability to articulate explicitly
how information flow evolves and propagates, particularly
in terms of its linkage to the interactions with the traffic
flow and inter-vehicle communication dynamics. That is,
they cannot track when and from whom a specific unit of
V2V communication-based travel experience data located
in a certain vehicle’s knowledge reaches it, and when and to
whom it propagates from it. Such spatiotemporal
capabilities are critical to develop strategies for both the
rapid flow of useful information and traffic routing to
enhance network performance.
The lack an explicit model for the information flow layer
at the network level in simulation-based and analytical
approaches precludes an understanding of the fundamental
relationships between the dynamic interactions among the
three layers, and the evolution of equipped vehicles’
knowledge in time and space. This is critical for three real-
world objectives: (i) to identify and/or design information
flow strategies/paradigms that lead to the rapid propagation
of useful information (in the sense of enhancing the traffic
network performance), (ii) to develop targeted V2V-based
routing strategies to manage traffic network conditions, and
(iii) to design a V2V-based ATIS so that such
communications are reliable and successful. This paper
seeks to fill this key gap in the literature by proposing an
integrated graph-based multi-layer network framework to
model the V2V-based ATIS as a complex system which is
comprised of three coupled network layers: traffic flow
network, inter-vehicle communication network, and
information flow network.
The proposed graph-based framework provides an
explicit retrospective modeling capability to articulate how
information flow evolves and propagates beyond the
current descriptive capability afforded by simulation-based
approaches. To do so, the framework is modeled as a set of
interacting networks in which information flow occurs as a
result of events in the traffic flow and inter-vehicle
communication networks. These events are the travel
experience data generation in the traffic flow network, and
the V2V communication occurrences in the inter-vehicle
communication network. In particular, the dynamics of
traffic flow are represented in terms of the spatiotemporal
Graph-based Modeling of Information Flow Evolution and Propagation under V2V Communications based Advanced
Traveler Information Systems
3
vehicle trajectories in the traffic network, and the feasibility
of inter-vehicle communication among vehicles is captured
in the inter-vehicle communication network using
constraints. Hence, to simulate the information flow
evolution and propagation that characterize the vehicle
knowledge in a V2V traffic system, the following are
assumed to be known: (i) “travel experience data” from the
physical traffic network, which represents the actual travel
experiences of vehicles (in terms of the time a vehicle
enters a link and its experienced travel time on that link)
along their route trajectories, and (ii) the inter-vehicle
communication constraints arising from the
communications network technology (in terms of the
communication range, interference and bandwidth).
Based on the known entities in the V2V-based ATIS, the
study first constructs the virtual inter-vehicle
communication layer that illustrates inter-vehicle
communication events determined by the known locations
of the vehicles and the technological constraints. Then, it
constructs the information flow network layer based on the
events in the other two layers. Finally, it seeks to identify
the vehicle knowledge of all vehicles in space and time to
explain what information is obtained by each equipped
vehicle. Through these modeling processes, the graph-based
approach provides a retrospective capability to explicitly
illustrate how information flow evolves and propagates,
particularly in terms of the linkage to the interactions with
the traffic flow and inter-vehicle communication dynamics.
The proposed information flow network has two key
modeling characteristics. First, it has a graph structure that
illustrates the information flow evolution and propagation.
This enables the efficient use of a graph-based search
algorithm to obtain a vehicle’s travel experience data based
on its traversing a connected subgraph of the information
flow network. Second, it stores data using an efficient graph
database. Graph databases (Robinson et al., 2013) use the
graph as a data structure that is optimized for the efficient
storing and processing of dense, interrelated datasets. Akin
to other studies that involve graph databases such as social,
citation, and biological networks, an information flow
network employs a graph database by assembling nodes and
links into a single graph structure. Thus, the information
flow network eliminates data representation redundancies
so that the same piece of data is not stored in more than one
place, and information flow evolution and propagation is
represented using directed links. Also, since a graph-based
search algorithm to characterize in the information flow
network performs a local search and is not concerned with
the network size, adapting a graph database enables the
development of computationally efficient solution
methodologies.
In summary, this study has two primary objectives in the
V2V-based ATIS context: (1) to model the information
flow evolution and propagation through an integrated multi-
layer network modeling framework, and (2) to characterize
the spatiotemporal evolution and propagation of
information flow through a graph structure.
As the key study contribution, the proposed framework
provides a retrospective modeling capability to understand
the information flow evolution and propagation explicitly
by capturing the dynamics of the interactions involving the
traffic flow and the inter-vehicle communication layers.
Thereby, the proposed graph structure of the information
flow network can illustrate the information flow evolution
and propagation. Another contribution is the systematic
modeling of the traffic flow, inter-vehicle communication,
and the information flow networks to capture their
interactions in the V2V-based ATIS context. From a
practical standpoint, the proposed graph-based approach
can efficiently model the V2V-based ATIS by leveraging a
single graph database.
The remainder of the paper is structured as follows.
Section 2 presents the graph-based multi-layer modeling
framework. The structural and functional properties of the
information flow network to identify the characteristics of
information flow evolution and propagation are presented
thereafter. Section 3 discusses the retrospective capabilities
associated with modeling the information flow evolution
and propagation, and the expected benefits of modeling the
information flow network in terms of a graph structures.
Section 4 describes the synthetic experiments and discusses
the associated results and insights. Section 5 presents some
concluding comments.
2 PRELIMINARIES
2.1 The integrated multi-layer network framework
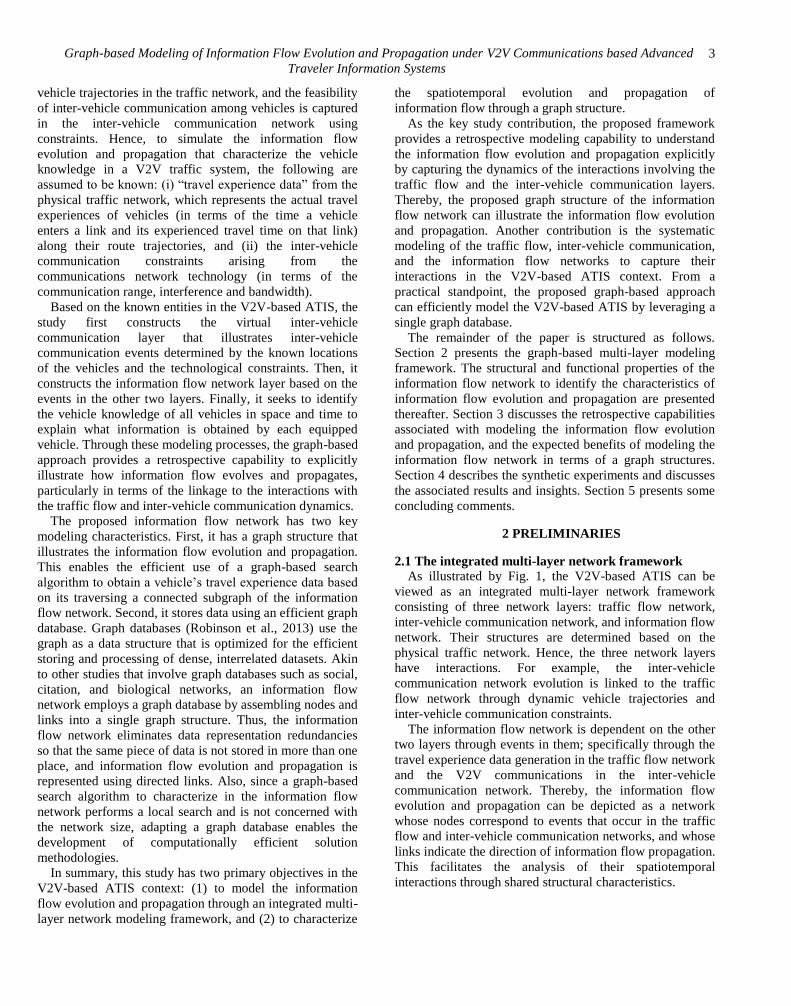
As illustrated by Fig. 1, the V2V-based ATIS can be
viewed as an integrated multi-layer network framework
consisting of three network layers: traffic flow network,
inter-vehicle communication network, and information flow
network. Their structures are determined based on the
physical traffic network. Hence, the three network layers
have interactions. For example, the inter-vehicle
communication network evolution is linked to the traffic
flow network through dynamic vehicle trajectories and
inter-vehicle communication constraints.
The information flow network is dependent on the other
two layers through events in them; specifically through the
travel experience data generation in the traffic flow network
and the V2V communications in the inter-vehicle
communication network. Thereby, the information flow
evolution and propagation can be depicted as a network
whose nodes correspond to events that occur in the traffic
flow and inter-vehicle communication networks, and whose
links indicate the direction of information flow propagation.
This facilitates the analysis of their spatiotemporal
interactions through shared structural characteristics.

Kim and Peeta 4
Traffic flow network
Inter-vehicle communication
network
Information flow network
Dynamics of information flow
Corresponding node
generation in the
information flow network
Travel experience
data generation event
Inter-vehicle
communication event
Dynamic vehicle
trajectory
TG = (N,A)
CG = (C,M)
I I I I IG = (N ,C , A , M )
Location of
vehicles
Inter-vehicle
communication event
Node in the traffic flow
networki
A pair of inter-vehicle
communication nodes
Variable name Detailed representation
Vehicle identification
(VID) numberID of the vehicle
Traveled link A link that the
vehicle passes through
Link entrance timeTime that the vehicle
enters the link
Link travel timeVehicle travel time between the
two nodes of a link
33 346 07:55:33 55seconds
Traveled linkVID Link entrance time Travel time
Inter-vehicle
communication link
Example of travel experience data
A pair of virtual inter-
vehicle communication
(VIC) nodes
Links in information
flow network
Travel experience data
generation event
Travel experience data
(TED) node
Fig. 1. Conceptual framework of the integrated multi-layer network framework.
2.1.1 Notation
The following notation is used to represent variables in
the integrated multi-layer network framework.
Traffic flow network TG = (N,A)
N : the set of physical nodes
A : the set of physical links
X : the set of vehicles
x : subscript for a vehicle, xX
T : the duration of interest in the V2V-based ATIS
t : superscript for (continuous) the time of interest,
t [0,T]
i : a physical node in the network, i N
( , )i j : a physical link in the network, ( , )i j A
Inter-vehicle communication network CG = (C,M)
C : the set of inter-vehicle communication nodes
M : the set of inter-vehicle communication links
x : broadcasting inter-vehicle communication nodes
for vehicle x , x C
y : receiving inter-vehicle communication nodes for
vehicle y , y C
( , )x y : inter-vehicle communication link from vehicle
x to vehicle y , ( , )x y M
Information flow network I I I I IG = (N ,C , A , M )
IN : the set of travel experience data (TED) nodes IC : the set of virtual inter-vehicle communication
(VIC) nodes IP : the set of nodes in the information flow network,
I I IP {N ,C } , I IN C IA : the set of information flow propagation trajectory
links (T-link) indicating the vehicle trajectory
direction based on the traffic flow IM : the set of inter-vehicle communication based
information flow propagation links (I-link)
denoting the direction of information flow based
on the inter-vehicle communication t
xi : travel experience data (TED) node indicating a
travel experience data generated by vehicle x at
node i at time t , x X , i N , t
xi IN
t
x : virtual inter-vehicle communication (VIC) node
denoting that vehicle x broadcasts travel
experience data at time t , t
xIC
t
y : virtual inter-vehicle communication (VIC) node

Graph-based Modeling of Information Flow Evolution and Propagation under V2V Communications based Advanced
Traveler Information Systems
5
denoting that vehicle y receives travel
experience data at time t , t I
y C
,t t
x xp q : nodes in the information flow network associated
with vehicle x at time t; t t I
x x, Pp q
( p
x
t1 ,q
x
t2 ): information flow propagation trajectory link
associated with the trajectory direction of vehicle x
from time 1t to time
2t , 1 2 I
x x, Pt tp q , x X ,
1 2t t
1 2( , )t t
x y : inter-vehicle communication based information
flow propagation link representing the direction
of information flow (from vehicle x to vehicle
y
), 1 2( , )t t
x y IC , x y ,
1 2t t
2.2 Physical traffic network
Under V2V-based ATIS, the equipped vehicles generate
data on their travel experiences using a global positioning
system (GPS) and a digital network mapping. Thereby,
when a vehicle reaches the end of the link (that is, the
associated downstream node in the traffic network), it
generates travel experience data. As shown in Fig. 1, the
travel experience data of a vehicle includes its vehicle
identification (VID) number, the identification number of
the link traversed, the link entrance time, and the link travel
time. Since the traffic flow network is a physical entity, we
assume that the generation of travel experience data based
on vehicle trajectories are observable, and given in the
study.
Let G
T = (N,A) denote a traffic flow network in which
vehicles have an ability to communicate with each other. A
set N of nodes corresponds to physical intersections or
designated points in the traffic flow network, and a set A
of directed links corresponds to road links. This layer
captures the spatiotemporal interactions among vehicles
through their trajectories. The time-dependent locations of
vehicles determine the events of interest; the travel
experience data generation in the traffic flow network, and
the feasibility of inter-vehicle communication based on
relevant technical constraints in the inter-vehicle
communication network. The travel experience data
generated in the physical traffic network represent one of
the components used to construct the information flow
network.
2.3 Virtual inter-vehicle communication network
The known time-dependent locations of vehicles in the
traffic flow network and the inter-vehicle communication
constraints are used to construct the inter-vehicle
communication network.
An inter-vehicle communication event is viewed as a
one-way transfer from a broadcasting vehicle to a receiving
vehicle. The transfer of information through inter-vehicle
communication creates a virtual communication node set
C and a directed communication link set M , leading to the
inter-vehicle communication network CG = (C, M). The
virtual inter-vehicle communication network represents the
characteristics of the inter-vehicle communication events
(that is, which vehicle broadcasts and which vehicle
receives the information in a given event), as illustrated in
Fig. 1. Based on the occurrence of events in the inter-
vehicle communication network, information flow
propagation takes place between vehicles.
The communication range illustrates the physical
distance within which V2V communication can potentially
occur. The communication signal power decreases with
distance. Hence, it is assumed that V2V communication
will not occur outside the specified range. Two equipped
vehicles can potentially communicate with each other when
physical distance is less than a predefined communication
range r . However, multiple trasmissions from vehicles
within communication range leads to interference, which
may result in the failure of receiving information from other
vehicle. The interference rate is defined as follows (Gupta
and Kumar, 2000):
2 2X
/ ( )x z
zx y z y
z x
T TE
(1)
where, z is defined as the GPS location coordinate of an
equipped vehicle z within communication range, Xz . We
assume that the power levels of vehicles (xT and
zT ) are
identical and the ambient noise power level ( E ) is zero.
Signal power decays with distance and the vehicle y will
succeessfully receive the information from vehicle x if it
satisfies the minimum signal-to-interference ratio of (the
study experiments use = 2 based on Gupta and Kumar,
(2000)). Specifically, all equipped vehicles’ positions
within communication range of vehicle y in the traffic
network are tracked. The time interval of V2V
communication is set to 0.5 seconds and the
accomplishment of inter-vehicle communication between y
and those vehicles is checked every interval. Consider the
locations of vehicles shown in Fig. 2, where vehicle x is
broadcasting and y is the receiving vehicle. Vehicles z3, z4
and z5, whose positions are within communication range r
from vehicle y, can potentially interfere with the
communication from vehicle x from vehicle y. This
interference rate is calculated based on Equation (1).
The bandwidth (capacity) of inter-vehicle
communication is a limiting factor and can result in
dropped data packets. In this study, we assume a 2Mbps
data transmission rate and 0.5 seconds for frequency of
communication. This is applied by restricting the number of
travel experience data to be broadcast in each inter-vehicle
communication.
The inter-vehicle communication layer uses the
trajectories of all equipped vehicles from the traffic flow
network, and computes whether vehicles succeed or fail to

Kim and Peeta 6
communicate with each other in the presence of the inter-
vehicle communication constraints discussed heretofore.
Hence, the retrospective capability in the proposed
framework is deterministic in the sense that given the
dynamic vehicle trajectories from the traffic flow network
and the inter-vehicle communication constraints, inter-
vehicle communication events are determinstically
computed. Given that this deterministic framework is a
building block, ongoing work by the authors seeks to
provide a stochastic capability for the inter-vehicle
communication layer to model the effects of the inter-
vehicle communication constraints in terms of capturing the
randomness related to the V2V communication.
4z
: inter-vehicle communication
z : GPS location coordinate
of an equipped vehicle z
: interference
X
x y
4z
1z
2z
3z
5z
yx
1z
5z
3z2z
x y : vehicle
: vehicle’s valid
communication range r
Fig. 2. Interference among vehicles.
2.4 Graph-based representation of information flow
network
Under a V2V–based ATIS, a vehicle continuously
updates its knowledge using its own experience and the
anonymously obtained travel experience data of other
vehicles. These travel experience data are stored in the
temporary memory on board the vehicle’s system, and
duplicate (spatiotemporal data of the same vehicle) and/or
older (data older than 30 minutes in the study experiments)
data are discarded.
Fig. 3 illustrates the vehicle knowledge evolution due to
travel experience data generation and inter-vehicle
communication, and details of the associated data packet
configuration. Fig. 3(a) shows the details of the vehicle
knowledge of vehicles 33 and 25, and the associated travel
experience data. Fig. 3(b) illustrates how events (generation
of travel experience data, and inter-vehicle communication)
impact the evolution of vehicle knowledge in Fig. 3(a). For
example, the vehicle knowledge of vehicle 33 consists of
sets of data that it generates and stores, and receives from
other vehicles (vehicle 17 in Fig. 3).
The information flow network, whose flows are a set of
travel experience data, is constructed using nodes and links
to map what/when/where information is generated and how
it propagates. It illustrates the dynamic nature of the
information flow evolution and propagation, and the
associated evolution of vehicle knowledge.
Information flow from one
vehicle to another
Vehicle travel experience data
Travel experience data generated by vehicle 33
Travel experience data transmittedfrom vehicle 17
Inter-vehicle
communication
VID 17
Temporary
memory
Travel experience data storedin vehicle 33
33 346 07:55:33 55seconds
Traveled linkVID Link
entrance timeTravel time
29 346 07:45:15 104
17 516 08:02:18 63
Store VID 25
VID 33
GPS
(b) Illustration of the travel experience
data generation and inter-vehicle
communication
33 578 08:03:21 41
Information flow within the vehicle
25 26 08:02:18 34
56 811 08:01:11 132
33 346 07:55:33 55
29 346 07:45:15 104
17 516 08:02:18 63
33 578 08:03:21 41
(a) Example of vehicle knowledge (vehicles 33 and 25)
and the associated travel experience data
Travel experience data transmitted from vehicle 33
Traveled linkVID Link
entrance timeTravel time
Fig. 3. Vehicle knowledge evolution.
The information flow network G
I = (NI , CI , AI , MI ) has
two types of nodes: a “travel experience data (TED)” node IN generated by the corresponding each event of travel
experience data generation in TG , and ii) a pair of “virtual
inter-vehicle communication (VIC)” nodes (one for
broadcast and the other for receiving) IC representing the
corresponding each event of inter-vehicle communication in CG , as illustrated in Fig. 1.
Two sets of links represent the dynamics of information
flow evolution and propagation. The directed information
flow propagation trajectory links (T-link) IA denotes the
spatiotemporal trajectories of the same vehicles through
TED-TED, TED-VIC, VIC-TED or VIC-VIC node
connections. The inter-vehicle communication based
information flow propagation links (I-link) IM connect
each pair of nodes (VIC-VIC) corresponding to inter-
vehicle communication events betweem two vehicles.
2.4.1 Information flow generataion/deletion
When a V2V-equipped vehicle reaches a physical
intersection, it generates data on the travel time experienced
on the link just traversed. This event is denoted by a TED
node, denoted as IN .t
xi It represents the travel
experience data generated by vehicle Xx at node i at time
t. As illustrated in Fig. 3, the travel experience data consists
of the vehicle identification number, the link entrance time,
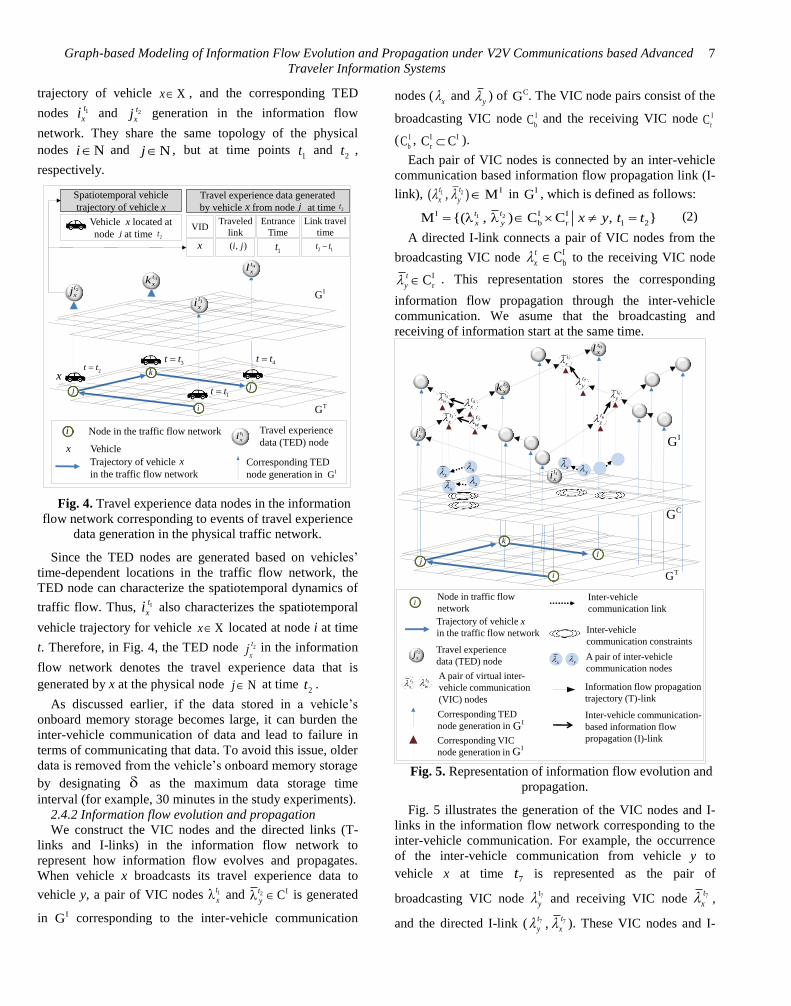
and the experienced link travel time. Fig. 4 shows the route
Graph-based Modeling of Information Flow Evolution and Propagation under V2V Communications based Advanced
Traveler Information Systems
7
trajectory of vehicle Xx , and the corresponding TED
nodes 1t
xi and 2t
xj generation in the information flow
network. They share the same topology of the physical
nodes Ni and Nj , but at time points 1t and
2t ,
respectively.
Vehicle
TG
Corresponding TED
node generation in IG
IG
VIDTraveled
link
Entrance
Time
Link travel
time
2t t
Node in the traffic flow network
Trajectory of vehicle
in the traffic flow network
Travel experience
data (TED) node 1t
xi
Spatiotemporal vehicle
trajectory of vehicle x
Vehicle x located at
node at time 2t
Travel experience data generated
by vehicle from node at time x
j
x
j
k
l
i
( , )i j
i
x
x
x
3t t
1t t
4t t
2t
1t 2 1t t
1t
xi
2t
xj
3t
xk
4t
xl
j
Fig. 4. Travel experience data nodes in the information
flow network corresponding to events of travel experience
data generation in the physical traffic network.
Since the TED nodes are generated based on vehicles’
time-dependent locations in the traffic flow network, the
TED node can characterize the spatiotemporal dynamics of
traffic flow. Thus, 1t
xi also characterizes the spatiotemporal
vehicle trajectory for vehicle Xx located at node i at time
t. Therefore, in Fig. 4, the TED node jx
t2 in the information
flow network denotes the travel experience data that is
generated by x at the physical node Nj at time 2t .
As discussed earlier, if the data stored in a vehicle’s
onboard memory storage becomes large, it can burden the
inter-vehicle communication of data and lead to failure in
terms of communicating that data. To avoid this issue, older
data is removed from the vehicle’s onboard memory storage
by designating as the maximum data storage time
interval (for example, 30 minutes in the study experiments).
2.4.2 Information flow evolution and propagation
We construct the VIC nodes and the directed links (T-
links and I-links) in the information flow network to
represent how information flow evolves and propagates.
When vehicle x broadcasts its travel experience data to
vehicle y, a pair of VIC nodes 1t
x and 2t
yIC is generated
in IG corresponding to the inter-vehicle communication
nodes (x and
y ) of CG . The VIC node pairs consist of the
broadcasting VIC node I
bC and the receiving VIC node I
rC
( I
bC , I I
rC C ).
Each pair of VIC nodes is connected by an inter-vehicle
communication based information flow propagation link (I-
link), 1 2( , )t t
x y IM in IG , which is defined as follows:
1 2I I I
b r 1 2M {( , ) C C , }t t
x y x y t t (2)
A directed I-link connects a pair of VIC nodes from the
broadcasting VIC node I
bCt
x to the receiving VIC node
I
rCt
y . This representation stores the corresponding
information flow propagation through the inter-vehicle
communication. We asume that the broadcasting and
receiving of information start at the same time.
Information flow propagation
trajectory (T)-link
Corresponding TED
node generation in Inter-vehicle communication-
based information flow
propagation (I)-linkCorresponding VIC
node generation in
yxA pair of inter-vehicle
communication nodes
Travel experience
data (TED) node
Trajectory of vehicle x
in the traffic flow network
Inter-vehicle
communication link
2t
xj
A pair of virtual inter-
vehicle communication
(VIC) nodes
Node in traffic flow
networki
3t
x3t
w
CG
TG
IG
yx
7t
y
7t
x
i
j
1t
xi
2t
xj
k
l
3t
x6t
z
6t
y5t
xk
8t
xl
IG
4t
x4t
w
3t
w
x
x
zz
Inter-vehicle
communication constraints
IG
Fig. 5. Representation of information flow evolution and
propagation.
Fig. 5 illustrates the generation of the VIC nodes and I-
links in the information flow network corresponding to the
inter-vehicle communication. For example, the occurrence
of the inter-vehicle communication from vehicle y to
vehicle x at time 7t is represented as the pair of
broadcasting VIC node 7t
y and receiving VIC node 7t
x ,
and the directed I-link ( 7 7,t t
y x ). These VIC nodes and I-

Kim and Peeta 8
links can map when/where information propagates from
one vehicle to another vehicle.
We define a set of information flow propagation
trajectory links (T-links) IA as follows: 1 2I I I
1 2A {( , ) (P P ) X, }t t
x xp q x t t (3)
As the TED and VIC nodes for a vehicle occur along with
its trajectory, a directed T-link connects TED-TED, TED-
VIC, VIC-TED or VIC-VIC nodes based on the trajectory
of vehicle x from time 1t to time
2t (1 2t t ). Hence, a
set of T-links represents the associated spatiotemporal
traffic flow dynamics. Fig. 5 illustrates that the directed T-
links 1 2( , )t t
x xi j , 32( , )tt
x xj and 3 4( , )t t
x x connect the TED-
TED, TED-VIC, and VIC-VIC nodes based on the vehicle
x trajectory direction. These T-links explain how
information flow propagates along with this vehicle’s
trajectory.
2.5 Graph structure and reverse search algorithm for
vehicle knowledge identification
The time-dependent knowledge of a vehicle at a
particular location (indicated by a specific TED node) is
represented by a connected group of TED nodes
(interpreted as travel experience data) and the associated
directed links in the graph structure of the information flow
network. Thereby, determining a subgraph that is connected
to a specific node in the information flow network identifies
the vehicle knowledge of interest. We formulate this
process as a searching problem. A graph-based reverse
search algorithm (Ahuja et al., 1993) tracks the flow of
information using a backtracking logic from the specific
node, by tracing the direction opposite to that of the
directed link and identifying each source of information
(that is, each TED node).
The time-dependent knowledge of a vehicle located at a
TED node can be identified by identifying all nodes that can
reach it along directed paths. Fig. 6 illustrates the procedure
to implement the reverse search algorithm to identify the
vehicle knowledge. In the initialization step, every node is
set as “unmarked”, and “Travel Data”, which collects all
nodes that are reachable from a specific node s (vehicle
location), is set to empty. Here, a node l is “reachable” from
another node k if there is a directed path from k to l.
A specific node j = s is marked initially and added to the
empty list “List”. We fan out from j to identify nodes that
can reach it. To do so, we search for admissible links that are
incident to j. A link (i, j) is referred to as admissible if node i
is unmarked and node j is marked. For each admissible link,
we designate its unmarked node i as visited and tag it as
marked. Node i is added to “List” and “Travel Data”. After
all admissible links for j are scanned, remove j from “List”.
Go to the next node in “List” and repeat the aforementioned
algorithmic process until there are no nodes in “List”. When
the algorithm terminates, each TED node in “Travel Data”
indicates a generated travel experience data and each VIC
node explains how it is obtained through inter-vehicle
communication.
begin
Unmark all nodes in IG ;
Mark node s ;
List:={s};
while List 0 do
begin
select a node j in List;
while there is an admissible link (i , j)
that is incident to node j do
begin
mark node i;
add node i to List;
add node i to Travel Data;
end;
delete node j from List;
end;
end;
Fig. 6. Implementation of the graph-based reverse search
algorithm.
3 RETROSPECTIVE MODELING CAPABILITY IN
THE GRAPH-BASED FRAMEWORK
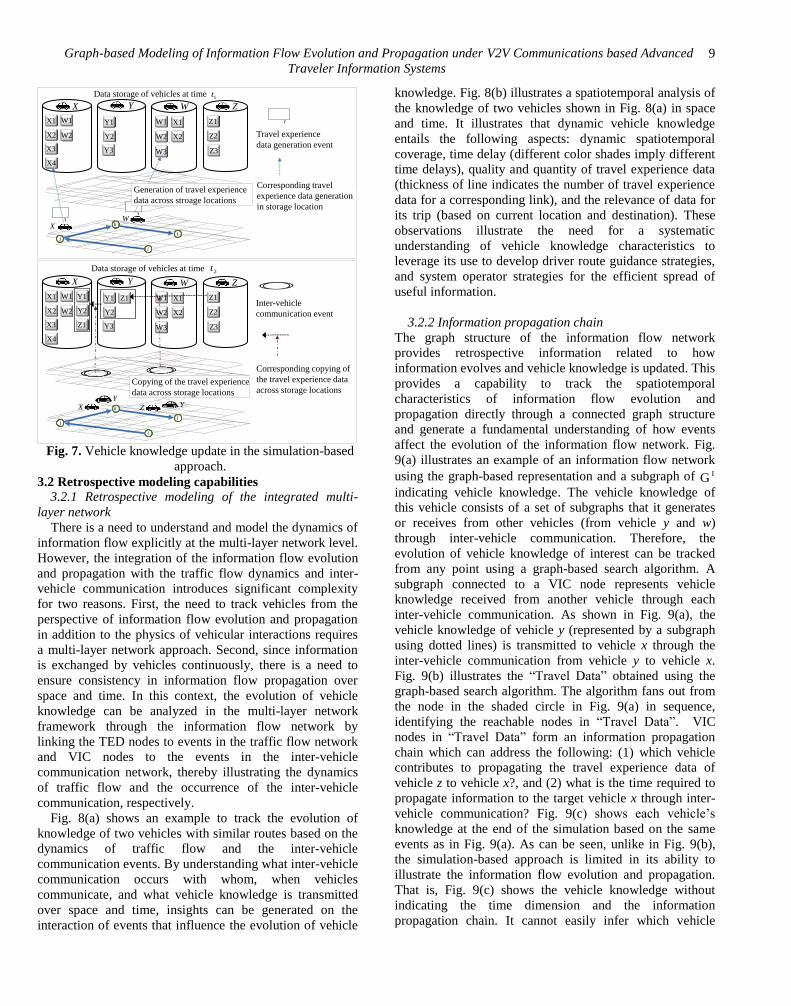
3.1 Vehicle knowledge update in simulation-based
approach
Modeling a large-scale V2V-based ATIS is inherently
complex. Hence, a simulation-based approaches has
typically been used to identify vehicle knowledge in V2V-
based ATIS studies. Past studies (Wu et al., 2005; Kim et
al., 2009; Kim, 2010) use traffic simulators as the traffic
flow layer, and inter-vehicle communication constraints
govern data exchange based on each equipped vehicle’s
location information in each simulation time step. Thereby,
in each time step of the simulation-based approach, each
vehicle’s knowledge is updated using traffic data received
from other vehicles as well as the data generated by the
vehicle itself. In an update process, each vehicle’s
knowledge after a relevant event is copied to an individual
memory location (for that vehicle) which stores its previous
vehicle knowledge; this is illustrated in Fig. 7 for two time
steps (t1 and t2). While this is an intuitive approach that
mimics the individual vehicles’ onboard memory storage
and copies the travel experience data from one vehicle to
another, it lacks retrospective modeling capabilities to
articulate explicitly how information flow evolves and
propagates. Further, as explained in Section 3.3, an
extensive update process is required to update each
vehicle’s knowledge under this approach.
Graph-based Modeling of Information Flow Evolution and Propagation under V2V Communications based Advanced
Traveler Information Systems
9
X1
X2
Y1
Y2
W1
i
j
k
l
Z1
W2
W1
W2
X1
X2
Y3X3
X4
W3
X Y W Z
Data storage of vehicles at time
X1
X2
Y1
Y2
W1
i
j
k
l
Z1
W2
W1
W2
Y1
Y2
X1
X2
Z1
Z1
Z2
Z3Y3X3
X4
W3
Copying of the travel experience
data across storage locations
Data storage of vehicles at time
Travel experience
data generation event
Inter-vehicle
communication event
Corresponding travel
experience data generation
in storage location
XW
Corresponding copying of
the travel experience data
across storage locations
X YY
Z
Generation of travel experience
data across stroage locations
Z2
Z3
1t
2t
X Y W Z
Fig. 7. Vehicle knowledge update in the simulation-based
approach.
3.2 Retrospective modeling capabilities
3.2.1 Retrospective modeling of the integrated multi-
layer network
There is a need to understand and model the dynamics of
information flow explicitly at the multi-layer network level.
However, the integration of the information flow evolution
and propagation with the traffic flow dynamics and inter-
vehicle communication introduces significant complexity
for two reasons. First, the need to track vehicles from the
perspective of information flow evolution and propagation
in addition to the physics of vehicular interactions requires
a multi-layer network approach. Second, since information
is exchanged by vehicles continuously, there is a need to
ensure consistency in information flow propagation over
space and time. In this context, the evolution of vehicle
knowledge can be analyzed in the multi-layer network
framework through the information flow network by
linking the TED nodes to events in the traffic flow network
and VIC nodes to the events in the inter-vehicle
communication network, thereby illustrating the dynamics
of traffic flow and the occurrence of the inter-vehicle
communication, respectively.
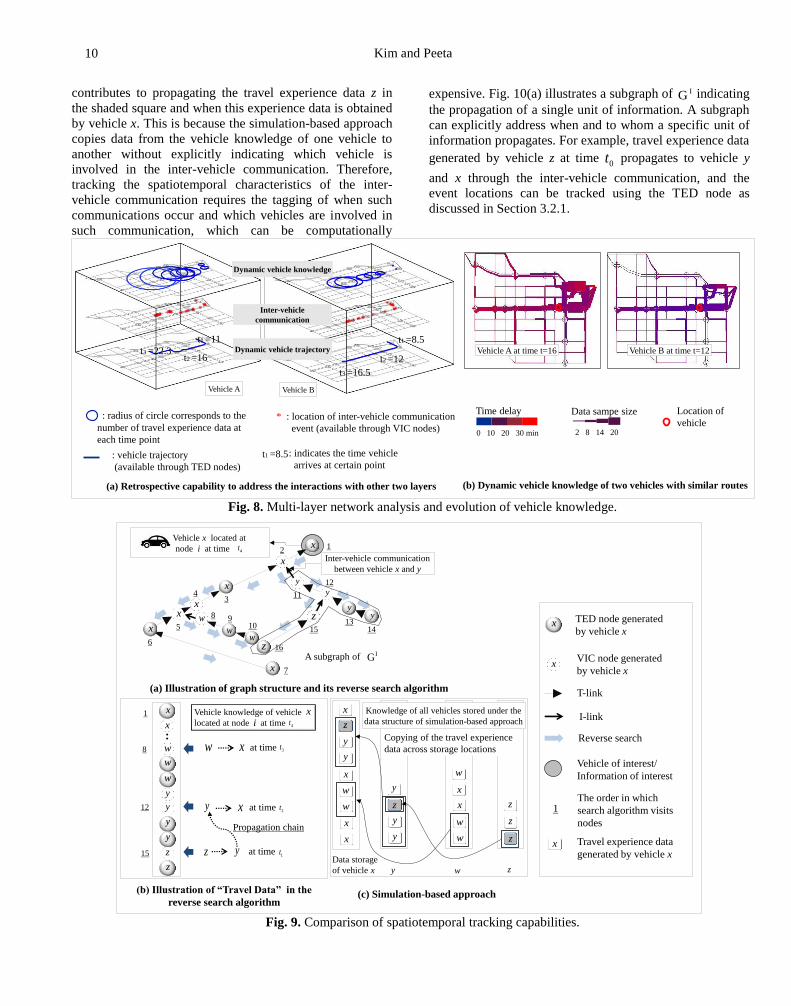
Fig. 8(a) shows an example to track the evolution of
knowledge of two vehicles with similar routes based on the
dynamics of traffic flow and the inter-vehicle
communication events. By understanding what inter-vehicle
communication occurs with whom, when vehicles
communicate, and what vehicle knowledge is transmitted
over space and time, insights can be generated on the
interaction of events that influence the evolution of vehicle
knowledge. Fig. 8(b) illustrates a spatiotemporal analysis of
the knowledge of two vehicles shown in Fig. 8(a) in space
and time. It illustrates that dynamic vehicle knowledge
entails the following aspects: dynamic spatiotemporal
coverage, time delay (different color shades imply different
time delays), quality and quantity of travel experience data
(thickness of line indicates the number of travel experience
data for a corresponding link), and the relevance of data for
its trip (based on current location and destination). These
observations illustrate the need for a systematic
understanding of vehicle knowledge characteristics to
leverage its use to develop driver route guidance strategies,
and system operator strategies for the efficient spread of
useful information.
3.2.2 Information propagation chain
The graph structure of the information flow network
provides retrospective information related to how
information evolves and vehicle knowledge is updated. This
provides a capability to track the spatiotemporal
characteristics of information flow evolution and
propagation directly through a connected graph structure
and generate a fundamental understanding of how events
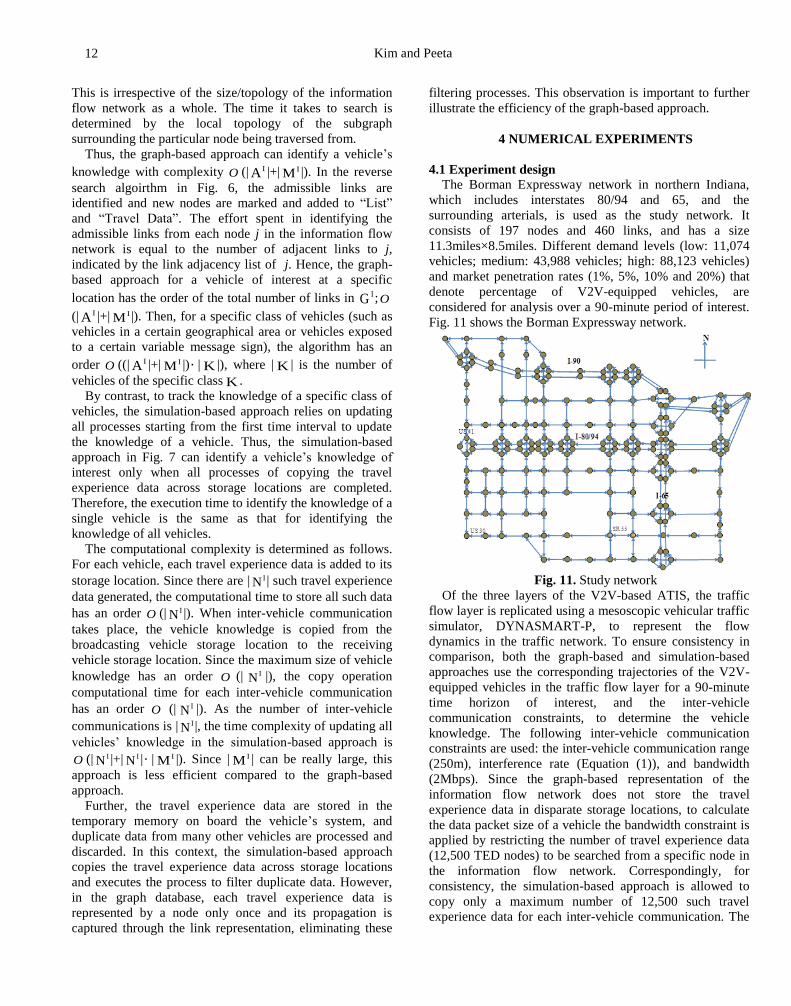
affect the evolution of the information flow network. Fig.
9(a) illustrates an example of an information flow network
using the graph-based representation and a subgraph of GI
indicating vehicle knowledge. The vehicle knowledge of
this vehicle consists of a set of subgraphs that it generates
or receives from other vehicles (from vehicle y and w)
through inter-vehicle communication. Therefore, the
evolution of vehicle knowledge of interest can be tracked
from any point using a graph-based search algorithm. A
subgraph connected to a VIC node represents vehicle
knowledge received from another vehicle through each
inter-vehicle communication. As shown in Fig. 9(a), the
vehicle knowledge of vehicle y (represented by a subgraph
using dotted lines) is transmitted to vehicle x through the
inter-vehicle communication from vehicle y to vehicle x.
Fig. 9(b) illustrates the “Travel Data” obtained using the
graph-based search algorithm. The algorithm fans out from
the node in the shaded circle in Fig. 9(a) in sequence,
identifying the reachable nodes in “Travel Data”. VIC
nodes in “Travel Data” form an information propagation
chain which can address the following: (1) which vehicle
contributes to propagating the travel experience data of
vehicle z to vehicle x?, and (2) what is the time required to
propagate information to the target vehicle x through inter-
vehicle communication? Fig. 9(c) shows each vehicle’s
knowledge at the end of the simulation based on the same
events as in Fig. 9(a). As can be seen, unlike in Fig. 9(b),
the simulation-based approach is limited in its ability to
illustrate the information flow evolution and propagation.
That is, Fig. 9(c) shows the vehicle knowledge without
indicating the time dimension and the information
propagation chain. It cannot easily infer which vehicle
Kim and Peeta 10
contributes to propagating the travel experience data z in
the shaded square and when this experience data is obtained
by vehicle x. This is because the simulation-based approach
copies data from the vehicle knowledge of one vehicle to
another without explicitly indicating which vehicle is
involved in the inter-vehicle communication. Therefore,
tracking the spatiotemporal characteristics of the inter-
vehicle communication requires the tagging of when such
communications occur and which vehicles are involved in
such communication, which can be computationally
expensive. Fig. 10(a) illustrates a subgraph of GI indicating
the propagation of a single unit of information. A subgraph
can explicitly address when and to whom a specific unit of
information propagates. For example, travel experience data
generated by vehicle z at time 0t propagates to vehicle y
and x through the inter-vehicle communication, and the
event locations can be tracked using the TED node as
discussed in Section 3.2.1.
(a) Retrospective capability to address the interactions with other two layers
: vehicle trajectory
(available through TED nodes)
* : location of inter-vehicle communication
event (available through VIC nodes)
: radius of circle corresponds to the
number of travel experience data at
each time point
(b) Dynamic vehicle knowledge of two vehicles with similar routes
0 10 20 30 min 2 8 14 20
Location of
vehicle
Time delay Data sampe size
Vehicle B
Vehicle A at time t=16
Vehicle A
Vehicle B at time t=12Dynamic vehicle trajectory
Inter-vehicle
communication
Dynamic vehicle knowledge
t1 =8.5
t1 =8.5
t3 =16.5
t2 =12
: indicates the time vehicle
arrives at certain point
t1 =11
t3 =22.3t2 =16
Fig. 8. Multi-layer network analysis and evolution of vehicle knowledge.
(c) Simulation-based approach
at time
Propagation chain
(b) Illustration of “Travel Data” in the
reverse search algorithm
at time
at time
12
5
3
8 910
6
7
11
12
1315 14
…
(a) Illustration of graph structure and its reverse search algorithm
16
8
12
15
x
x
w
y
yz
x
ww
yy
z
x
x
xA subgraph of IG
Vehicle x located at
node i at time 4t
x
w
w
y
y
z
xw z
y
y
x
x
w
y
y
1
z
Vehicle knowledge of vehicle
located at node at time
x
4ti
x4
3t
2t
1t
Vehicle of interest/
Information of interest
Reverse search
T-link
I-link
TED node generated
by vehicle xx
1
xVIC node generated
by vehicle x
The order in which
search algorithm visits
nodes
x Travel experience data
generated by vehicle x
x
z
y
y
x
w
w
x
x
y
z
y
w
w
x
x
w
z
z
Copying of the travel experience
data across storage locations
y
Data storage
of vehicle x y w z
z
Inter-vehicle communication
between vehicle x and y
Knowledge of all vehicles stored under the
data structure of simulation-based approach
Fig. 9. Comparison of spatiotemporal tracking capabilities.

Graph-based Modeling of Information Flow Evolution and Propagation under V2V Communications based Advanced
Traveler Information Systems
11
Vehicle location that has
received a specific information
: Location where the information
is initially generated
(a) Illustration of graph structure and its forward search algorithm
(b) Dynamics of information flow propagation
(under market penetration of 10% and 20%, respectively)
98
6
5
2
1z
x
A subgraph ofIG
Travel experience data
generated by vehicle z at
node j at time 0tz
y
y
x
z
z
3
4
y
7
Vehicle of interest/
Information of interestForward search
After 15minutes
After 5minutes
After 25minutes
Fig. 10. Dynamic information flow evolution and
propagation under different market penetration rates.
Therefore, the graph structure transparently provides a
direct link to track the information flow evolution and
propagation from one vehicle to another using the graph-
based search algorithm from a TED node (which indicates a
specific travel experience data). By contrast, the simulation-
based approach requires a scan of the knowledge of all
vehicles stored using the data structure in Fig. 7 to
determine whether it has a particular travel experience data
of interest, which can be computationally expensive. Fig.
10(b) shows the propagation of a travel experience data
from a vehicle in terms of the dynamics of traffic flow and
inter-vehicle communication events. It shows which vehicle
receives this information over time (5, 15, and 25 minutes
after it is first generated) under different market penetration
rates (10% and 20%).
3.3 Efficiency of the graph database
3.3.1 Graph database in the graph-based approach
In contrast to the data storage mechanism of the
simulation-based approach illustrated in Section 3.1, the
graph database used in this study shares data in a single
memory to represent the knowledge of all vehicles through
interconnected nodes and links, and uses a local search to
identify the vehicle knowledge of any vehicle. A reverse
graph-based search algorithm leverages this structure to
traverse the graph in a direction opposite to that of the
information flow propagation from the current location of a
vehicle to determine the current vehicle knowledge. More
details on graph databases can be found in Robinson et al.
(2013) and Sakr and Pardede (2011).
3.3.2 Memory usage efficiency
By sharing the nodes and links to represent the
knowledge of vehicles in the information flow network, the
graph database leads to memory size efficiency compared
to a simulation-based approach which needs to store the
vehicle knowledge separately for each vehicle to update the
knowledge of other vehicles. The reverse search algorithm
for each vehicle of interest identifies the subgraph of the
information flow network that denotes its knowledge.
Thereby, the proposed graph database is efficient and
eliminates the need to store vehicle knowledge for each
vehicle.
By contrast, the simulation-based approach adapts an
update mechanism which copies data from the most recent
vehicle knowledge of the broadcasting vehicle to the
receiving vehicle at the time of inter-vehicle
communication, as seen in Fig. 7. Thus, the simulation-
based approach must memorize all vehicles’ knowledge
individually to compute other vehicles’ knowledge. This
leads to an exponential increase in memory size usage for
large scale real-world traffic networks.
Let | X | be the number of equipped vehicles in V2V-
based ATIS, and | NI |, | C
I |, | AI |, and | M
I |, the number of
elements in NI , C
I , AI , and M
I , respectively. Since the
graph database of the information flow network is stored as
a single graph, there is no duplication of nodes. Hence, the
memory usage for representing the information flow
network can be bounded by (| NI |+| C
I | +| AI |+| M
I |).
However, the memory usage for the simulation-based
approach requires up to (| NI | | X |). This is because it stores
all vehicles’ knowledge individually to compute other
vehicles’ knowledge. That is, each of the | X | vehicles can
have a maximum of | NI | travel experience data nodes.
3.3.3 Computational efficiency
In the graph database, the vehicle knowledge of any
vehicle can be identified by visiting only connected
subgraph of information flow network. Therefore, it does
not require an update of the knowledge of all vehicles to
identify a specific vehicle’s knowledge. In addition to
addressing the three real-world objectives identified in
Section 1, this provides a significant practical benefit in
terms of the ability to track the spatiotemporal evolution of
information for a specific class of vehicles. Further,
traversing from one node to another is a constant time
operation. Thus, the search time is defined solely by the
number of nodes and links identified by the local seach.
Kim and Peeta 12
This is irrespective of the size/topology of the information
flow network as a whole. The time it takes to search is
determined by the local topology of the subgraph
surrounding the particular node being traversed from.
Thus, the graph-based approach can identify a vehicle’s
knowledge with complexity O (| AI |+| M
I |). In the reverse
search algoirthm in Fig. 6, the admissible links are
identified and new nodes are marked and added to “List”
and “Travel Data”. The effort spent in identifying the
admissible links from each node j in the information flow
network is equal to the number of adjacent links to j,
indicated by the link adjacency list of j. Hence, the graph-
based approach for a vehicle of interest at a specific
location has the order of the total number of links in GI ;O
(| AI |+| M
I |). Then, for a specific class of vehicles (such as
vehicles in a certain geographical area or vehicles exposed
to a certain variable message sign), the algorithm has an
order O ((| AI |+| M
I |) | K |), where | K | is the number of
vehicles of the specific class K .
By contrast, to track the knowledge of a specific class of
vehicles, the simulation-based approach relies on updating
all processes starting from the first time interval to update
the knowledge of a vehicle. Thus, the simulation-based
approach in Fig. 7 can identify a vehicle’s knowledge of
interest only when all processes of copying the travel
experience data across storage locations are completed.
Therefore, the execution time to identify the knowledge of a
single vehicle is the same as that for identifying the
knowledge of all vehicles.
The computational complexity is determined as follows.
For each vehicle, each travel experience data is added to its
storage location. Since there are | NI | such travel experience
data generated, the computational time to store all such data
has an order O (| NI |). When inter-vehicle communication
takes place, the vehicle knowledge is copied from the
broadcasting vehicle storage location to the receiving
vehicle storage location. Since the maximum size of vehicle
knowledge has an order O (| NI |), the copy operation
computational time for each inter-vehicle communication
has an order O (| NI |). As the number of inter-vehicle
communications is | NI |, the time complexity of updating all
vehicles’ knowledge in the simulation-based approach is
O (| NI |+| N
I | | MI |). Since | M
I | can be really large, this
approach is less efficient compared to the graph-based
approach.
Further, the travel experience data are stored in the
temporary memory on board the vehicle’s system, and
duplicate data from many other vehicles are processed and
discarded. In this context, the simulation-based approach
copies the travel experience data across storage locations
and executes the process to filter duplicate data. However,
in the graph database, each travel experience data is
represented by a node only once and its propagation is
captured through the link representation, eliminating these
filtering processes. This observation is important to further
illustrate the efficiency of the graph-based approach.
4 NUMERICAL EXPERIMENTS
4.1 Experiment design
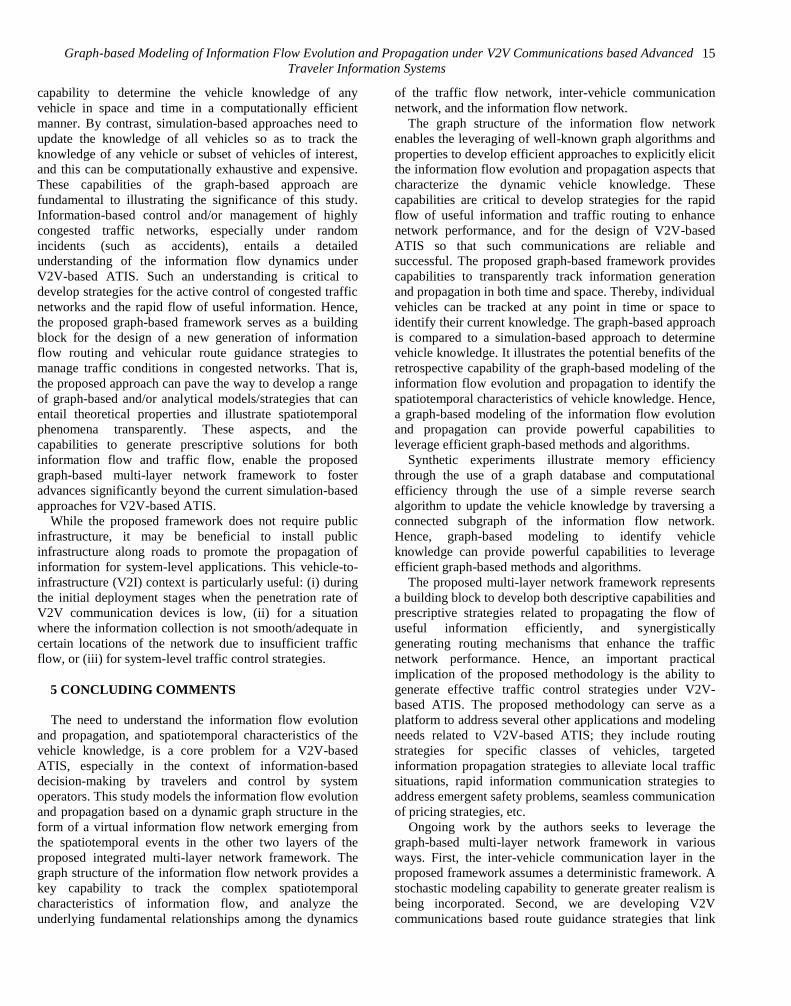
The Borman Expressway network in northern Indiana,
which includes interstates 80/94 and 65, and the
surrounding arterials, is used as the study network. It
consists of 197 nodes and 460 links, and has a size
11.3miles×8.5miles. Different demand levels (low: 11,074
vehicles; medium: 43,988 vehicles; high: 88,123 vehicles)
and market penetration rates (1%, 5%, 10% and 20%) that
denote percentage of V2V-equipped vehicles, are
considered for analysis over a 90-minute period of interest.
Fig. 11 shows the Borman Expressway network.
Fig. 11. Study network
Of the three layers of the V2V-based ATIS, the traffic
flow layer is replicated using a mesoscopic vehicular traffic
simulator, DYNASMART-P, to represent the flow
dynamics in the traffic network. To ensure consistency in
comparison, both the graph-based and simulation-based
approaches use the corresponding trajectories of the V2V-
equipped vehicles in the traffic flow layer for a 90-minute
time horizon of interest, and the inter-vehicle
communication constraints, to determine the vehicle
knowledge. The following inter-vehicle communication
constraints are used: the inter-vehicle communication range
(250m), interference rate (Equation (1)), and bandwidth
(2Mbps). Since the graph-based representation of the
information flow network does not store the travel
experience data in disparate storage locations, to calculate
the data packet size of a vehicle the bandwidth constraint is
applied by restricting the number of travel experience data
(12,500 TED nodes) to be searched from a specific node in
the information flow network. Correspondingly, for
consistency, the simulation-based approach is allowed to
copy only a maximum number of 12,500 such travel
experience data for each inter-vehicle communication. The

Graph-based Modeling of Information Flow Evolution and Propagation under V2V Communications based Advanced
Traveler Information Systems
13
performance of the two approaches to identify the vehicle
knowledge under various scenarios is examined in terms of
memory usage efficiency and computational efficiency. In
all scenarios, demand is loaded during the first 90 minutes
of analysis. We examine twelve scenarios that represent
combinations of three demand levels (low, medium, and
high) and four market penetration rates (1%, 5%, 10%, and
20%).
4.2 Information flow network size and construction time
Given events in the traffic flow and inter-vehicle
communication networks, the information flow network is
constructed in the graph-based approach by adding new
nodes and links. The sizes of the information flow network
under the 250m communication range, and different
scenarios of demand and market penetration levels are
summarized in Table 1 in terms of the number of equipped
vehicles | X | and the number of network components,
including TED nodes | IN |, VIC nodes | IC |, T-links |IA |,
and I-links |IM |. Here, | IN | increases with the number of
equipped vehicles | X |. As vehicles are more likely to
exchange information under higher demand and market
penetration rates, the associated number of nodes | IC |, and
links |IA | and |
IM | increase rapidly. The time to construct IG in terms of generating the node-link adjacency matrix of
the information flow network is also shown in Table 1.
Given the information flow network for each scenario, the
graph-based approach identifies the spatiotemporal
characteristics of vehicle knowledge using the graph-based
reverse search algorithm.
4.3 Performance evaluation
4.3.1 Memory usage efficiency
Table 2 compares the memory usage of the graph-based
information flow network and the simulation-based
approach. For example, for the high demand scenario with
market penetration 20%, the memory usage to store the
knowledge of all vehicles requires 2.9 MB for the graph-
based representation and 1.45 GB for the simulation-based
approach. The associated ratios of the memory usage of the
simulation-based and graph-based approaches are shown in
the last column. As the number of inter-vehicle
communication events increases rapidly with higher
demand and market penetration rates, the memory required
to store the knowledge of all vehicles individually tends to
increase exponentially.
As discussed earlier, the superior memory usage
efficiency under the graph-based approach is due to the
sharing of nodes and links to represent vehicle knowledge
rather than duplicating the travel experience data when
information propagation occurs.
Table 1
Information flow network size and construction time under different scenarios
Scenario* Size of the information flow network Network
construction time
| X | | IN | | IC | |IA | |
IM | (unit: seconds)
L-1 111 1,082 174 1,145 87 0.04
L-5 543 5,060 4,146 8,663 2,073 0.06
L-10 1,091 10,324 15,936 25,169 7,968 0.53
L-20 2,173 20,763 62,280 80,870 31,140 1.4
M-1 372 3,490 2,488 5,606 1,244 0.25
M-5 1,834 16,885 54,464 69,515 27,232 1.15
M-10 3,682 33,995 202,806 233,119 101,403 4.2
M-20 7,354 67,729 689,358 749,733 344,679 15.1
H-1 601 4,959 8,260 12,618 4,130 0. 4
H-5 2,986 24,898 174,082 195,994 87,041 2.8
H-10 5,953 49,895 589,180 633,122 294,590 13.2
H-20 11,953 99,947 1,945,198 2,033,192 972,599 42.3
*L: low demand, M: medium demand, H: high demand; 1,5,10, and 20: market penetration rate (in percent)
4.3.2 Computational efficiency
Table 3 compares the computational times of the graph-
based and the simulation-based approaches to determine the
vehicle knowledge of all vehicles at their destinations to
ensure consistency in comparison, as the simulation-based
approach can determine their vehicle knowledge only at the
end of the horizon of interest (90 minutes in the study
experiments). The number of equipped vehicles | X |, shown
in the second column, represents the number of times that
the reverse search algorithm is executed. Since the graph-
based approach can identify the knowledge of a vehicle of

Kim and Peeta 14
interest without updating the other vehicles’ knowledge, the
associated average computational times across the vehicles
in column 2 are shown in the third column. The
computational times to determine the knowledge of all
vehicles are shown in the fourth column (as the product of
the second and third columns). The computational times to
determine the knowledge of all vehicles under the
simulation-based approach are shown in last column.
In summary, an explicit modeling of the information
flow network as a graph database leads to memory
efficiency due to the circumvention of redundant storage of
the travel experience data. Further, the local searching of
only reachable nodes, which are a subgraph of the
information flow network, enables the computational
efficiency.
Table 2
Memory usage to update vehicle knowledge
Scenario* Memory usage (unit: Megabytes)
Graph-based approach Simulation-based approach Comparison ratio
L-1 0.025 0.1 4
L-5 0.1 2.5 25
L-10 0.2 13.3 67
L-20 0.4 54 135
M-1 0.1 0.6 6
M-5 0.3 28.2 94
M-10 0.7 130 185
M-20 1.4 543 387
H-1 0.1 1.2 12
H-5 0.5 49 98
H-10 1.1 477 433
H-20 2.9 1,454 501 *L: low demand, M: medium demand, H: high demand; 1,5,10, and 20: market penetration rate (in percent)
Table 3
Computation time to determine vehicle knowledge for all vehicles
Scenario*
Graph-based approach for the vehicle knowledge identification Simulation-based approach
Number of
equipped vehicles
| X |
Average execution
time of the search
algorithm (seconds)
Time to determine the
knowledge of all vehicles
(seconds)
Time to determine the
knowledge of all vehicles
(seconds)
L-1 111 0.0018 0.2 0.3
L-5 543 0.0030 1.6 2.0
L-10 1,091 0.0046 5.0 7.2
L-20 2,173 0.0075 16.3 38.8
M-1 372 0.0024 0.9 1.4
M-5 1,834 0.0074 13.6 26.7
M-10 3,682 0.0169 62 310
M-20 7,354 0.0567 417 2,552
H-1 601 0.0031 1.9 4.4
H-5 2,986 0.0175 52 166
H-10 5,953 0.0502 299 1,147
H-20 11,953 0.1715 2,050 9,212 *L: low demand, M: medium demand, H: high demand; 1,5,10, and 20: market penetration rate (in percent)
4.4 Key insights for V2V-based ATIS
As illustrated in Sections 3 and 4, a primary benefit of
the graph-based approach is its capability to track the
spatiotemporal characteristics of vehicle knowledge
explicitly. Further, the proposed graph-based multi-layer
network framework provides an explicit modeling
capability to articulate how information flow evolves and
propagates. It can link it to the interactions with traffic flow
and inter-vehicle communication dynamics. The graph-
based multi-layer framework also provides the important
Graph-based Modeling of Information Flow Evolution and Propagation under V2V Communications based Advanced
Traveler Information Systems
15
capability to determine the vehicle knowledge of any
vehicle in space and time in a computationally efficient
manner. By contrast, simulation-based approaches need to
update the knowledge of all vehicles so as to track the
knowledge of any vehicle or subset of vehicles of interest,
and this can be computationally exhaustive and expensive.
These capabilities of the graph-based approach are
fundamental to illustrating the significance of this study.
Information-based control and/or management of highly
congested traffic networks, especially under random
incidents (such as accidents), entails a detailed
understanding of the information flow dynamics under
V2V-based ATIS. Such an understanding is critical to
develop strategies for the active control of congested traffic
networks and the rapid flow of useful information. Hence,
the proposed graph-based framework serves as a building
block for the design of a new generation of information
flow routing and vehicular route guidance strategies to
manage traffic conditions in congested networks. That is,
the proposed approach can pave the way to develop a range
of graph-based and/or analytical models/strategies that can
entail theoretical properties and illustrate spatiotemporal
phenomena transparently. These aspects, and the
capabilities to generate prescriptive solutions for both
information flow and traffic flow, enable the proposed
graph-based multi-layer network framework to foster
advances significantly beyond the current simulation-based
approaches for V2V-based ATIS.
While the proposed framework does not require public
infrastructure, it may be beneficial to install public
infrastructure along roads to promote the propagation of
information for system-level applications. This vehicle-to-
infrastructure (V2I) context is particularly useful: (i) during
the initial deployment stages when the penetration rate of
V2V communication devices is low, (ii) for a situation
where the information collection is not smooth/adequate in
certain locations of the network due to insufficient traffic
flow, or (iii) for system-level traffic control strategies.
5 CONCLUDING COMMENTS
The need to understand the information flow evolution
and propagation, and spatiotemporal characteristics of the
vehicle knowledge, is a core problem for a V2V-based
ATIS, especially in the context of information-based
decision-making by travelers and control by system
operators. This study models the information flow evolution
and propagation based on a dynamic graph structure in the
form of a virtual information flow network emerging from
the spatiotemporal events in the other two layers of the
proposed integrated multi-layer network framework. The
graph structure of the information flow network provides a
key capability to track the complex spatiotemporal
characteristics of information flow, and analyze the
underlying fundamental relationships among the dynamics
of the traffic flow network, inter-vehicle communication
network, and the information flow network.
The graph structure of the information flow network
enables the leveraging of well-known graph algorithms and
properties to develop efficient approaches to explicitly elicit
the information flow evolution and propagation aspects that
characterize the dynamic vehicle knowledge. These
capabilities are critical to develop strategies for the rapid
flow of useful information and traffic routing to enhance
network performance, and for the design of V2V-based
ATIS so that such communications are reliable and
successful. The proposed graph-based framework provides
capabilities to transparently track information generation
and propagation in both time and space. Thereby, individual
vehicles can be tracked at any point in time or space to
identify their current knowledge. The graph-based approach
is compared to a simulation-based approach to determine
vehicle knowledge. It illustrates the potential benefits of the
retrospective capability of the graph-based modeling of the
information flow evolution and propagation to identify the
spatiotemporal characteristics of vehicle knowledge. Hence,
a graph-based modeling of the information flow evolution
and propagation can provide powerful capabilities to
leverage efficient graph-based methods and algorithms.
Synthetic experiments illustrate memory efficiency
through the use of a graph database and computational
efficiency through the use of a simple reverse search
algorithm to update the vehicle knowledge by traversing a
connected subgraph of the information flow network.
Hence, graph-based modeling to identify vehicle
knowledge can provide powerful capabilities to leverage
efficient graph-based methods and algorithms.
The proposed multi-layer network framework represents
a building block to develop both descriptive capabilities and
prescriptive strategies related to propagating the flow of
useful information efficiently, and synergistically
generating routing mechanisms that enhance the traffic
network performance. Hence, an important practical
implication of the proposed methodology is the ability to
generate effective traffic control strategies under V2V-
based ATIS. The proposed methodology can serve as a
platform to address several other applications and modeling
needs related to V2V-based ATIS; they include routing
strategies for specific classes of vehicles, targeted
information propagation strategies to alleviate local traffic
situations, rapid information communication strategies to
address emergent safety problems, seamless communication
of pricing strategies, etc.
Ongoing work by the authors seeks to leverage the
graph-based multi-layer network framework in various
ways. First, the inter-vehicle communication layer in the
proposed framework assumes a deterministic framework. A
stochastic modeling capability to generate greater realism is
being incorporated. Second, we are developing V2V
communications based route guidance strategies that link

Kim and Peeta 16
vehicle knowledge to driver decision-making, thereby
completing the interactions loop in Fig. 1 by linking the
information flow network dynamics to the traffic flow
network dynamics.
ACKNOWLEDGMENTS
This study is based on research supported by the
NEXTRANS Center, the USDOT Region 5 University
Transportation Center at Purdue University. Any errors or
omissions remain the sole responsibility of the authors.
REFERENCES
Ahuja, R.K., Magnanti, T.L. & Orlin, J.B. (1993),
Network flows: Theory, algorithms, and applications,
Englewood Cliffs, NJ, Prentice Hall.
Eichler, S., Benedikt, O., Schroth, C., & Kosch, T.
(2005), Simulation of car-to-car messaging: analyzing the
impact on road traffic, in Proceedings of Annual
International Symposium on Modeling, Analysis, and
Simulation of Computer and Telecommunications Systems,
Piscataway, New Jersey, 507-510.
Fitzgibbons, B., Fujimoto, R., Guensler, R., Hunter, M.,
Park, A. & Wu, H. (2004), Distributed simulation test bed
for intelligent transportation systems design and analysis, in
Proceedings of the National Conference on Digital
Government Research, Seattle, Washington, 308-309.
Gupta, P. & Kumar, P.R. (2000), The capacity of
wireless networks, IEEE Transactions on Information
Theory, 46(2), 388–404.
Kim, H., Hunter, M., & Fujimoto, R. (2009), A
simulation-based investigation of a dynamic advanced
traveler information system, in Proceedings of the 2009
Winter Simulation Conference, Austin, Texas, 1124-1135.
Kim, H. (2010), A simulation framework for traffic
information dissemination in ubiquitous vehicular ad hoc
networks, Ph.D. thesis, University of Maryland.
Kim, Y.H., Peeta, S., & He, X., (2014). An analytical
model to characterize the spatiotemporal propagation of
information under vehicle-to-vehicle communications, in
Proceedings of the 17th International IEEE Conference on
Intelligent Transportation Systems, Qingdao, China, 1142-
1147.
Li, J., Blake, C., Douglas, S.J., Lee, H.I. & Morris, R.
(2001), Capacity of ad hoc wireless networks, in
Proceedings of the 7th Annual International Conference on
Mobile Computing and Networking, Rome, Italy, 61–69.
Robinson, I., Webber, J. & Eifrem, E. (2013), Graph
Databases, O’Reilly Media, Inc.
Sakr, S. & Pardede, E. (2011), Graph Data Management:
Techniques and Applications, IGI Global.
Schmidt-Eisenlohr, F., Torrent-Moreno, M., Mittag, J. &
Hartenstein, H. (2007), Simulation platform for inter-
vehicle communications and analysis of periodic
information exchange, in Proceedings of the 4th Annual
Conference on Wireless on Demand Network Systems and
Services(WONS), Obergurgl, Austria, 50-58.
Schroth, C., Dotzer, F., Korch, T. Ostermaier, B. &
Strassberger, M. (2005), Simulating the traffic effects of
vehicle-to-vehicle messaging systems, in Proceedings of
the 5th International Conference on ITS
Telecommunications, Brest, France.
Vuyyuru, R. & Oguchi, K. (2007), Vehicle-to-Vehicle ad
hoc communication protocol evaluation using simulation
framework, in Proceedings of the 4th IEEE/IFIP Wireless
On Demand Networks and Services, Austria, 100–106.
Yang, X. & Recker, W. (2008), Evaluation of
information applications of a self-organizing distributed
traffic information system for a large-scale real world
traffic network, Computer-Aided Civil and Infrastructure
Engineering, 23(8), 575-595.
Wang, X.B., (2007). Modeling the process of information
relay through inter-vehicle communication, Transportation
Research Part B: Methodological, 41(6), 684-700.
Wu, H., Lee, J., Hunter, M., Fujimoto, R.M., Guensler,
R.L. & Ko, J. (2005), Efficiency of simulated vehicle-to-
vehicle message propagation in Atlanta’s I-75 corridor,
Journal of the Transportation Research Board,
Transportation Research Board of the National Academies,
Washington D.C., 1910, 82-89.