graph structure in the web - snap: stanford network...
TRANSCRIPT
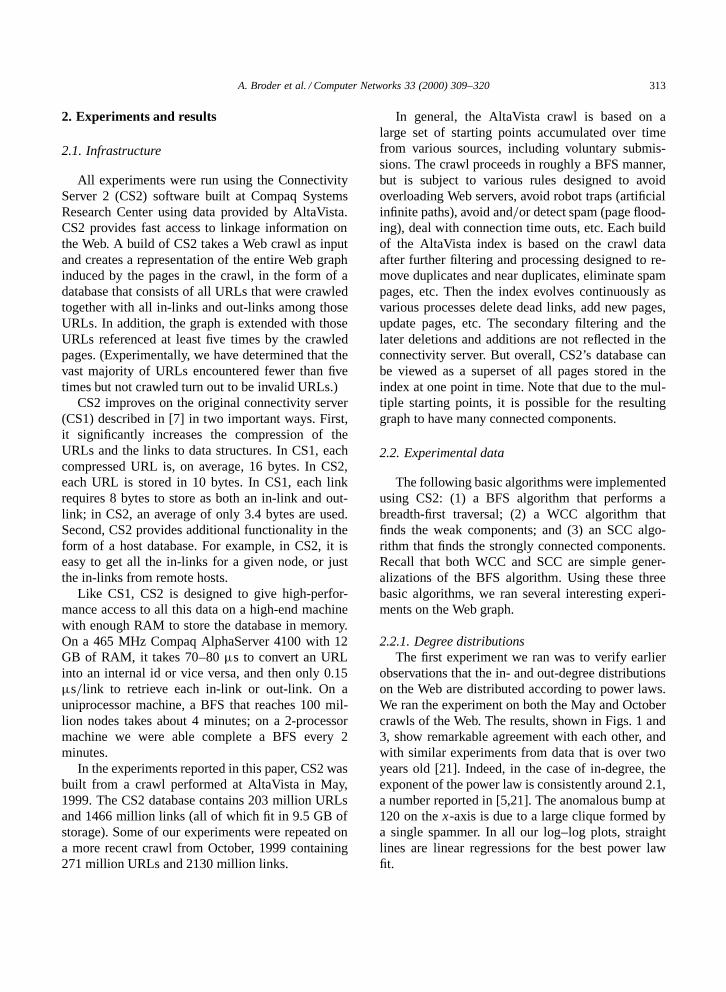
Computer Networks 33 (2000) 309–320www.elsevier.com/locate/comnet
Graph structure in the Web
Andrei Broder a, Ravi Kumar b,Ł, Farzin Maghoul a, Prabhakar Raghavan b,Sridhar Rajagopalan b, Raymie Stata c, Andrew Tomkins b, Janet Wiener c
a AltaVista Company, San Mateo, CA, USAb IBM Almaden Research Center, San Jose, CA, USA
c Compaq Systems Research Center, Palo Alto, CA, USA
Abstract
The study of the Web as a graph is not only fascinating in its own right, but also yields valuable insight into Webalgorithms for crawling, searching and community discovery, and the sociological phenomena which characterize itsevolution. We report on experiments on local and global properties of the Web graph using two AltaVista crawls each withover 200 million pages and 1.5 billion links. Our study indicates that the macroscopic structure of the Web is considerablymore intricate than suggested by earlier experiments on a smaller scale. 2000 Published by Elsevier Science B.V. Allrights reserved.
Keywords: Graph structure; Diameter; Web measurement
1. Introduction
Consider the directed graph whose nodes corre-spond to static pages on the Web, and whose arcscorrespond to links between these pages. We studyvarious properties of this graph including its diame-ter, degree distributions, connected components, andmacroscopic structure. There are several reasons fordeveloping an understanding of this graph.(1) Designing crawl strategies on the Web [15].(2) Understanding of the sociology of content cre-
ation on the Web.(3) Analyzing the behavior of Web algorithms that
make use of link information [9–11,20,26]. Totake just one example, what can be said of thedistribution and evolution of PageRank [9] val-ues on graphs like the Web?
Ł Corresponding author. E-mail: [email protected]
(4) Predicting the evolution of Web structures suchas bipartite cores [21] and Webrings, and de-veloping better algorithms for discovering andorganizing them.
(5) Predicting the emergence of important new phe-nomena in the Web graph.
We detail a number of experiments on a Webcrawl of approximately 200 million pages and 1.5billion links; the scale of this experiment is thus fivetimes larger than the previous biggest study [21] ofstructural properties of the Web graph, which useda pruned data set from 1997 containing about 40million pages. Recent work ([21] on the 1997 crawl,and [5] on the approximately 325 thousand nodend.edu subset of the Web) has suggested that thedistribution of degrees (especially in-degrees, i.e.,the number of links to a page) follows a power law.
The power law for in-degree: the probability
1389-1286/00/$ – see front matter 2000 Published by Elsevier Science B.V. All rights reserved.PII: S 1 3 8 9 - 1 2 8 6 ( 0 0 ) 0 0 0 8 3 - 9
310 A. Broder et al. / Computer Networks 33 (2000) 309–320
that a node has in-degree i is proportional to 1=i x ,for some x > 1.
We verify the power law phenomenon in current(considerably larger) Web crawls, confirming it as abasic Web property.
In other recent work, [4] report the intriguingfinding that most pairs of pages on the Web areseparated by a handful of links, almost always under20, and suggest that this number will grow logarith-mically with the size of the Web. This is viewed bysome as a ‘small world’ phenomenon. Our experi-mental evidence reveals a rather more detailed andsubtle picture: most ordered pairs of pages cannot bebridged at all and there are significant numbers ofpairs that can be bridged, but only using paths goingthrough hundreds of intermediate pages. Thus, theWeb is not the ball of highly connected spaghetti webelieved it to be; rather, the connectivity is stronglylimited by a high-level global structure.
1.1. Our main results
We performed three sets of experiments on Webcrawls from May 1999 and October 1999. Unlessotherwise stated, all results described below are forthe May 1999 crawl, but all conclusions have beenvalidated for the October 1999 crawl as well. First,we generated the in- and out-degree distributions,confirming previous reports on power laws; for in-stance, the fraction of Web pages with i in-linksis proportional to 1=i2:1. The constant 2.1 is in re-markable agreement with earlier studies at varyingscales [5,21]. In our second set of experiments westudied the directed and undirected connected com-ponents of the Web. We show that power laws alsoarise in the distribution of sizes of these connectedcomponents. Finally, in our third set of experiments,we performed a number of breadth-first searchesfrom randomly chosen start nodes. We detail theseexperiments in Section 2.
Our analysis reveals an interesting picture (Fig. 9)of the Web’s macroscopic structure. Most (over 90%)of the approximately 203 million nodes in our May1999 crawl form a single connected component iflinks are treated as undirected edges. This connectedWeb breaks naturally into four pieces. The first pieceis a central core, all of whose pages can reach
one another along directed links; this ‘giant stronglyconnected component’ (SCC) is at the heart of theWeb. The second and third pieces are called IN andOUT. IN consists of pages that can reach the SCC,but cannot be reached from it; possibly new sitesthat people have not yet discovered and linked to.OUT consists of pages that are accessible from theSCC, but do not link back to it, such as corporateWebsites that contain only internal links. Finally, theTENDRILS contain pages that cannot reach the SCC,and cannot be reached from the SCC. Perhaps themost surprising fact is that the size of the SCC isrelatively small; it comprises about 56 million pages.Each of the other three sets contain about 44 millionpages, thus, all four sets have roughly the samesize.
We show that the diameter of the central core(SCC) is at least 28, and that the diameter of thegraph as a whole is over 500 (see Section 1.3 fordefinitions of diameter). We show that for randomlychosen source and destination pages, the probabilitythat any path exists from the source to the destinationis only 24%. We also show that, if a directed path ex-ists, its average length will be about 16. Likewise, ifan undirected path exists (i.e., links can be followedforwards or backwards), its average length will beabout 6. These analyses appear in the Section 3.These results are remarkably consistent across twodifferent, large AltaVista crawls. This suggests thatour results are relatively insensitive to the particularcrawl we use, provided it is large enough. We willsay more about crawl effects in Section 3.4.
In a sense the Web is much like a complicated or-ganism, in which the local structure at a microscopicscale looks very regular like a biological cell, but theglobal structure exhibits interesting morphologicalstructure (body and limbs) that are not obviously ev-ident in the local structure. Therefore, while it mightbe tempting to draw conclusions about the structureof the Web graph from a local picture of it, suchconclusions may be misleading.
1.2. Related prior work
Broadly speaking, related prior work can be clas-sified into two groups: (1) observations of the powerlaw distributions on the Web; and (2) work on apply-ing graph theoretic methods to the Web.
A. Broder et al. / Computer Networks 33 (2000) 309–320 311
1.2.1. Zipf–Pareto–Yule and power lawsDistributions with an inverse polynomial tail have
been observed in a number of contexts. The earliestobservations are due to Pareto [27] in the contextof economic models. Subsequently, these statisticalbehaviors have been observed in the context of lit-erary vocabulary [32], sociological models [33], andeven oligonucleotide sequences [24] among others.Our focus is on the closely related power law dis-tributions, defined on the positive integers, with theprobability of the value i being proportional to 1=i k
for a small positive number k. Perhaps the first rig-orous effort to define and analyze a model for powerlaw distributions is due to Simon [30].
More recently, power law distributions have beenobserved in various aspects of the Web. Two linesof work are of particular interest to us. First, powerlaws have been found to characterize user behavioron the Web in two related but dual forms:(1) access statistics for Web pages, which can be
easily obtained from server logs (but for cachingeffects); see [1,2,17,19];
(2) numbers of times users at a single site accessparticular pages, as verified by instrumentingand inspecting logs from Web caches, proxies,and clients (see [6] and references therein, aswell as [23]).
Second, and more relevant to our immediate con-text, is the distribution of degrees on the Web graph.In this context, recent work (see [5,21]) suggests thatboth the in- and the out-degrees of vertices on theWeb graph have power laws. The difference in scopein these two experiments is noteworthy. The first [21]examines a Web crawl from 1997 due to Alexa, Inc.,with a total of over 40 million nodes. The second [5],examines Web pages from the University of NotreDame domain, *.nd.edu, as well as a portion of theWeb reachable from three other URLs. In this paper,we verify these power laws on more recent (andconsiderably larger) Web crawls. This collection offindings reveals an almost fractal-like quality for thepower law in-degree and out-degree distributions, inthat it appears both as a macroscopic phenomenonon the entire Web, as a microscopic phenomenonat the level of a single university Website, and atintermediate levels between these two.
There is no evidence that users’ browsing behav-ior, access statistics and the linkage statistics on the
Web graph are related in any fundamental way, al-though it is very tempting to conjecture that this isindeed the case. It is usually the case, though notalways so, that pages with high in-degree will alsohave high PageRank [9]. Indeed, one way of viewingPageRank is that it puts a number on how easy (ordifficult) it is to find particular pages by a brows-ing-like activity. Consequently, it is plausible that thein-degree distributions induce a similar distributionon browsing activity and consequently, on accessstatistics.
Faloutsos et al. [16] observe Zipf–Pareto distribu-tions (power law distributions on the ranks of values)on the Internet network topology using a graph ofthe network obtained from the routing tables of abackbone BGP router.
1.2.2. Graph theoretic methodsMuch recent work has addressed the Web as a
graph and applied algorithmic methods from graphtheory in addressing a slew of search, retrieval, andmining problems on the Web. The efficacy of thesemethods was already evident even in early local ex-pansion techniques [10]. Since then, the increasingsophistication of the techniques used, the incorpora-tion of graph theoretical methods with both classicaland new methods which examine context and con-tent, and richer browsing paradigms have enhancedand validated the study and use of such methods. Fol-lowing Butafogo and Schneiderman [10], the viewthat connected and strongly connected componentsrepresent meaningful entities has become accepted.Pirolli et al. [28] augment graph theoretic analysis toinclude document content, as well as usage statistics,resulting in a rich understanding of domain structureand a taxonomy of roles played by Web pages.
Graph theoretic methods have been used forsearch [8,9,12,13,20], browsing and information for-aging [10,11,14,28,29], and Web mining [21,22,25,26]. We expect that a better structural characteriza-tion of the Web will have much to say in each ofthese contexts.
In this section we formalize our view of the Web asa graph; in this view we ignore the text and other con-tent in pages, focusing instead on the links betweenpages. Adopting the terminology of graph theory [18],we refer to pages as nodes, and to links as arcs. In thisframework, the Web becomes a large graph contain-
312 A. Broder et al. / Computer Networks 33 (2000) 309–320
ing several hundred million nodes, and a few billionarcs. We will refer to this graph as the Web graph,and our goal in this paper is to understand some of itsproperties. Before presenting our model for Web-likegraphs, we begin with a brief primer on graph theory,and a discussion of graph models in general.
1.3. A brief primer on graphs and terminology
The reader familiar with basic notions from graphtheory may skip this primer.
A directed graph consists of a set of nodes, de-noted V and a set of arcs, denoted E . Each arc is anordered pair of nodes (u; v) representing a directedconnection from u to v. The out-degree of a node uis the number of distinct arcs .u; v1/: : :.u; vk/ (i.e.,the number of links from u), and the in-degree isthe number of distinct arcs .v1; u/: : :.vk; u/ (i.e., thenumber of links to u). A path from node u to nodev is a sequence of arcs .u; u1/; .u1; u2/; : : :.uk; v/.One can follow such a sequence of arcs to ‘walk’through the graph from u to v. Note that a pathfrom u to v does not imply a path from v to u. Thedistance from u to v is one more than the smallestk for which such a path exists. If no path exists, thedistance from u to v is defined to be infinity. If (u; v)is an arc, then the distance from u to v is 1.
Given a directed graph, a strongly connected com-ponent (strong component for brevity) of this graphis a set of nodes such that for any pair of nodes u andv in the set there is a path from u to v. In general, adirected graph may have one or many strong compo-nents. The strong components of a graph consist ofdisjoint sets of nodes. One focus of our studies willbe in understanding the distribution of the sizes ofstrong components on the Web graph.
An undirected graph consists of a set of nodesand a set of edges, each of which is an unorderedpair fu; vg of nodes. In our context, we say there isan edge between u and v if there is a link betweenu and v, without regard to whether the link pointsfrom u to v or the other way around. The degree of anode u is the number of edges incident to u. A pathis defined as for directed graphs, except that now theexistence of a path from u to v implies a path fromv to u. A component of an undirected graph is a setof nodes such that for any pair of nodes u and v inthe set there is a path from u to v. We refer to the
components of the undirected graph obtained from adirected graph by ignoring the directions of its arcsas the weak components of the directed graph. Thustwo nodes on the Web may be in the same weakcomponent even though there is no directed pathbetween them (consider, for instance, a node u thatpoints to two other nodes v and w; then v and w arein the same weak component even though there maybe no sequence of links leading from v to w or viceversa). The interplay of strong and weak componentson the (directed) Web graph turns out to reveal someunexpected properties of the Web’s connectivity.
A breadth-first search (BFS) on a directed graphbegins at a node u of the graph, and proceeds tobuild up the set of nodes reachable from u in aseries of layers. Layer 1 consists of all nodes that arepointed to by an arc from u. Layer k consists of allnodes to which there is an arc from some vertex inlayer k � 1, but are not in any earlier layer. Noticethat by definition, layers are disjoint. The distance ofany node from u can be read out of the breadth-firstsearch. The shortest path from u to v is the index ofthe layer v belongs in, i.e., if there is such a layer.On the other hand, note that a node that cannot bereached from u does not belong in any layer, andthus we define the distance to be infinity. A BFS onan undirected graph is defined analogously.
Finally, we must take a moment to describe theexact notions of diameter we study, since severalhave been discussed informally in the context ofthe Web. Traditionally, the diameter of a graph,directed or undirected, is the maximum over all or-dered pairs (u; v) of the shortest path from u to v.Some researchers have proposed studying the aver-age distance of a graph, defined to be the lengthof the shortest path from u to v, averaged over allordered pairs (u; v); this is referred to as diameterin [4]. The difficulty with this notion is that even asingle pair (u; v) with no path from u to v resultsin an infinite average distance. In fact, as we showfrom our experiments below, the Web is rife withsuch pairs (thus it is not merely a matter of discard-ing a few outliers before taking this average). Thismotivates the following revised definition: let P bethe set of all ordered pairs (u; v) such that there isa path from u to v. The average connected distanceis the expected length of the shortest path, where theexpectation is over uniform choices from P .
A. Broder et al. / Computer Networks 33 (2000) 309–320 313
2. Experiments and results
2.1. Infrastructure
All experiments were run using the ConnectivityServer 2 (CS2) software built at Compaq SystemsResearch Center using data provided by AltaVista.CS2 provides fast access to linkage information onthe Web. A build of CS2 takes a Web crawl as inputand creates a representation of the entire Web graphinduced by the pages in the crawl, in the form of adatabase that consists of all URLs that were crawledtogether with all in-links and out-links among thoseURLs. In addition, the graph is extended with thoseURLs referenced at least five times by the crawledpages. (Experimentally, we have determined that thevast majority of URLs encountered fewer than fivetimes but not crawled turn out to be invalid URLs.)
CS2 improves on the original connectivity server(CS1) described in [7] in two important ways. First,it significantly increases the compression of theURLs and the links to data structures. In CS1, eachcompressed URL is, on average, 16 bytes. In CS2,each URL is stored in 10 bytes. In CS1, each linkrequires 8 bytes to store as both an in-link and out-link; in CS2, an average of only 3.4 bytes are used.Second, CS2 provides additional functionality in theform of a host database. For example, in CS2, it iseasy to get all the in-links for a given node, or justthe in-links from remote hosts.
Like CS1, CS2 is designed to give high-perfor-mance access to all this data on a high-end machinewith enough RAM to store the database in memory.On a 465 MHz Compaq AlphaServer 4100 with 12GB of RAM, it takes 70–80 µs to convert an URLinto an internal id or vice versa, and then only 0.15µs=link to retrieve each in-link or out-link. On auniprocessor machine, a BFS that reaches 100 mil-lion nodes takes about 4 minutes; on a 2-processormachine we were able complete a BFS every 2minutes.
In the experiments reported in this paper, CS2 wasbuilt from a crawl performed at AltaVista in May,1999. The CS2 database contains 203 million URLsand 1466 million links (all of which fit in 9.5 GB ofstorage). Some of our experiments were repeated ona more recent crawl from October, 1999 containing271 million URLs and 2130 million links.
In general, the AltaVista crawl is based on alarge set of starting points accumulated over timefrom various sources, including voluntary submis-sions. The crawl proceeds in roughly a BFS manner,but is subject to various rules designed to avoidoverloading Web servers, avoid robot traps (artificialinfinite paths), avoid and=or detect spam (page flood-ing), deal with connection time outs, etc. Each buildof the AltaVista index is based on the crawl dataafter further filtering and processing designed to re-move duplicates and near duplicates, eliminate spampages, etc. Then the index evolves continuously asvarious processes delete dead links, add new pages,update pages, etc. The secondary filtering and thelater deletions and additions are not reflected in theconnectivity server. But overall, CS2’s database canbe viewed as a superset of all pages stored in theindex at one point in time. Note that due to the mul-tiple starting points, it is possible for the resultinggraph to have many connected components.
2.2. Experimental data
The following basic algorithms were implementedusing CS2: (1) a BFS algorithm that performs abreadth-first traversal; (2) a WCC algorithm thatfinds the weak components; and (3) an SCC algo-rithm that finds the strongly connected components.Recall that both WCC and SCC are simple gener-alizations of the BFS algorithm. Using these threebasic algorithms, we ran several interesting experi-ments on the Web graph.
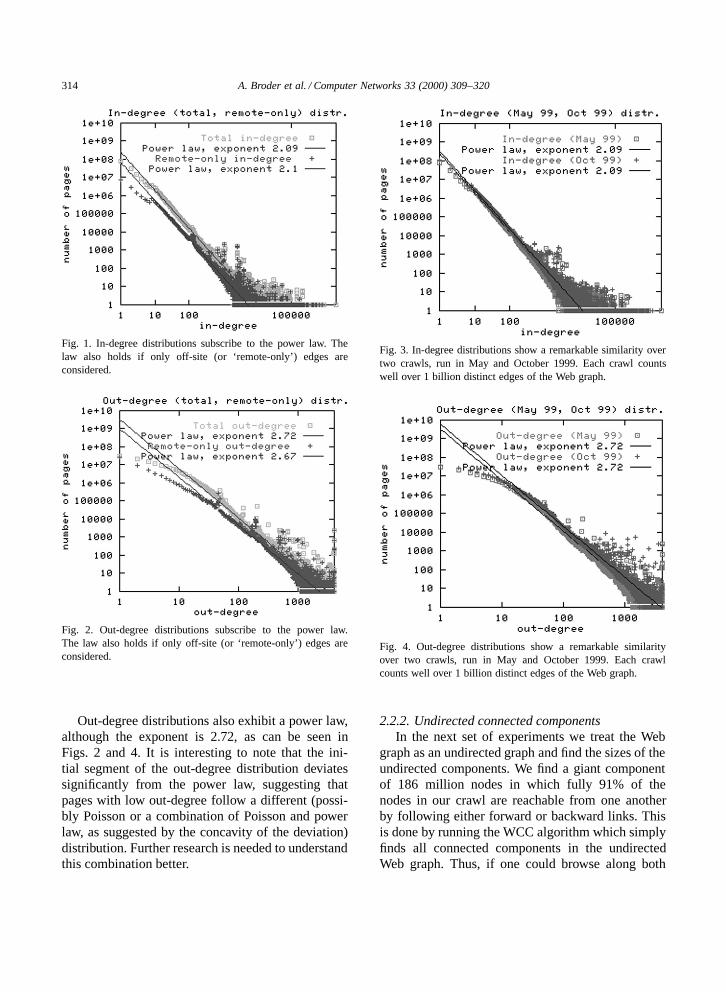
2.2.1. Degree distributionsThe first experiment we ran was to verify earlier
observations that the in- and out-degree distributionson the Web are distributed according to power laws.We ran the experiment on both the May and Octobercrawls of the Web. The results, shown in Figs. 1 and3, show remarkable agreement with each other, andwith similar experiments from data that is over twoyears old [21]. Indeed, in the case of in-degree, theexponent of the power law is consistently around 2.1,a number reported in [5,21]. The anomalous bump at120 on the x-axis is due to a large clique formed bya single spammer. In all our log–log plots, straightlines are linear regressions for the best power lawfit.
314 A. Broder et al. / Computer Networks 33 (2000) 309–320
Fig. 1. In-degree distributions subscribe to the power law. Thelaw also holds if only off-site (or ‘remote-only’) edges areconsidered.
Fig. 2. Out-degree distributions subscribe to the power law.The law also holds if only off-site (or ‘remote-only’) edges areconsidered.
Out-degree distributions also exhibit a power law,although the exponent is 2.72, as can be seen inFigs. 2 and 4. It is interesting to note that the ini-tial segment of the out-degree distribution deviatessignificantly from the power law, suggesting thatpages with low out-degree follow a different (possi-bly Poisson or a combination of Poisson and powerlaw, as suggested by the concavity of the deviation)distribution. Further research is needed to understandthis combination better.
Fig. 3. In-degree distributions show a remarkable similarity overtwo crawls, run in May and October 1999. Each crawl countswell over 1 billion distinct edges of the Web graph.
Fig. 4. Out-degree distributions show a remarkable similarityover two crawls, run in May and October 1999. Each crawlcounts well over 1 billion distinct edges of the Web graph.
2.2.2. Undirected connected componentsIn the next set of experiments we treat the Web
graph as an undirected graph and find the sizes of theundirected components. We find a giant componentof 186 million nodes in which fully 91% of thenodes in our crawl are reachable from one anotherby following either forward or backward links. Thisis done by running the WCC algorithm which simplyfinds all connected components in the undirectedWeb graph. Thus, if one could browse along both
A. Broder et al. / Computer Networks 33 (2000) 309–320 315
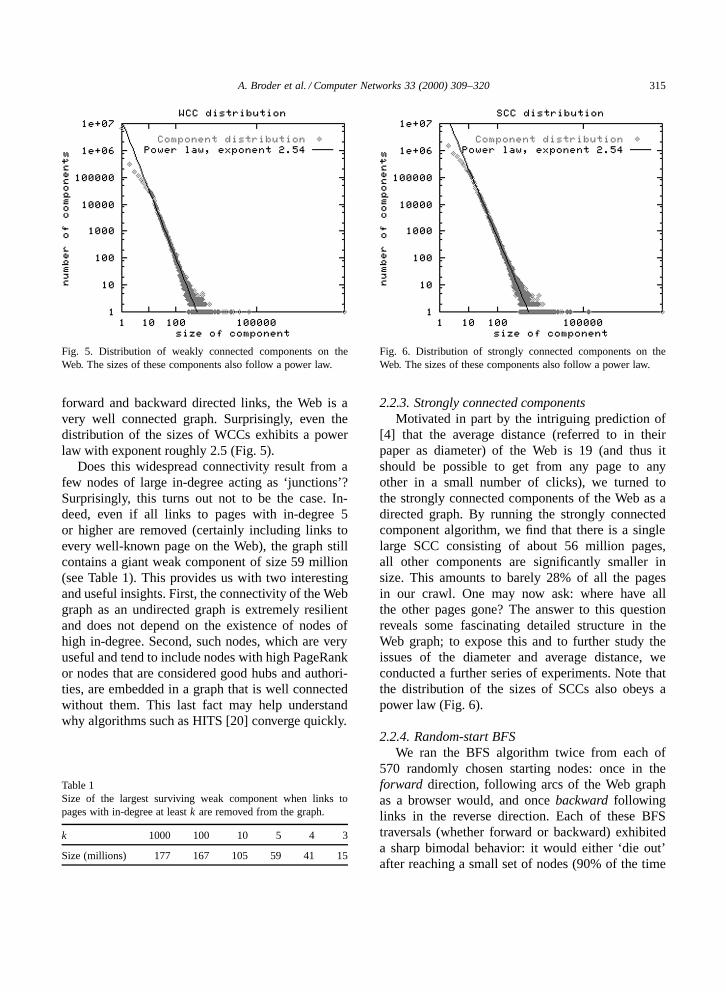
Fig. 5. Distribution of weakly connected components on theWeb. The sizes of these components also follow a power law.
forward and backward directed links, the Web is avery well connected graph. Surprisingly, even thedistribution of the sizes of WCCs exhibits a powerlaw with exponent roughly 2.5 (Fig. 5).
Does this widespread connectivity result from afew nodes of large in-degree acting as ‘junctions’?Surprisingly, this turns out not to be the case. In-deed, even if all links to pages with in-degree 5or higher are removed (certainly including links toevery well-known page on the Web), the graph stillcontains a giant weak component of size 59 million(see Table 1). This provides us with two interestingand useful insights. First, the connectivity of the Webgraph as an undirected graph is extremely resilientand does not depend on the existence of nodes ofhigh in-degree. Second, such nodes, which are veryuseful and tend to include nodes with high PageRankor nodes that are considered good hubs and authori-ties, are embedded in a graph that is well connectedwithout them. This last fact may help understandwhy algorithms such as HITS [20] converge quickly.
Table 1Size of the largest surviving weak component when links topages with in-degree at least k are removed from the graph.
k 1000 100 10 5 4 3
Size (millions) 177 167 105 59 41 15
Fig. 6. Distribution of strongly connected components on theWeb. The sizes of these components also follow a power law.
2.2.3. Strongly connected componentsMotivated in part by the intriguing prediction of
[4] that the average distance (referred to in theirpaper as diameter) of the Web is 19 (and thus itshould be possible to get from any page to anyother in a small number of clicks), we turned tothe strongly connected components of the Web as adirected graph. By running the strongly connectedcomponent algorithm, we find that there is a singlelarge SCC consisting of about 56 million pages,all other components are significantly smaller insize. This amounts to barely 28% of all the pagesin our crawl. One may now ask: where have allthe other pages gone? The answer to this questionreveals some fascinating detailed structure in theWeb graph; to expose this and to further study theissues of the diameter and average distance, weconducted a further series of experiments. Note thatthe distribution of the sizes of SCCs also obeys apower law (Fig. 6).
2.2.4. Random-start BFSWe ran the BFS algorithm twice from each of
570 randomly chosen starting nodes: once in theforward direction, following arcs of the Web graphas a browser would, and once backward followinglinks in the reverse direction. Each of these BFStraversals (whether forward or backward) exhibiteda sharp bimodal behavior: it would either ‘die out’after reaching a small set of nodes (90% of the time
316 A. Broder et al. / Computer Networks 33 (2000) 309–320
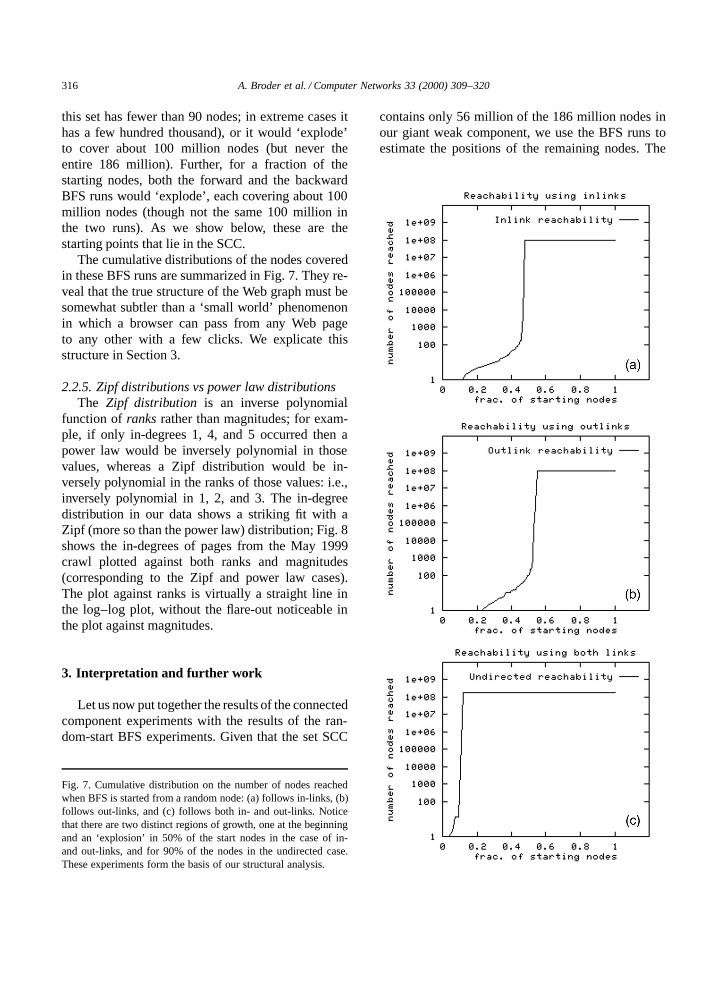
this set has fewer than 90 nodes; in extreme cases ithas a few hundred thousand), or it would ‘explode’to cover about 100 million nodes (but never theentire 186 million). Further, for a fraction of thestarting nodes, both the forward and the backwardBFS runs would ‘explode’, each covering about 100million nodes (though not the same 100 million inthe two runs). As we show below, these are thestarting points that lie in the SCC.
The cumulative distributions of the nodes coveredin these BFS runs are summarized in Fig. 7. They re-veal that the true structure of the Web graph must besomewhat subtler than a ‘small world’ phenomenonin which a browser can pass from any Web pageto any other with a few clicks. We explicate thisstructure in Section 3.
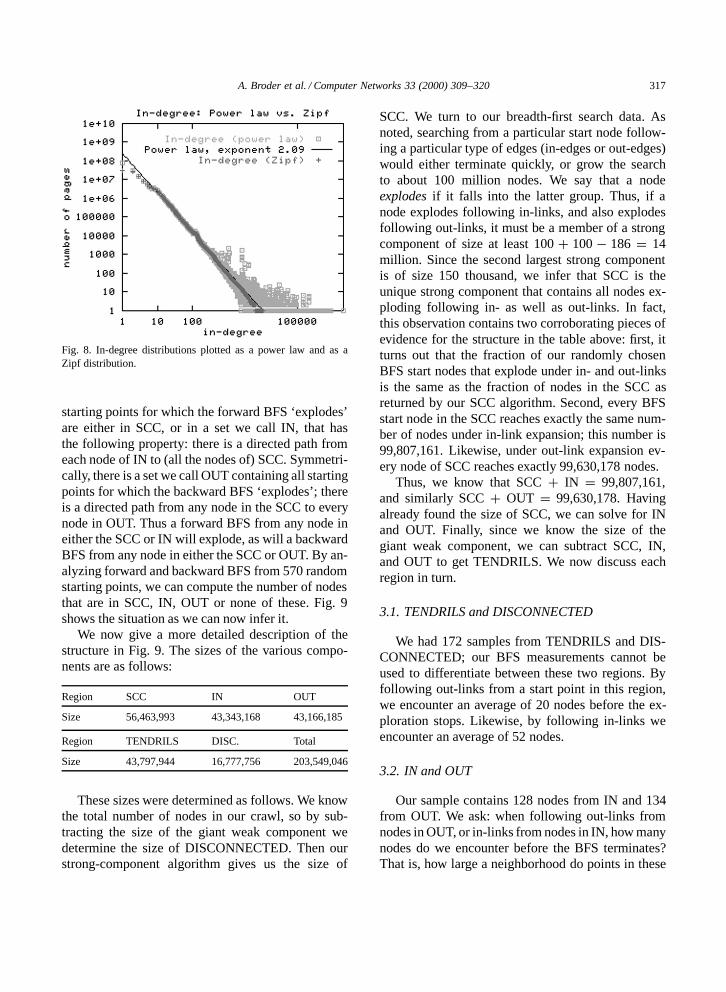
2.2.5. Zipf distributions vs power law distributionsThe Zipf distribution is an inverse polynomial
function of ranks rather than magnitudes; for exam-ple, if only in-degrees 1, 4, and 5 occurred then apower law would be inversely polynomial in thosevalues, whereas a Zipf distribution would be in-versely polynomial in the ranks of those values: i.e.,inversely polynomial in 1, 2, and 3. The in-degreedistribution in our data shows a striking fit with aZipf (more so than the power law) distribution; Fig. 8shows the in-degrees of pages from the May 1999crawl plotted against both ranks and magnitudes(corresponding to the Zipf and power law cases).The plot against ranks is virtually a straight line inthe log–log plot, without the flare-out noticeable inthe plot against magnitudes.
3. Interpretation and further work
Let us now put together the results of the connectedcomponent experiments with the results of the ran-dom-start BFS experiments. Given that the set SCC
Fig. 7. Cumulative distribution on the number of nodes reachedwhen BFS is started from a random node: (a) follows in-links, (b)follows out-links, and (c) follows both in- and out-links. Noticethat there are two distinct regions of growth, one at the beginningand an ‘explosion’ in 50% of the start nodes in the case of in-and out-links, and for 90% of the nodes in the undirected case.These experiments form the basis of our structural analysis.
contains only 56 million of the 186 million nodes inour giant weak component, we use the BFS runs toestimate the positions of the remaining nodes. The
A. Broder et al. / Computer Networks 33 (2000) 309–320 317
Fig. 8. In-degree distributions plotted as a power law and as aZipf distribution.
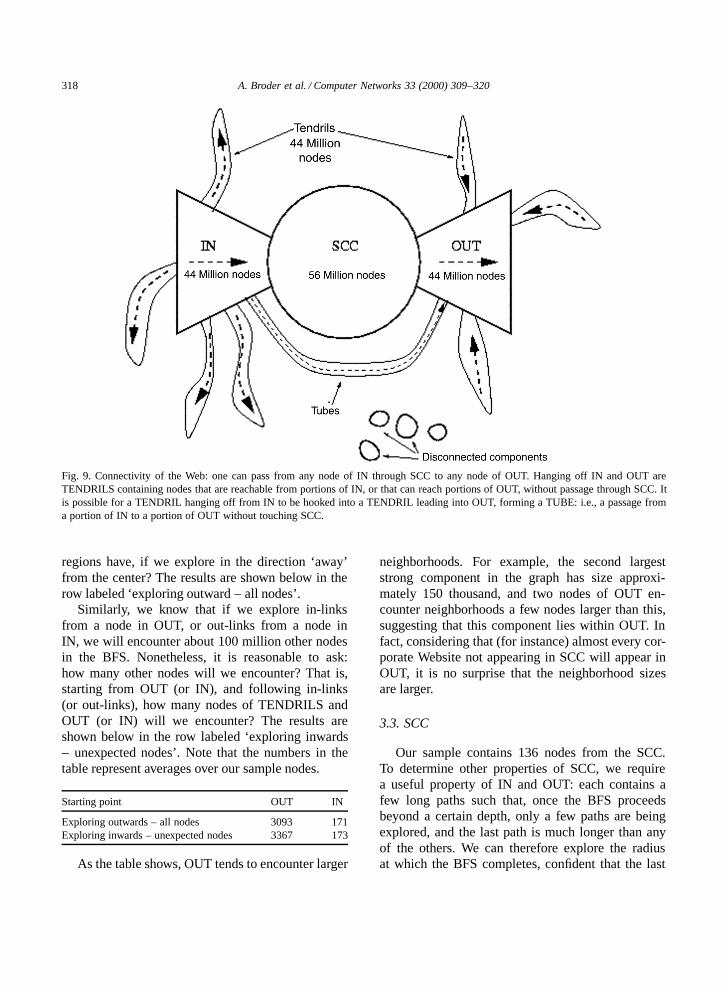
starting points for which the forward BFS ‘explodes’are either in SCC, or in a set we call IN, that hasthe following property: there is a directed path fromeach node of IN to (all the nodes of) SCC. Symmetri-cally, there is a set we call OUT containing all startingpoints for which the backward BFS ‘explodes’; thereis a directed path from any node in the SCC to everynode in OUT. Thus a forward BFS from any node ineither the SCC or IN will explode, as will a backwardBFS from any node in either the SCC or OUT. By an-alyzing forward and backward BFS from 570 randomstarting points, we can compute the number of nodesthat are in SCC, IN, OUT or none of these. Fig. 9shows the situation as we can now infer it.
We now give a more detailed description of thestructure in Fig. 9. The sizes of the various compo-nents are as follows:
Region SCC IN OUT
Size 56,463,993 43,343,168 43,166,185
Region TENDRILS DISC. Total
Size 43,797,944 16,777,756 203,549,046
These sizes were determined as follows. We knowthe total number of nodes in our crawl, so by sub-tracting the size of the giant weak component wedetermine the size of DISCONNECTED. Then ourstrong-component algorithm gives us the size of
SCC. We turn to our breadth-first search data. Asnoted, searching from a particular start node follow-ing a particular type of edges (in-edges or out-edges)would either terminate quickly, or grow the searchto about 100 million nodes. We say that a nodeexplodes if it falls into the latter group. Thus, if anode explodes following in-links, and also explodesfollowing out-links, it must be a member of a strongcomponent of size at least 100 C 100 � 186 D 14million. Since the second largest strong componentis of size 150 thousand, we infer that SCC is theunique strong component that contains all nodes ex-ploding following in- as well as out-links. In fact,this observation contains two corroborating pieces ofevidence for the structure in the table above: first, itturns out that the fraction of our randomly chosenBFS start nodes that explode under in- and out-linksis the same as the fraction of nodes in the SCC asreturned by our SCC algorithm. Second, every BFSstart node in the SCC reaches exactly the same num-ber of nodes under in-link expansion; this number is99,807,161. Likewise, under out-link expansion ev-ery node of SCC reaches exactly 99,630,178 nodes.
Thus, we know that SCC C IN D 99,807,161,and similarly SCC C OUT D 99,630,178. Havingalready found the size of SCC, we can solve for INand OUT. Finally, since we know the size of thegiant weak component, we can subtract SCC, IN,and OUT to get TENDRILS. We now discuss eachregion in turn.
3.1. TENDRILS and DISCONNECTED
We had 172 samples from TENDRILS and DIS-CONNECTED; our BFS measurements cannot beused to differentiate between these two regions. Byfollowing out-links from a start point in this region,we encounter an average of 20 nodes before the ex-ploration stops. Likewise, by following in-links weencounter an average of 52 nodes.
3.2. IN and OUT
Our sample contains 128 nodes from IN and 134from OUT. We ask: when following out-links fromnodes in OUT, or in-links from nodes in IN, how manynodes do we encounter before the BFS terminates?That is, how large a neighborhood do points in these
318 A. Broder et al. / Computer Networks 33 (2000) 309–320
Fig. 9. Connectivity of the Web: one can pass from any node of IN through SCC to any node of OUT. Hanging off IN and OUT areTENDRILS containing nodes that are reachable from portions of IN, or that can reach portions of OUT, without passage through SCC. Itis possible for a TENDRIL hanging off from IN to be hooked into a TENDRIL leading into OUT, forming a TUBE: i.e., a passage froma portion of IN to a portion of OUT without touching SCC.
regions have, if we explore in the direction ‘away’from the center? The results are shown below in therow labeled ‘exploring outward – all nodes’.
Similarly, we know that if we explore in-linksfrom a node in OUT, or out-links from a node inIN, we will encounter about 100 million other nodesin the BFS. Nonetheless, it is reasonable to ask:how many other nodes will we encounter? That is,starting from OUT (or IN), and following in-links(or out-links), how many nodes of TENDRILS andOUT (or IN) will we encounter? The results areshown below in the row labeled ‘exploring inwards– unexpected nodes’. Note that the numbers in thetable represent averages over our sample nodes.
Starting point OUT IN
Exploring outwards – all nodes 3093 171Exploring inwards – unexpected nodes 3367 173
As the table shows, OUT tends to encounter larger
neighborhoods. For example, the second largeststrong component in the graph has size approxi-mately 150 thousand, and two nodes of OUT en-counter neighborhoods a few nodes larger than this,suggesting that this component lies within OUT. Infact, considering that (for instance) almost every cor-porate Website not appearing in SCC will appear inOUT, it is no surprise that the neighborhood sizesare larger.
3.3. SCC
Our sample contains 136 nodes from the SCC.To determine other properties of SCC, we requirea useful property of IN and OUT: each contains afew long paths such that, once the BFS proceedsbeyond a certain depth, only a few paths are beingexplored, and the last path is much longer than anyof the others. We can therefore explore the radiusat which the BFS completes, confident that the last
A. Broder et al. / Computer Networks 33 (2000) 309–320 319
long path will be the same no matter which node ofSCC we start from. The following table shows thedepth at which the BFS terminates in each direction(following in-links or out-links) for nodes in theSCC.
Measure Minimum depth Average depth Maximum depth
In-links 475 482 503Out-links 430 434 444
As the table shows, from some nodes in the SCCit is possible to complete the search at distance 475,while from other nodes distance 503 is required. Thisallows us to conclude that the directed diameter ofSCC is at least 28.
3.4. Other observations
As noted above, the (min, average, max) depthsat which the BFS from SCC terminates following in-links are (475, 482, 503). For IN, we can perform thesame analysis, and the values are: (476, 482, 495).These values, especially the average, are so similarthat nodes of IN appear to be quite close to SCC.
Likewise, for SCC the (min, average, max) depthsfor termination under out-links are (430, 434, 444).For OUT, the values are (430, 434, 444).
Now, consider the probability that an orderedpair (u; v) has a path from u to v. By noting thatthe average in-size of nodes in IN is very small(171) and likewise the average out-size of nodes inOUT is very small (3093), the pair has a path withnon-negligible probability if and only if u is in SCCC IN, and v is in SCC C OUT. The probability ofthis event for node pairs drawn uniformly from ourcrawl is only 24%; for node pairs drawn from theweak component it is only 28%. This leads to thesomewhat surprising conclusion that, given a randomstart and finish page on the Web, one can get fromthe start page to the finish page by traversing linksbarely a quarter of the time.
The structure that is now unfolding tells us that itis relatively insensitive to the particular large crawlwe use. For instance, if AltaVista’s crawler failsto include some links whose inclusion would addone of the tendrils to the SCC, we know that theresulting change in the sizes of SCC and TENDRILwill be small (since any individual tendril is small).
Likewise, our experiments in which we found thatlarge components survived the deletion of nodes oflarge in-degree show that the connectivity of the Webis resilient to the removal of significant portions.
3.5. Diameter and average connected distance
As we discussed above, the directed diameter ofthe SCC is at least 28. Likewise, the maximumfinite shortest path length is at least 503, but isprobably substantially more than this: unless a shorttube connects the most distant page of IN to themost distant page of OUT without passing throughthe SCC, the maximum finite shortest path length islikely to be close to 475 C 430 D 905.
We can estimate the average connected distanceusing our 570 BFS start points, under both in-linksand out-links. The values are shown below; the col-umn headed ‘Undirected’ corresponds to the averageundirected distance.
Edge type In-links Out-links Undirected(directed) (directed)
Average connected 16.12 16.18 6.83distance
These results are in interesting contrast to thoseof [4], who predict an average distance of 19 for theWeb based on their crawl of the nd.edu site; it isunclear whether their calculations consider directedor undirected distances. Our results on the otherhand show that over 75% of time there is no directedpath from a random start node to a random finishnode; when there is a path, the figure is roughly 16.However, if links can be traversed in either direction,the distance between random pairs of nodes can bemuch smaller, around 7, on average.
4. Further work
Further work can be divided into three broadclasses.(1) More experiments aimed at exposing further de-
tails of the structures of SCC, IN, OUT, andthe TENDRILS. Would this basic structure, andthe relative fractions of the components, remainstable over time?
320 A. Broder et al. / Computer Networks 33 (2000) 309–320
(2) Mathematical models for evolving graphs, moti-vated in part by the structure of the Web; in addi-tion, one may consider the applicability of suchmodels to other large directed graphs such as thephone-call graph, purchase=transaction graphs,etc. [3].
(3) What notions of connectivity (besides weak andstrong) might be appropriate for the Web graph?For instance, what is the structure of the undi-rected graph induced by the co-citation relationor by bibliographic coupling [31].
Acknowledgements
We thank Keith Randall for his insights into ourSCC algorithm and implementation.
References
[1] L. Adamic and B. Huberman, The nature of markets on theWorld Wide Web, Xerox PARC Technical Report, 1999.
[2] L. Adamic and B. Huberman, Scaling behavior on theWorld Wide Web, Technical comment on [5].
[3] W. Aiello, F. Chung and L. Lu, A random graph modelfor massive graphs, ACM Symposium on the Theory andComputing, 2000.
[4] R. Albert, H. Jeong and A.-L. Barabasi, Diameter of theWorld Wide Web, Nature 401 (1999) 130–131.
[5] A. Barabasi and R. Albert, Emergence of scaling in randomnetworks, Science 286 (509) (1999).
[6] P. Barford, A. Bestavros, A. Bradley and M.E. Crovella,Changes in Web client access patterns: characteristics andcaching implications, World Wide Web, Special Issue onCharacterization and Performance Evaluation, 2 (1999) 15–28.
[7] K. Bharat, A. Broder, M. Henzinger, P. Kumar and S.Venkatasubramanian, The connectivity server: fast access tolinkage information on the web, in: Proc. 7th WWW, 1998.
[8] K. Bharat and M. Henzinger, Improved algorithms for topicdistillation in hyperlinked environments, in: Proc. 21st SI-GIR, 1998.
[9] S. Brin and L. Page, The anatomy of a large scale hyper-textual web search engine, in: Proc. 7th WWW, 1998.
[10] R.A. Butafogo and B. Schneiderman, Identifying aggregatesin hypertext structures, in: Proc. 3rd ACM Conference onHypertext, 1991.
[11] J. Carriere and R. Kazman, WebQuery: searching and visu-alizing the Web through connectivity, in: Proc. 6th WWW,1997.
[12] S. Chakrabarti, B. Dom, D. Gibson, J. Kleinberg, P. Ragha-
van and S. Rajagopalan, Automatic resource compilation byanalyzing hyperlink structure and associated text, in: Proc.7th WWW, 1998.
[13] S. Chakrabarti, B. Dom, D. Gibson, S. Ravi Kumar, P.Raghavan, S. Rajagopalan and A. Tomkins, Experimentsin topic distillation, in: Proc. ACM SIGIR Workshop onHypertext Information Retrieval on the Web, 1998.
[14] S. Chakrabarti, D. Gibson and K. McCurley, Surfing theWeb backwards, in: Proc. 8th WWW, 1999.
[15] J. Cho, H. Garcia-Molina, Synchronizing a database to im-prove freshness, To appear in 2000 ACM International Con-ference on Management of Data (SIGMOD), May 2000.
[16] M. Faloutsos, P. Faloutsos and C. Faloutsos, On power lawrelationships of the internet topology, ACM SIGCOMM,1999.
[17] S. Glassman, A caching relay for the world wide web, in:Proc. 1st WWW, 1994.
[18] F. Harary, Graph Theory, Addison-Wesley, Reading, MA,1975.
[19] B. Huberman, P. Pirolli, J. Pitkow and R. Lukose, Strongregularities in World Wide Web surfing, Science 280 (1998)95–97.
[20] J. Kleinberg, Authoritative sources in a hyperlinked envi-ronment, in: Proc. 9th ACM–SIAM SODA, 1998.
[21] R. Kumar, P. Raghavan, S. Rajagopalan and A. Tomkins,Trawling the Web for cyber communities, in: Proc. 8thWWW, April 1999.
[22] R. Kumar, P. Raghavan, S. Rajagopalan and A. Tomkins,Extracting large scale knowledge bases from the Web, in:Proc. VLDB, July 1999.
[23] R.M. Lukose and B. Huberman, Surfing as a real option,in: Proc. 1st International Conference on Information andComputation Economies, 1998.
[24] C. Martindale and A.K. Konopka, Oligonucleotide frequen-cies in DNA follow a Yule distribution, Computer andChemistry 20 (1) (1996) 35–38.
[25] A. Mendelzon, G. Mihaila and T. Milo, Querying the WorldWide Web, Journal of Digital Libraries 1 (1) (1997) 68–88.
[26] A. Mendelzon and P. Wood, Finding regular simple paths ingraph databases, SIAM J. Comp. 24 (6) (1995) 1235–1258.
[27] V. Pareto, Cours d’economie politique, Rouge, Lausanne etParis, 1897.
[28] P. Pirolli, J. Pitkow and R. Rao, Silk from a sow’s ear:extracting usable structures from the Web, in: Proc. ACMSIGCHI, 1996.
[29] J. Pitkow and P. Pirolli, Life, death, and lawfulness on theelectronic frontier, in: Proc. ACM SIGCHI, 1997.
[30] H.A. Simon, On a class of stew distribution functions,Biometrika 42 (1955) 425–440.
[31] H.D. White and K.W. McCain, Bibliometrics, in: AnnualReview of Information Science and Technology, Vol. 24,Elsevier, Amsterdam, 1989, pp. 119–186.
[32] G.U. Yule, Statistical Study of Literary Vocabulary, Cam-bridge University Press, New York, 1944.
[33] G.K. Zipf, Human Behavior and the Principle of LeastEffort, Addison-Wesley, Reading, MA, 1949.