grapher 4
DESCRIPTION
A introduction of Grapher 4 software.TRANSCRIPT
Grapher 4.0
Introduction to Grapher
Welcome to Grapher, the easy to use technical graphing package for scientists,
engineers, business professionals, or anyone who needs to generate graphs quickly and
easily.
Grapher is a sophisticated graphing program that transforms your data into any graph
type you desire. Grapher creates over 50 different graph types, including 2D and 3D line,
scatter, step, and function plots; bar, floating bar, and histogram charts; pie charts, polar
plots, ternary diagrams, stiff plots, hi-low-close plots, box and whisker plots, and many
other plot types. Combine plot types to reveal information about your data. Add fit curves,
confidence intervals, or display statistical information for your data. Grapher allows you
to produce the finest publication quality graphs available.
Creating graphs is as easy as choosing the graph type, selecting the data file, and clicking
the Open button. Grapher automatically selects reasonable default settings for each new
graph. Changing the default settings for all future graphs is easy, allowing you to make
the graph you want the first time, every time. All graphs allow quick and easy
customization of all graph, axis, and plot settings. For example, you can change tick mark
spacing, tick labels, axis title, axis length, grid lines, line colors, symbol styles, fill
opacity, and more. You can add legends, images, fit curves, and drawing objects to the
graph. You can import title blocks and company logos to create the final graph right in
Grapher. To apply the same custom settings to several graphs, you can create a Grapher
template containing the preferred styles. Once the graph is complete, you can export it in
a variety of formats for use in all your presentations and publications.
The Scripter program, included with Grapher, is useful for creating, editing, and
running script files that automate Grapher procedures. By writing and running script
files, simple mundane tasks or complex system integration tasks can be performed
precisely and repetitively without direct interaction. Grapher also supports Active X
automation using any compatible client, such as Visual BASIC. These two automation
capabilities allow Grapher to be used as a graph program for all your scientific,
engineering, or business needs.
The script recorder records all commands as you make them in Grapher. When the script
is run, Grapher performs the steps for you. This is ideal for users that need to perform
repetitive tasks but are unfamiliar with automation, for advanced users who do not want
to manually enter all of the syntax, or for average users having difficulty with syntax.
Installation Directions
Installing Grapher 4 requires logging onto the computer with an account that has
Administrator rights. Golden Software does not recommend installing Grapher 4 over
any previous version of Grapher. Grapher 4 can coexist with older versions (i.e.
Grapher 3) as long as they are installed in different directories, which is the default.
To install Grapher
There are eight files in the Grapher 4.0 folder.
Double-click the Grapher 4.msi file to begin the installation process.
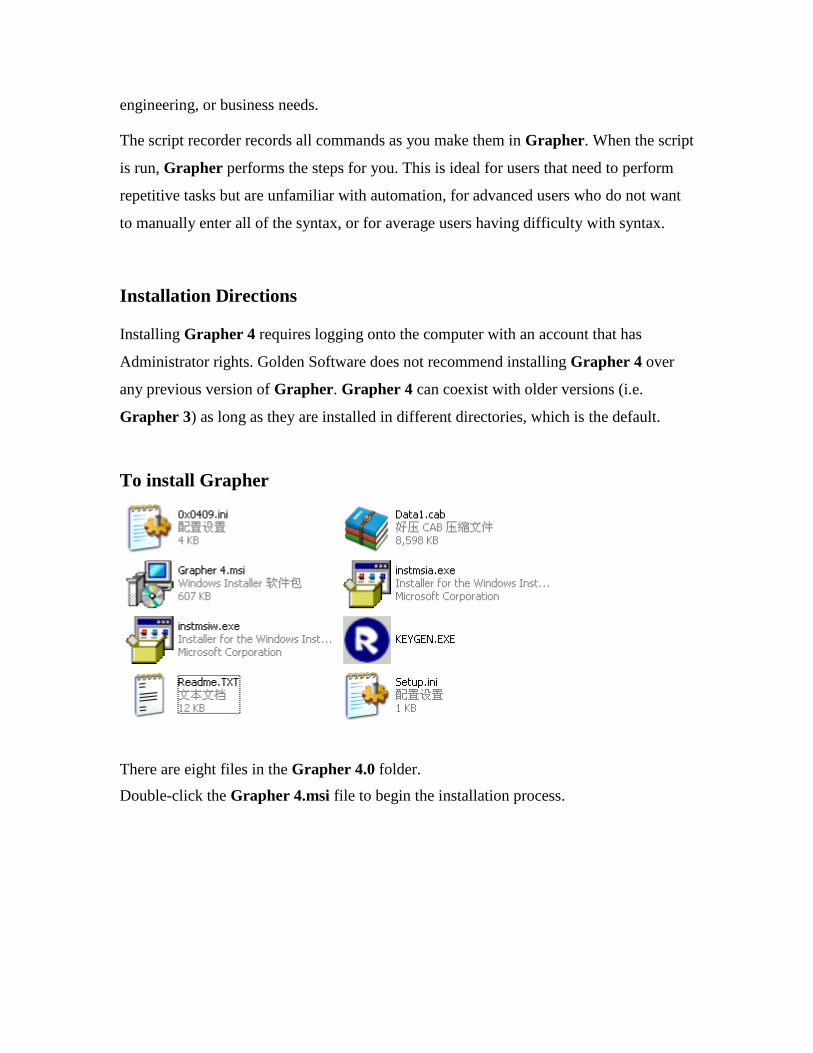
Click Next
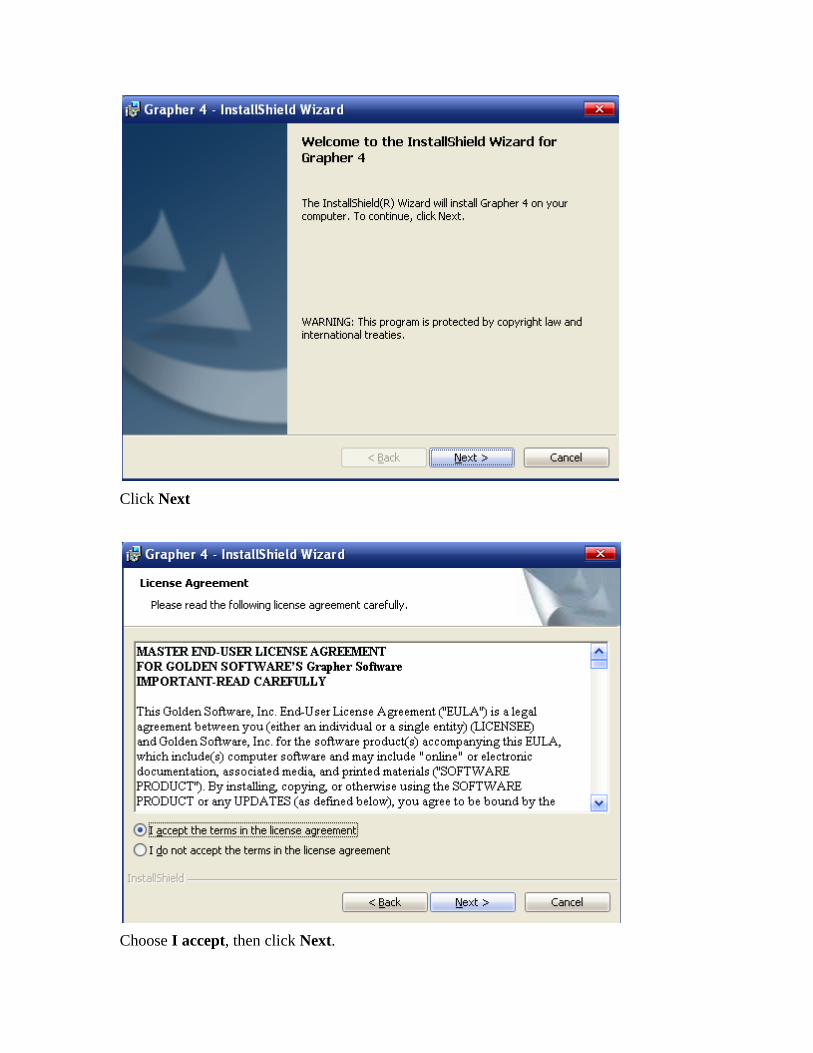
Choose I accept, then click Next.
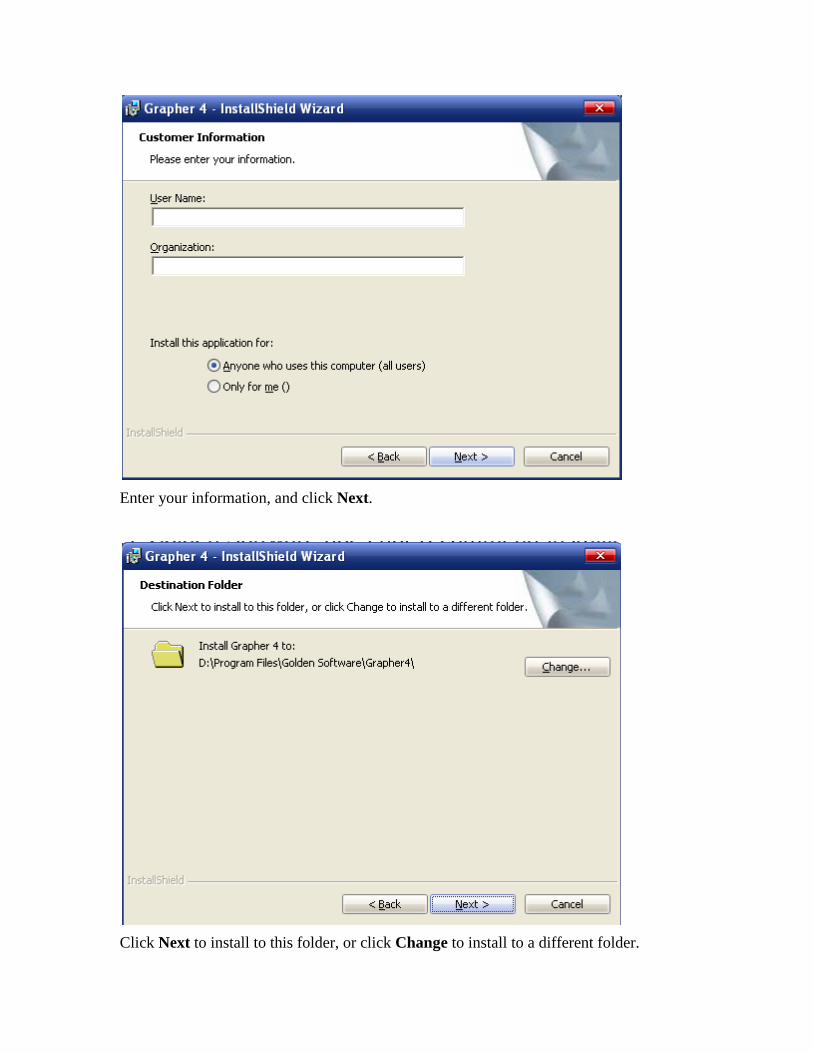
Enter your information, and click Next.
Click Next to install to this folder, or click Change to install to a different folder.
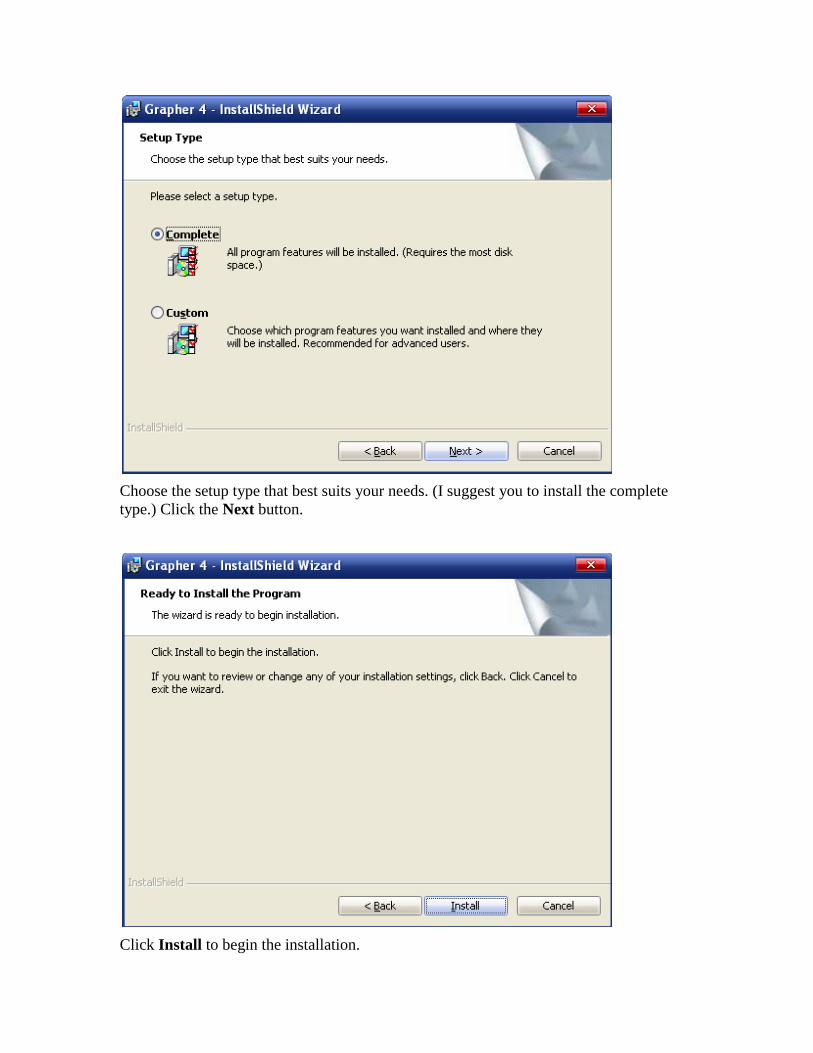
Choose the setup type that best suits your needs. (I suggest you to install the complete
type.) Click the Next button.
Click Install to begin the installation.
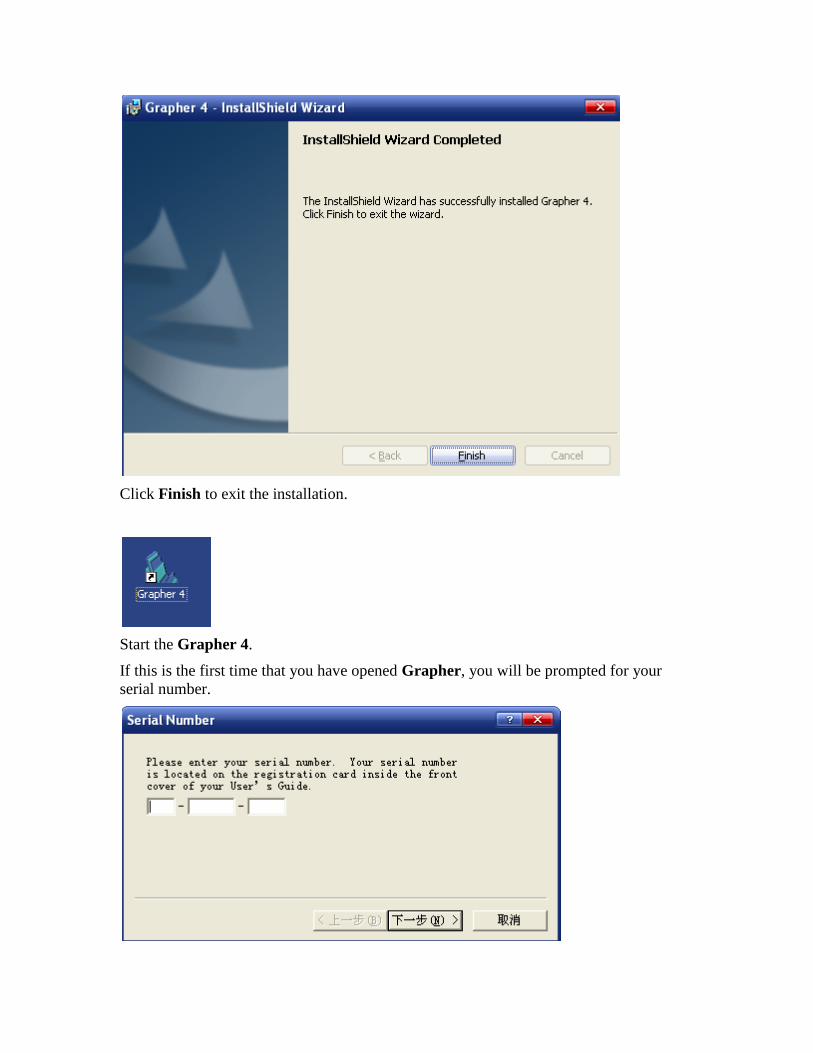
Click Finish to exit the installation.
Start the Grapher 4.
If this is the first time that you have opened Grapher, you will be prompted for your
serial number.
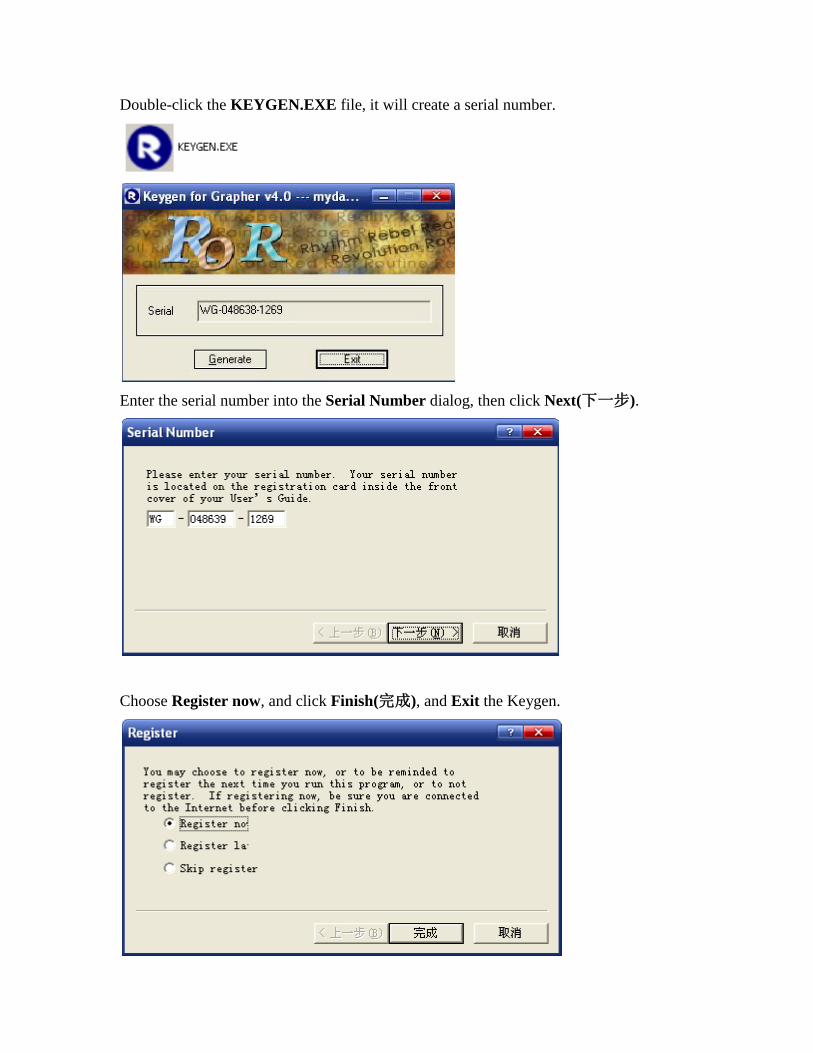
Double-click the KEYGEN.EXE file, it will create a serial number.
Enter the serial number into the Serial Number dialog, then click Next(下一步).
Choose Register now, and click Finish(完成), and Exit the Keygen.
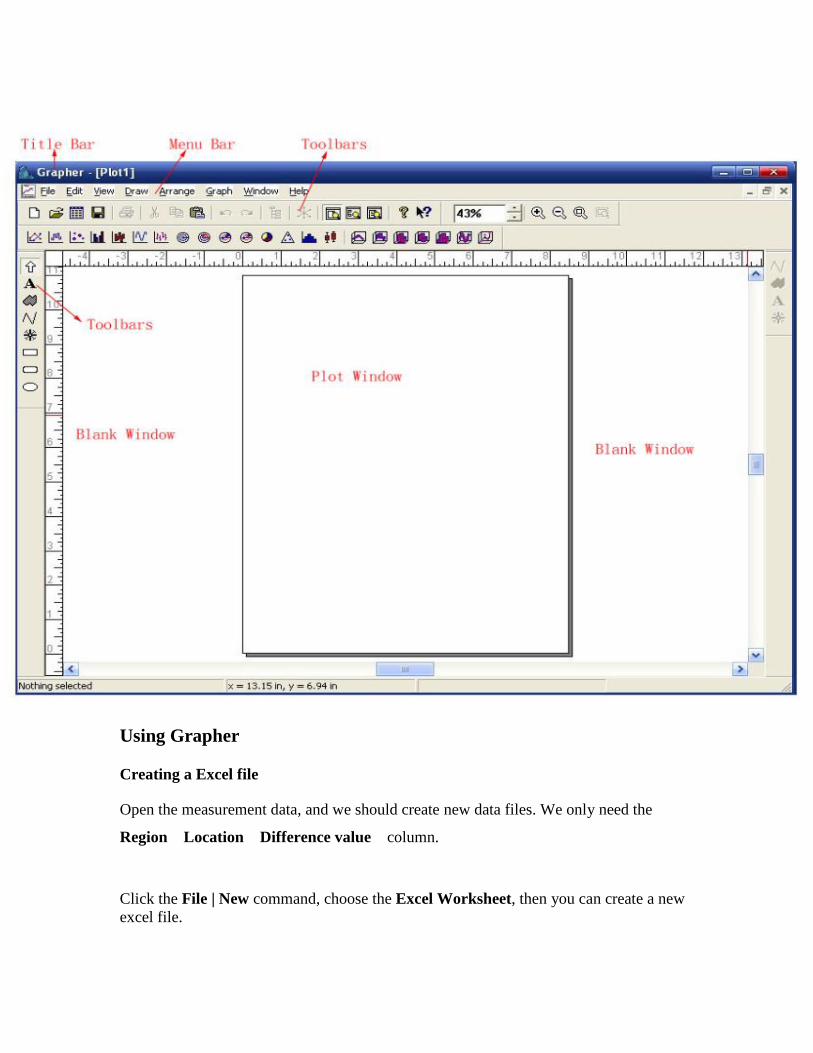
Using Grapher
Creating a Excel file
Open the measurement data, and we should create new data files. We only need the
Region Location Difference value column.
Click the File | New command, choose the Excel Worksheet, then you can create a new
excel file.
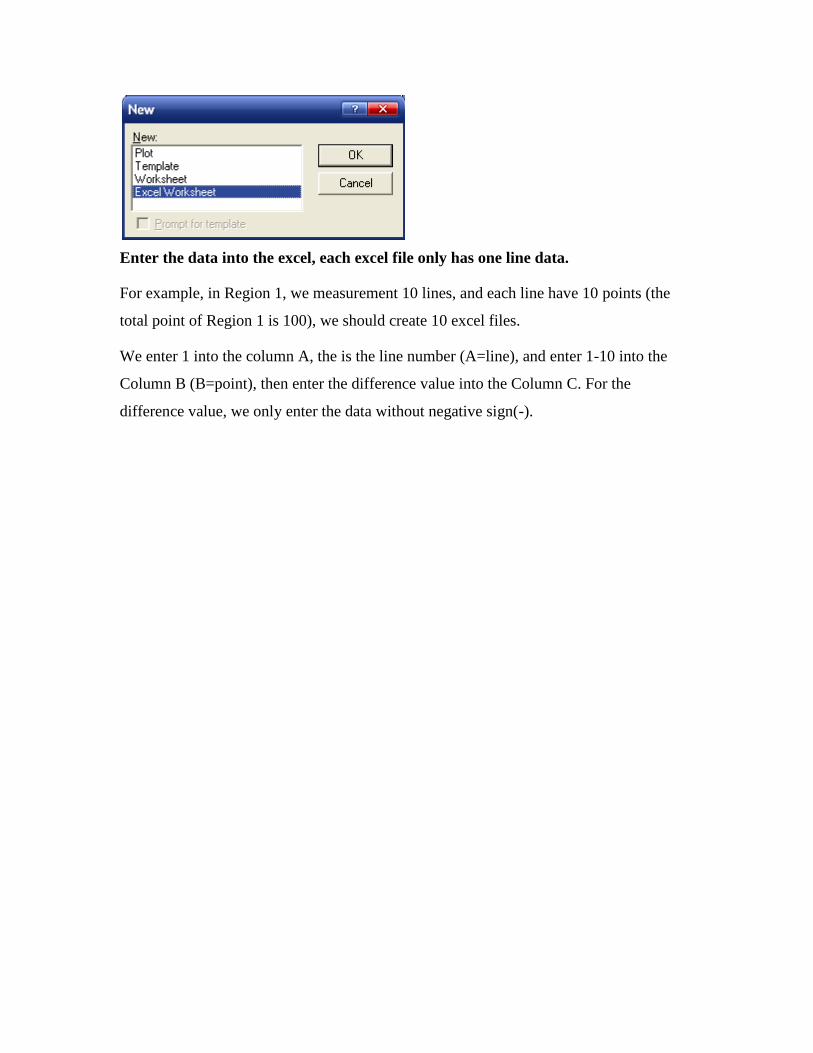
Enter the data into the excel, each excel file only has one line data.
For example, in Region 1, we measurement 10 lines, and each line have 10 points (the
total point of Region 1 is 100), we should create 10 excel files.
We enter 1 into the column A, the is the line number (A=line), and enter 1-10 into the
Column B (B=point), then enter the difference value into the Column C. For the
difference value, we only enter the data without negative sign(-).
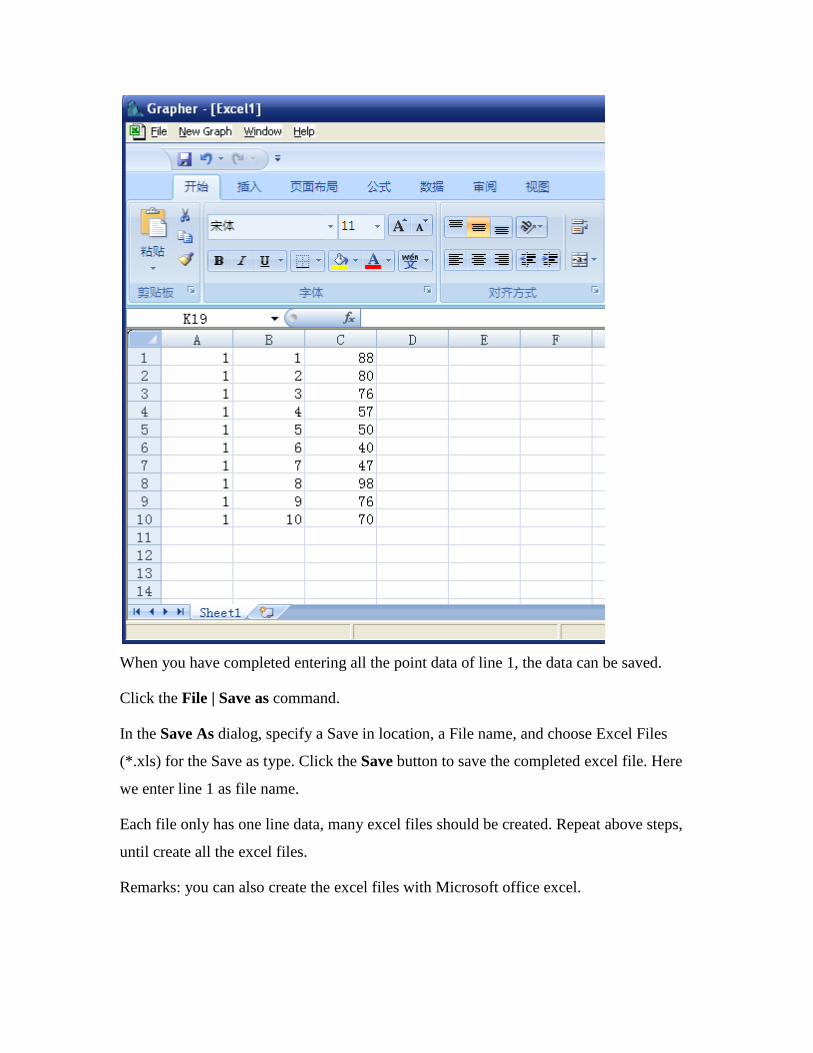
When you have completed entering all the point data of line 1, the data can be saved.
Click the File | Save as command.
In the Save As dialog, specify a Save in location, a File name, and choose Excel Files
(*.xls) for the Save as type. Click the Save button to save the completed excel file. Here
we enter line 1 as file name.
Each file only has one line data, many excel files should be created. Repeat above steps,
until create all the excel files.
Remarks: you can also create the excel files with Microsoft office excel.
Creating a Graph
To create a line/scatter graph:
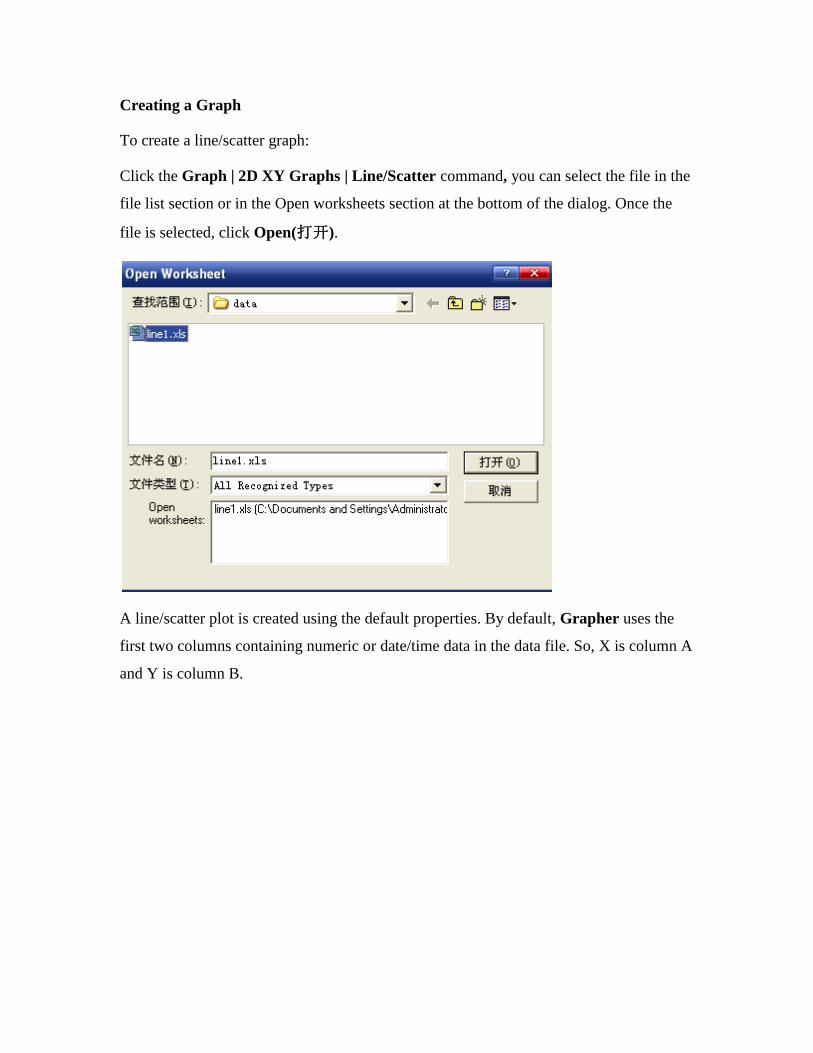
Click the Graph | 2D XY Graphs | Line/Scatter command, you can select the file in the
file list section or in the Open worksheets section at the bottom of the dialog. Once the
file is selected, click Open(打开).
A line/scatter plot is created using the default properties. By default, Grapher uses the
first two columns containing numeric or date/time data in the data file. So, X is column A
and Y is column B.
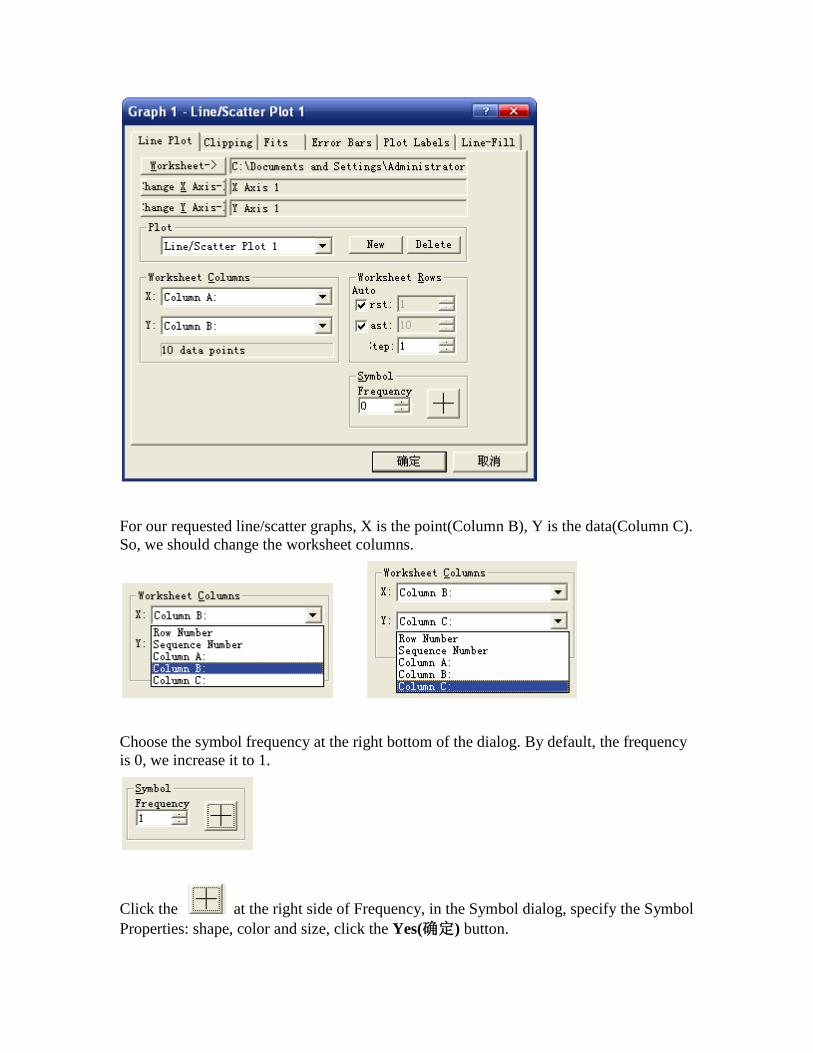
For our requested line/scatter graphs, X is the point(Column B), Y is the data(Column C).
So, we should change the worksheet columns.
Choose the symbol frequency at the right bottom of the dialog. By default, the frequency
is 0, we increase it to 1.
Click the at the right side of Frequency, in the Symbol dialog, specify the Symbol
Properties: shape, color and size, click the Yes(确定) button.
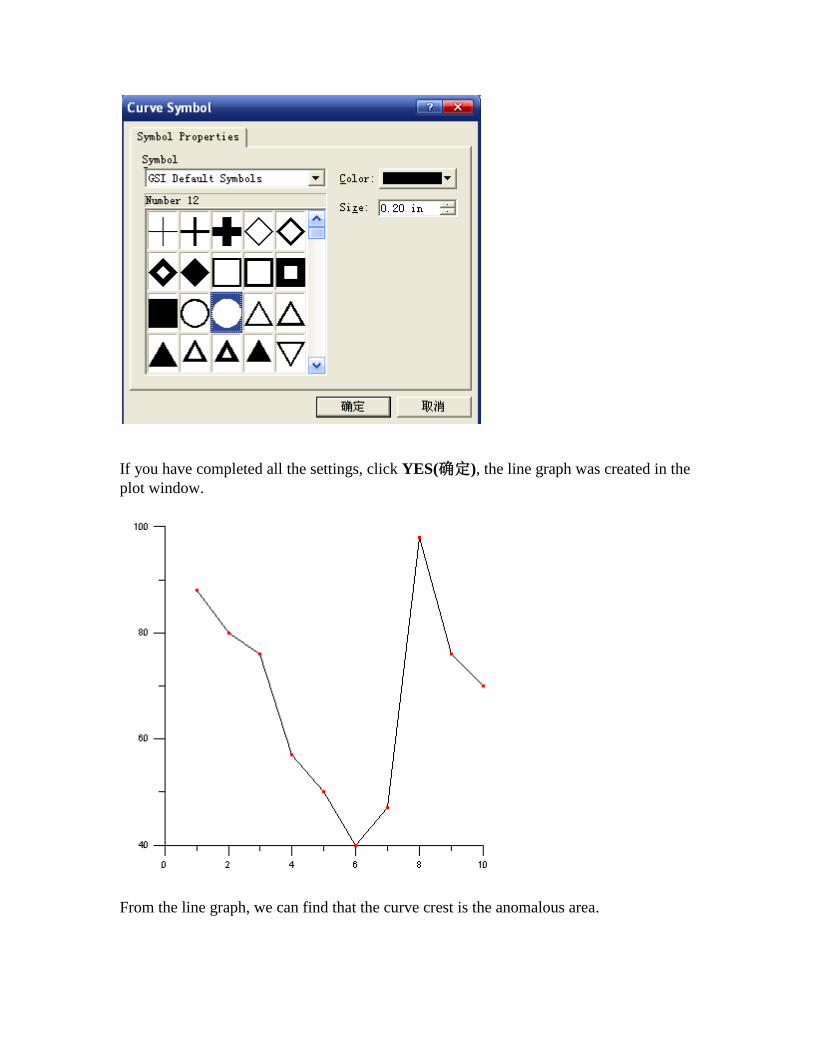
If you have completed all the settings, click YES(确定), the line graph was created in the
plot window.
From the line graph, we can find that the curve crest is the anomalous area.

Because we should create many line graphs, so we need mark the graphs to distinguish
them.
Click on the left side, and click on the blank area above the picture, enter the
remarks, click OK.
Then click , choose the graph and remove it to the blank area, and create another line
graph in the plot window.
If you completed all the graphs, click the File | Save as command.
In the Save As dialog, specify a Save in location, a File name, and choose Grapher Files
(*.grf) for the Save as type. Click the Save(保存) button to save the completed grapher
file. Here we enter Area 1 as file name.