graphical policy analysis tool developed by kevin wheeler for usbr and cadswes
TRANSCRIPT

Graphical Policy Analysis Tool
Developed by Kevin Wheeler for USBR and CADSWES

Comparing Potential Policies
Complex Models = Complex Output Multiple Slots of Interest Stakeholders
Multiple Run Analysis Hydrologic scenarios
Multiple Policies of InterestTime
Traditional Comparison
Model managers extract, graph and present all results that they deem as significant – Potential bias? Focus on differences and not similarities
Stakeholder inevitably ask questions for which the modelers are not prepared to answer Discussions Cease
RESCHEDULE MEETINGS = $$$

Using ExcelWriter
Write RiverWare Outputs into Spreadsheet Format
Run
Tim
e
Slot
POLICY #1

How to Compare Policies???
POLICY #1
POLICY #3
POLICY #4
POLICY #5
POLICY #2
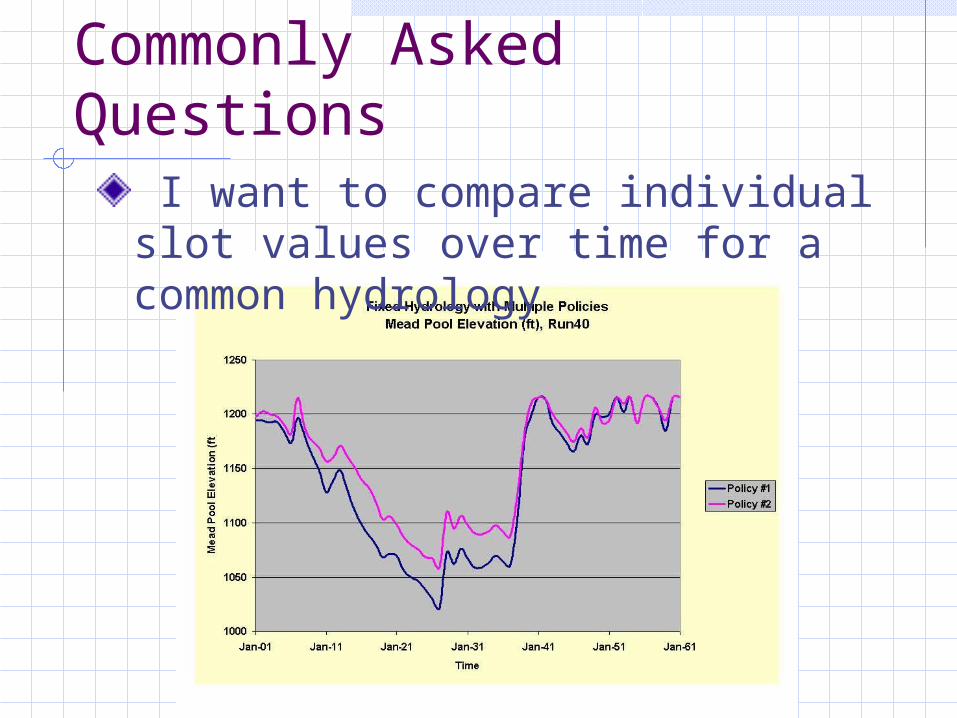
Commonly Asked Questions
I want to compare individual slot values over time for a common hydrology

Commonly Asked Questions
I want to compare the statistics of all hydrologic scenarios over time Mean, Minimum, Maximum, Standard
Deviation

Commonly Asked Questions
How do the probabilistic distributions of slot values compare at one point in time? PDF (Histogram) , CDF

c
Cumulative Distribution Function - Length of time since a 260 kaf flood event for the Colorado Delta
0
10
20
30
40
50
60
70
0% 10% 20% 30% 40% 50% 60% 70% 80% 90% 100%
Probability of Exceedance
Ye
ars
Baseline
Delta Miniumum Flow
Zero Flow Shortage

Commonly Asked Questions
What will the slot values be over time that correspond to a particular percentile of occurrence?
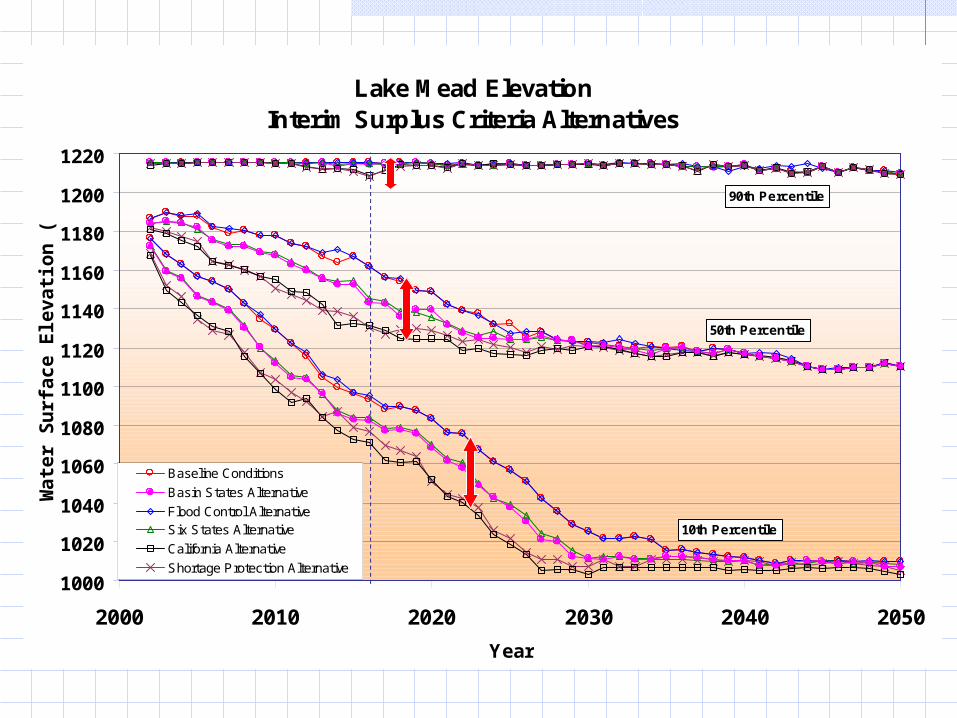
Lake Mead ElevationInterim Surplus Criteria Alternatives
1000
1020
1040
1060
1080
1100
1120
1140
1160
1180
1200
1220
2000 2010 2020 2030 2040 2050
Year
Wa
ter
Su
rfa
ce
Ele
va
tio
n (
fee
t)
Baseline Conditions
Basin States Alternative
Flood Control AlternativeSix States Alternative
California Alternative
Shortage Protection Alternative
90th Percentile
50th Percentile
10th Percentile

Commonly Asked QuestionsProbabilities
What is the probability of a slot variable exceeding or not exceeding a certain value through time?What is the probability of a slot variable falling within a specified range through time?What is the probability of a binary occurrence? Flood release, shortage, surplus, equalization
flags

Example: Depleting Reservoirs

c
Flow Duration Curves for Flaming Gorge Release December
0
500
1000
1500
2000
2500
3000
0% 20% 40% 60% 80% 100%
Percent Exceedance
cfs
With Flow Rec Minimum Baseflow Constraints
Relaxed Flow Rec Minimum Baseflow Constraints
Unregulated Inflow

c
Maximum 14 Day Flow Duration CurvesBelow Green-Yampa Confluence
0
5000
10000
15000
20000
25000
30000
35000
0% 20% 40% 60% 80% 100%Percent Exceedance
cfs
No Shift
10 Day
15 Day

Specialty Functions
Arithmetic operations between slots in the same policy to create new slots What is the total storage capacity in the system?
Arithmetic operations between different policies What are the differences between two policies
for ALL slots?
Isolate Monthly Values What is the probability exceeding a slot value
during a specific set of months?
Record and recall graphs produced

Benefits
Give rapid access to all model results Answer questions “on the fly”
Facilitate model interpretation by stakeholders Generate a qualitative AND quantitative understanding of similarities and tradeoffs Promote interactive discussions between stakeholders – Generate new policies

Present
Version 1.1 on the web siteVersion 1.2 Development circulating

Future
Bulletproof development version and releaseSolicit needs Include some concepts from TVA’s tool Additional timesteps Connections to other tools and more!
Add features to version 2.0