graphical presentation and classification for assessment of ground water quality by ism ravi kiran...
DESCRIPTION
Classification either on quality or type based for groundwater can offer great advantages especially in regional groundwater management. It provides a short, quick processing, interpretation for a lot of complete hydro-chemical data sets and concise presentation of the results. There is a demonstrable need for a quality assurance, with the advanced usage of world's largest fresh water storage i.e Ground water. Its getting depleted over the years and the quality of the same degrading with a rapid pace. Ground water Quality is assessed mainly by the chemical analysis of samples. The data obtained from the chemical analysis is key for the further classification, analysis, correlation etc. Graphical and Numerical interpretation of the data is the main source for Hydro-chemical studies. In this paper we test the performance of the many available graphical and statistical methodologies used to classify water samples including: Collins bar diagram, Stiff pattern diagram, Schoeller plot, Piper diagram, Durov's Double Triangular Diagram, Gibbs's Diagram, Stuyfzand Classification. This paper explains various models which classify, correlate etc., summarizing the water quality data. The basic graphs and diagrams in each category are explained by sample diagrams. In addition to the diagrams an overall characterization of hydro-chemical facies of the water can be carried out by using plots which represents a water type and hardness domain. The combination of graphical and statistical techniques provides a consistent and objective means to classify large numbers of samples while retaining the ease of classic graphical presentation.TRANSCRIPT
Graphical Presentation and Classification for assessment of Groundwater Quality
presented by
Ravi Kiran JP Email : [email protected]
Department of Environmental Science & Engineering
Indian School of Mines(ISM), Dhanbad Jharkhand- 826004
Source of this Paper:
Study on spatial distribution of geochemical characteristics in Groundwater of North Bengal using GIS and its evaluation using statistical and graphical techniques under NIH ROORKEE in association with MINISTRY OF WATER RESOURCES INDIA.
SR kumar, Scientist H, NIH Roorkee.
Assisted by Anshul Jain & Prashanth.
Ground Water
Water present in the subsurface environment of earth is called Groundwater, an important component of water resource systems.
Groundwater is the largest reservoir of fresh water that is readily available to humans( 90% of Earth’s fresh water).
Extracted from aquifers through pumping wells and supplied for domestic use, industry and agriculture.With increased withdrawal of groundwater, the quality of groundwater has been continuously deteriorating.
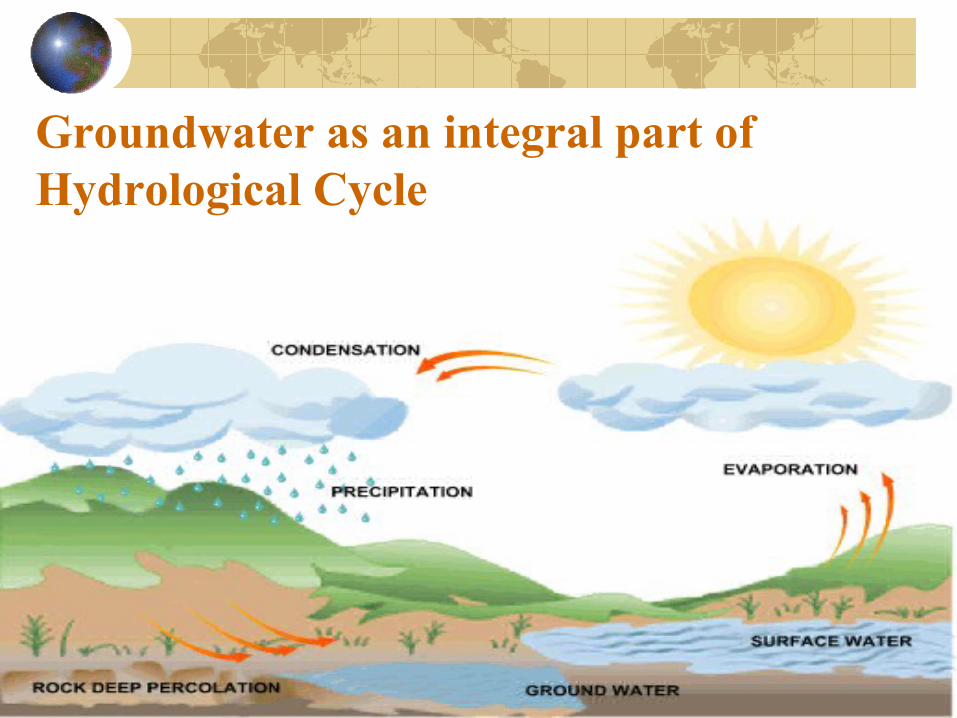
Groundwater as an integral part of Hydrological Cycle
Ground Water Quality Significance
Helps us understand the hydro-geologic system.
Indicates comingling of groundwater and surface water.
Helps us interpret groundwater flow dynamics
Delineates groundwater contamination.

Ground Water contamination

Sources of GW Pollution
Effects of Ground water Pollution
Ground water contaminated with bacteria, chemicals, pesticides, gasoline or oil can result in various human health problems, Ecological Imbalance etc.
It costs far less to prevent contamination than to clean up.

One Example: Landfill Effects
• Waste acts as rectors to form Toxic Products• These landfills also breeds harmful insects and organisms• Spreads contagious diseases• Ultimately Groundwater pollution
Groundwater resources Management by Water Classification
How?
Compare ions with ions using chemical equivalence
Making sure anions and cations balance
Use of diagrams and models.
Ground Water resourcesManagement by Water Classification
Why?
Helps define origin of the water
Indicates residence time in the aquifer
Aids in defining the hydrogeology
Defines suitability
Graphical Classification
Presentation of chemical analysis in graphical form makes understanding of complex groundwater system simpler and quicker.
The chemical parameters of groundwater play a significant role in classifying and assessing water quality.
The hydro chemical study reveals quality of water that is suitable for drinking, agriculture and industrial purposes
Contd..
Tables showing results of analyses of chemical quality of ground water may be difficult to interpret, particularly where more than a few analyses are involved.
To overcome this, graphical representations are useful for display purpose, for comparing analyses, and for emphasizing similarities and differences.
Graphical classifications can also aid in detecting the mixing of water of different compositions and in identifying chemical processes occurring as ground water moves (Todd, 1980).
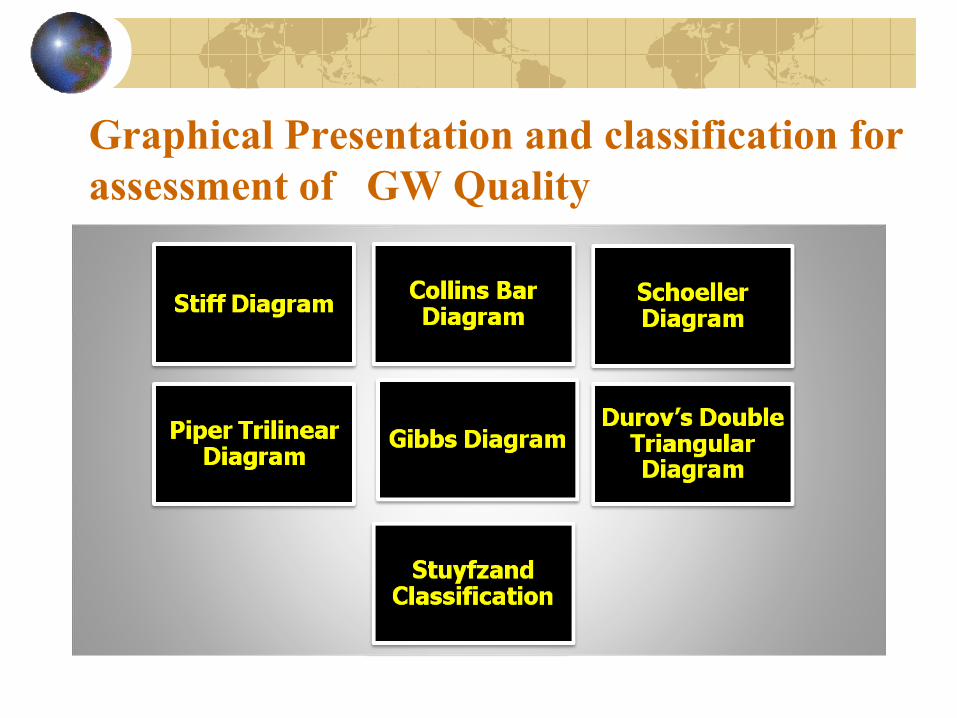
Graphical Presentation and classification for assessment of GW Quality
Stiff DiagramStiff diagrams are graphical representation of water chemical analyses, first developed by H.A. Stiff in 1951.
A polygonal shape is created from three or four parallel horizontal axes extending on either side of a vertical zero axis. Cations are plotted in milliequivalents per liter on the left side of the zero axis, one to each horizontal axis, and anions are plotted on the right side.
Stiff patterns are useful in making a rapid visual comparison between water from different sources.
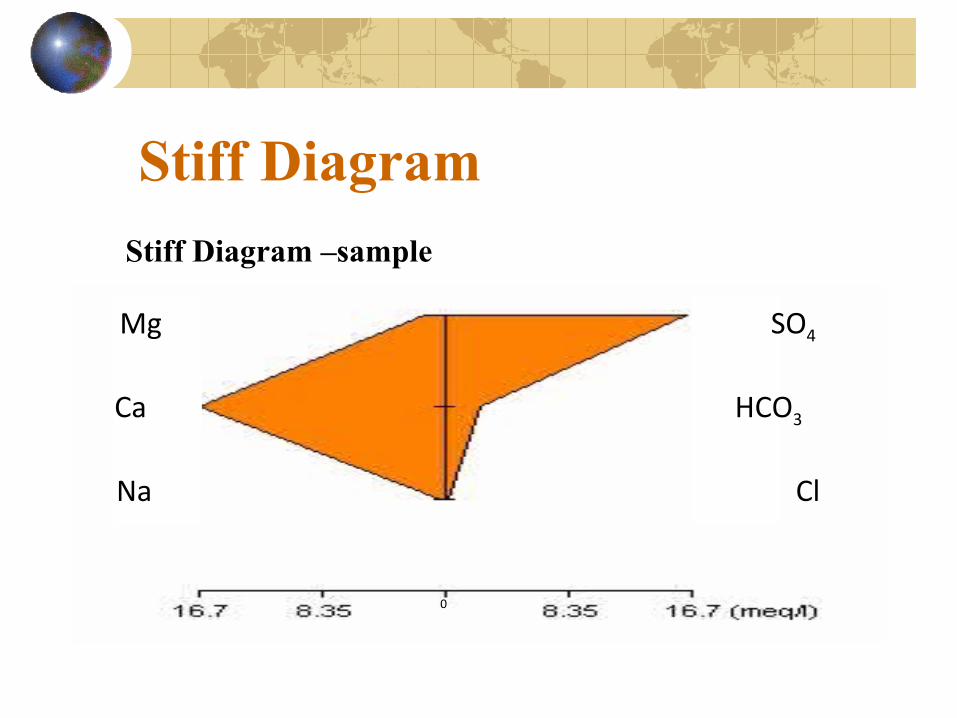
Stiff Diagram
Stiff Diagram –sample
Na
Ca
Mg SO4
HCO3
Cl
0
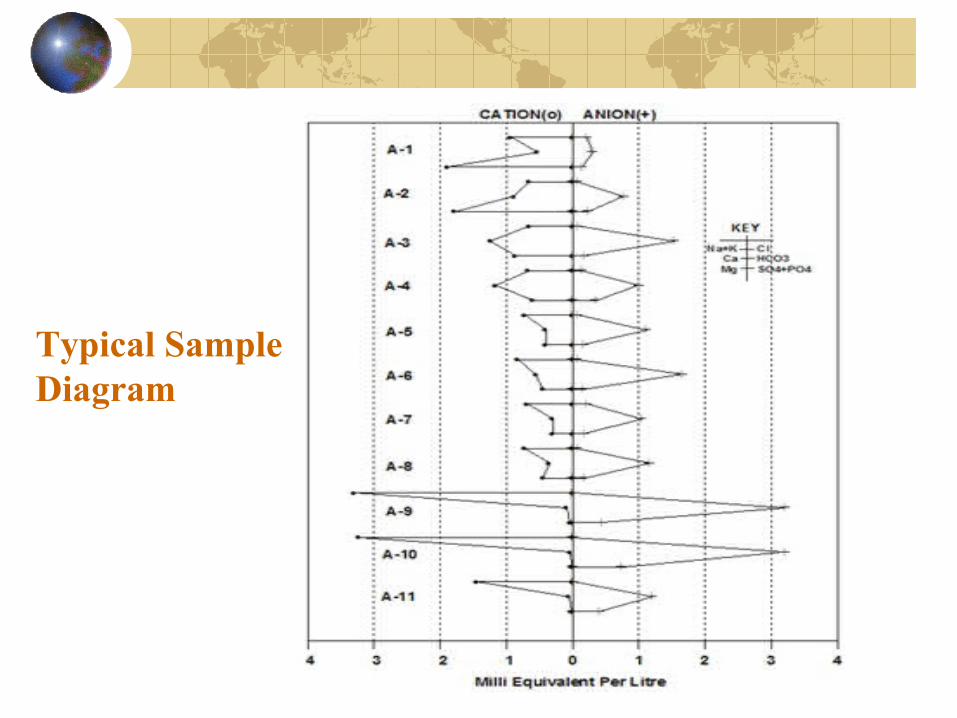
Typical Sample Diagram
ADVANTAGES
• Can help visualize ionically related waters from which a flow path can be determined, or;
• If the flow path is known, to show how the ionic composition of a water body changes over space and/or time.
DISADVANTAGE• Only one analysis per plot.
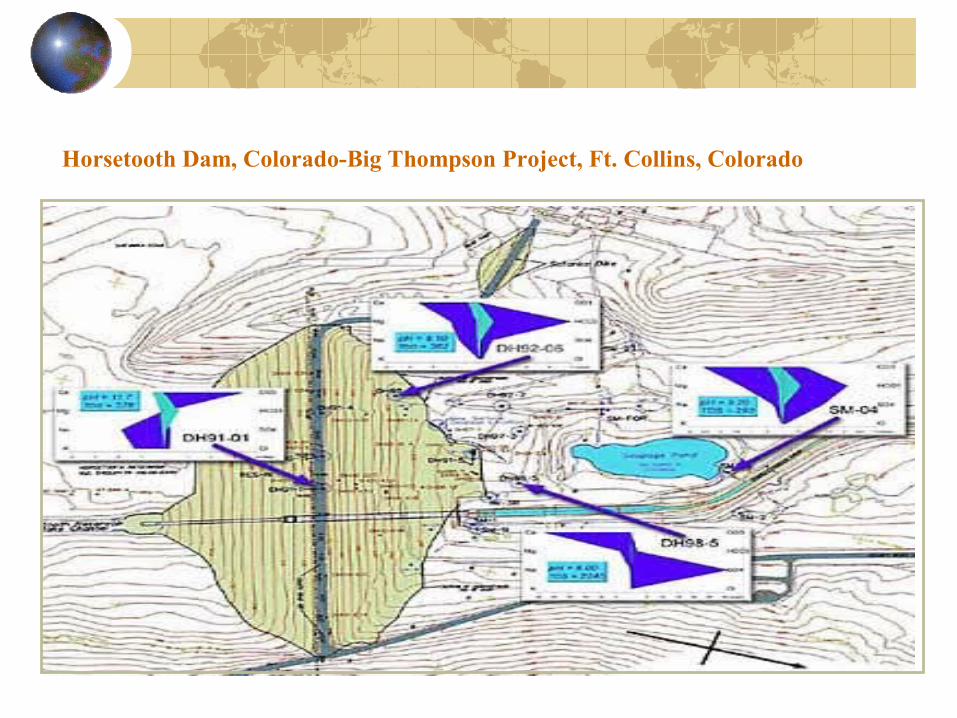
Horsetooth Dam, Colorado-Big Thompson Project, Ft. Collins, Colorado
Piper Trilinear Diagram
A piper diagram is a graphical representation of the chemistry of a water sample or samples.
The cations and anions are shown by separate ternary plots.
The apexes of the cation plot are calcium, magnesium and sodium plus potassium cations. The apexes of the anion plot are sulfate, chloride and carbonate plus bicarbonate anions.
The two ternary plots are then projected up onto a diamond. The diamond is a matrix transformation of a graph of the anions and cations
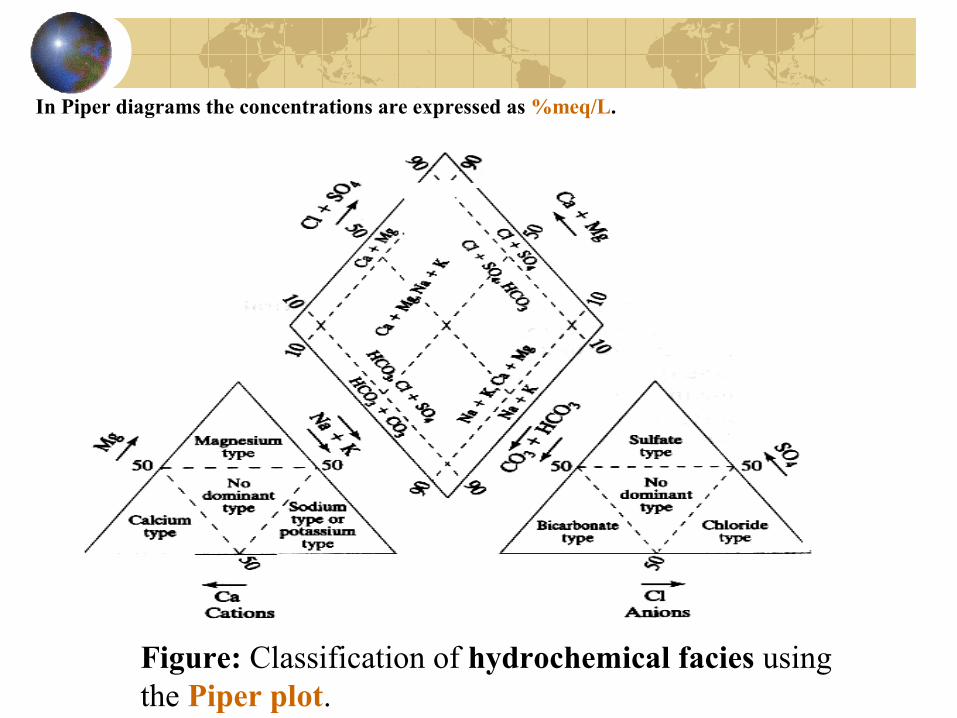
Figure: Classification of hydrochemical facies using the Piper plot.
In Piper diagrams the concentrations are expressed as %meq/L.
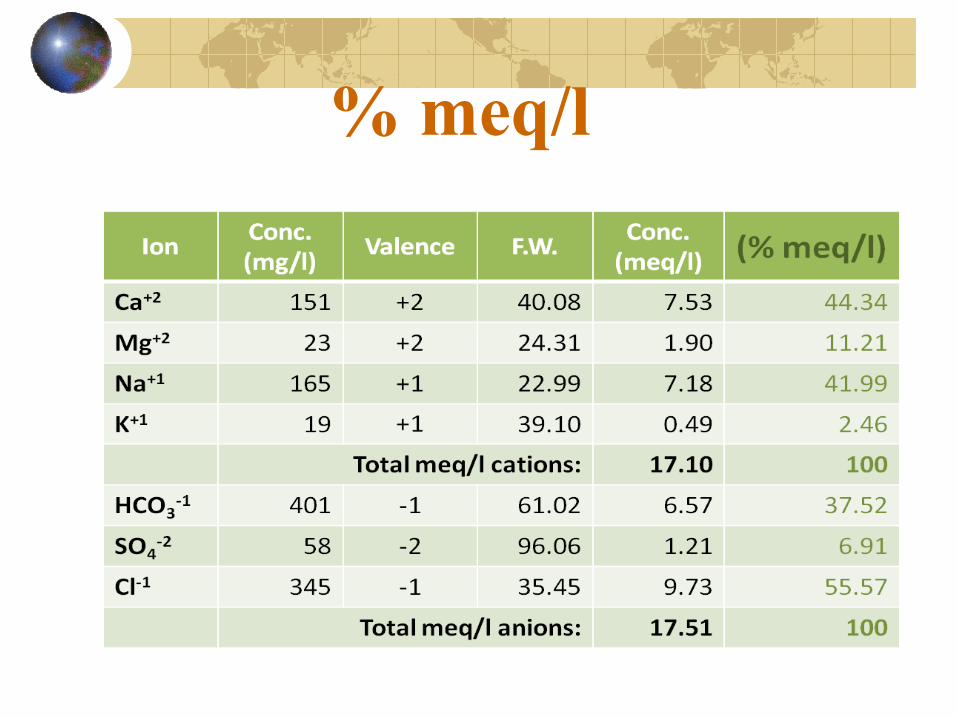
% meq/l
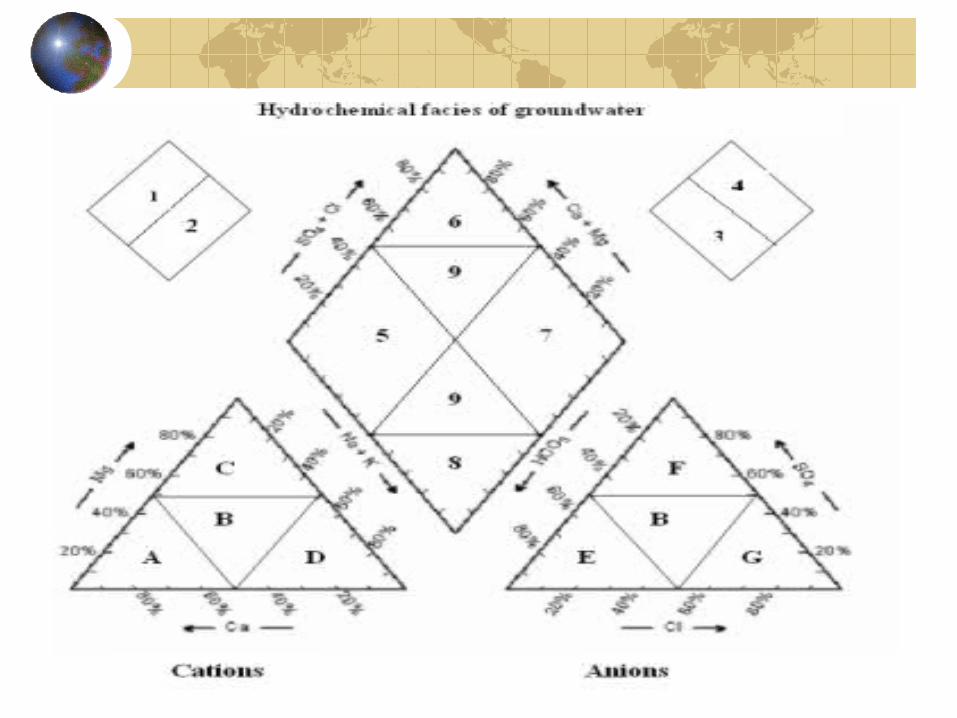
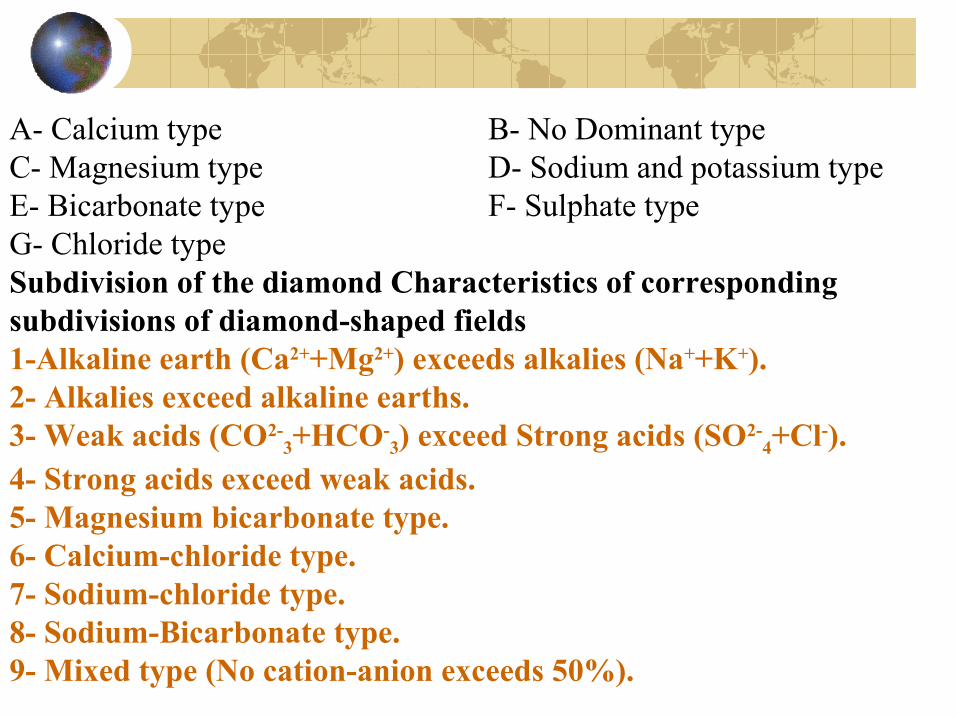
A- Calcium type B- No Dominant typeC- Magnesium type D- Sodium and potassium typeE- Bicarbonate type F- Sulphate typeG- Chloride typeSubdivision of the diamond Characteristics of corresponding subdivisions of diamond-shaped fields1-Alkaline earth (Ca2++Mg2+) exceeds alkalies (Na++K+).2- Alkalies exceed alkaline earths.3- Weak acids (CO2-
3+HCO-3) exceed Strong acids (SO2-
4+Cl-).4- Strong acids exceed weak acids. 5- Magnesium bicarbonate type.6- Calcium-chloride type. 7- Sodium-chloride type. 8- Sodium-Bicarbonate type. 9- Mixed type (No cation-anion exceeds 50%).
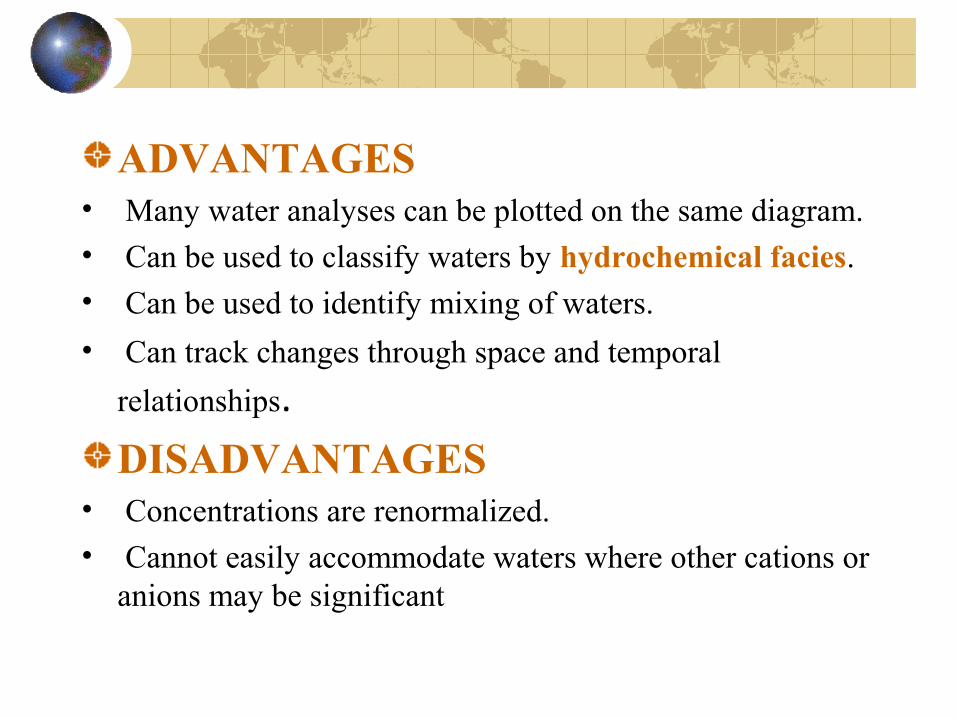
ADVANTAGES• Many water analyses can be plotted on the same diagram.• Can be used to classify waters by hydrochemical facies.• Can be used to identify mixing of waters.
• Can track changes through space and temporal
relationships.
DISADVANTAGES• Concentrations are renormalized. • Cannot easily accommodate waters where other cations or
anions may be significant
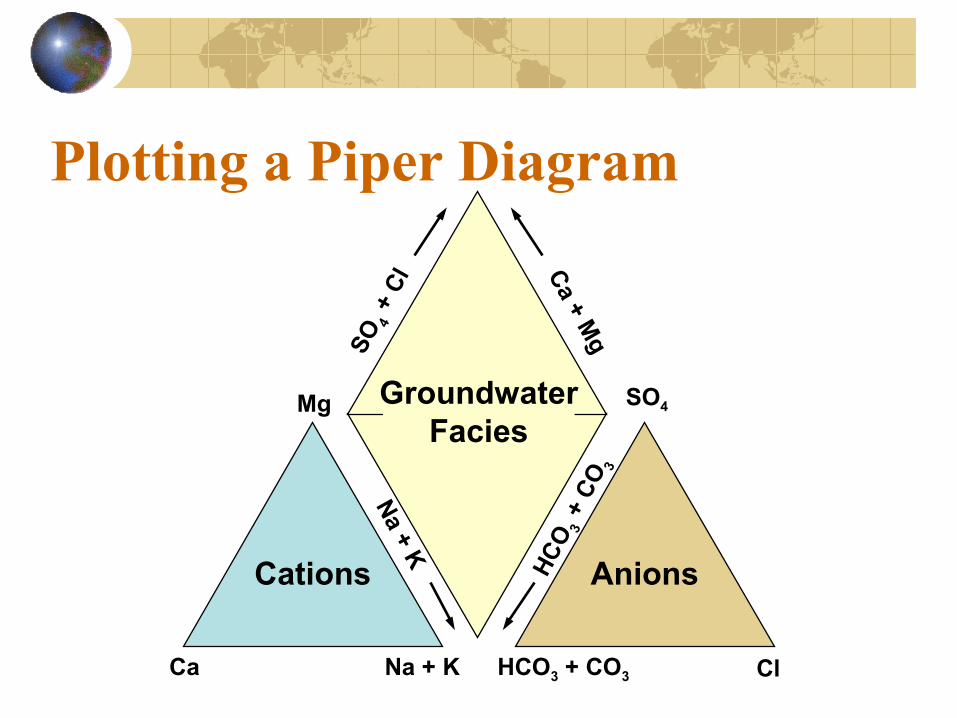
Plotting a Piper Diagram
Cations Anions
GroundwaterFacies
Ca
Mg
Na + K HCO3 + CO3 Cl
SO4C
a + MgS
O4 +
Cl
HC
O3 +
CO
3
Na + K
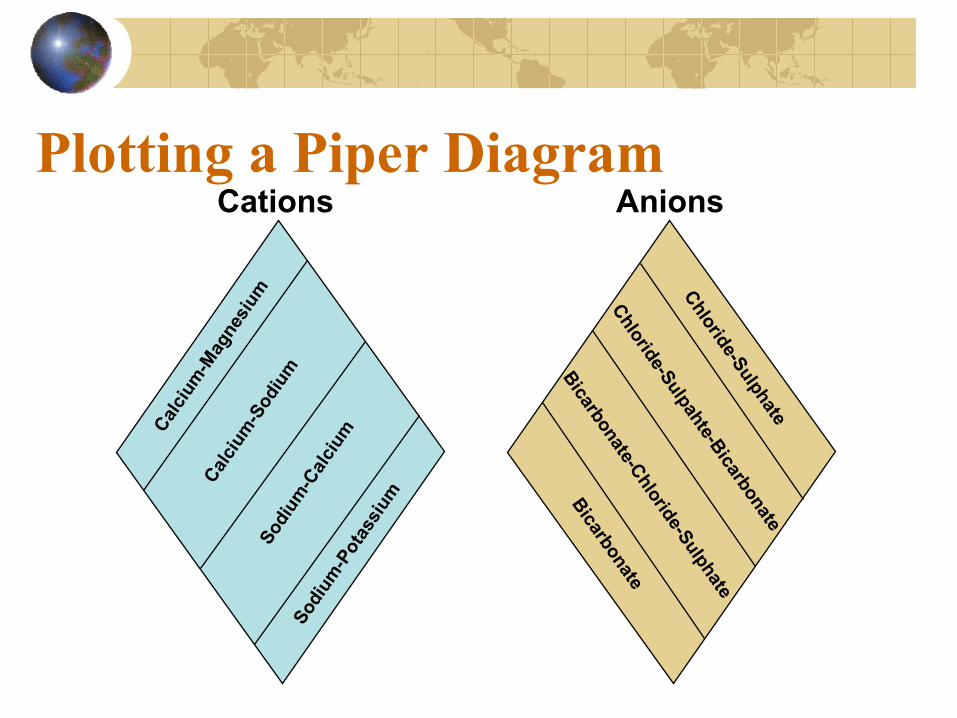
Plotting a Piper DiagramC
alci
um-M
agne
sium
Sodi
um-P
otas
sium
Chloride-Sulphate
Bicarbonate
Bicarbonate-C
hloride-Sulphate
Chloride-Sulpahte-B
icarbonateC
alci
um-S
odiu
mSo
dium
-Cal
cium
Cations Anions
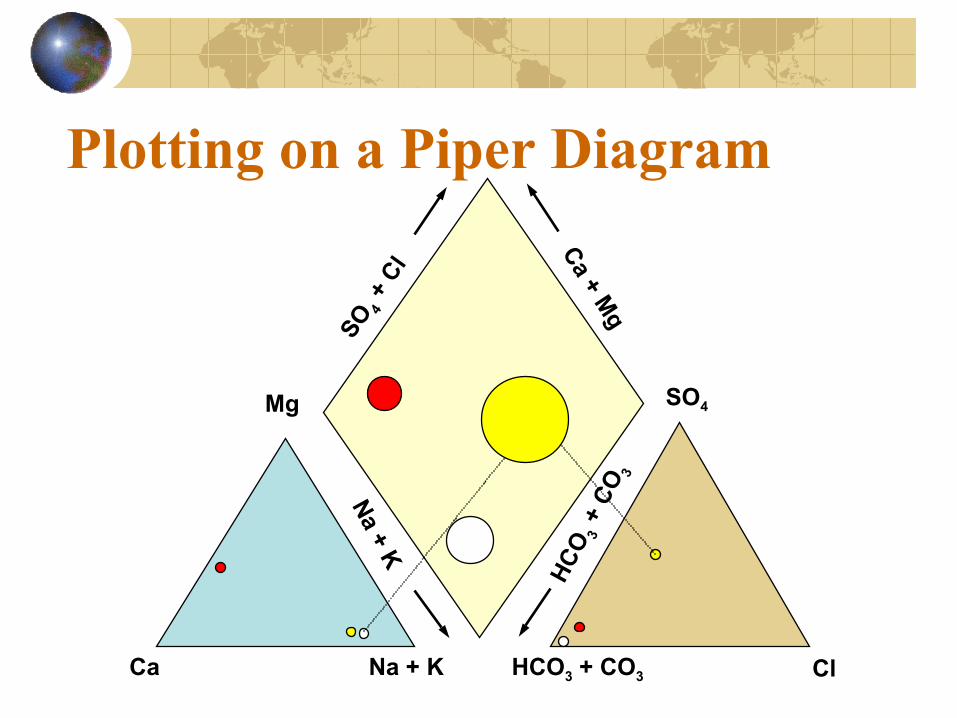
Plotting on a Piper Diagram
Ca
Mg
Na + K HCO3 + CO3 Cl
SO4C
a + Mg
SO4 +
Cl
HC
O3 +
CO
3
Na + K
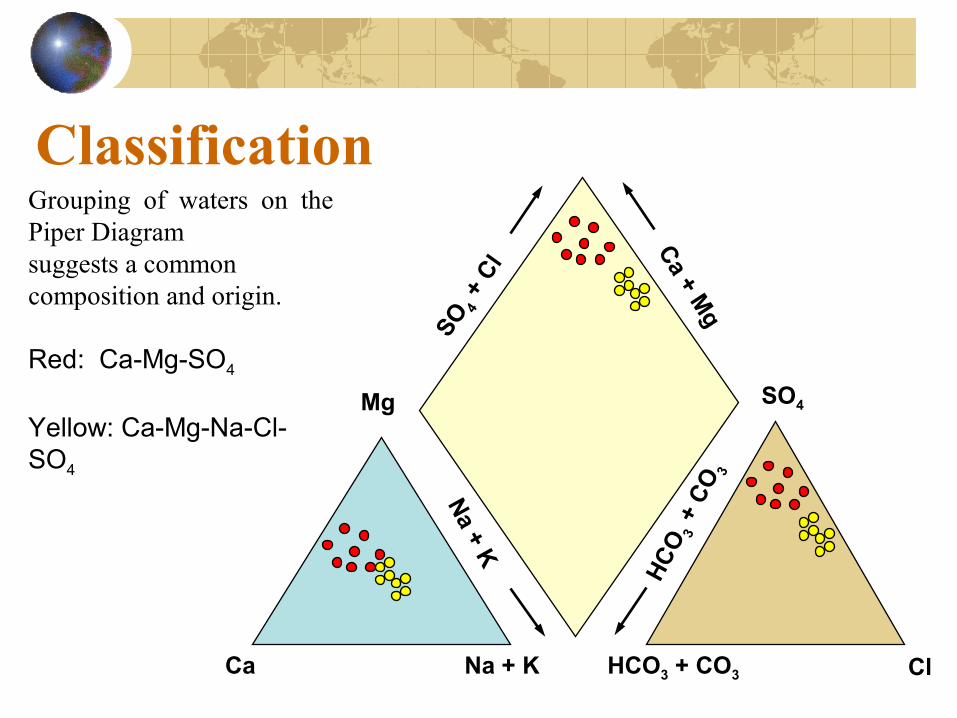
Classification
Ca
Mg
Na + K HCO3 + CO3 Cl
SO4
Ca + M
g
SO4 +
Cl
HC
O3 +
CO
3
Na + K
Grouping of waters on the Piper Diagramsuggests a commoncomposition and origin.
Red: Ca-Mg-SO4
Yellow: Ca-Mg-Na-Cl-SO4
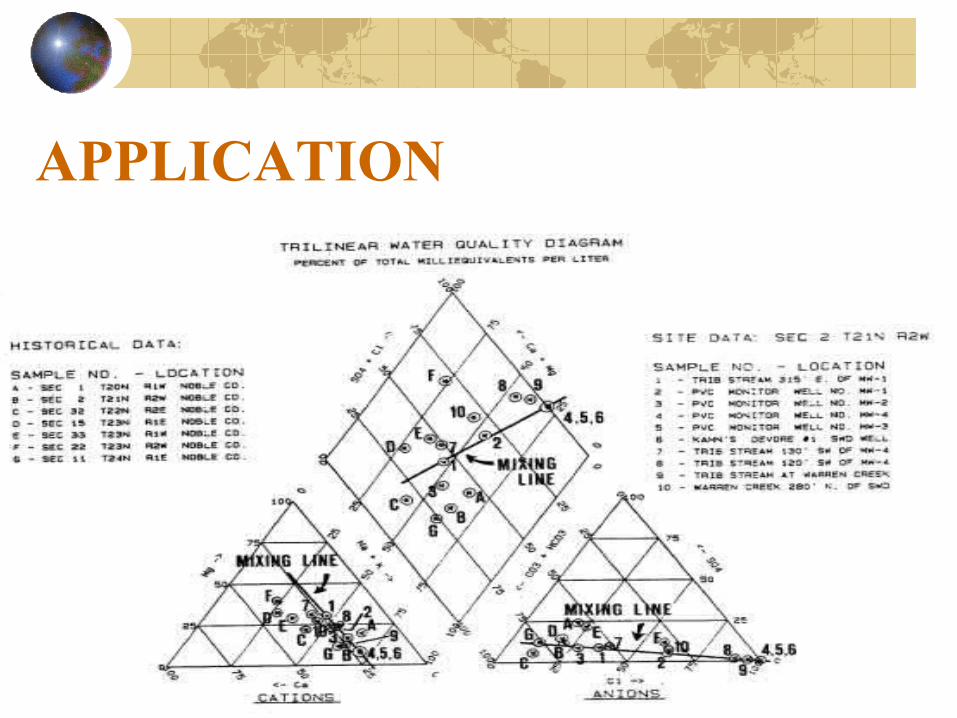
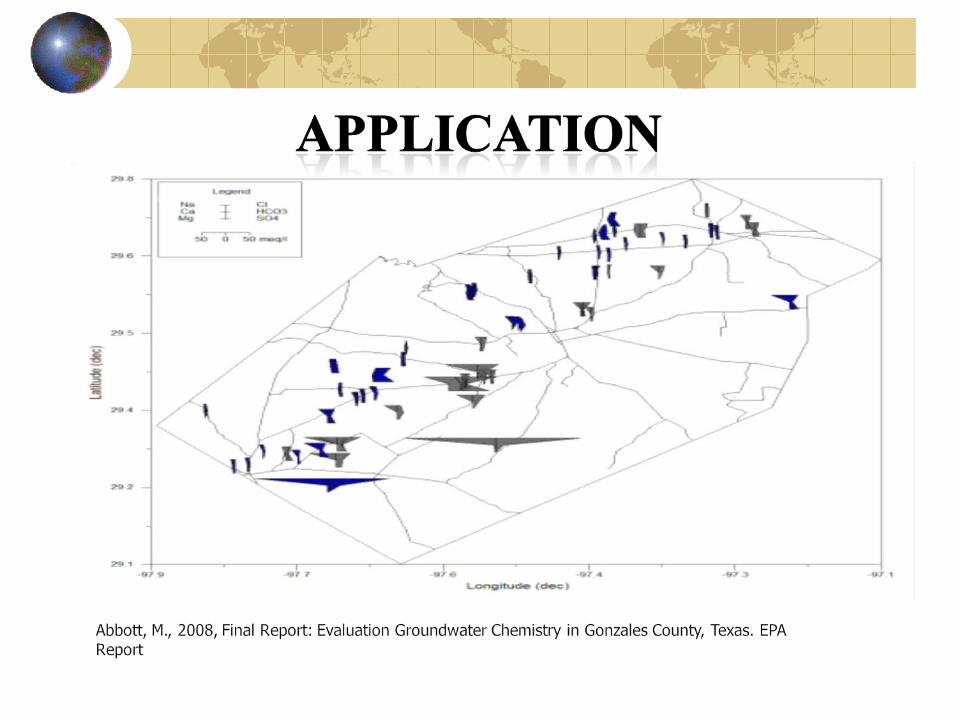
APPLICATION
Schoeller Diagram
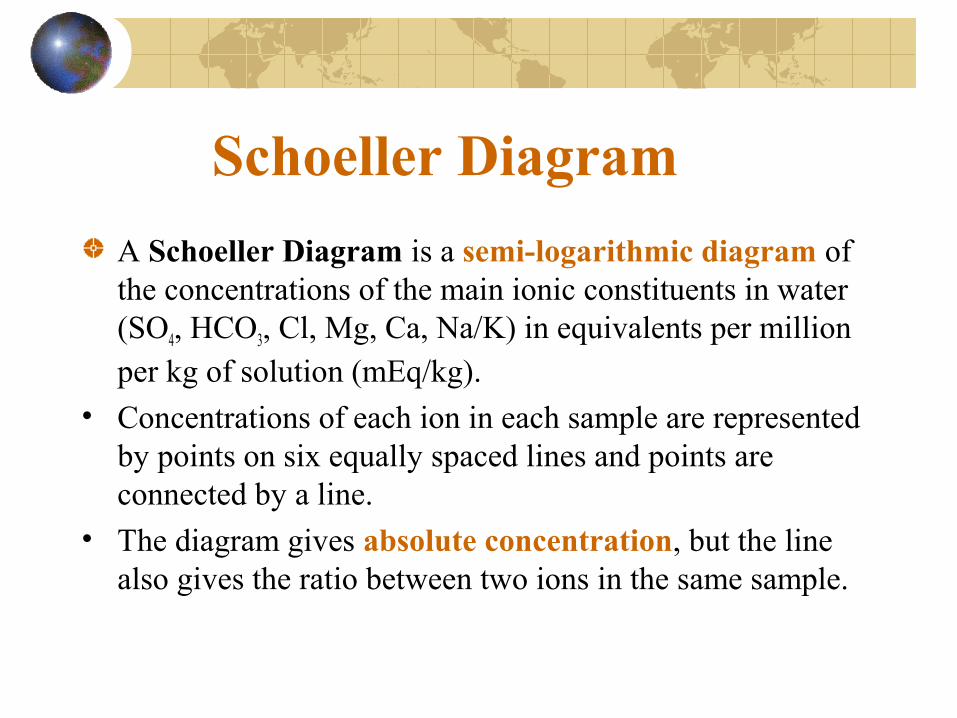
A Schoeller Diagram is a semi-logarithmic diagram of the concentrations of the main ionic constituents in water (SO4, HCO3, Cl, Mg, Ca, Na/K) in equivalents per million per kg of solution (mEq/kg).
• Concentrations of each ion in each sample are represented by points on six equally spaced lines and points are connected by a line.
• The diagram gives absolute concentration, but the line also gives the ratio between two ions in the same sample.

Schoeller Diagram
Key note:
Because of logarithmic scale, if a straight line joining the two points of two ions in one water sample is parallel to another straight line joining the other two points of the same two ions in another water sample, the ratio of the ions in both analyses is equal.
Studies that use Schoeller Diagram
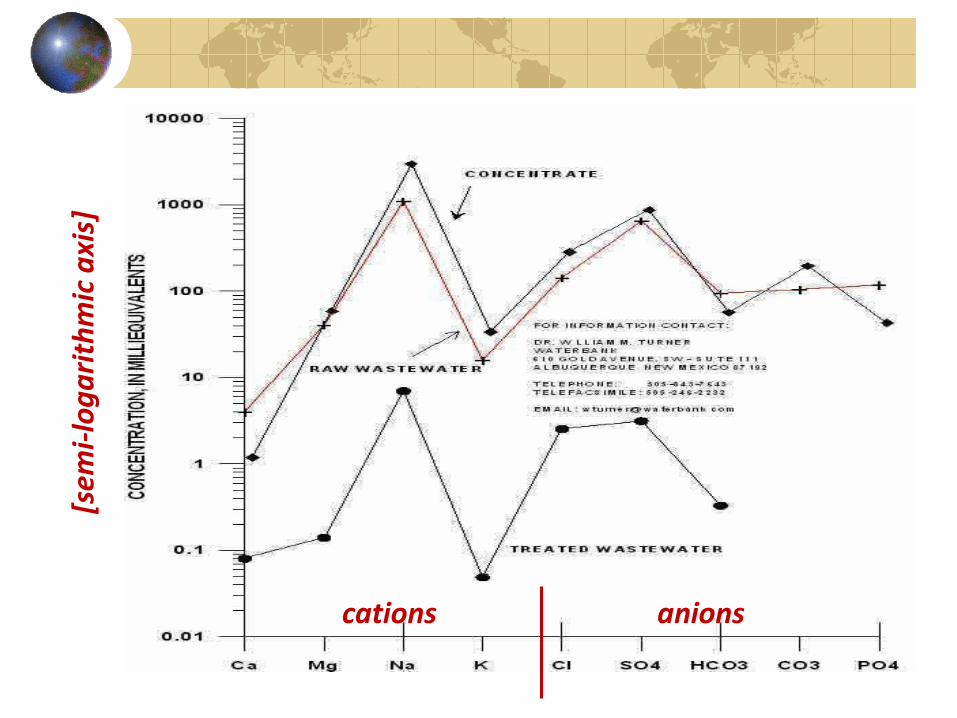
cations anions
[sem
i-log
arit
hmic
axi
s]
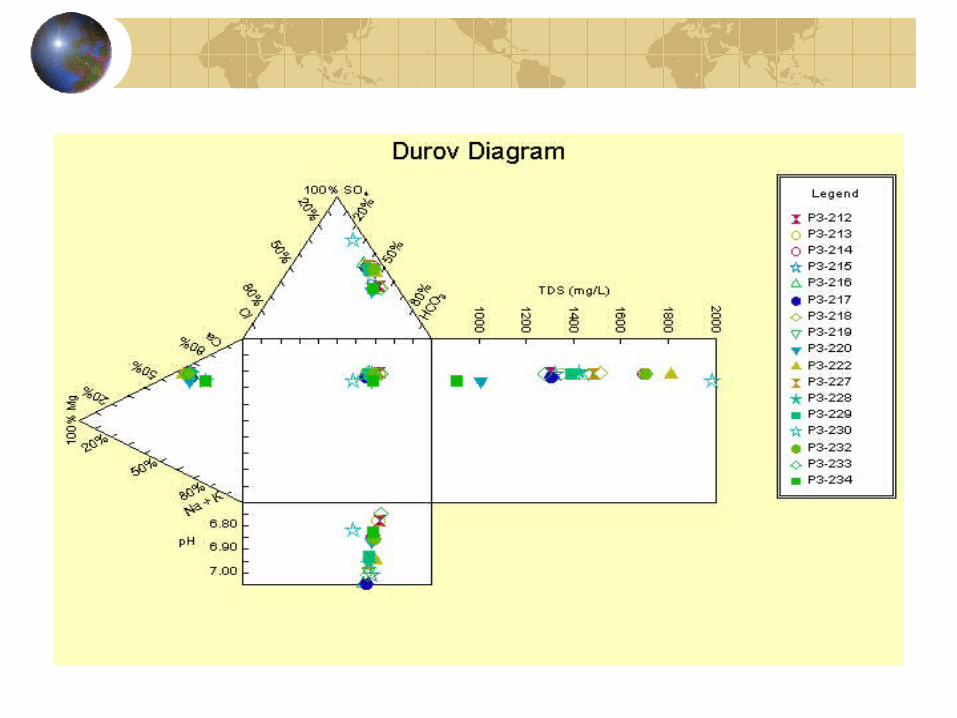
Durov’s Double Triangular DiagramDescription/ Type of data : a composite plot consisting of 2 ternary diagrams where the cations of interest are plotted against the anions of interest (data is normalized to 100%); sides form a binary plot of total cation vs. total anion concentrations (this plot can be contoured); expanded version includes TDS (mg/L) and pH data added to the sides of the binary plot to allow further
comparisons. • Primary: Cations (i.e. Na + K, Ca and Mg) and Anions
(i.e. Cl, HCO3 and SO4), and total cations vs. total anions only.
• Expanded: TDS and pH added
Applications
To graphically illustrate cation/anion concentrations, relative to TDS and pH.
For example, using samples IC and AAS data, we can plot the ion concentrations, then calculate the TDS from our specific conductivity field measurements, and use the pH field measurements. Because we sampled at several locations (i.e. causeway, pond, etc.), we can use those as data groups to see if there are any spatial variations in water chemistry , and if so, could they be related to a different TDS content, different pH, or both
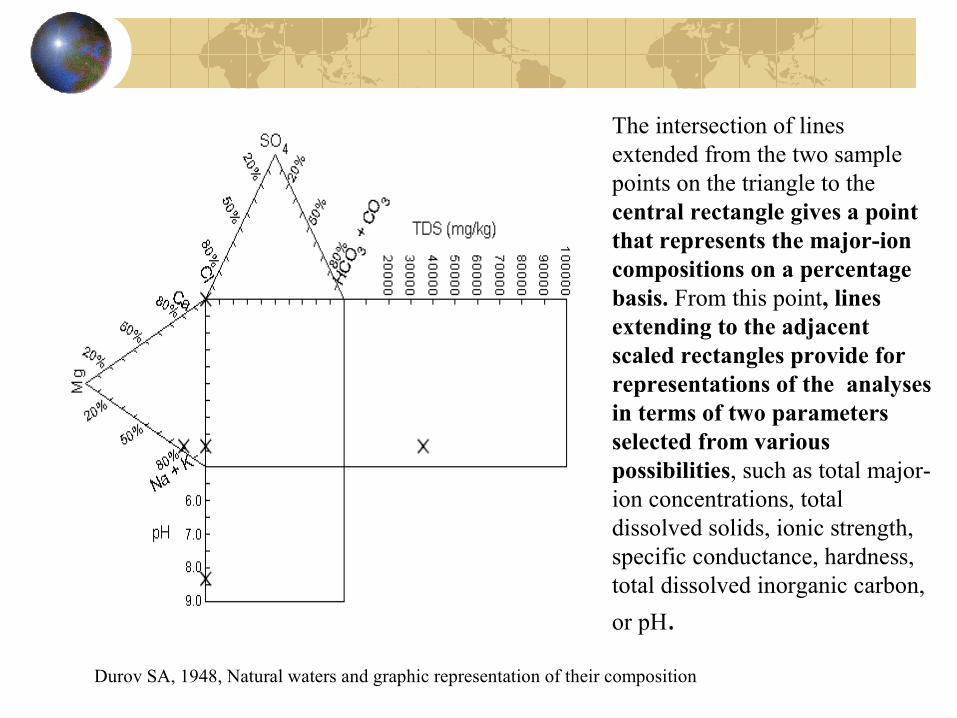
The intersection of lines extended from the two sample points on the triangle to the central rectangle gives a point that represents the major-ion compositions on a percentage basis. From this point, lines extending to the adjacent scaled rectangles provide for representations of the analyses in terms of two parameters selected from various possibilities, such as total major-ion concentrations, total dissolved solids, ionic strength, specific conductance, hardness, total dissolved inorganic carbon,
or pH.
Durov SA, 1948, Natural waters and graphic representation of their composition
Collins bar Diagram
Display of concentrations (not ratios) for individual samples
But as it is a cumulative chart the values are not readily apparent
Total height ~ reflects TDS
Easier to compare samples than pie charts
Collin bar Diagram
Collin Bar Diagram
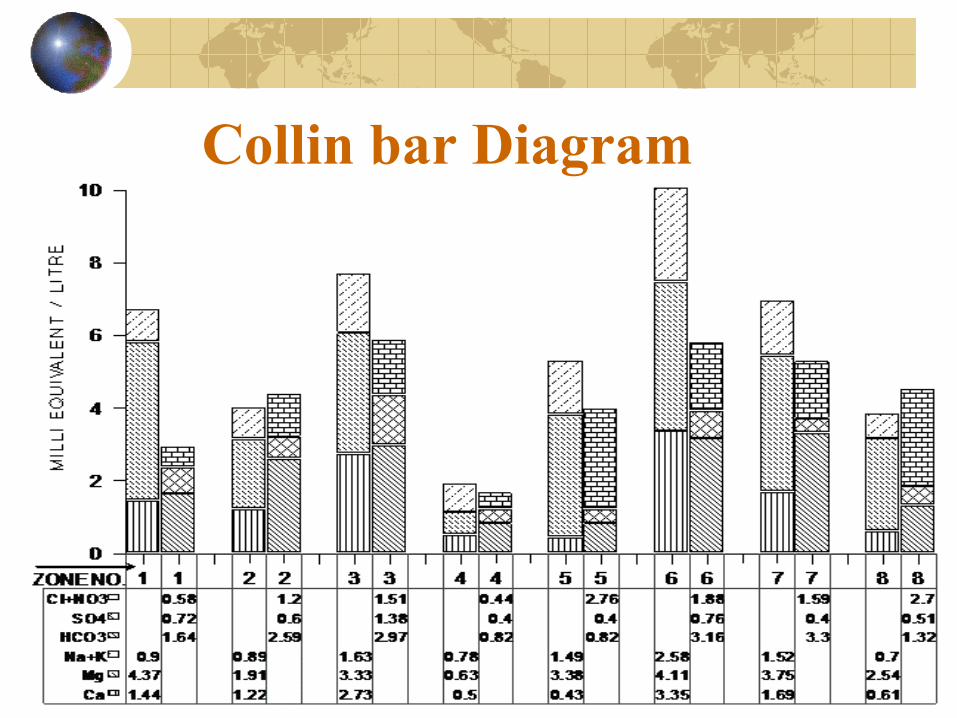
These are vertical bar diagrams. Each sample is represented by two bars, one for cations and other for anions. The height of each bar is proportional to the total concentration of cations or anions in meql-1.
The concentration of cations and anions can be plotted either in absolute values or as the percentage of total epm.
The Collin’s bar chart was used to show the concentration of various major ions of the analyzed samples.
The cations are represented as Ca2+, Mg2+, Na+, K+, and the anions as Cl-, SO4
2- and CO32-, HCO3
2- .
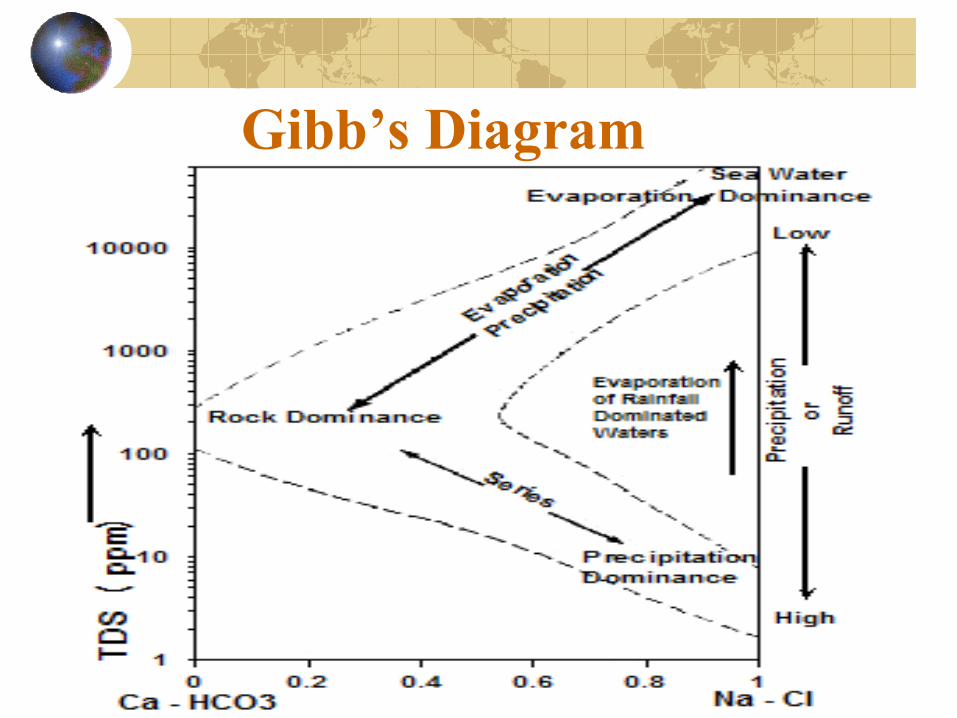
Gibb’s DiagramMany aspects of the over all mechanism are still poorly understood of Ground water. Therefore, Gibb's suggested a graphical diagram to understand the water chemistry relationship of the chemical components of the water from the respective aquifers, such as chemistry of the rock types, chemistry of the precipitated water and rate of evaporation.
Based on Gibbs variation (ratio – I) i. e. anions dominant and Gibbs variation (ratio – II) i. e. cation dominant nature, the groundwater samples of the area are plotted separately against respective values to know the nature of the groundwater chemistry of the area .
Gibb’s Diagram
Gibb’s Diagram
The Gibbs plot depicted that the chemistry of waters were modified by chemical weathering piloted by precipitation as the major factor controlling the chemistry of the sub-surface waters
It illustrates the three major mechanisms that regulate the chemistry of the world's water:
(1) Evapo-concentration
(2) selective mineral precipitation
(3) rainfall of variable composition
Stuyfzand Classification
A new hydrochemical classification of water types.
This subdivides the most important chemical water characteristics at 4 levels. The primary type is determined based on the chloride content (Table I).
The type is determined on the basis of an index for hardness (Table II). The classification into subtypes is determined based on the dominant cations and anions.
Finally, the class is determined on the basis of the sum of Na, K and Mg in meq/l, corrected for a sea salt contribution.
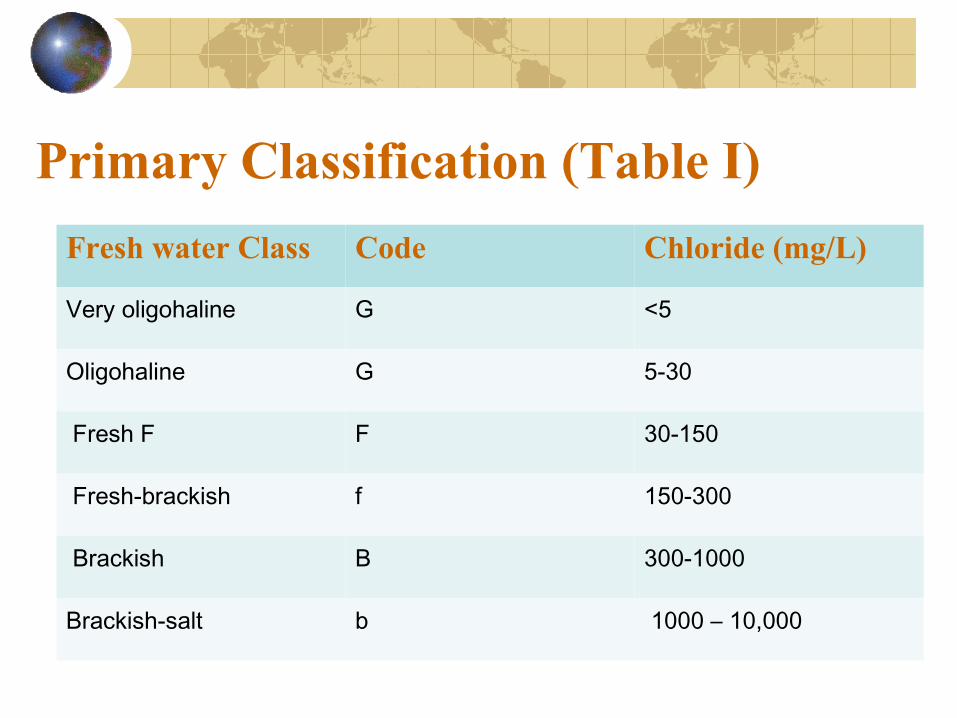
Primary Classification (Table I)
Fresh water Class Code Chloride (mg/L)
Very oligohaline G <5
Oligohaline G 5-30
Fresh F F 30-150
Fresh-brackish f 150-300
Brackish B 300-1000
Brackish-salt b 1000 – 10,000
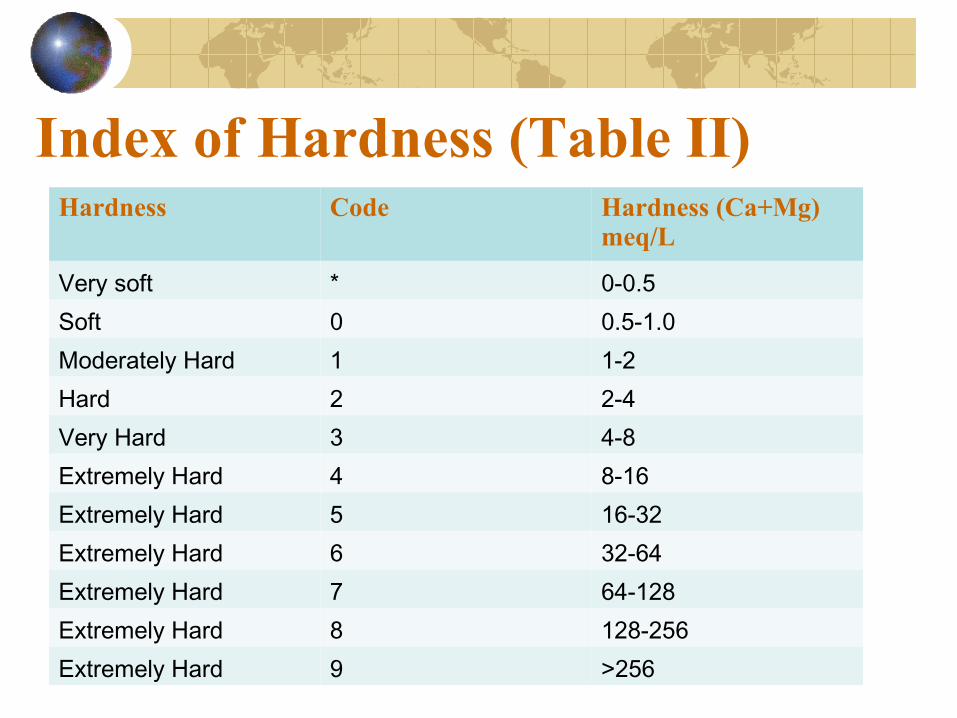
Index of Hardness (Table II)Hardness Code Hardness (Ca+Mg)
meq/L
Very soft * 0-0.5Soft 0 0.5-1.0Moderately Hard 1 1-2Hard 2 2-4Very Hard 3 4-8Extremely Hard 4 8-16Extremely Hard 5 16-32Extremely Hard 6 32-64Extremely Hard 7 64-128Extremely Hard 8 128-256Extremely Hard 9 >256
Conclusion
It provides a quick processing and interpretation of a lot of complete water analysis and a short, concise presentation of the results in graphical form makes understanding of complex. groundwater system simpler and quicker.
This study illustrated the usefulness of multivariate statistical techniques in the water quality assessment and identification of pollution sources.
Accuracy assessment of the classification process using different classification algorithms is always recommended for the assessment of Ground water quality.

A graphical classification approach by using geochemical analysis of the ground water in order to estimate potential quality of the groundwater resources.
Conclusion