graphing polar curves - university of washingtonebekyel/math126/...then use that information to...
TRANSCRIPT

Math 126 Worksheet 5 Polar Coordinates
Graphing Polar Curves
The aim of this worksheet is to help you familiarize with the polar coordinate system. In particular, how theangle θ increases counter-clockwise and how the radius r increases going away from the origin. In the firstexamples, you can make a table of values and plot them. As you get more comfortable, you start thinkingwhether |r| is increasing (spiraling outward) or decreasing (sprinkling inward). You also have to keep trackof the sign of r.
1. Graph r = θ by filling out the table using your calculator. Each circular tick corresponds to 1 unit onthe scale of r as shown.
θ 0 π2 π 3π
2 2π 5π2 3π 7π
2 4πr = θ
1

Math 126 Worksheet 5 Polar Coordinates
2. Graph r = 1 + sin θ by filling out this table of values and plotting on the graph. The graph is scaledso that the radius of the complete circle is 3 units.
θ 0 π6
π4
π3
π2
2π3
3π4
5π6 π 7π
65π4
4π3
3π2
5π3
7π4
11π6 2π
r = 1 + sin θ
3. Graph r = 1+cos θ by using the table and information below. The scaling is the same as above. Whenr increases, it spirals away from the origin. When r decreases, it spirals towards the origin.
θ 0 π2 π 3π
2 2πr = 1 + cos θ 2 decreasing 1 decreasing 0 increasing 1 increasing 2
Both graphs have the same shape with different orientations. They have symmetry with respect to thex or y axes.
2
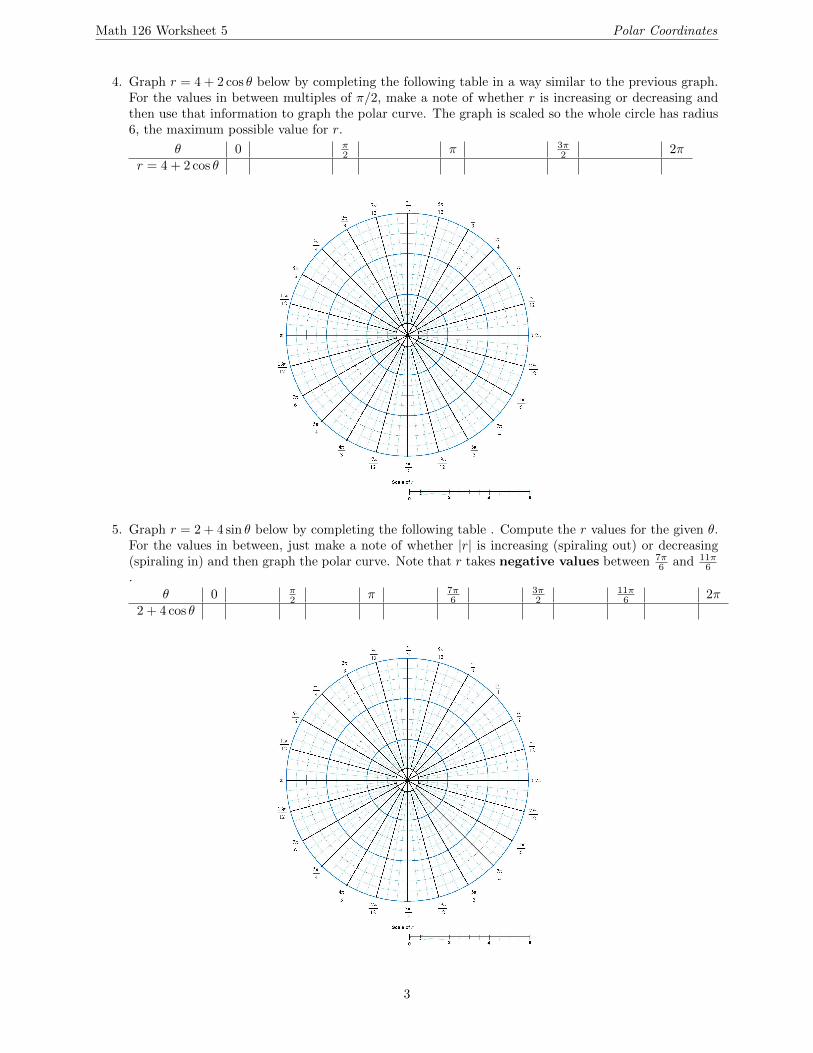
Math 126 Worksheet 5 Polar Coordinates
4. Graph r = 4 + 2 cos θ below by completing the following table in a way similar to the previous graph.For the values in between multiples of π/2, make a note of whether r is increasing or decreasing andthen use that information to graph the polar curve. The graph is scaled so the whole circle has radius6, the maximum possible value for r.
θ 0 π2 π 3π
2 2πr = 4 + 2 cos θ
5. Graph r = 2 + 4 sin θ below by completing the following table . Compute the r values for the given θ.For the values in between, just make a note of whether |r| is increasing (spiraling out) or decreasing(spiraling in) and then graph the polar curve. Note that r takes negative values between 7π
6 and 11π6
.
θ 0 π2 π 7π
63π2
11π6 2π
2 + 4 cos θ
3

Math 126 Worksheet 5 Polar Coordinates
The graphs in Questons 2-5 are from the family of cardioids. They have equations of the form r =a + b cos θ or r = a + b sin θ, with a, b > 0. You get one of the three shapes you drew depending onwhether a > b (Question 4), b < a (Question 5) or b = a (Questions 2 and 3). The other popularfamily of polar curves are the roses with equations r = a cos(nθ) or r = a sin(nθ) where n > 1 is apositive integer. You can use the polar graphs below to draw some examples from the book or sketchyour homework problems. Scale the r as appropriate.
4