graphs & data. describing data the distribution of a variable tells us what values the variable...
TRANSCRIPT
Graphs & DataGraphs & Data
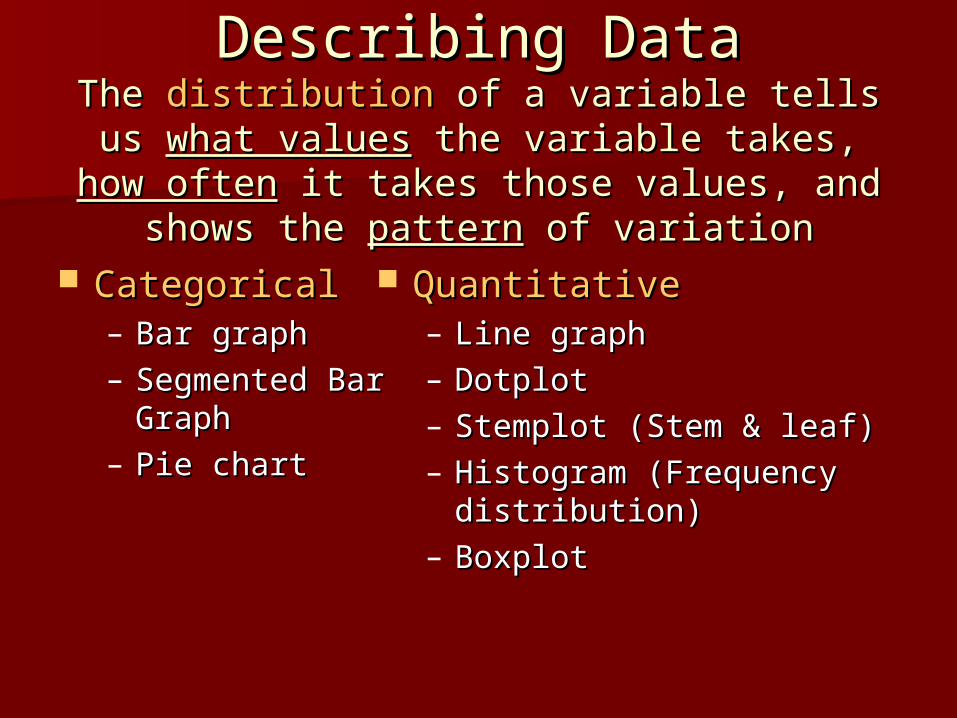
Describing DataDescribing DataThe The distributiondistribution of a variable tells us of a variable tells us what what
valuesvalues the variable takes, the variable takes, how oftenhow often it takes it takes those values, and shows the those values, and shows the patternpattern of of
variationvariation CategoricalCategorical
– Bar graphBar graph– Segmented Bar Segmented Bar
GraphGraph– Pie chartPie chart
QuantitativeQuantitative– Line graphLine graph– DotplotDotplot– Stemplot (Stem & leaf)Stemplot (Stem & leaf)– Histogram (Frequency Histogram (Frequency
distribution)distribution)– BoxplotBoxplot
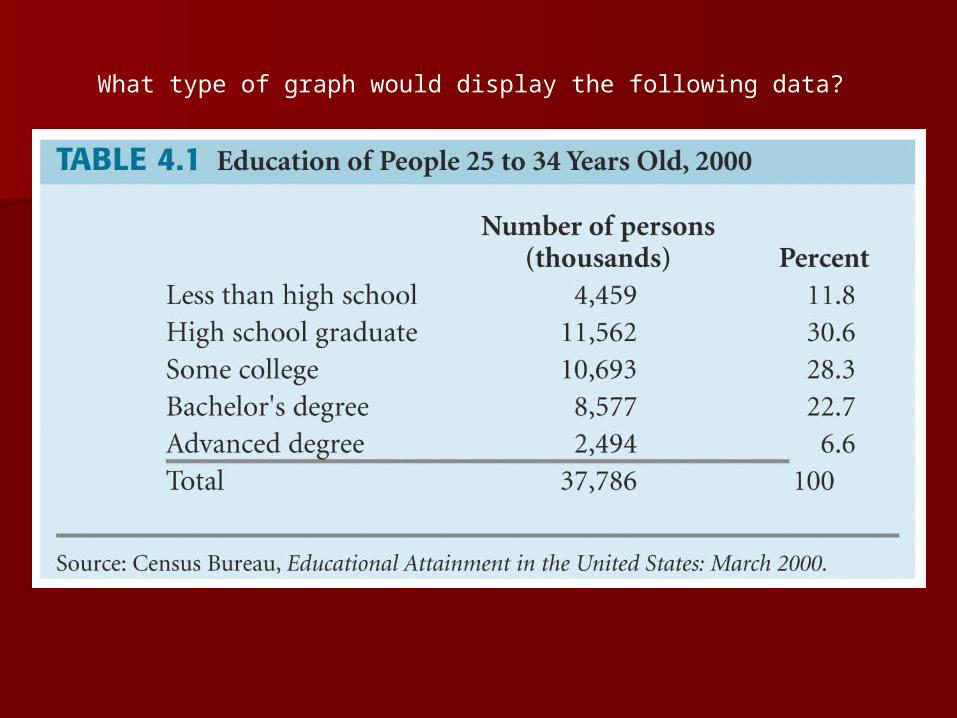
What type of graph would display the following data?
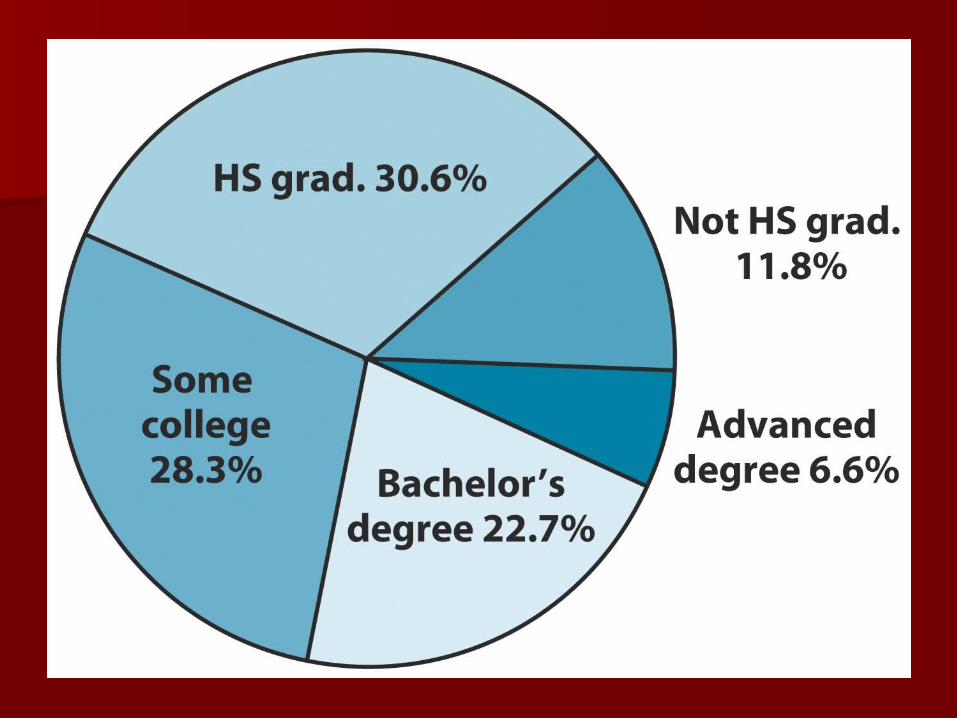
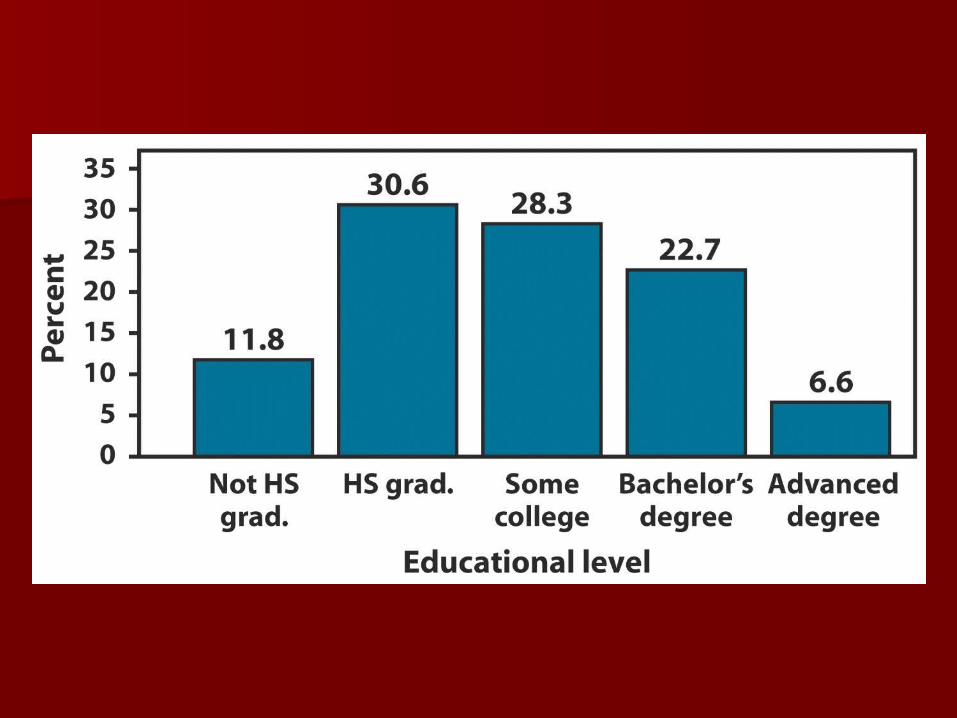

Bar, Segmented Bar, & Pie Bar, Segmented Bar, & Pie ChartsCharts
0.52293580.7363184
0.1813665
0.47706420.2636816
0.8186335
0%
20%
40%
60%
80%
100%
Children Women Men
Lost
Saved
0
500
1000
1500
Men Women Children
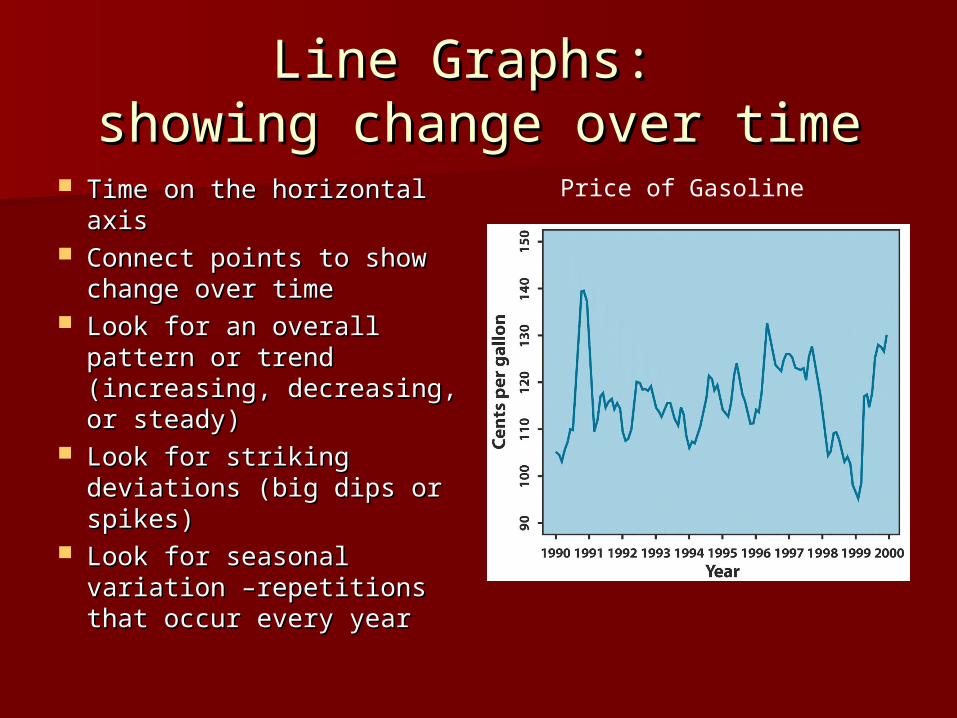
Line Graphs: Line Graphs: showing change over timeshowing change over time
Time on the horizontal axisTime on the horizontal axis Connect points to show Connect points to show
change over timechange over time Look for an overall pattern Look for an overall pattern
or trend (increasing, or trend (increasing, decreasing, or steady)decreasing, or steady)
Look for striking deviations Look for striking deviations (big dips or spikes)(big dips or spikes)
Look for seasonal variation Look for seasonal variation –repetitions that occur –repetitions that occur every yearevery year
Price of Gasoline
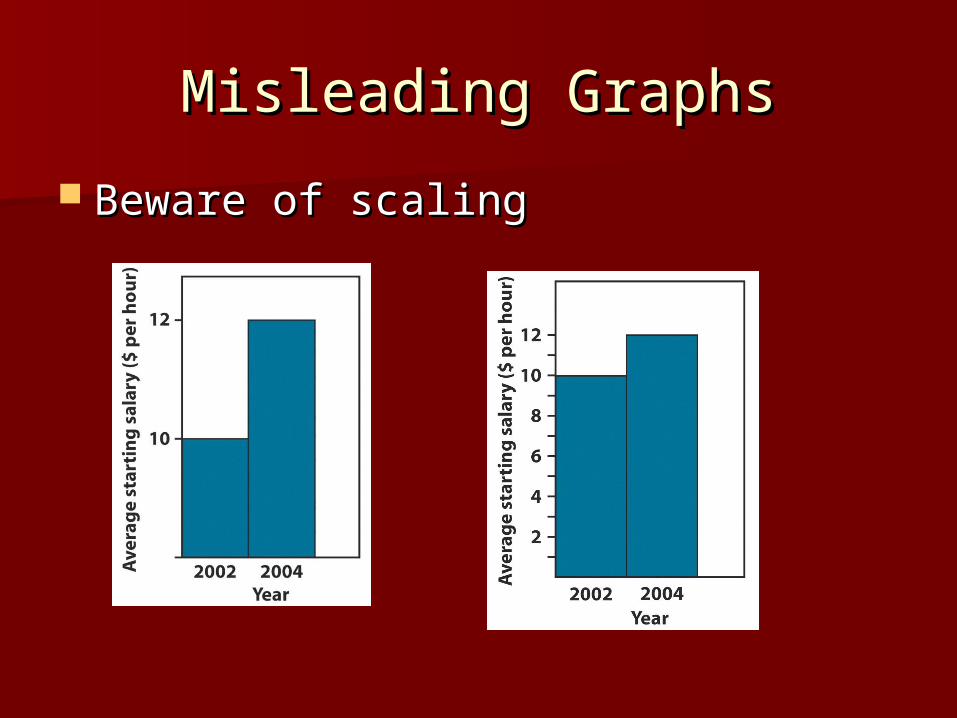
Misleading GraphsMisleading Graphs
Beware of scalingBeware of scaling
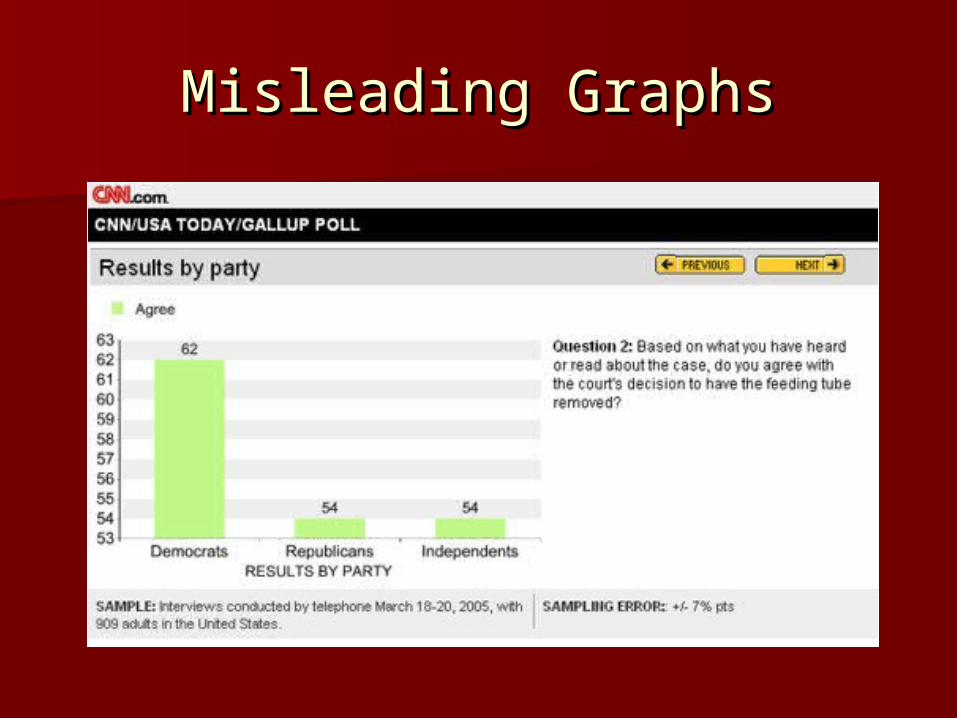
Misleading GraphsMisleading Graphs
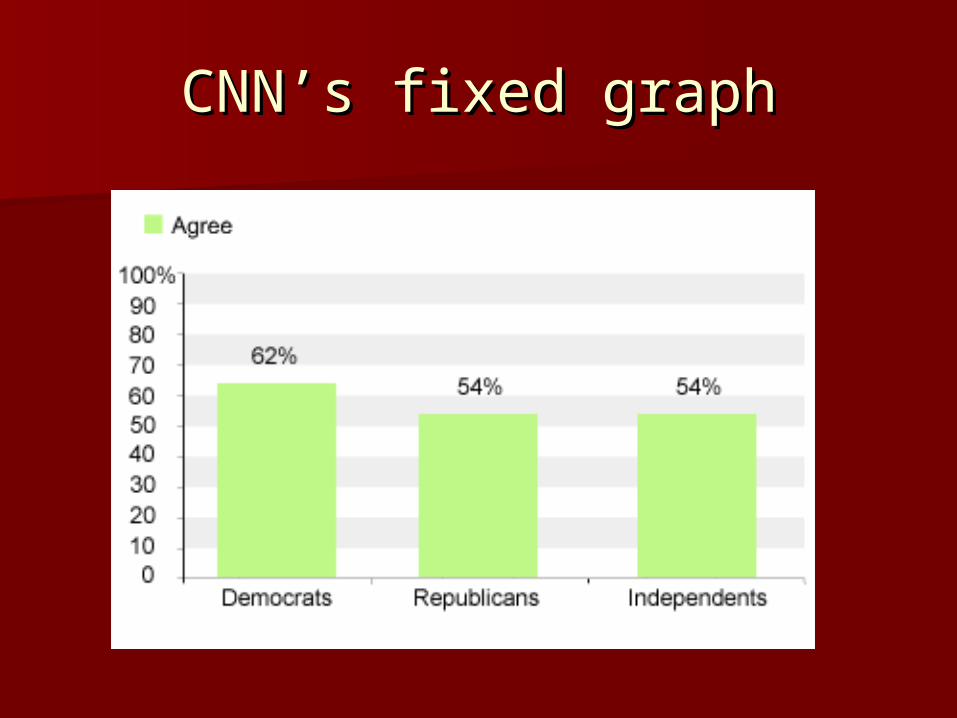
CNN’s fixed graphCNN’s fixed graph
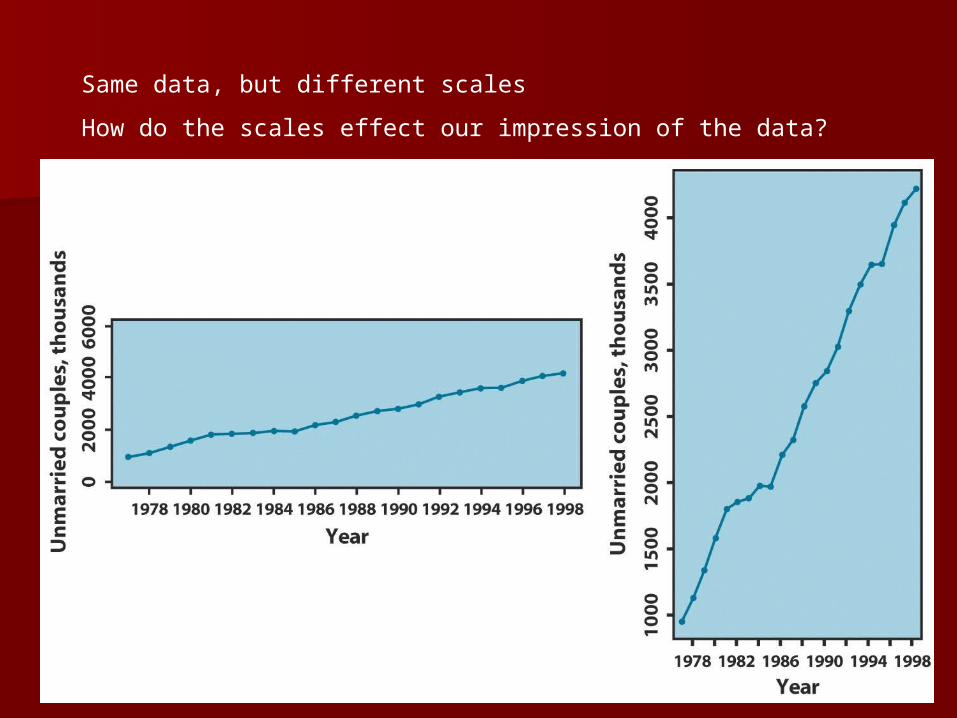
Same data, but different scales
How do the scales effect our impression of the data?
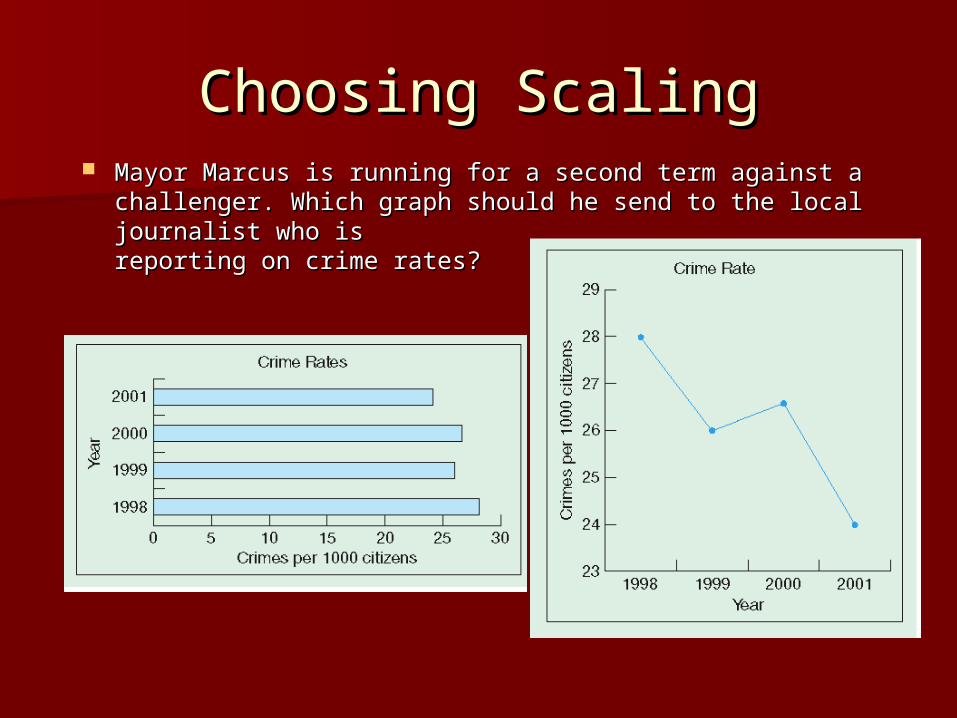
Choosing ScalingChoosing Scaling Mayor Marcus is running for a second term against a Mayor Marcus is running for a second term against a
challenger. Which graph should he send to the local challenger. Which graph should he send to the local journalist who is journalist who is reporting on crime rates?reporting on crime rates?
Misleading GraphsMisleading Graphs
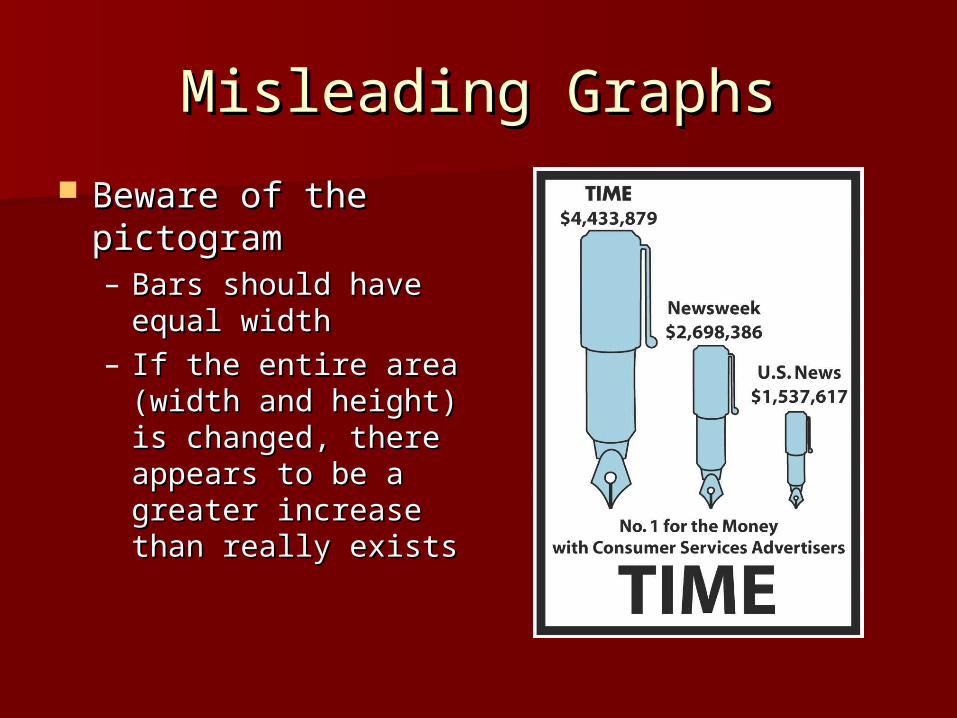
Beware of the Beware of the pictogram pictogram – Bars should have Bars should have
equal width equal width – If the entire area If the entire area
(width and height) (width and height) is changed, there is changed, there appears to be a appears to be a greater increase greater increase than really existsthan really exists
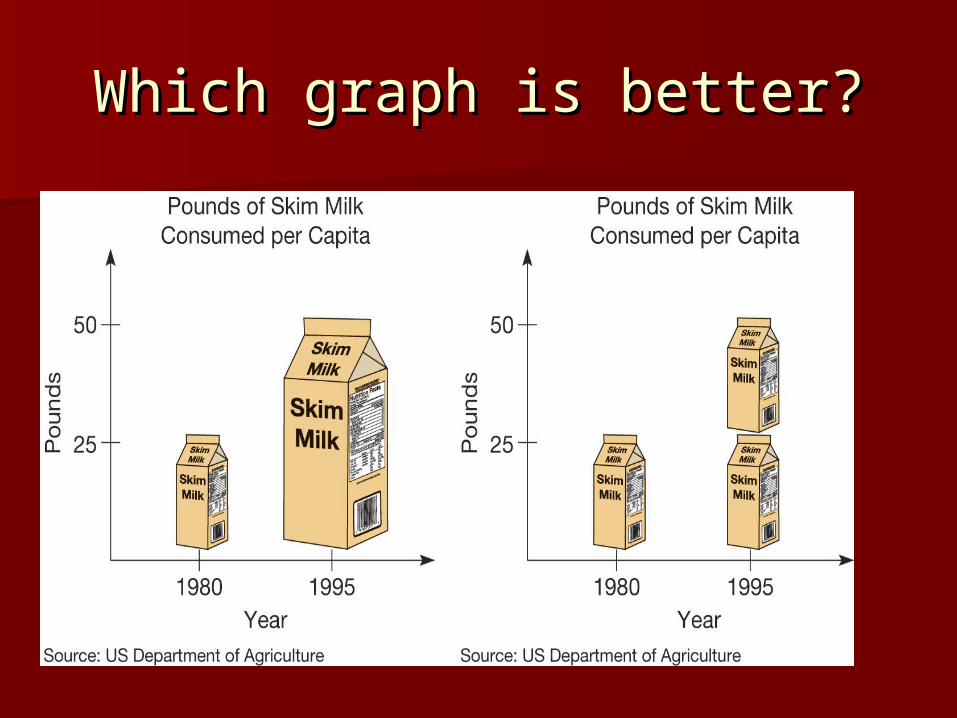
Which graph is better?Which graph is better?

What are some problems with this What are some problems with this graph?graph?
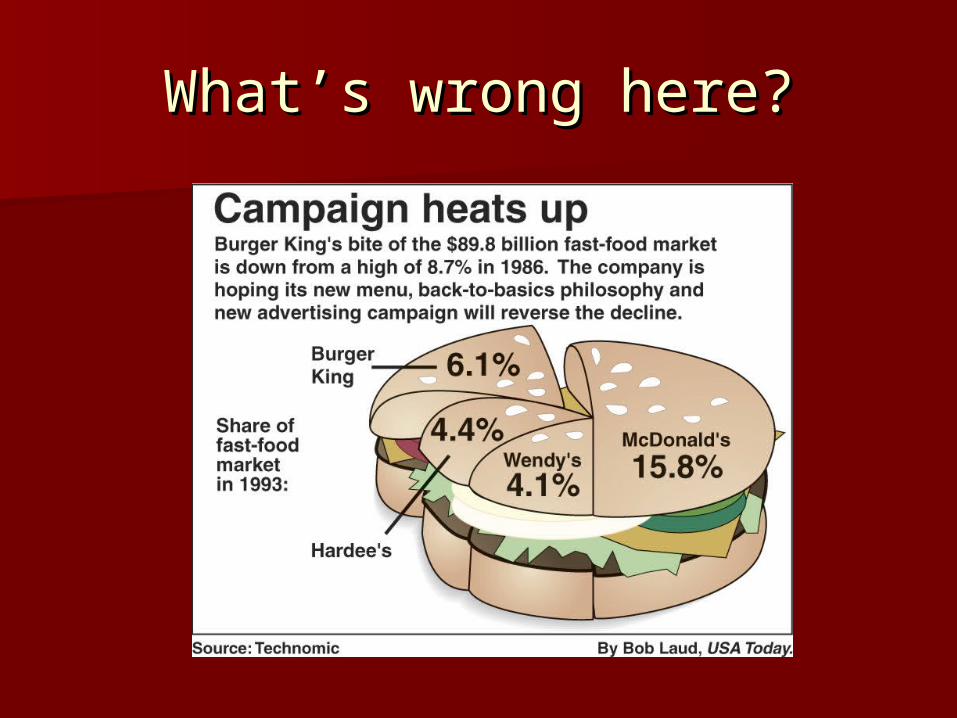
What’s wrong here?What’s wrong here?
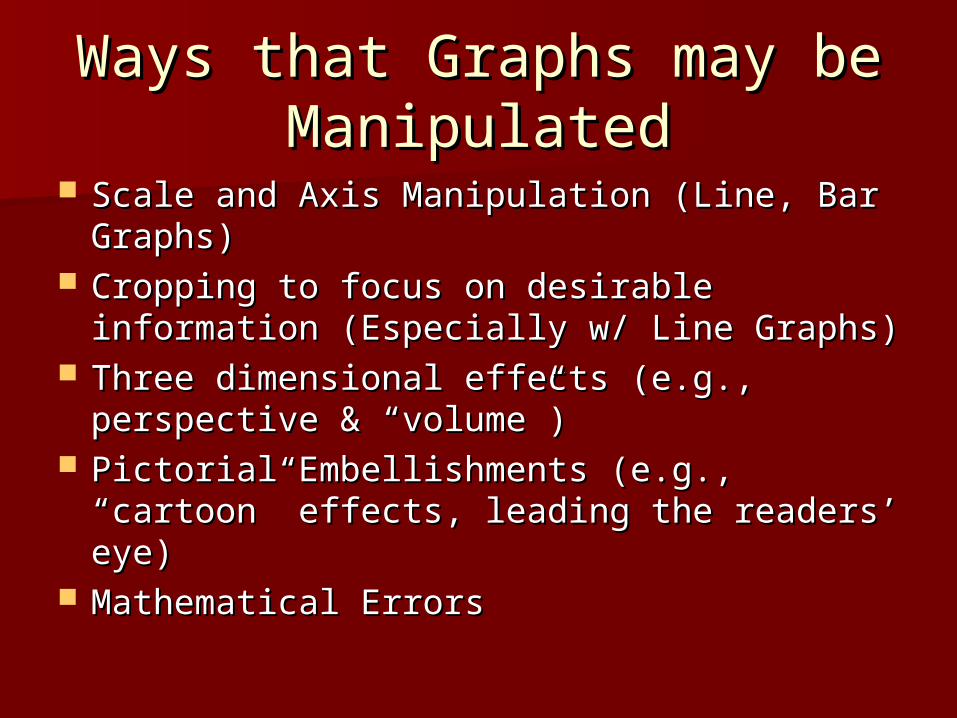
Ways that Graphs may be Ways that Graphs may be ManipulatedManipulated
Scale and Axis Manipulation (Line, Bar Scale and Axis Manipulation (Line, Bar Graphs)Graphs)
Cropping to focus on desirable information Cropping to focus on desirable information (Especially w/ Line Graphs)(Especially w/ Line Graphs)
Three dimensional effects (e.g., Three dimensional effects (e.g., perspective & “volume”)perspective & “volume”)
Pictorial Embellishments (e.g., “cartoon” Pictorial Embellishments (e.g., “cartoon” effects, leading the readers’ eye)effects, leading the readers’ eye)
Mathematical Errors Mathematical Errors
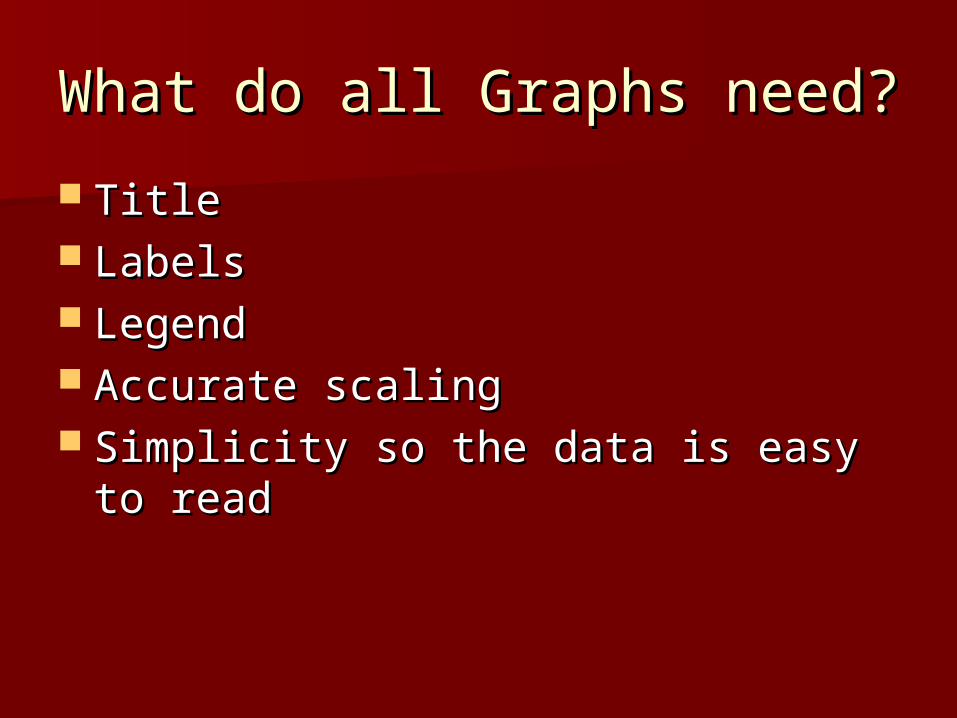
What do all Graphs need?What do all Graphs need?
TitleTitle LabelsLabels LegendLegend Accurate scalingAccurate scaling Simplicity so the data is easy to readSimplicity so the data is easy to read