graphs of equations 2.2 in two variables
TRANSCRIPT
Graphs of Equations in Two Variables 2.2
Equation in Two Variables
An equation in two variables, such as y = x2 + 1, expresses a relationship between two quantities.
Graph of an Equation in Two Variables
A point (x, y) satisfies the equation if it makes the equation true when the values for x and y are substituted into the equation.
For example, the point (3, 10) satisfies the equation y = x2 + 1 because 10 = 32 + 1.
However, the point (1, 3) does not, because 3 ≠ 12 + 1.

The Graph of an Equation
The graph of an equation in x and y is:
The set of all points (x, y) in the coordinate plane that satisfy the equation.

The Graph of an Equation
The graph of an equation is a curve, just a general name, it could be a line, a box, but graphs in a 2D plane are called curves, in 3D, they are called surfaces.
So, to graph an equation, we:
1. Plot as many points as we can. 2. Connect them by a smooth curve.

Sketching a Graph by Plotting Points
Sketch the graph of the equation 2x – y = 3
We first solve the given equation for y to get:
y = 2x – 3

Sketching a Graph by Plotting Points
Use a table, put in the x values and the equation that will be y. Then the ordered pair

Sketching a Graph by Plotting Points
Of course, there are infinitely many points on the graph—and it is impossible to plot all of them.
But, the more points we plot, the better we can imagine what the graph represented by the equation looks like.

Sketching a Graph by Plotting Points
Plot the points that work in the equation As they appear to lie
on a line, we complete the graph by joining the points by a line.

Sketching a Graph by Plotting Points
The graph of this equation is indeed a line.
Sketching a Graph by Plotting Points
Sketch the graph of the equation
y = x2 – 2

Sketching a Graph by Plotting Points
Plug in some x and see what you get for y…In Ch 2.3, you will get your calculator to do this.

Sketching a Graph by Plotting Points
Plot the points and then connect them
A curve with this shape is called a parabola.

E.g. 3—Graphing an Absolute Value Equation
Sketch the graph of the equation
y = |x| Remember from 1.7 y=-x y=x
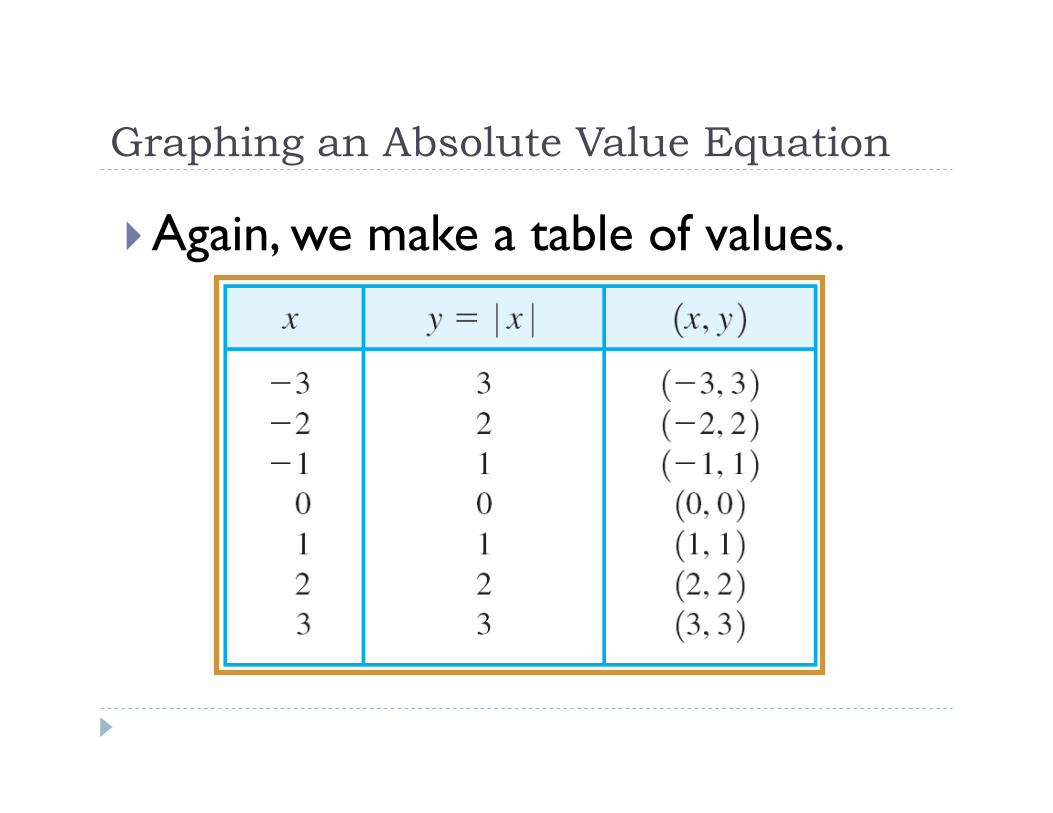
Graphing an Absolute Value Equation
Again, we make a table of values.

Graphing an Absolute Value Equation
Tables are great and they make for flawless graphing….
Intercepts

x-intercepts
Are the x-coordinates where a graph intersects the x-axis, they are called the x-intercepts of the graph.
They are obtained by setting y = 0 in the equation of the graph.

Why? y-intercepts
The y-coordinates of the points where a graph intersects the y-axis are called the y-intercepts of the graph.
They are obtained by setting x = 0 in the equation of the graph.

Finding Intercepts
Find the x- and y-intercepts of the graph of the equation
y = x2 – 2

Finding Intercepts
To find the x-intercepts, we set y = 0 and solve for x.
Thus, 0 = x2 – 2 x2 = 2 (Add 2 to each side)
(Take the sq. root)
The x-intercepts are and .

Finding Intercepts
To find the y-intercepts, we set x = 0 and solve for y.
Thus, y = 02 – 2
y = –2
The y-intercept is –2.

Circles

Circles
So far, we have discussed how to find the graph of an equation in x and y.
The converse problem is to find an equation of a graph—an equation that represents a given curve in the xy-plane.
We can do this easily with circles because they have a very standard equation
Circles
As an example of this type of problem, let’s find the equation of a circle with radius r and center (h, k).

Circles
From the distance formula, we have:
(Square each side)
This is the desired equation.

Equation of a Circle—Standard Form
An equation of the circle with center (h, k) and radius r is:
(x – h)2 + (y – k)2 = r2
This is called the standard form for the equation of the circle.
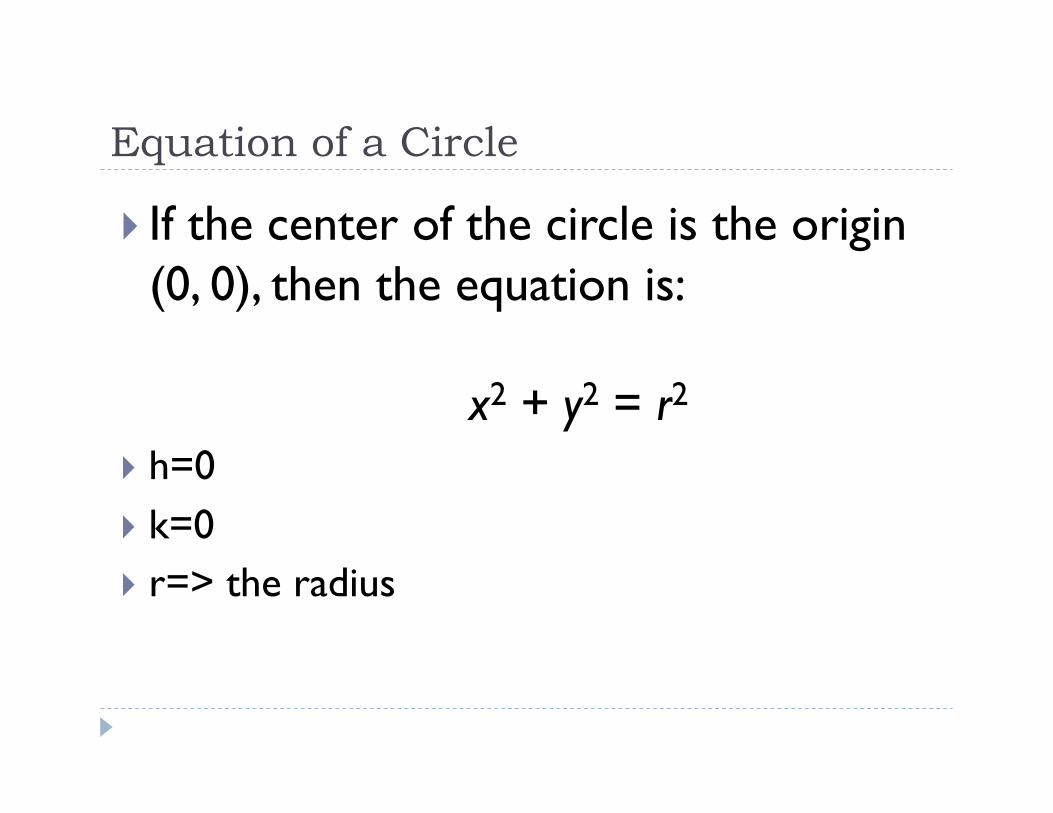
Equation of a Circle
If the center of the circle is the origin (0, 0), then the equation is:
x2 + y2 = r2
h=0 k=0 r=> the radius
Graphing a Circle
Graph each equation. (You know these are circles, because of the standard
form of a circle equation)
(a) x2 + y2 = 25
(b) (x – 2)2 + (y + 1)2 = 25
Graphing a Circle
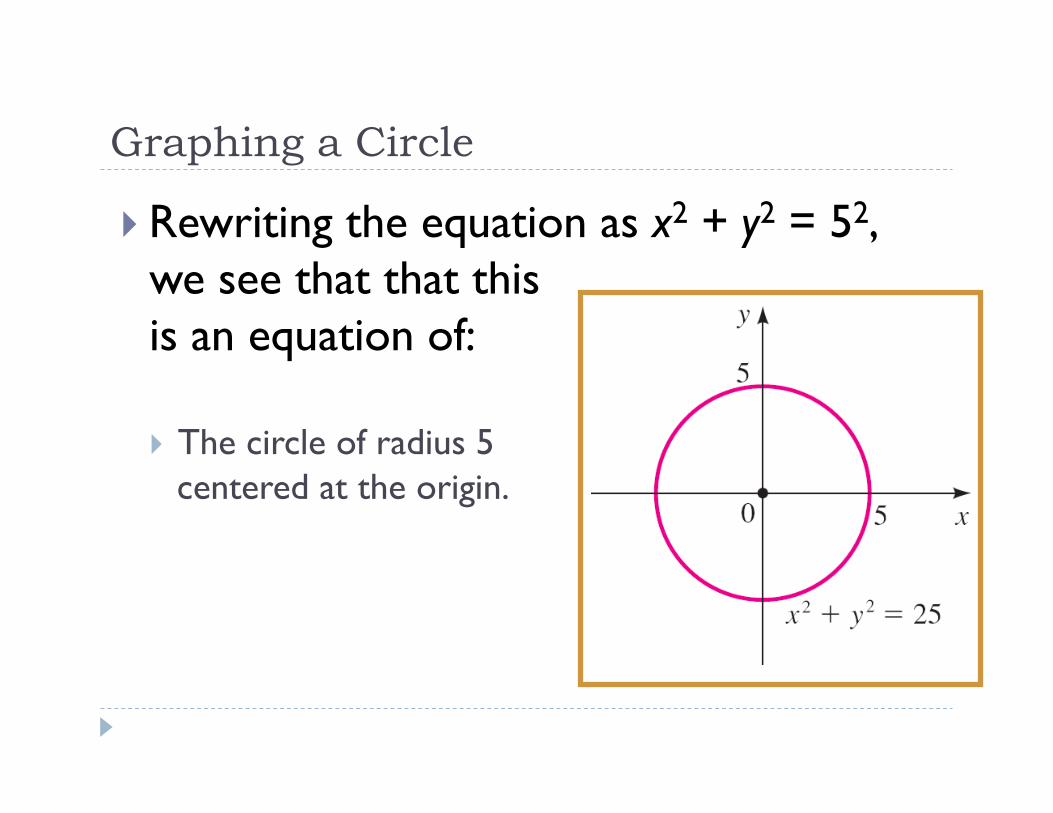
Rewriting the equation as x2 + y2 = 52, we see that that this is an equation of:
The circle of radius 5 centered at the origin.

Graphing a Circle Rewriting the equation as
(x – 2)2 + (y + 1)2 = 52, we see that this is an equation of:
The circle of radius 5 centered at (2, –1).
Equation of a Circle
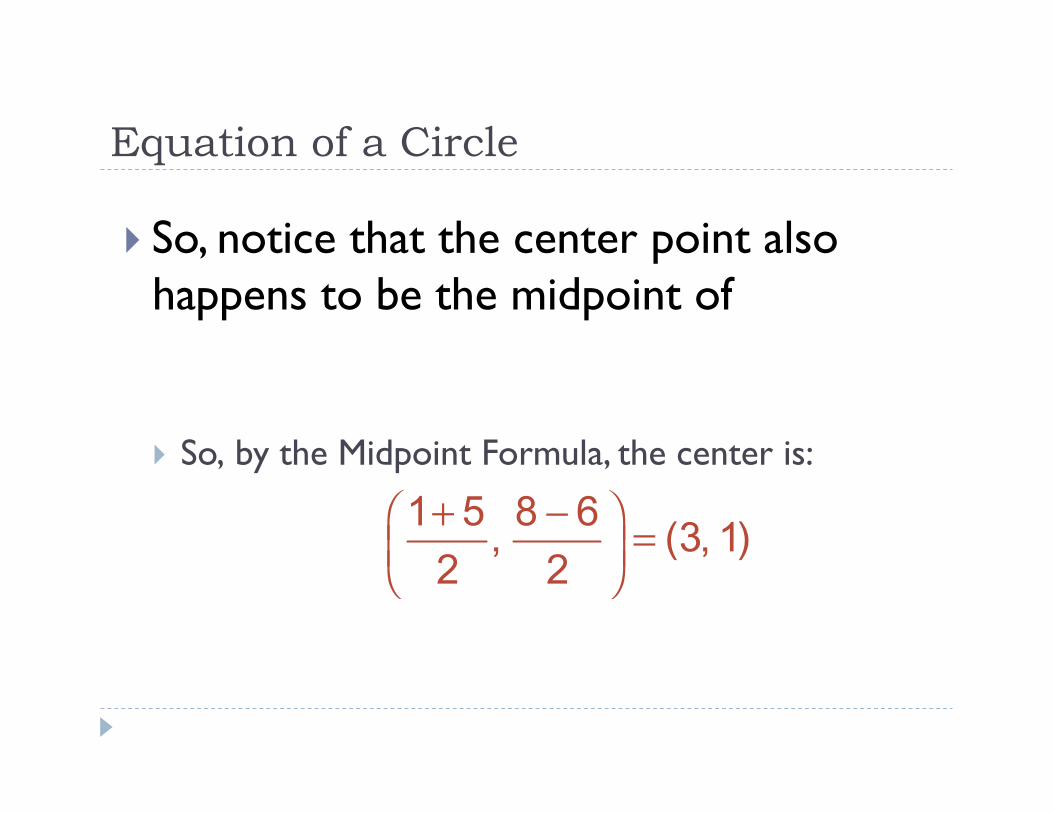
So, notice that the center point also happens to be the midpoint of
So, by the Midpoint Formula, the center is:
Equation of a Circle
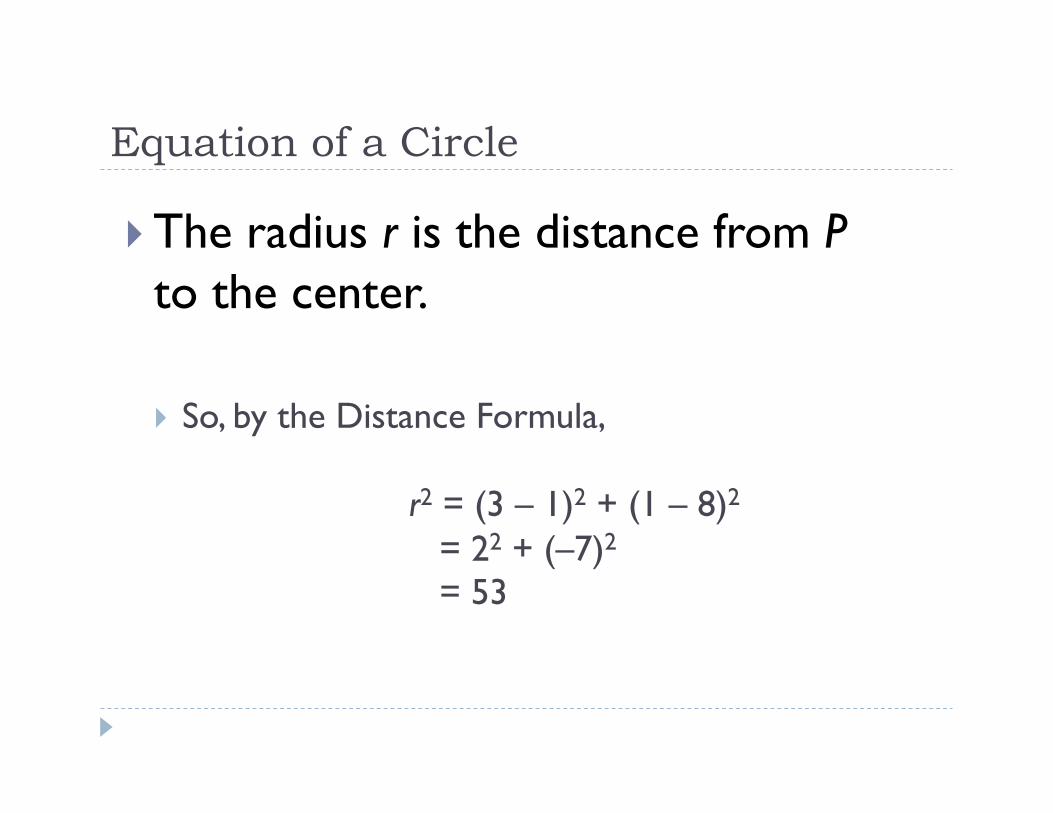
The radius r is the distance from P to the center.
So, by the Distance Formula,
r2 = (3 – 1)2 + (1 – 8)2 = 22 + (–7)2 = 53

Equation of a Circle
Hence, the equation of the circle is:
(x – 3)2 + (y – 1)2 = 53

Equation of a Circle Let’s expand the equation of the circle
in the preceding example.
(x – 3)2 + (y – 1)2 = 53 (Standard form)
x2 – 6x + 9 + y2 – 2y + 1 = 53 (Expand the squares)
x2 – 6x +y2 – 2y = 43 (Subtract 10 to get the expanded form)

Equation of a Circle
Notice that you can then “complete the square” to get the equation of the circle back To do that, we need to know what to add to
an expression like x2 – 6x to make it a perfect square. That is, we need to complete the square—as in
the next example.
E.g. 7—Identifying an Equation of a Circle
Show that the equation
x2 + y2 + 2x – 6y + 7 = 0
represents a circle.
Find the center and radius of the circle.
Identifying an Equation of a Circle First, notice you should have x2 and y2 (big indicators) Second, group the x-terms and y-terms.
Then, we complete the square within each grouping.
We complete the square for x2 + 2x by adding (½ · 2)2 = 1.
We complete the square for y2 – 6y by adding [½ · (–6)]2 = 9.

Identifying an Equation of a Circle

Symmetry – an attribute of a shape or relation (function), exact reflection of form on an opposite sides of a dividing line such as axis.
Symmetry
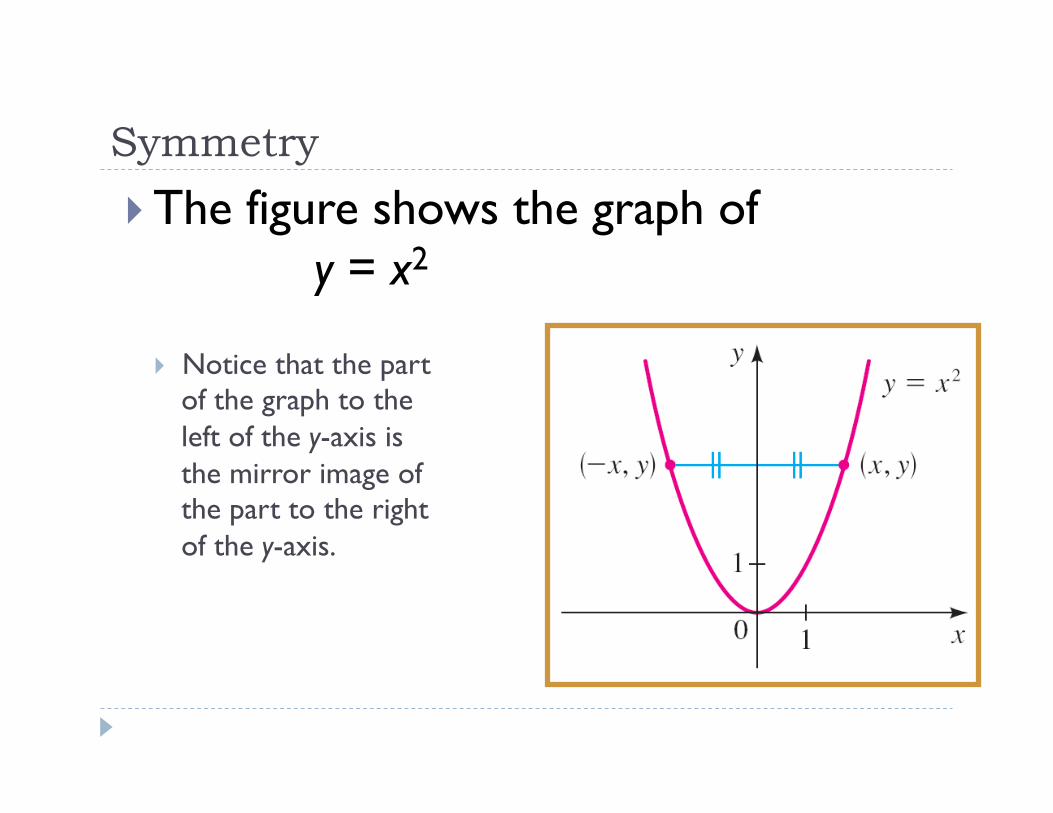
The figure shows the graph of y = x2
Notice that the part of the graph to the left of the y-axis is the mirror image of the part to the right of the y-axis.
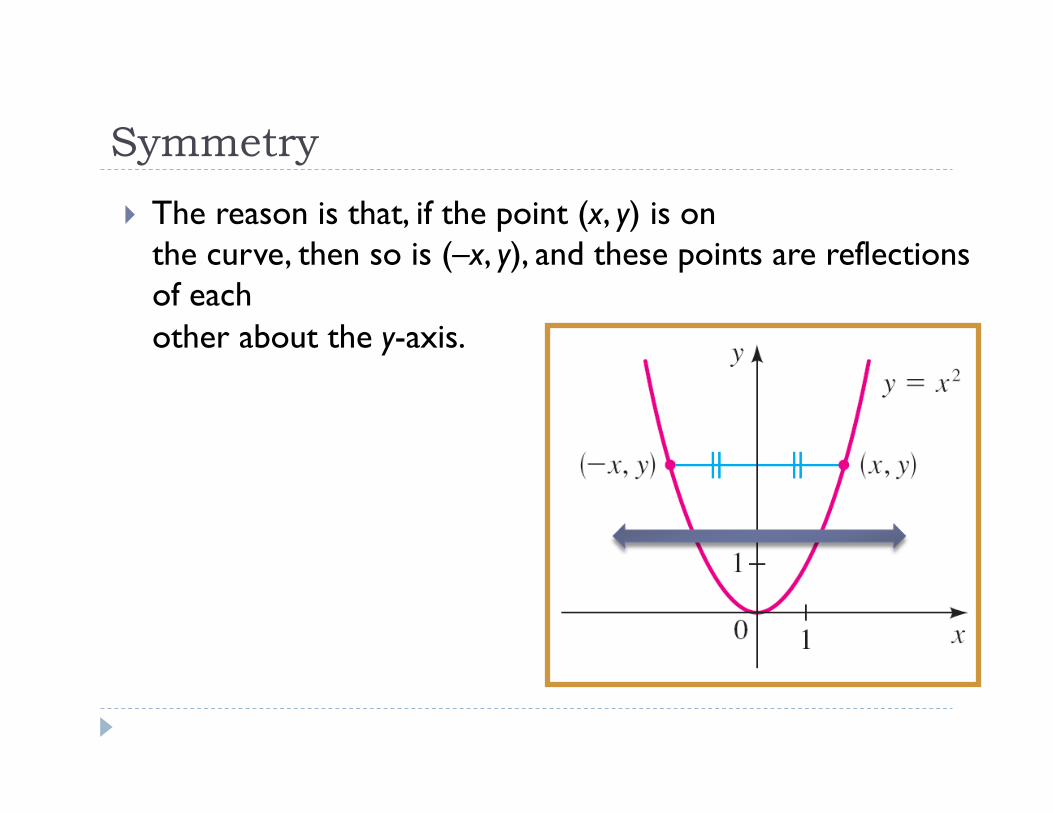
Symmetry
The reason is that, if the point (x, y) is on the curve, then so is (–x, y), and these points are reflections of each other about the y-axis.

Symmetric with Respect to y-axis
In this situation, we say the graph is symmetric with respect to the y-axis.

Symmetric with Respect to x-axis
Similarly, we say a graph is symmetric with respect to the x-axis if, whenever the point (x, y) is on the graph, then so is (x, –y).

Symmetric with Respect to Origin A graph is symmetric with respect to
the origin if, whenever (x, y) is on the graph, so is (–x, –y).

Using Symmetry to Sketch a Graph
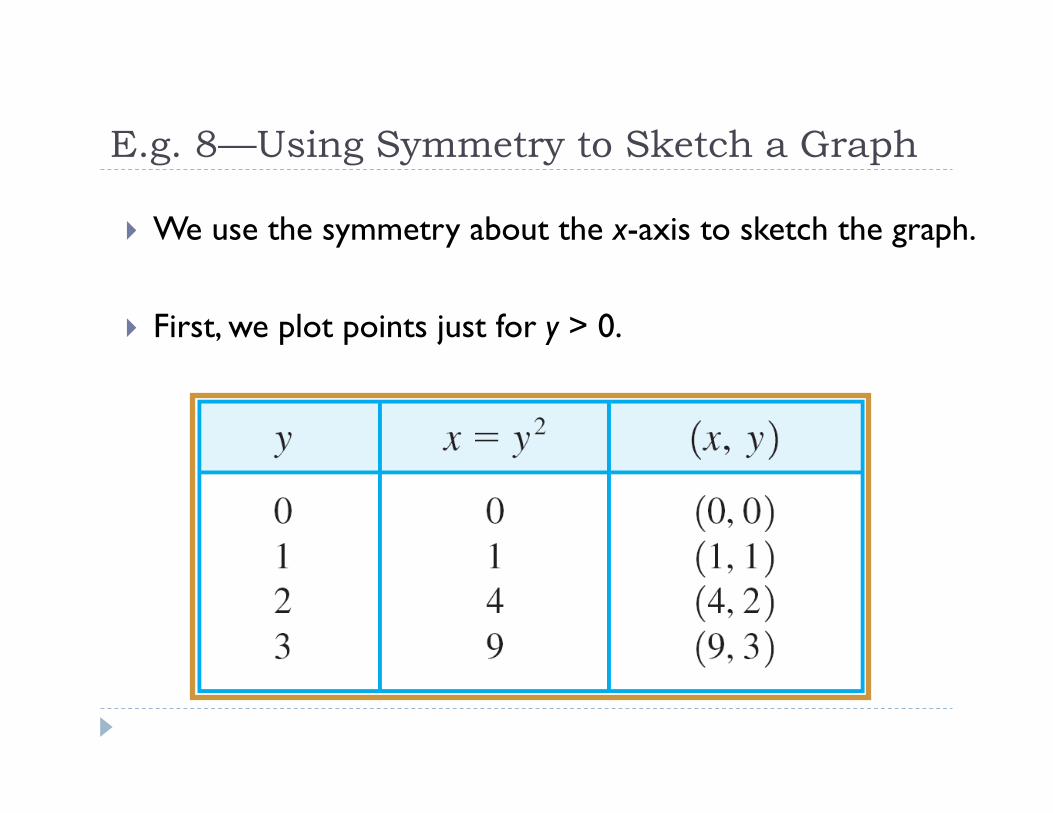
Test the equation x = y2 for symmetry and sketch the graph.
• If y is replaced by –y in the equation x = y2, we get: • x = (–y)2 (Replace y by –y)
• x = y2 (Simplify)
So, the equation is unchanged. Thus, the graph is symmetric about the x-axis.

E.g. 8—Using Symmetry to Sketch a Graph
However, changing x to –x gives the equation
–x = y2
This is not the same as the original equation. So, the graph is not symmetric about the y-axis.
E.g. 8—Using Symmetry to Sketch a Graph
We use the symmetry about the x-axis to sketch the graph.
First, we plot points just for y > 0.

E.g. 8—Using Symmetry to Sketch a Graph
Then, we reflect the graph in the x-axis.

Testing an Equation for Symmetry
If we replace x by –x and y by –y, we get: –y = (–x3) – 9(–x) –y = –x3 + 9x (Simplify) y = x3 – 9x (Multiply by –1)
So, the equation is unchanged. This means that the graph is symmetric
with respect to the origin.