graphs of functions (part 2) 2.5 graphing calculator day
TRANSCRIPT

Graphs of Functions Graphs of Functions (Part 2) 2.5(Part 2) 2.5
Graphs of Functions Graphs of Functions (Part 2) 2.5(Part 2) 2.5
Graphing calculator dayGraphing calculator day

PODGive the new form of y = f(x) under
the following transformation:
vertical shift down 2horizontal shift right 3horizontal compression by 4

PODGive the new form of y = f(x) under
the following transformation:
vertical shift down 2horizontal shift right 3horizontal compression by 4
234 xfy

Piecewise functions– another go
Graph this function on your calculator. The trick to getting a sound graph is to make sure x is the first term in the typed interval.
2
52
)( 2x
x
xf
1
1
1
x
x
x

Piecewise functions– another go, on the 84
2
52
)( 2x
x
xf
1
1
1
x
x
x

Piecewise functions– another go, on CAS

Piecewise functions– another go
What are the domain and range?
Where are the points of discontinuity?
How could we change the function so that it is continuous?

The greatest integer function
Suppose you have a job making widgets. Okay, not widgets– think of something else.
You’re paid for each completed item, so if you make 25 ½ of them, only 25 are credited. This rounding down to the nearest integer is called the “rounding down” or greatest integer function.
You have it on the parent function sheet.

The greatest integer function
Each value of x is rounded down to the next integer. This is also called the floor function. The notation looks like
What does the graph look like? See how this could be labeled a “step function?”
xxf )(

The greatest integer function
Graph on the 84’s or on CAS. The trick is to keep track of which
endpoints are open and closed.What are the domain and range?Where is the function discontinuous?
The greatest integer function
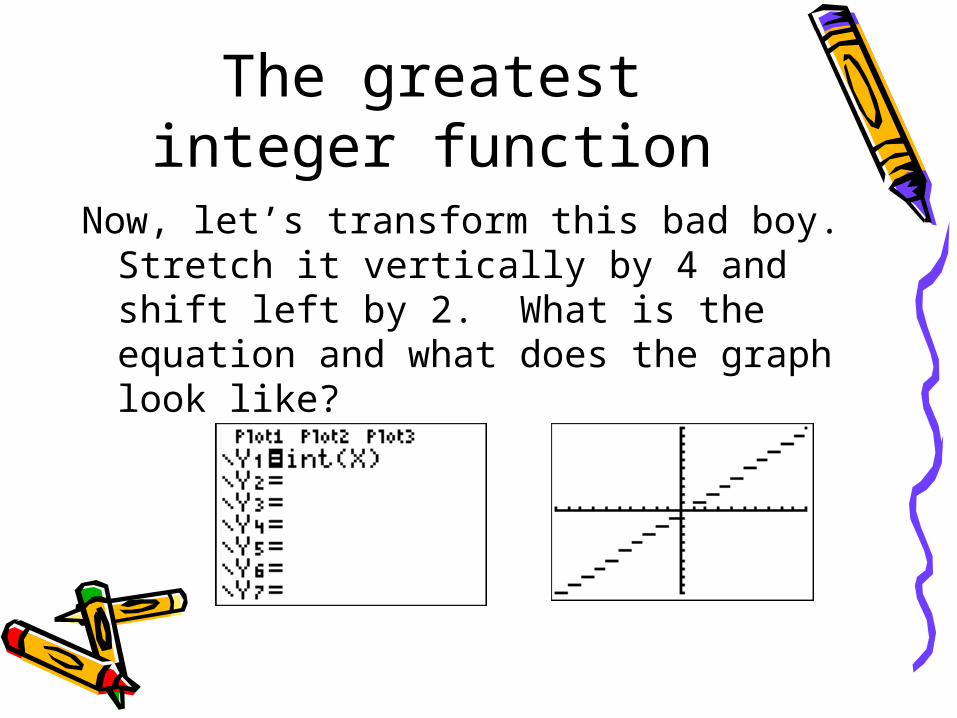
Now, let’s transform this bad boy. Stretch it vertically by 4 and shift left by 2. What is the equation and what does the graph look like?

The greatest integer function
Now, let’s transform this bad boy. Stretch is vertically by 4 and shift left by 2.
What are the domain and range?Where is it discontinuous?

The ceiling functionIn addition to the floor function, there is
something called the ceiling function.In this function, each value of x is
rounded up to the next integer. The notation looks like
What does the graph look like?
xxf )(

The ceiling functionThe ceiling graph looks like it’s simply
shifted up by 1 from the floor graph. But something else is going on– what is it?
Absolute valueMoving beyond the simple…Before graphing this, see if you can
anticipate what it looks like.y = |x2 - 4|

Absolute valuey = |x2 - 4|
Compare this to y = x2 – 4. What do you think changes?

Absolute valuey = |x2 - 4|
Compare this to y = x2 – 4. What do you think changes? The values for y will not be negative– they reflect back over the x axis.

Absolute valueSometimes solving an equation
algebraically is just too tough– use the graph as another tool. Solve this by graphing each side separately.
1158.072.1314.0 2 xx

Absolute valueThen what?
1158.072.1314.0 2 xx

Absolute valueThen what? Calculate intersections.
At x = ±15.52 and ±2.80
1158.072.1314.0 2 xx

Absolute valueFinal answer: (-∞, -15.52)U(-2.80, 2.80)U(15.52,
∞)1158.072.1314.0 2 xx