grcc data team
DESCRIPTION
GRCC Data Team. August 25, 2010 September 10, 2010. Purpose of the Data Team. To review student outcomes to determine those areas where the greatest achievement gaps exist Role of the data team is NOT to determine what strategies we should consider to address achievement gaps - PowerPoint PPT PresentationTRANSCRIPT

GRCC Data Team
August 25, 2010September 10, 2010

Purpose of the Data Team
To review student outcomes to determine those areas where the greatest achievement gaps exist
Role of the data team is NOT to determine what strategies we should consider to address achievement gaps That will come later…….

GRCC Data Team to study……
…the number of students who. . .
Complete developmental courses
Succeed in the gatekeeper courses
Complete courses with a grade of “C” or better
Re-enroll from one semester to the next
Complete--earn certificates and degrees
Relationship to Other Campus Teams/Work Strategic Planning (Strategic
Leadership Team)
Achieving the Dream
AQIP
College Action Projects
Department Action Projects
AGC/Deans Council
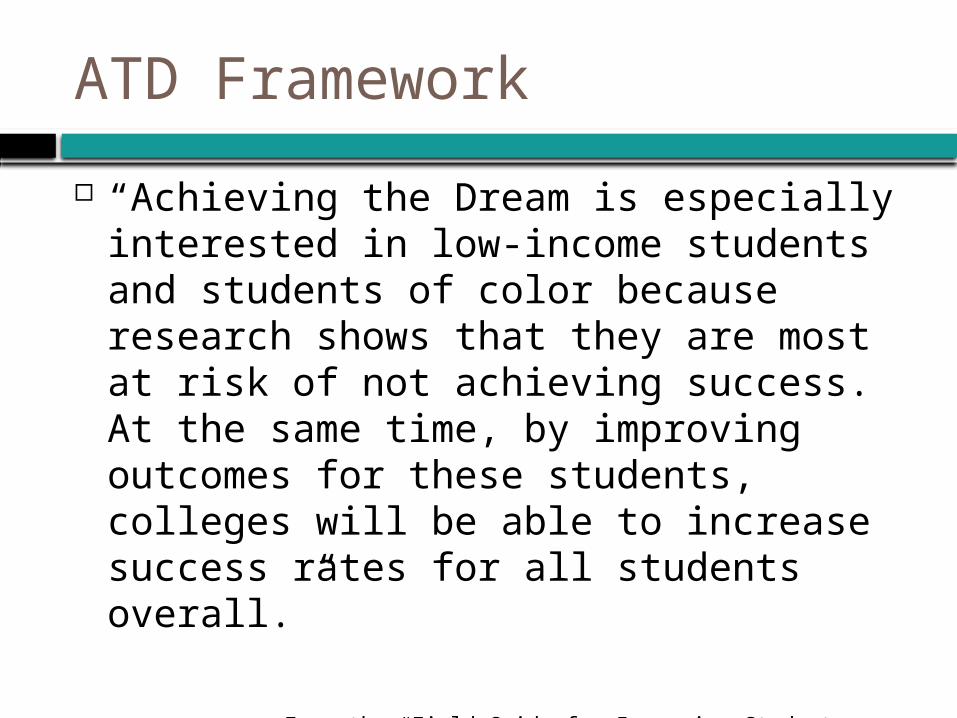
ATD Framework
“Achieving the Dream is especially interested in low-income students and students of color because research shows that they are most at risk of not achieving success. At the same time, by improving outcomes for these students, colleges will be able to increase success rates for all students overall.”
From the “Field Guide for Improving Student Success, 2009”
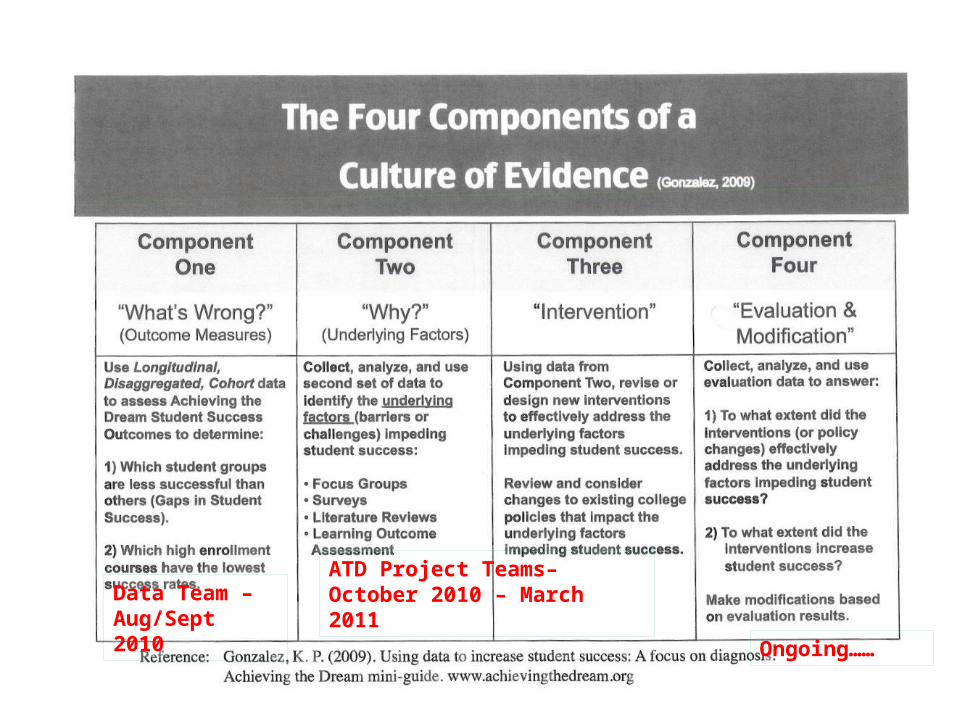
Data Team – Aug/Sept 2010
ATD Project Teams– October 2010 – March 2011
Ongoing……

Data for two audiences. . .
Simple, repetitive data that we all wish EVERYONE AT THE COLLEGE KNEW ALL OF THE TIME:
graduation rate? Ethnic makeup of
student population?
Percentage of students needing dev ed?
DETAILED DATA FOR THE DATA TEAM:
Retention data by segment groups
Graduation rate data by segment groups
Course level data by segment groups

Ten Things Everyone at GRCC Should Know If we want all students who attend GRCC
to be successful and accomplish their goals, it’s important that we know the “basics” about our students and how well they are currently doing. By joining together to create a culture of evidence, we can diagnose problem areas and create strategies to improve student results.
Source: Institutional Research and Planning

Demographic Data/Outcome Data Credit student headcount Total number of unique students served in a
calendar year Ethnic makeup of student population Gender makeup of student population Age breakdown of students Percent of students receiving financial aid Fall to fall retention rate Graduation rate Percent of students needing developmental
education (AFP) Course success rate
Source: Institutional Research and Planning

1. Credit Student Headcount
1999 2000 2110 2002 2003 2004 2005 2006 2007 2008 200910000
11000
12000
13000
14000
15000
16000
17000
18000
12602
1345113479139231411114206
14820152721524715430
16992
Fall Enrollment
Source: Institutional Research and Planning
35% increase over 10 years

2. Total Number of Students Served Per Year
1999-00
2000-01
2001-02
2002-03
2003-04
2004-05
2005-06
2006-07
2007-08
2008-09
20000
22000
24000
26000
28000
30000
32000
2376324720
23491 23486
25282
23853
26226 26032
28017
29430
Credit and Non-CreditUnduplicated
Source: Institutional Research and Planning
23% increase over 10 years
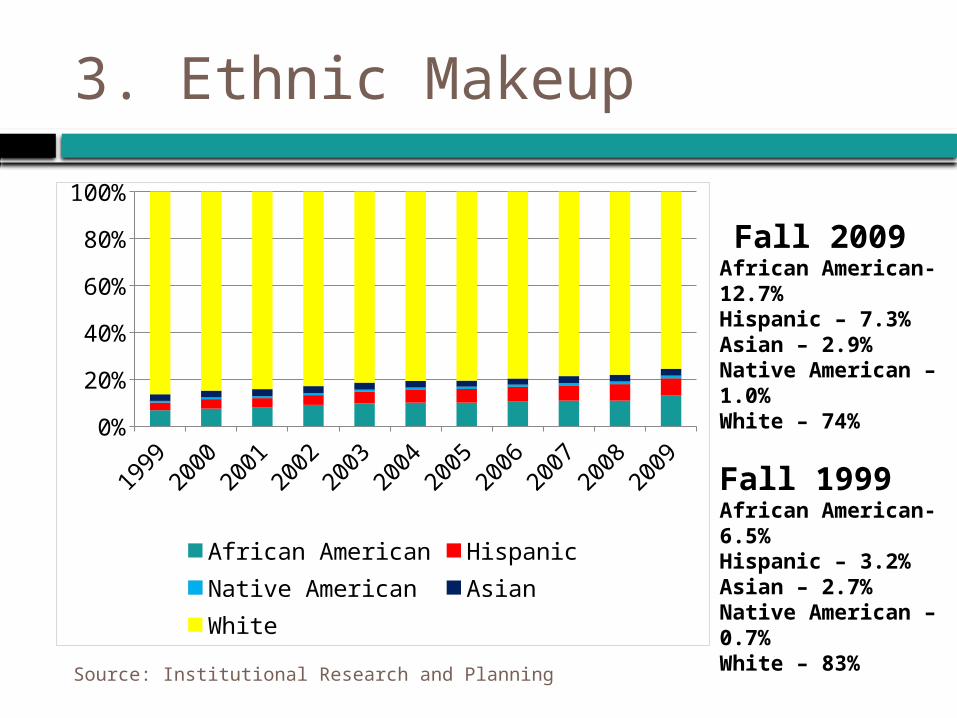
3. Ethnic Makeup
1999
2000
2001
2002
2003
2004
2005
2006
2007
2008
2009
0%
20%
40%
60%
80%
100%
African American HispanicNative American AsianWhite
Fall 2009African American- 12.7%Hispanic – 7.3%Asian – 2.9%Native American – 1.0%White – 74%
Fall 1999African American- 6.5%Hispanic – 3.2%Asian – 2.7%Native American – 0.7%White – 83%Source: Institutional Research and Planning

4. Gender Makeup
0%
10%
20%
30%
40%
50%
60%
70%
80%
90%
100%
Male Female
Source: Institutional Research and Planning
Fall 2009Male – 48%Female – 52%
Fall 1999Male – 52%Female – 48%

5. Age Breakdown
1999
2000
2001
2002
2003
2004
2005
2006
2007
2008
2009
0
10
20
30
40 4136 34
31 31 30 29 30 30 3134
% of Students Age 25 or Older
Year Average Age
2002 24.9
2003 24.9
2004 24.7
2005 24.7
2006 24.8
2007 24.8
2008 24.9
2009 25.3
Source: Institutional Research and Planning

6. Percent of Students Receiving Needs-Based Financial Aid
2000
2001
2002
2003
2004
2005
2006
2007
2008
2009
0%10%20%30%40%50%60%70%80%90%
100%
No Financial AidFinancial Aid Recipients
Number (%) of Financial Aid Recipients in Fall 2009:
7636 (45%)
Number (%) of Financial Aid Recipients in Fall 2000:
2290 (17%)
Source: Institutional Research and Planning

7. Fall to Fall Retention Rate
2001
2002
2003
2004
2005
2006
2007
2008
0
10
20
30
40
50
60
70
80
60.3 6064.6 64.5
61.4 61.6 62.659
43.6 41.7 38.8
48.444.7 43.4 43.8 44.6
64.1 63.5 63.7 63.3 63.1 63.6 6467.2
35.9 36.1 39 38.2 38 36.9 37.1 37.1
Full time - GRCCPart time - GRCCFull time - CSRDE BenchmarkPart time - CSRDE Benchmark
Source: Institutional Research and Planning
Very large Institutions

8. Graduation Rate - 3 Year (Degree/Certificate Seeking Students Only)
2001 2002 2003 2004 2005 20060
2
4
6
8
10
12
14
16
1816.7
15.716.9
15.514.4
15.1
2.7
4.63.2 3.4
2.5
4.3
12.311.6 11.7 11.1 11 10.6
2.7 2.4 2.9 2.8 2.7 2.6
Full time - GRCCPart time - GRCCFull time - CSRDE BenchmarkPart time - CSRDE Benchmark
Cohort Year (Year Student Began at GRCC)
Source: Institutional Research and Planning
Very large Institutions

9. Number of Developmental Education Placements
Fall 2007 Fall 2008 Fall 20090%
10%20%30%40%50%60%70%80%90%
100%
1063 13102449
Placed into Developmental EducationAcademically Prepared
25% 31%51%
NOTE: In Fall 2009 placement testing was required for any student with an ACT component score of 17 or lower. Previously, the threshold was an ACT composite score of 15 or lower.
Source: Institutional Research and Planning

10. Course Success Rate
Winter 06
Fall 06 Winter 07
Fall 07 Winter 08
Fall 08 Winter 09
Fall 09 Winter 10
50
55
60
65
70
75
80
67 67 67 6866
7068
7169
Percent of grades “C or better”
Source: Institutional Research and Planning
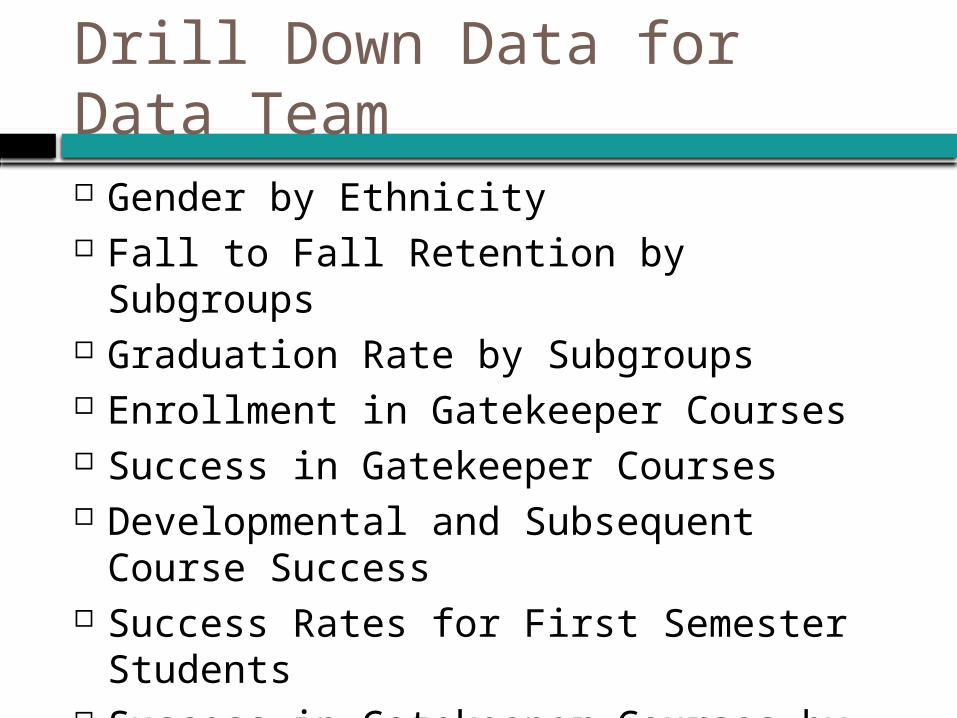
Drill Down Data for Data Team Gender by Ethnicity Fall to Fall Retention by Subgroups Graduation Rate by Subgroups Enrollment in Gatekeeper Courses Success in Gatekeeper Courses Developmental and Subsequent Course
Success Success Rates for First Semester
Students Success in Gatekeeper Courses by
Subgroups Success in Developmental Courses by
Subgroups

Segment Groups
Race/Ethnicity (White, Black, Hispanic, Asian, Native American, Non-resident Alien, No Response)
Age (Less than 20, 20-24, 25+) Gender (F, M) Pell (Yes, No)
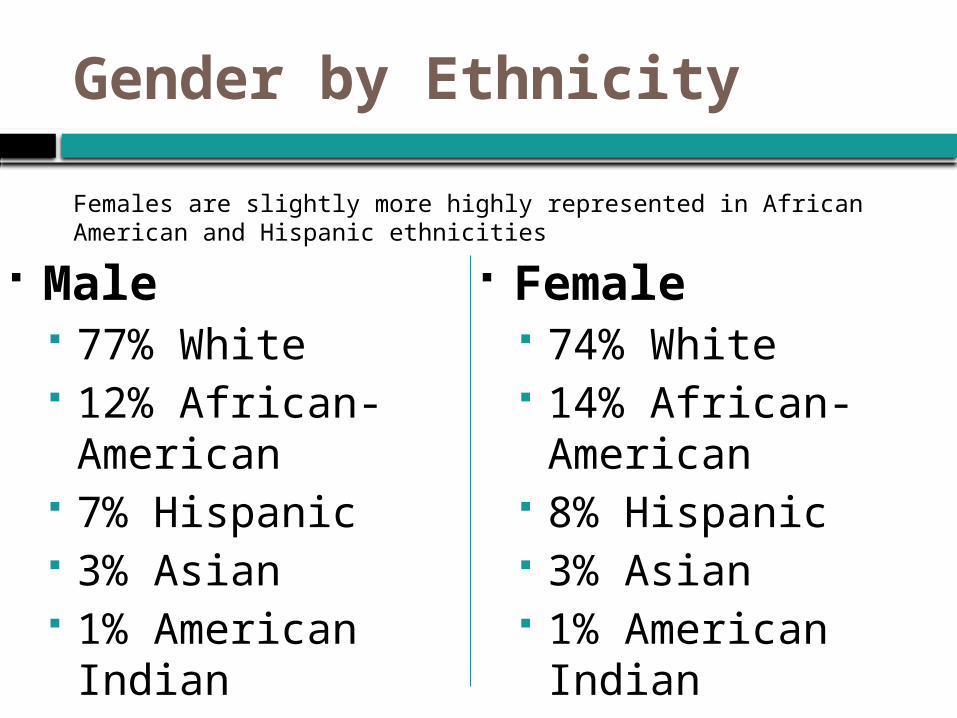
Gender by Ethnicity
Male 77% White 12% African-
American 7% Hispanic 3% Asian 1% American Indian
Female 74% White 14% African-
American 8% Hispanic 3% Asian 1% American
Indian
Females are slightly more highly represented in African American and Hispanic ethnicities
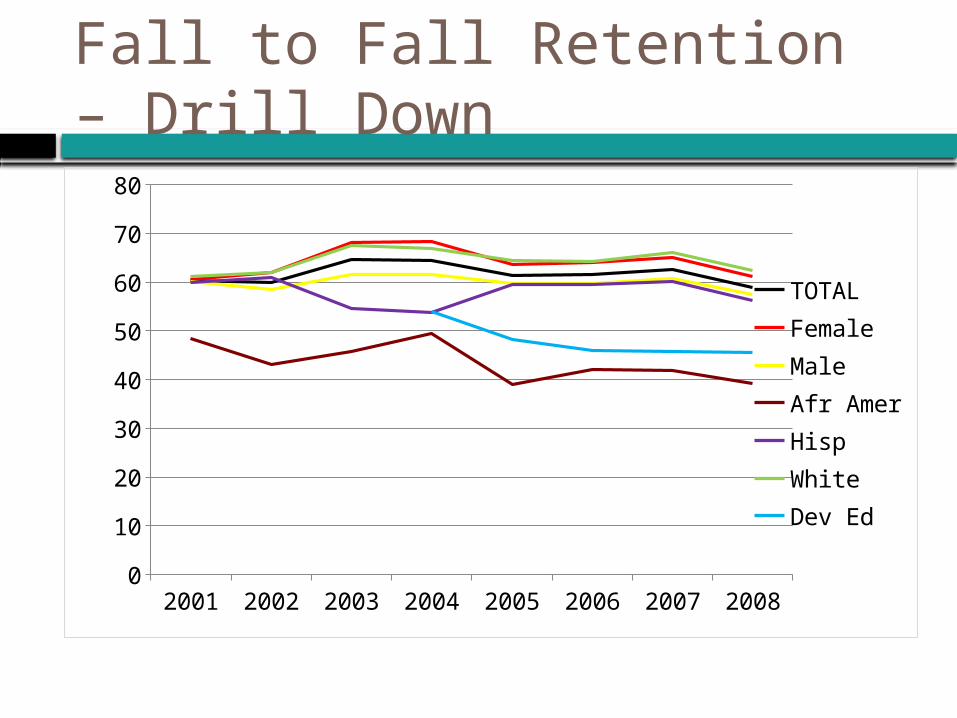
Fall to Fall Retention – Drill Down
2001 2002 2003 2004 2005 2006 2007 20080
10
20
30
40
50
60
70
80
TOTALFemaleMaleAfr AmerHispWhiteDev Ed
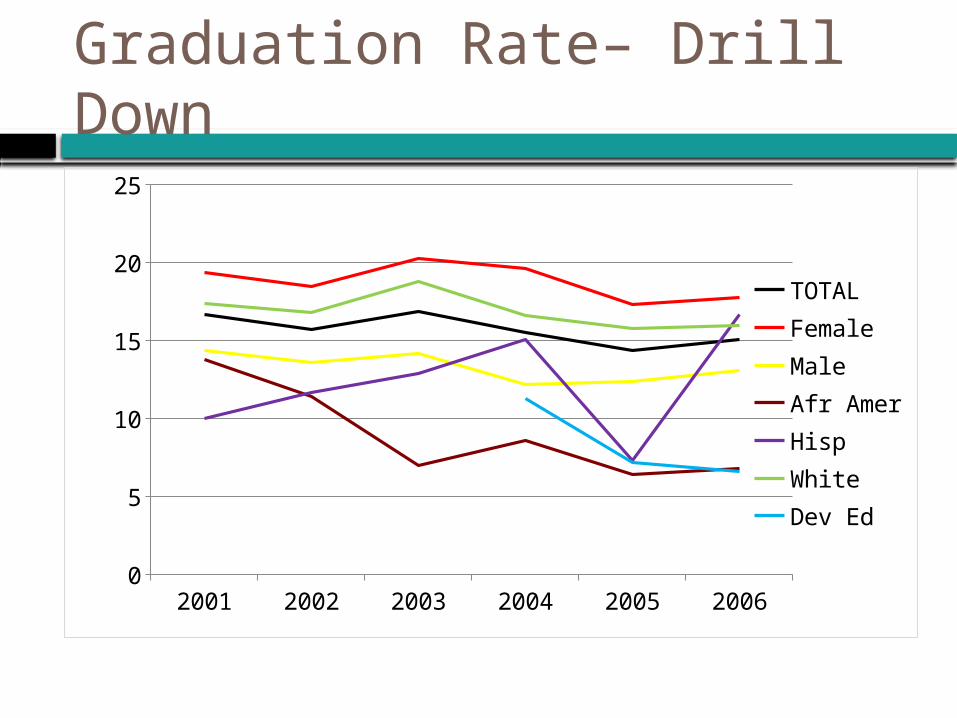
Graduation Rate– Drill Down
2001 2002 2003 2004 2005 20060
5
10
15
20
25
TOTALFemaleMaleAfr AmerHispWhiteDev Ed

Enrollment in Gatekeeper Courses Gatekeeper courses
are those courses that have the highest enrollments.
Success is measured as the % of students who earn A, B, or C in the course
Failure is measured as the % of students who earn a D, F, I, NS, WP or WF in the course
Fall 2009 Data
Course EnrollmentEN 101 2,675PS 110 2,214PY 201 1,576MA 107 1,480MA 104 1,263EN 102 1,181BI 101 878COM 135 815CO 101 771COM 131 670CLS 100 619EN 100 569WE 156 559CJ 110 559SP 101 559

Success in Gatekeeper Courses Gatekeeper
courses are those courses that have the highest enrollments.
Success is measured as the % of students who earn A, B, or C in the course
Failure is measured as the % of students who earn a D, F, I, NS, WP or WF in the course
Fall 2009 Data
Course Enrollment “Success” MA 104 1,263 61% EN 100 569 62% CO 101 771 63% MA 107 1,480 65% SP 101 559 68% EN 101 2,675 71% CJ 110 559 72% PS 110 2,214 75% EN 102 1,181 75% BI 101 878 76% PY 201 1,576 77%
CLS 100 619 77% COM 131 670 78% COM 135 815 80% WE 156 559 88%
26

GRCC Top 15 Courses by Enrollment--Fall 2009
Course Enrollment As Bs Cs Ds Fs I,NS,WsTotal D, F, I, N, S, Ws
MA 104 1,263 16% 24% 21% 11% 10% 18% 39%
EN 100 569 21% 22% 19% 7% 14% 16% 38%
CO 101 771 37% 17% 10% 5% 4% 28% 37%
MA 107 1,480 24% 21% 20% 8% 9% 18% 35%
SP 101 559 27% 22% 19% 4% 10% 18% 32%
EN 101 2,675 23% 30% 19% 6% 10% 13% 29%
CJ 110 559 25% 27% 21% 9% 13% 6% 28%
EN 102 1,181 31% 31% 13% 5% 5% 15% 25%
PS 110 2,214 26% 28% 21% 7% 7% 11% 25%
BI 101 878 16% 33% 27% 9% 6% 9% 24%
CLS 100 619 40% 23% 14% 5% 9% 9% 23%
PY 201 1,576 31% 26% 20% 6% 7% 10% 23%
COM 131 670 36% 30% 12% 4% 5% 13% 22%
COM 135 815 40% 31% 10% 5% 7% 8% 20%
WE 156 559 71% 16% 1% 0% 1% 11% 12%
All 53,044 34% 25% 14% 5% 7% 14%

Developmental and Subsequent Course Success Rates
From Title 3 Application (Aug 2010) , Fall 2008 Data
Success Rates: Developmental Courses Enrollment Grades A-C
EN 097 Academic Foundations English 662 58%
MA 003 Mathematics for College Students 633 47%
RD 097 Introduction to College Reading 244 60%Success Rates: Subsequent Gateway Courses EN 100 College Writing, 101 English Composition or BA 101 Business and Technical English
388 61%
MA 104 Elementary Algebra 304 54%
PS 110 Survey of American Government 139 43%
28

Success Rates for First Semester Students
Fall 2005
Fall 2006
Fall 2007
Fall 2008
Fall 2009
05
101520253035404550
3227
30 30
3841 42 42 42
45
AFP FTIAC Non-AFP FTIAC
29
Percent of students who earned all A-Cs during their first semester
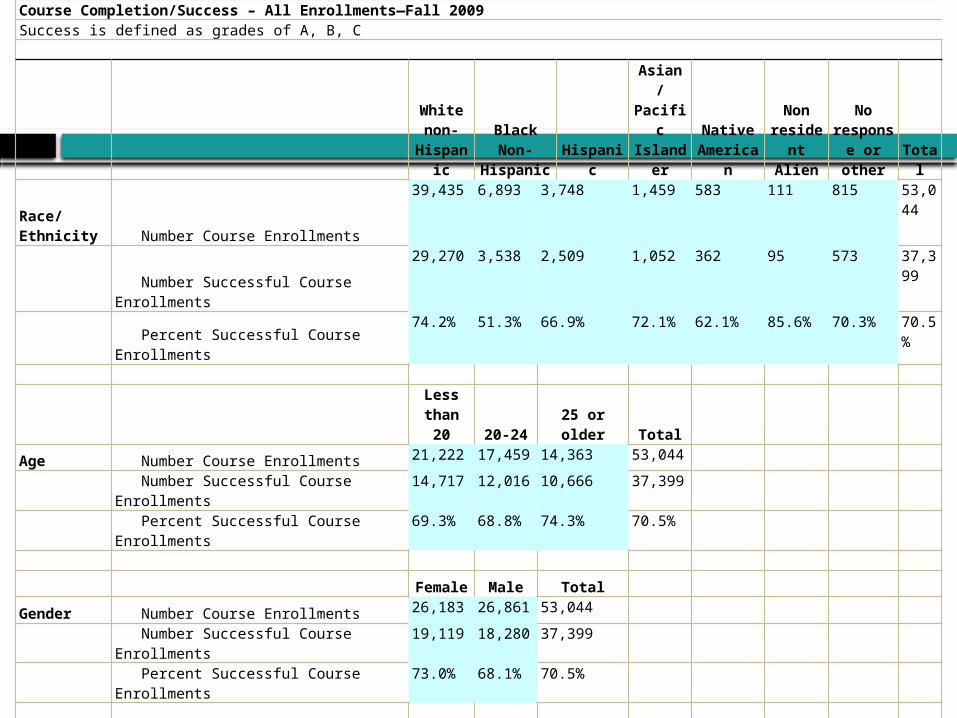
Course Completion/Success – All Enrollments—Fall 2009Success is defined as grades of A, B, C
White non-
Hispanic
Black Non-
Hispanic Hispanic
Asian / Pacific
Islander
Native America
n
Non resident
Alien
No respons
e or other Total
Race/Ethnicity Number Course Enrollments
39,435 6,893 3,748 1,459 583 111 815 53,044
Number Successful Course Enrollments
29,270 3,538 2,509 1,052 362 95 573 37,399
Percent Successful Course Enrollments
74.2% 51.3% 66.9% 72.1% 62.1% 85.6% 70.3% 70.5%
Less
than 20 20-24 25 or older Total
Age Number Course Enrollments21,222 17,459 14,363 53,044
Number Successful Course Enrollments14,717 12,016 10,666 37,399
Percent Successful Course Enrollments69.3% 68.8% 74.3% 70.5%
Female Male Total
Gender Number Course Enrollments26,183 26,861 53,044
Number Successful Course Enrollments19,119 18,280 37,399
Percent Successful Course Enrollments73.0% 68.1% 70.5%
Yes No Total
Pell Number Course Enrollments23,012 30,032 53,044
Number Successful Course Enrollments15,041 22,358 37,399
Percent Successful Course Enrollments65.4% 74.4% 70.5%