great salt lake integrated water resources management ... · great salt lake integrated water...
TRANSCRIPT

Great Salt Lake Integrated Water Resources Management Model (GSLIM)
Krishna Khatri, PhD Engineer, Hydrology and Modeling Section
Utah Division of Water Resources
[Great Salt Lake Advisory Council Meeting]March 13, 2019
Current Status and Future Work

The model evaluation processes: three phases (Aug 2017 to Jan 2019)

FIRST PHASE:
• Report received • Aug 11, 2017: The model and report from Jacobs
• Comments on the report and model• Sep 1, 2017: DWRe shared the comments to FFSL (Utah Division of
Forestry, Fire & State Lands through Laura Vernon)
• Comments discussed with Jacbos• Sept 5, 2017: Model comments were updated to the Jacob’s team
skype call

SECOND PHASE:
• Updated model and report• Jan 19, 2018: Updated model
and report from Jacobs
• Internal meetings and updates • Mar 28, 2018
• Model errors and calibration issues were informed to DFFSL (Laura Vernon)
• FFSL was requested to share the model and evaluate the model with other agencies and the tech. committee memebers

THIRD PHASE:
Joint evaluations with Jacobs (Six Skype Meetings):
• Started on Jul 10, 2018
1) First Skype meeting: Sept 19, 2018
2) Second Skype meeting: Sep 26, 2018
• The updated Calibrated Model on Oct 1, 2018
3) Third skype meeting: Oct 17, 2018
4) Fourth skype meeting: Nov 2, 2018
5) Fifth Skype meeting: Dec 4, 2018
• The extended (Dynamic) Module on Dec 17, 2018
6) Final Skype meeting: Jan 23, 2019
• Discussed on the next steps

Acknowledgements:
JACOBS Team:
• Jeff DenBleyker P.E. – Salt Lake City, Office
• Armin Munevar P.E. – San Diego, California Office
• Paula Silva P.E. – San Diego, California Office
• Kensey Daly – San Diego, California Office
Outline:
• Model features• Model simulation results• Model performances and future work

Outline:
• Model features • Model simulation results• Model performances and future work

GSLIM• How do changes in GSL
and its watersheds impact the lake’s water levels and salinity?
• Modeled on the GoldSimSoftware Platform

Three modules
• River Basin (Integrated) Module
• Wetland and Lake (Dynamic) Module
• Lake (USGS Lake) Module

(1)River Basin Module: Basins, Subareas, & 12 km size grids
6 7 8 9 1 2 3 5411
79 80 81 82
73 74 75 76 77 78 70 71 72
64 65 66 67 68 69 61 62 63
55 56 57 58 59 60 52 53 54
46 47 48 49 50 51 44 45
37 38 39 40 41 42 43 35 36
28 29 30 31 32 33 34 25 26 27
18 19 20 21 22 23 24 13 14 15 1716
10 12
94 95 96 97 9998
90 91 92 93 87 88 89
84 85 86
83
111
211
117 118 119 116110 115114112 113
299 300 301 302 303 304 305 298292 293 297296294 295
286 287 288 289 290 291 285279 284280 281 283282
273 274 275 276 277 278 272266 267 271270268 269
259 260 261 262 263 264 265 253 254 258257255 256
246 247 248 249 250 251 252 240 245241 242 244243
232 233 234 235 236 237 238 239 227 228 229 231230
219 220 221 222 223 224 225 226 214 215 218216 217
206 207 208 209 210 212 213 199 205204200 201 203202
191 192 193 194 195 196 197 198 190184 185 189188186 187
176 177 178 179 180 181 182 183 175169 174170 173171 172
161 162 163 164 165 166 167 168 155 156 160159157 158
140 147 148 149 150 151 152 153 154 141 142 146143 145144
125 132 133 134 135 136 137 138 139 126 131127 128 130129
109 120 121 122 123 124
102 103 104 105 106 107 108 101100
Legend
12 km grid
Subareas
0 10 20 30 405Miles
°
About 55000 km2About 38 Subareas About 305 Grids of 12 km
Grid level: rainfall and runoffSubareas level: water
supply and demand
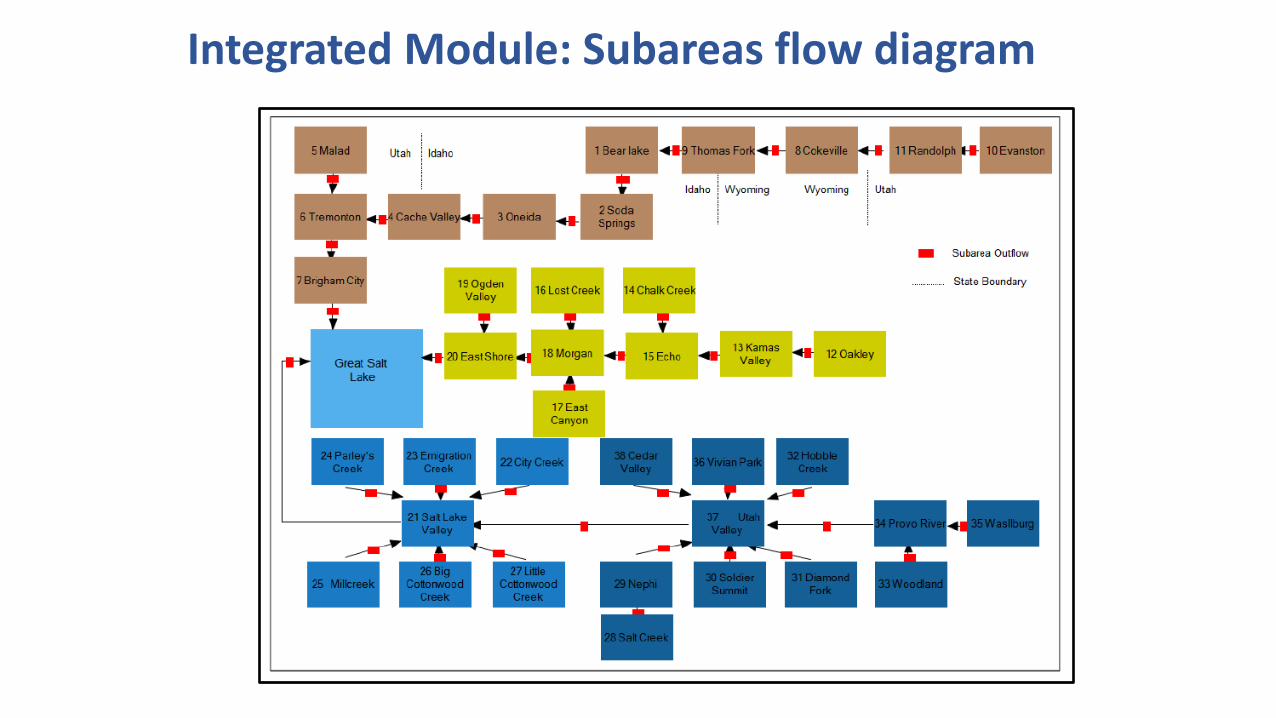
Integrated Module: Subareas flow diagram

(2) Lake Module and (3) Dynamic Module (Lake and Wetland)
Lake Module Dynamic Module

Both modules: Water and Salt Balance USGS equations
Salt Balance
[USGS WRI Report: 4221]

Model Illustrations


Outline:
• Model features• Model simulation results• Model performances and future work

Five Scenarios Run (Hypothetical): How will lake levels and salinity change in the future (2017 to 2040)?
1. Base scenario: Assuming same historical climatic and water uses observed from 1989 to 2012, and lake levels and salinity recorded on Jan 1st, 2017
2. Temperature increases by 0.50°C
3. Precip. decreases by 1%
4. Temperature increases by 0.50°C & precip. decreases by 1%
5. Population growth @4% of 2010

4175
4180
4185
4190
4195
4200
4205
20
17
Jan
20
17
Au
g
20
18
Mar
20
18
Oct
20
19
May
20
19
Dec
20
20
Ju
l
20
21
Feb
20
21
Sep
20
22
Ap
r
20
22
No
v
20
23
Ju
n
20
24
Jan
20
24
Au
g
20
25
Mar
20
25
Oct
20
26
May
20
26
Dec
20
27
Ju
l
20
28
Feb
20
28
Sep
20
29
Ap
r
20
29
No
v
20
30
Ju
n
20
31
Jan
20
31
Au
g
20
32
Mar
20
32
Oct
20
33
May
20
33
Dec
20
34
Ju
l
20
35
Feb
20
35
Sep
20
36
Ap
r
20
36
No
v
20
37
Ju
n
20
38
Jan
20
38
Au
g
20
39
Mar
20
39
Oct
20
40
May
20
40
Dec
Sou
th L
ake
leve
l (ft
.)
Extended Future Year
Integrated Baseline_Future ft 0.50 Deg.Cel Temp Increase ft
Precip decrease by 1% ft 0.50 Deg.Cel Temp & 1% Precp decrease ft
Population increase 4% ft
Base Case
0.5 ° Cincrease
1% Precipdecrease
0.5 ° C & 1% Precip
4% Populn
Min4185.72 4185.26 4185.27 4184.84 4185.70
Max4200.30 4199.50 4198.72 4197.96 4200.32
Mean4192.98 4192.18 4191.66 4190.82 4192.97
Std3.46 3.36 3.18 3.11 3.46

4190
4192
4194
4196
4198
4200
4202
4204
4206
4208
4210
4212
4214
0 10 20 30 40 50 60 70 80 90 100
Ave
rage
lake
leve
l(ft
.)
Sample percentile (water year 1950 to 2010)
Normal Probability Plot (Observed data 1950 to 2010)
Mean :4198.60 ftOptimum Lake level?


4175
4180
4185
4190
4195
4200
4205
20
17
Jan
20
17
Sep
20
18
May
20
19
Jan
20
19
Sep
20
20
May
20
21
Jan
20
21
Sep
20
22
May
20
23
Jan
20
23
Sep
20
24
May
20
25
Jan
20
25
Sep
20
26
May
20
27
Jan
20
27
Sep
20
28
May
20
29
Jan
20
29
Sep
20
30
May
20
31
Jan
20
31
Sep
20
32
May
20
33
Jan
20
33
Sep
20
34
May
20
35
Jan
20
35
Sep
20
36
May
20
37
Jan
20
37
Sep
20
38
May
20
39
Jan
20
39
Sep
20
40
May
Sou
th L
ake
leve
l (ft
.)
Extended Future Year
Integrated Baseline_Future ft 0.50 Deg.Cel Temp Increase ft
Precip decrease by 1% ft 0.50 Deg.Cel Temp & 1% Precp decrease ft
Population increase 4% ft
Salin
ity
(%)

Outline:
• Model features• Model simulation results• Model performances and future work

4,190
4,195
4,200
4,205
4,210
4,215
19
87
Jan
19
87
Oct
19
88
Ju
l
19
89
Ap
r
19
90
Jan
19
90
Oct
19
91
Ju
l
19
92
Ap
r
19
93
Jan
19
93
Oct
19
94
Ju
l
19
95
Ap
r
19
96
Jan
19
96
Oct
19
97
Ju
l
19
98
Ap
r
19
99
Jan
19
99
Oct
20
00
Ju
l
20
01
Ap
r
20
02
Jan
20
02
Oct
20
03
Ju
l
20
04
Ap
r
20
05
Jan
20
05
Oct
20
06
Ju
l
20
07
Ap
r
20
08
Jan
20
08
Oct
20
09
Ju
l
20
10
Ap
r
20
11
Jan
20
11
Oct
20
12
Ju
l
Sou
th A
rm E
leva
tio
n A
bo
ve N
GV
D2
9 (
feet
)
Date
Observed GSLIM Lake GSLIM Dynamic
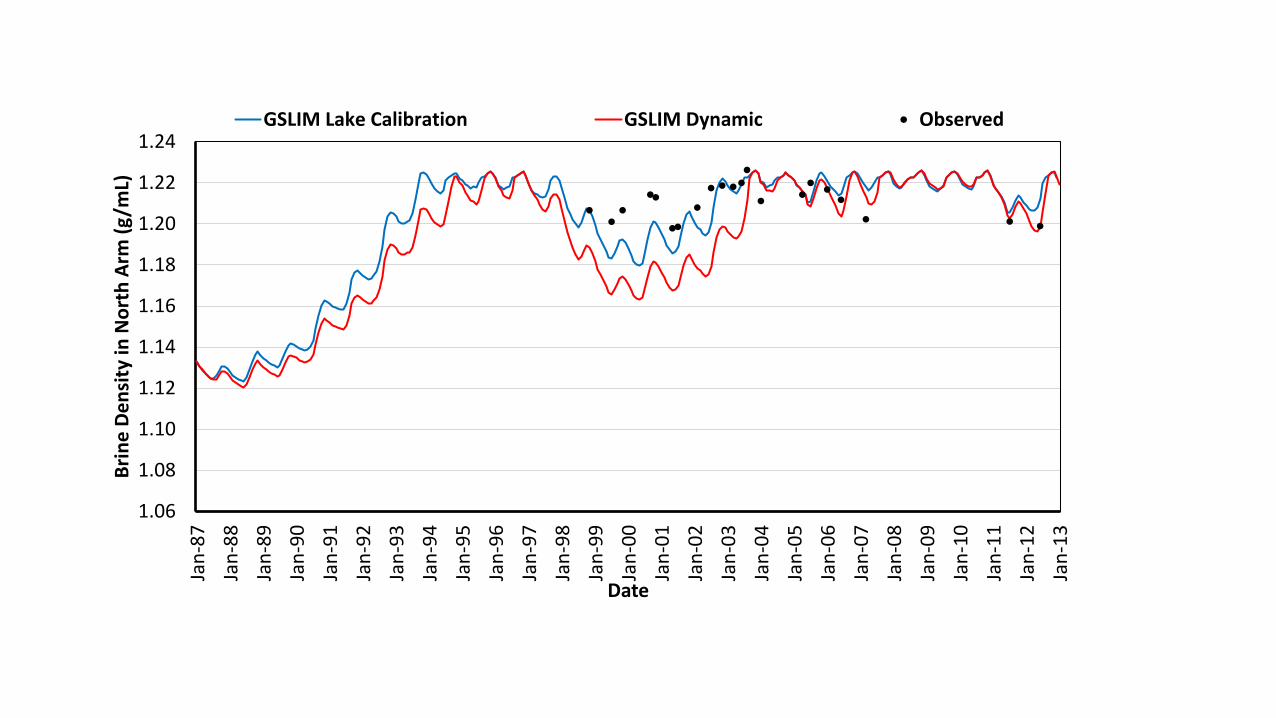
Lake and dynamics modules
R2=0.98 R2=0.97
1.06
1.08
1.10
1.12
1.14
1.16
1.18
1.20
1.22
1.24
Jan
-87
Jan
-88
Jan
-89
Jan
-90
Jan
-91
Jan
-92
Jan
-93
Jan
-94
Jan
-95
Jan
-96
Jan
-97
Jan
-98
Jan
-99
Jan
-00
Jan
-01
Jan
-02
Jan
-03
Jan
-04
Jan
-05
Jan
-06
Jan
-07
Jan
-08
Jan
-09
Jan
-10
Jan
-11
Jan
-12
Jan
-13
Bri
ne
De
nsi
ty in
No
rth
Arm
(g
/mL)
Date
GSLIM Lake Calibration GSLIM Dynamic Observed

Old bridge
New bridge
- Update New Bridge hydraulics using data collected since 2017

• Update scenarios: industrial water uses

- Model other water quality parameters and deep brine layers

4,190
4,195
4,200
4,205
4,210
4,215
19
87
Jan
19
87
Oct
19
88
Ju
l
19
89
Ap
r
19
90
Jan
19
90
Oct
19
91
Ju
l
19
92
Ap
r
19
93
Jan
19
93
Oct
19
94
Ju
l
19
95
Ap
r
19
96
Jan
19
96
Oct
19
97
Ju
l
19
98
Ap
r
19
99
Jan
19
99
Oct
20
00
Ju
l
20
01
Ap
r
20
02
Jan
20
02
Oct
20
03
Ju
l
20
04
Ap
r
20
05
Jan
20
05
Oct
20
06
Ju
l
20
07
Ap
r
20
08
Jan
20
08
Oct
20
09
Ju
l
20
10
Ap
r
20
11
Jan
20
11
Oct
20
12
Ju
lSou
th A
rm E
leva
tio
n A
bo
ve N
GV
D2
9 (
feet
)
Date
Observed GSLIM Integrated
River Basin (Integrated) Module
R2=0.88

- Verify water balance in subareas level incorporating reservoirs, snowmelt and river routing

Precipitation, 36%
Groundwater inflow, 3%
Stream inflows, 61%
GSL Water Balance(UPRR, 2014)
Bear River Basin 58%
Weber River Basin15%
Jordan River Basin 22%
Other 5%
Basin Inflows(Tarboton et al., 2012)

- Update input data (e.g. climate, population growth, and land use changes)
- Update scenarios incorporating important diversions in river basins (e.g. Bear River)

Summary Lake and Dynamic Module: Good performances1. Future climate parameters
2. Bridge hydraulics and bidirectional flows
3. Deep brine layer
4. Sensitivity analyses
5. Scenarios update
River Basin Module: Needs improvement1. Reservoir operation rules, snowpack, and snowmelt analyses2. Subareas water balance analyses and verification3. Sensitivity and errors analyses4. Routing module5. Scenarios update[e.g. Bear River diversion]

Organization supporting the GSLIM
(CH2M , 2017)
IA= implementing agencies

Thank you!
Any questions/comments/suggestions?
Craig Miller, P.E.Manager, Hydrology and Modeling
Candice Hasenyager, P.E.Asst. Director
Todd Adams, P.E.Deputy Director