great salt lake utah, 1847-1983 - u.s. geological … salt lake, utah, 1847-1983 by ted arnow...
TRANSCRIPT
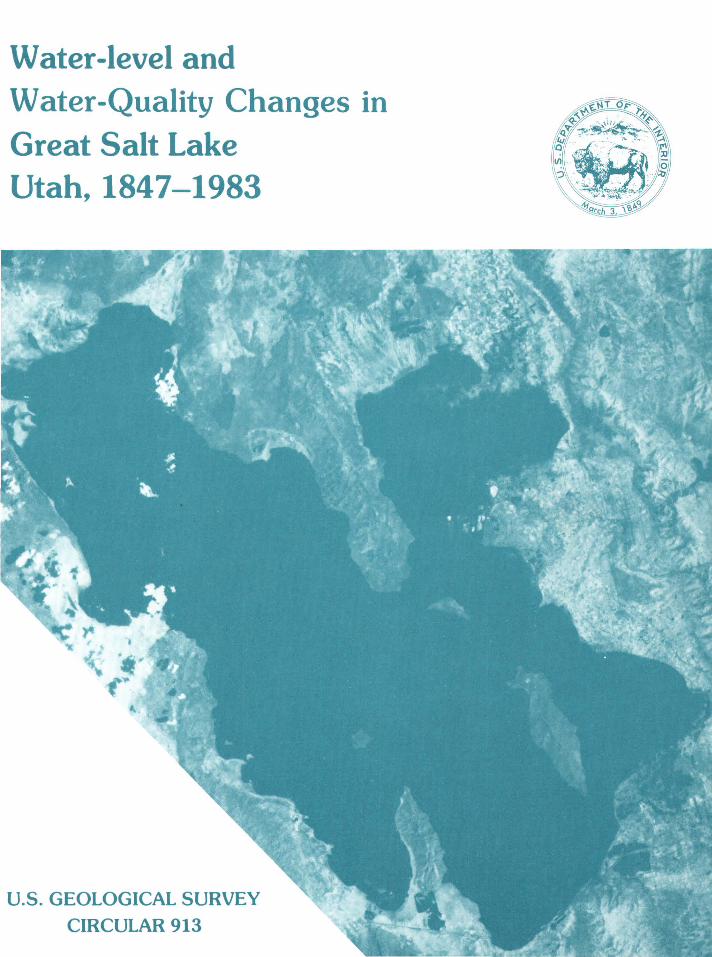
Water-level and Water-Quality Changes in Great Salt Lake Utah, 1847-1983
U.S. GEOLOGICAL SURVEY
CIRCULAR 913

Composite view of Great Salt lake taken July ~17, 1983, by the National Oceanic and Atmospheric Administra
tion landsat 4 satellite from 438 miles above the earth. Shows the area covered by the lake after its recordbreaking
rise from September 18, 1982, to June 30, 1983.
Water-Level and
Water-Quality Changes in Great Salt Lake, Utah, 1847-1983
By Ted Arnow
GEOLOGICAL SURVEY CIRCULAR 913
1984
United States Department of the Interior WILLIAM P. CLARK, Secretary
Geological Survey Dallas L. Peck, Director
Free on application to Branch of Distribution, U.S. Geological Survey, 604 South Pickett Street, Alexandria, VA 22304

Summary ..
Introduction
CONTENTS
Page Page
Relation of inflow to outflow-the water budget Inflow ..... .
Streams ... . Changes of lake level
Prehistoric record . Historic record . .
1
1
2
2 6
Precipitation . Ground water
Outflow ..
11 12 13 16 16 16 19 19 19 19 21 21
1847-1982 ...... . 1982--83 ....... .
7 7
Storage change . . . . . The lake brine . . . . .
Effects of man's activities Consumptive use . Railroad causeway . .
11 11 11
Chemical characteristics Changes in salinity
Conclusions . . . References cited . . . .
ILLUSTRATIONS
Page
FIGURE 1. Map showing location of Great Salt Lake . . . . . . . . . . . . . . . . . . . . . . . . . . . . . . . . . . 2 2. Map showing area covered by Great Salt Lake at historic high, low, and average levels, 1847-1983 3 3. Graph showing changes of water level and dissolved-mineral concentration of Great Salt Lake, 1847-1983. 4 4. Map showing extent of Lake Bonneville . . . . . . . . . . . . . . . . . . . . . . . . . . . . . . 5 5. Map showing location of gages used to determine the level of Great Salt Lake, 1875-1983 . . . . . . 6 6. Photograph of continuous lake-level recording gage at Salt Lake County Boat Harbor, 1972 . . . . . 7 7. Graph showing cumulative departure from average annual precipitation at Salt Lake City, 1875-1982 7 8. Map showing drainage basin of Great Salt Lake . . . . . . . . . . . . . . . . . . . . . . . . . . . . . . . 9 9. Map showing relative magnitude of streamflow into Great Salt Lake in the major rivers from October
1982 through May 1983 compared to average streamflow for October through May . . . . . . . . . 10 10. Views of Great Salt Lake taken by the National Oceanic and Atmospheric Administration Landsat 4 satellite
at the beginning of and after the recordbreaking rise of 1982--83 . . . . . . . . . . . . . . . . . . . . 12 11. Graph showing effects of consumptive use of water resulting from man's activities on recorded levels of
Great Salt Lake, 1850-1965 . . . . . . . . . . . . . . . . . . . . . . . . . . . . . . . . . . . . . . . . . 13 12. Map showing location of railroad causeway and gaging stations used for estimating surface-water inflow
to Great Salt Lake . . . . . . . . . . . . . . . . . . . . . . . . . . . . . . . . . . . . . . . . . 14 13. Photographs of flow through the culverts in the railroad causeway at different lake levels . . 15 14. Graph showing relations among the level, area, and volume of Great Salt Lake prior to 1957 15 15. Diagram showing sources of inflow to Great Salt Lake . . . . . . . . . . . . . . . . . . . . . . 16 16. Graph showing annual inflow to Great Salt Lake from all sources, 1931-76 . . . . . . . . . . . 17 17. Schematic drawing of railroad causeway showing direction of flow (A) through the culverts and (B) through
the permeable fill . . . . . . . . . . . . . . . . . . . . . . . . . . . . . . . . . . . . . . . . . . . . . . . 21
III
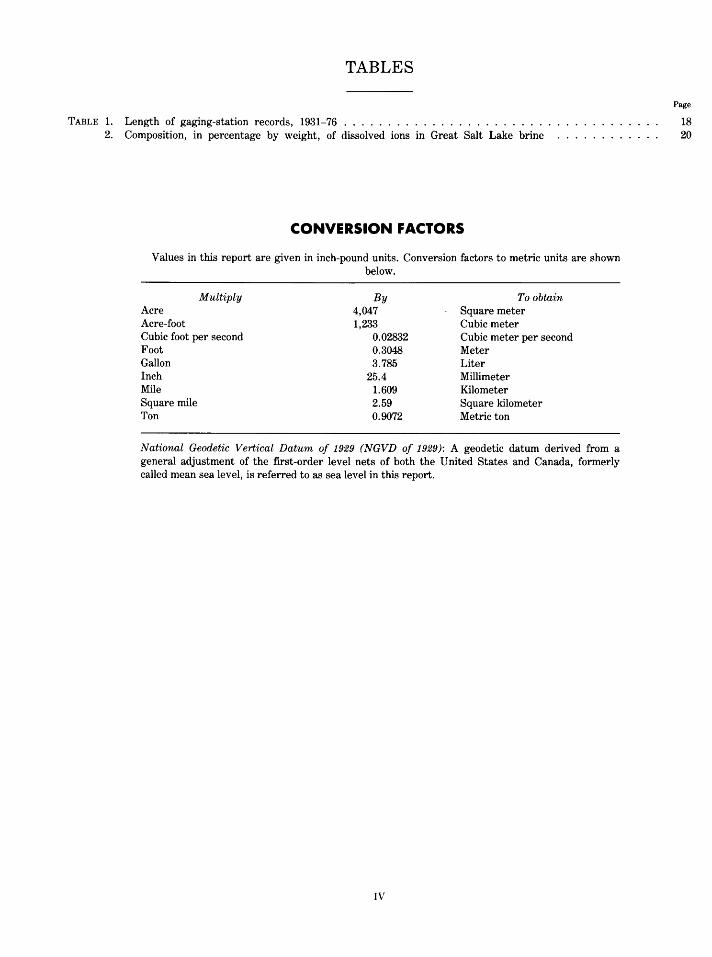
TABLES
TABLE 1. Length of gaging-station records, 1931-76 ....................... . 2. Composition, in percentage by weight, of dissolved ions in Great Salt Lake brine
CONVERSION FACTORS
Values in this report are given in inch-pound units. Conversion factors to metric units are shown below.
Multiply By To obtain Acre 4,047 Square meter Acre-foot 1,233 Cubic meter Cubic foot per second 0.02832 Cubic meter per second Foot 0.3048 Meter Gallon 3.785 Liter Inch 25.4 Millimeter Mile 1.609 Kilometer Square mile 2.59 Square kilometer Ton 0.9072 Metric ton
National Geodetic Vertical Datum of 1929 (NGVD of 1929): A geodetic datum derived from a general adjustment of the first-order level nets of both the United States and Canada, formerly called mean sea level, is referred to as sea level in this report.
IV
Page
18 20
WATER-LEVEL AND WATER-QUALITY CHANGES IN GREAT SALT LAKE, UTAH, 1847-1983
By Ted Arnow
SUMMARY
The surface level of Great Salt Lake, Utah, fluctuates continuously, primarily in response to climatic factors. During 1847-1982 the lake surface fluctuated between a low of about 4,191 feet and a high of about 4,212 feet above sea level but showed no net change. From September 18, 1982, to June 30, 1983, however, the lake rose 5.2 feet-from about 4,200 to about 4,205 feet above sea level-which is the greatest seasonal rise ever recorded. That rise resulted from considerably greater than average rainfall in 1982, greater than average snowfall during the autumn of 1982 through the spring of 1983, and unseasonably cool weather during that spring.
Man's activities have had a lesser, but still important effect on the lake level. The lake surface would have been about 5 feet higher in 1983 had there been no consumptive use of water owing to man's activities in the lake basin since 1847. The lake has been divided into two parts by a railroad causeway since 1959. The causeway restricts natural circulation, resulting in a difference of salinity and surface level of the lake across the causeway. The difference in surface level between the two parts of the lake varies both seasonally and annually and was as much as 3.25 feet in 1983.
The water budget for the Great Salt Lake can be expressed as:
Inflow = Outflow ± Storage change
The average annual inflow for 1931-76 was about 2.9 million acre-feet-about 1.9 million acre-feet from surface water, about 900,000 acre-feet from direct precipitation, and about 75,000 acre-feet from ground water. The average annual outflow for the same period, all by evaporation, also was about 2.9 million acre-feet. There was no net change in storage during the period.
The famed buoyancy of the brine in Great Salt Lake results from a dissolved-mineral content of almost 5 billion tons. More than 2 million additional tons have been added to the lake annually in recent years. The major dissolved ions in the brine are chloride, sulfate, sodium, magnesium, and potassium.
Prior to completion of the railroad causeway, the salinity of the brine varied inversely with the lake level. Since the causeway divided the lake into two parts, the salinity of the brine in the north part has been relatively constant at or close to saturation. The salinity of the brine in the south part has
1
continued to change inversely with the lake level, but the salinity has been less than it would have been without the causeway.
INTRODUCTION
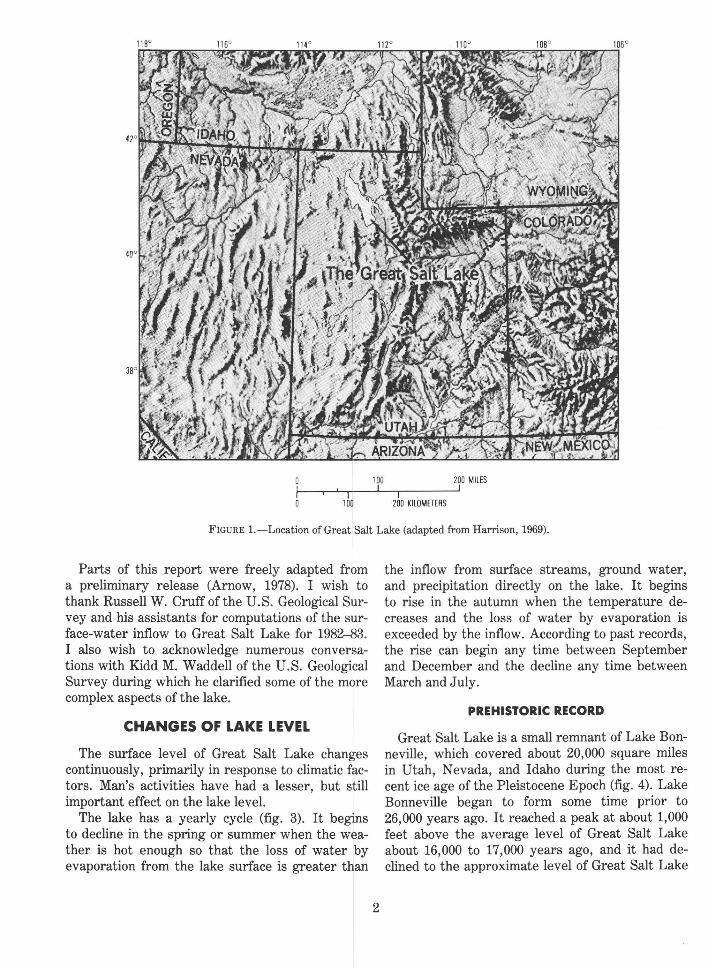
Great Salt Lake is unique among lakes in the Western Hemisphere because of its size and salt content. It occupies a low part of the desert area of western Utah-a terminal lake with no outlet to the sea (fig. 1). It varies considerably in size, depending on its surface elevation, which varies with climatic changes. At the elevation of approximately 4,200 feet above sea level, the average level about which it has fluctuated during historic time (fig. 2), it covers approximately 1, 700 square miles and contains about 16 million acre-feet of water. An acre-foot is the quantity of water necessary to cover 1 acre of land with water 1 foot deep or about 326,000 gallons. At times the lake contains as much as 27 percent salt, about eight times more than ocean water.
Changes in the level of the lake have a direct effect on roads, railroads, recreational facilities, wildlife-management areas, and industrial installations around the lake. These facilities have been constructed to cope with small changes of lake level, but the record-breaking rise of 5.2 feet from September 18, 1982, to June 30, 1983, resulted in severe economic impacts on all types of manmade installations.
The purpose of this report is to describe the background and the conditions that led to the 5.2-foot change of lake level in 1982-83. For a more complete treatment of other aspects of the lake, the reader is referred to a recent comprehensive volume edited by Gwynn (1980).
100 200 MilES
100 200 KilOMETERS
FIGURE 1.-Location of Great Salt Lake (adapted from Harrison, 1969).
Parts of this report were freely adapted from a preliminary release (Arnow, 1978). I wish to thank Russell W. Cruff of the U.S. Geological Survey and his assistants for computations of the surface-water inflow to Great Salt Lake for 1982--83. I also wish to acknowledge numerous conversations with Kidd M. Waddell of the U.S. Geological Survey during which he clarified some of the more complex aspects of the lake.
CHANGES OF LAKE LEVEL
The surface level of Great Salt Lake changes continuously, primarily in response to climatic factors. Man's activities have had a lesser, but still important effect on the lake level.
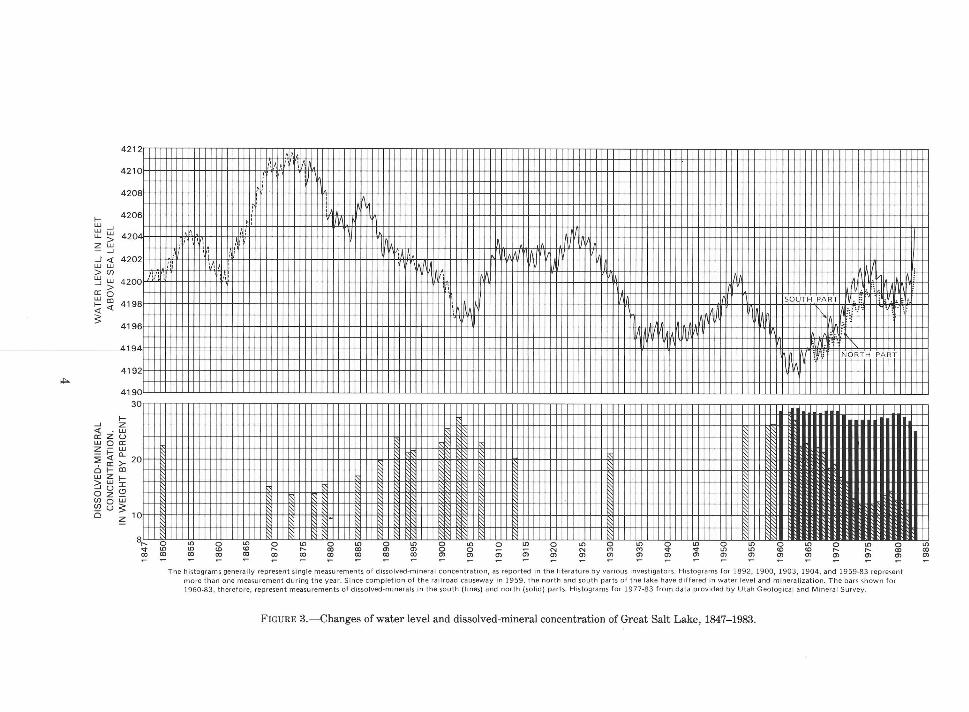
The lake has a yearly cycle (fig. 3). It begins to decline in the spring or summer when the weather is hot enough so that the loss of water by evaporation from the lake surface is greater than
2
the inflow from surface streams, ground water, and precipitation directly on the lake. It begins to rise in the autumn when the temperature decreases and the loss of water by evaporation is exceeded by the inflow. According to past records, the rise can begin any time between September and December and the decline any time between March and July.
PREHISTORIC RECORD
Great Salt Lake is a small remnant of Lake Bonneville, which covered about 20,000 square miles in Utah, Nevada, and Idaho during the most recent ice age of the Pleistocene Epoch (fig. 4). Lake Bonneville began to form some time prior to 26,000 years ago. It reached a peak at about 1,000 feet above the average level of Great Salt Lake about 16,000 to 17,000 years ago, and it had declined to the approximate level of Great Salt Lake
\ \ \ l ) /
~../ J (. / 1\..-/ ' ) \...-
EXPLANATION
LAKE·LEVEL ELEVATION (FEET)
--- 4 ,211.5 (historic high)
'ii ""'"" ' i 4,200 (average)
-------4,191.35 (historic low)
Ogden
SALT LAKE CITY
10 MILES
1 0 KILOMETERS
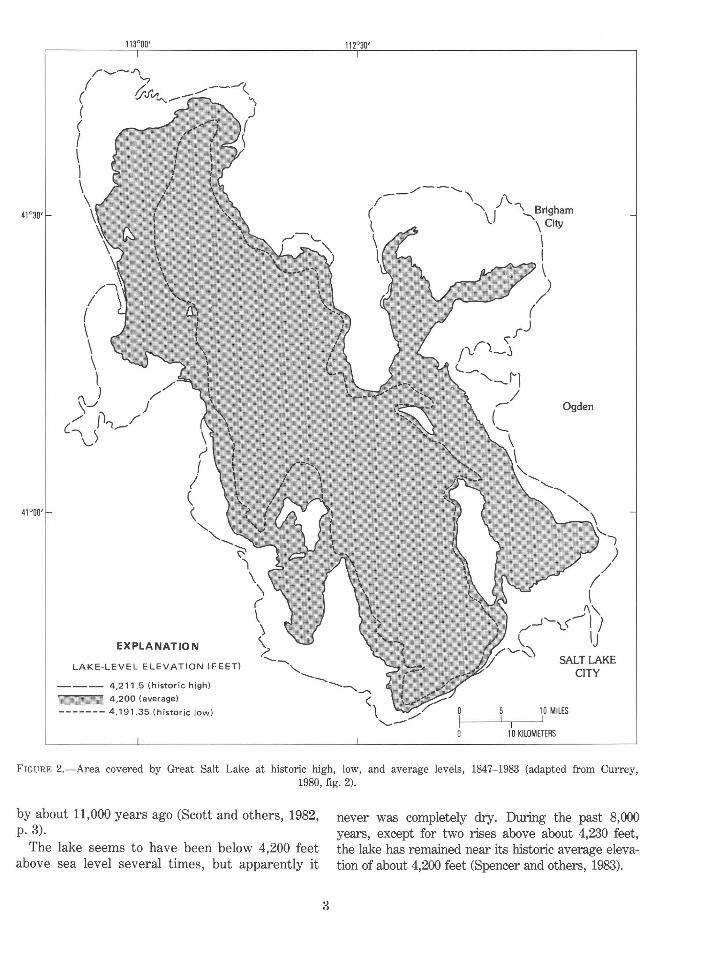
FIGURE 2.-Area covered by Great Salt Lake at historic high, low, and average levels, 1847-1983 (adapted from Currey, 1980, fig. 2).
by about 11,000 years ago (Scott and others, 1982, p. 3).
The lake seems to have been below 4,200 feet above sea level several times, but apparently it
3
never was completely dry. During the past 8,000 years, except for two rises above about 4,230 feet, the lake has remained near its historic average elevation of about 4,200 feet (Spencer and others, 1983).
..,..
4212 -~.~11.
4210 :\11.1·~ !' f\1/
4208 , ... j:
4206 )'oj: f
w_, ww u.. > zw - -' _,- <( w w >Cfl ww -'> a:o wcn
"11' ,, 4202 :'
''''I 4200' ::'
~~ 1 :
,"1'' 11 11 A II\, 1
II~~~~
till
~<( s
4198
4196
4194
4192
4190 .>U
f--' z <( -W a:zu woa: z-w -~a.. 2a:>-Qf-Cll
20
WZf-~~I Oz~ CflQW ~us 0 z 10
8,._ .. "'
0 L.O
"' L.O 0 L.O 0 L.O 0 L.O 0 L.O 0 L.O 0 L.O 0 L.O 0 L.O 0 L.O 0 L.O L.O CD CD "' "' "' "' Ol Ol 0 0 Ci Ci N N "' "' .. .. L.O L.O
"' "' "' "' "' "' "' "' "' Ol Ol Ol Ol Ol Ol Ol Ol Ol Ol
The histograms generally represent single measurements of dissolved -minera l concentration, as reported in t he literature by various investigators. Histograms for 1892, 1900, 1903, 1904, and 1959-83 represent more than one measurement during the yea r . Since completion of the railroad causeway in 1959, the north and south parts of the lake have differed in water level and m ineralization. The bars shown for 1960-83, therefore, represent measurements of dissolved-minerals in t he south (lines) and north (solid) parts. Histograms for 1977-83 from data provided by Utah Geological and Mineral Survey.
FIGURE 3.-Changes of water level and dissolved-mineral concentration of Great Salt Lake, 1847-1983.

Q
Wildcat Mountain
EXPLANATION
OUTLINE OF LAKE AT BONNEVILLE SHORELINE - Surrounding area patterned
.. EXISTING LAKES
50 MILES
50 KILOMETERS
FIGURE 4.-Extent of Lake Bonneville (adapted from Crittenden, 1963, fig. 1).
5

HISTORIC RECORD
The continuous record of lake-level changes that is based on actual measurements or carefully calculated estimates extends from 184 7 to the present (1983). John C. Fremont determined that Great Salt Lake was 4,200 feet above sea level in 1843 (Miller, 1980, p. 3); however, no records are available for 1844-46. Lake-level changes will be treated for two periods here in order to provide more detailed discussion of the unprecedented rise of the lake that began in September 1982.
The historic record of lake-level fluctuations begins in 1847. The level was determined indirectly by Gilbert (1890, p. 240--241) for 1847-75 on the basis of reported observations of the depth of water over the sandbars between the mainland
P\1• ..
q} Bear q;:"
10 20 KILOMETERS
10 MILES
and Antelope and Stansbury Islands. This information was relayed to Gilbert by stockmen who rode horses across the bars to reach the islands. Gilbert related these oral reports to later measurements by determining the elevations of the Antelope and Stansbury Island bars, making soundings on the Antelope Island bar, and relating the water level there to gage readings near Black Rock and Farmington (fig. 5).
From 1875 to 1938 the lake level was measured periodically at staff gages at six different sites. The level has been measured continuously at the Salt Lake County Boat Harbor since 1939 (fig. 6), and at Saline since 1966. Both stations are operated in cooperation with the Utah Division of Water Rights. The gaging sites and the chronology of the record are shown in figure 5.
SALT LAKE
@1 CITY
"' -<
FIGURE 5.-Location of gages used to detennine the level of Great Salt Lake, 1875--1983.
6

FIG URE 6.-Continuous lake-level recording gage at Salt Lake County Boat Harbor, 1972 (photograph by Verda Jensen).
1847-1982
When the Mormon pioneers arrived in Utah in 1847, the surface of Great Salt Lake was about 4,200 feet above sea level (fig. 3). It rose almost 5 feet by 1855 but then declined again to 4,200 feet by 1860. From 1862 until 1873 the lake level rose almost 12 feet to reach a historic high of about 4,211.5 feet. At this level, the lake covered approximately 2,400 square miles (fig. 2). The rapid rise of the lake during 1862-73 was of considerable concern to the Mormon settlers. If the lake continued to rise, they feared that Salt Lake City and adjacent farmlands would be flooded. In the hope of averting such a calamity, Brigham Young sent out an exploration party to determine if the water could be spilled from the lake into the vast desert area to the west. But the lake peaked in 1873, ending the concern at that time.
en w :I:
40
u ~
~ w a: :::> 1-a: <1: D.. w 0 w > i= ~ :::> ~ -30 :::> 0 It) 0 It)
u .... .... CX) CX)
~ ~ ~ ~
During the next 31 years the lake level declined almost 16 feet, and by 1905 it was at a then historic low of slightly less than 4,196 feet. A series of fluctuations followed, with each the lake declining to a lower level, and by 1963 it had reached an all-time historic low of 4,191.35 feet (fig. 2). At this level it covered only about 1,000 square miles. The fluctuations of the lake surface generally reflected fluctuations of precipitation as represented by the record for Salt Lake City (fig. 7) where systematic recordkeeping of precipitation was started during 1874.
Many people thought that the lake was going to become dry. Roads, railroads, wildfowl-management areas, recreational facilities, and industrial installations were established on the exposed lakebed. But then the lake began to rise again in response to greater than average precipitation, and by 1976 it had risen 11 feet to slightly above 4,202 feet. Again, concerns about a potential calamity resulted, and studies were made of the feasibility of pumping water out of the lake into the desert to the west. But the lake began to decline in 1977 in response to unusually little snowfall during the preceding winter, again ending the concern at that time.
Early in September 1982, the lake surface was at about 4,200 feet-the same level that it was 135 years earlier when the pioneers arrived. Thus, the lake had fluctuated between about 4, 191 and about 4,212 feet but had shown no net change.
1982-83
On September 18, 1982, the lake began to rise in response to a series of storms earlier in the
FIGURE 7.-Cumulative departure from average annual precipitation at Salt Lake City, 1875-1982.
7

month. Then on September 26, during a recordbreaking storm, 2.27 inches of rain was recorded at the Salt Lake City International Airport, the maximum precipitation ever measured for 1 day during the 108 years for which records have been kept for the city. The precipitation of 7. 04 inches for the month made it the wettest September on record for the city. The total precipitation at Salt Lake City during 1982 was 22.86 inches, compared to an annual average of 15.63 inches.
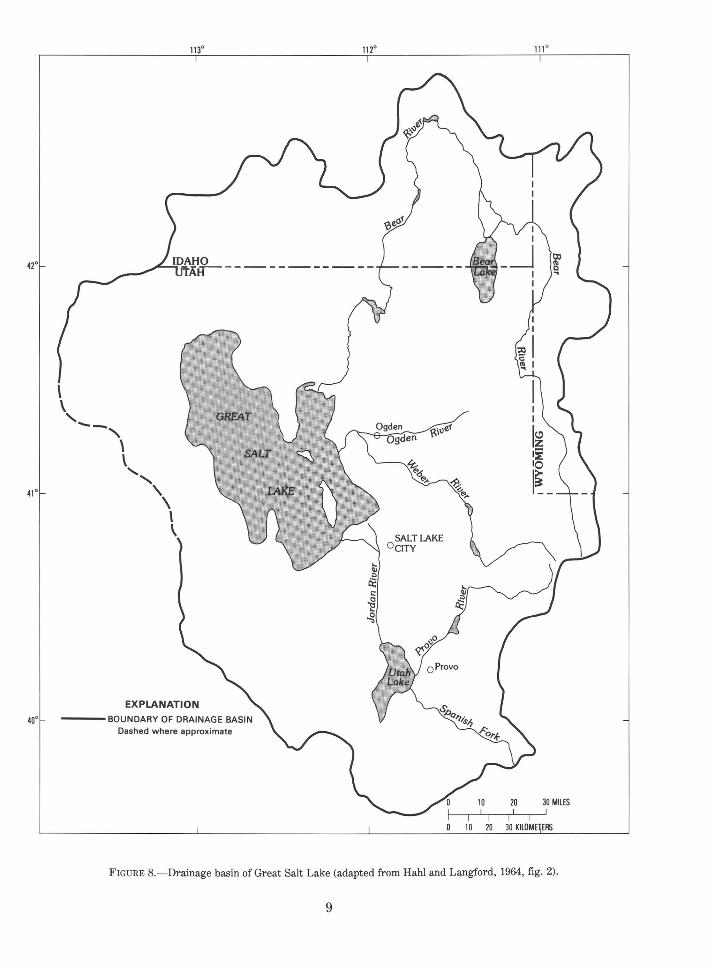
The unusually intense rainfall resulted in unseasonably large inflow to Great Salt Lake, both from precipitation directly on the lake and from tributary surface streams (fig. 8). The flow in the Jordan River on September 27 was 2, 760 cubic feet per second or about 20,600 gallons per second, the maximum during 40 years of recordkeeping. The large flows in the Jordan River, resulting from greater than average precipitation and the continuous overflow from Utah Lake, continued for the remainder of the year. The flow in the Jordan River from October-December was 3.8 times greater than average. During the same period, the flows in the Bear and Weber Rivers were 2.0 and 2. 7 times greater than average. Great Salt Lake continued to rise rapidly throughout the autumn in response to the great surface inflow and the concurrent relatively cool weather and extensive cloud cover that decreased loss of water from the lake by evaporation.
The snowfall in the drainage basin of Great Salt Lake from the autumn of 1982 through the following spring was greatly above average, providing a potential of enormous quantities of water for the lake. The maximum reported snowfall was 845 inches at Alta, about 20 miles southeast of Salt Lake City (Salt Lake Tribune, July 7, 1983). The snow cover on June 1 ranged from about 2. 4 to 3.4 times greater than average in the Bear River basin, from about 4.2 to 5.2 times greater than average in the Weber River basin, and from about 3.7 to 5.2 times greater than average in the Jordan-Provo River basin (Whaley, 1983, p. 7-11).
The lake continued to rise throughout the winter-a normal annual occurrence. But the weather remained unseasonably cool throughout most of the spring, so that the lake lost relatively little water by evaporation and continued its steady rise.
Snowmelt began about a month later than usual, and the snow-water content increased until midMay. Soil moisture in the drainage basin was con-
8
siderably greater than average, thus diminishing the potential for water to infiltrate into the ground. The major snowmelt began at the end of May, during a heat wave on the Memorial Day weekend; and recordbreaking quantities of water flowed into the lake from many tributary streams. The Bear River peaked at about 9,500 cubic feet per second on June 2, considerably more than its previously recorded peak of 7,880 cubic feet per second in 1980. The Jordan River peaked at about 3,100 cubic feet per second on June 1, which was greater than the recent record flow of the previous September. The Weber River peaked at about 7,200 cubic feet per second on June 3, the third greatest flow in 78 years of record. From January to May, the flows in the Bear, Jordan, and Weber Rivers were 1. 7, 3.6, and 1.6 times greater than average. The inflow to Great Salt Lake in the three rivers from October 1982 to May 1983 is compared to the average inflow in figure 9.
The large streamflows continued for many weeks; and the lake level continued to rise until June 30, when losses by evaporation finally exceeded the inflow, and the lake level peaked at 4205.00 feet. The rise from September 18, 1982, until June 30, 1983, was 5.2 feet, which is the greatest seasonal rise ever recorded. This represents a net increase in the volume of the lake of about 6 million acre-feet. That quantity of water is equivalent to what might be used by about 36 million people (with an average daily per capita consumption of 150 gallons) in 1 year, or by 1.5 million people (the entire population of Utah) in 24 years. The previous largest seasonal rise known was 3.4 feet in 190&-07.
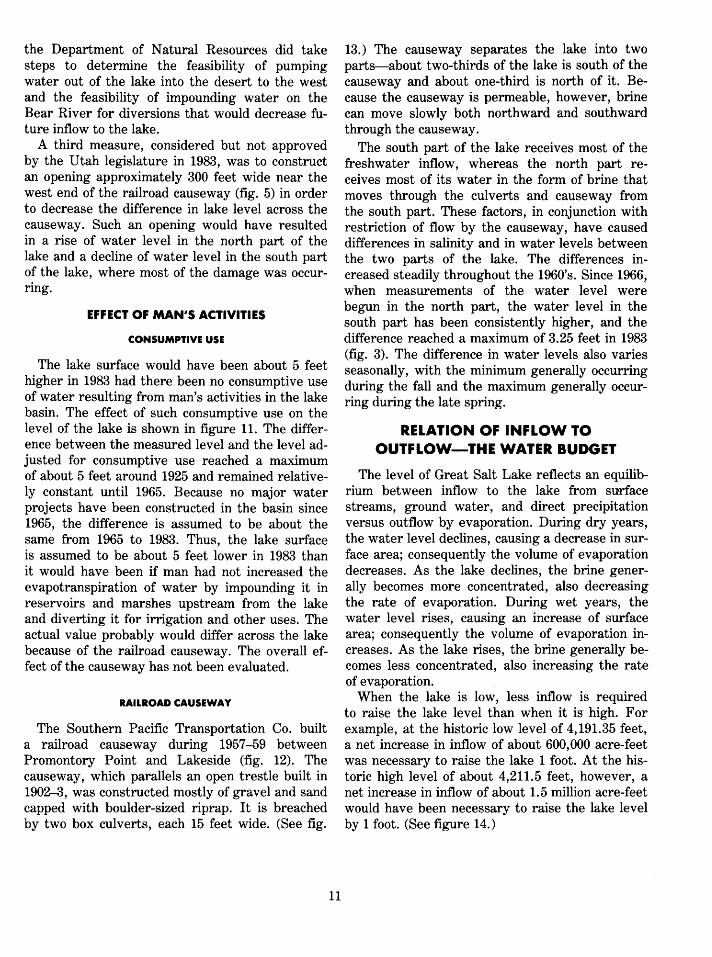
The increase in area covered by the lake from September 1982 to July 1983 (Fig. 10) was about 171,000 acres (267 square miles). This resulted in damage to the roads, railroads, wildfowl-management areas, recreational facilities, and industrial installations that had been established on the exposed lake bed. The direct and indirect capital damages and the costs of work to protect these facilities as the lake rose to the level of 4,205 feet were estimated by the Utah Division of State Lands and Forestry (1983, p. 24) to be about $157 million.
The Utah legislature passed a law in 1979 which made the Utah Department of Natural Resources responsible for managing the lake so as to maintain the surface level below the elevation of 4,202 feet. Although that goal was not achieved in 1983,
42°
41°
40°
\ \. --' \
\ ', ' \ \
\
113°
EXPLANATION ---BOUNDARY OF DRAINAGE BASIN
Dashed where approximate
112°
OSALTLAKE CITY
111 °
30 MILES
FIGURE 8.-Drainage basin of Great Salt Lake (adapted from Hahl and Langford, 1964, fig. 2).
9

GREAT
SALT
LAKE
EXPLANATION
<'-t_ _____ AVERAGE INFLOW OCTOBER-MAY ,,-----
~ INFLOW OCTOBER 1982-MAY 1983
--- BOUNDARY OF DRAINAGE BASIN Dashed wher approximate
10 10 30 40 50 KILOM ETERS I I I I I I
I I 10 10 30 MILES
FIGURE 9.-Relative magnitude of streamflow into Great Salt Lake in the major rivers from October 1982 through May 1983 compared to average streamflow for October through May.
10
the Department of Nat ural Resources did take steps to determine the feasibility of pumping water out of the lake into the desert to the west and the feasibility of impounding water on the Bear River for diversions that would decrease future inflow to the lake.
A third measure, considered but not approved by the Utah legislature in 1983, was to construct an opening approximately 300 feet wide near the west end of the railroad causeway (fig. 5) in order to decrease the difference in lake level across the causeway. Such an opening would have resulted in a rise of water level in the north part of the lake and a decline of water level in the south part of the lake, where most of the damage was occurring.
EFFECT OF MAN•s ACTIVITIES
CONSUMPTIVE USE
The lake surface would have been about 5 feet higher in 1983 had there been no consumptive use of water resulting from man's activities in the lake basin. The effect of such consumptive use on the level of the lake is shown in figure 11. The difference between the measured level and the level adjusted for consumptive use reached a maximum of about 5 feet around 1925 and remained relatively constant until 1965. Because no major water projects have been constructed in the basin since 1965, the difference is assumed to be about the same from 1965 to 1983. Thus, the lake surface is assumed to be about 5 feet lower in 1983 than it would have been if man had not increased the evapotranspiration of water by impounding it in reservoirs and marshes upstream from the lake and diverting it for irrigation and other uses. The actual value probably would differ across the lake because of the railroad causeway. The overall effect of the causeway has not been evaluated.
RAILROAD CAUSEWAY
The Southern Pacific Transportation Co. built a railroad causeway during 1957-59 between Promontory Point and Lakeside (fig. 12). The causeway, which parallels an open trestle built in 1902-3, was constructed mostly of gravel and sand capped with boulder-sized riprap. It is breached by two box culverts, each 15 feet wide. (See fig.
11
13.) The causeway separates the lake into two parts-about two-thirds of the lake is south of the causeway and about one-third is north of it. Because the causeway is permeable, however, brine can move slowly both northward and southward through the causeway.
The south part of the lake receives most of the freshwater inflow, whereas the north part receives most of its water in the form of brine that moves through the culverts and causeway from the south part. These factors, in conjunction with restriction of flow by the causeway, have caused differences in salinity and in water levels between the two parts of the lake. The differences increased steadily throughout the 1960's. Since 1966, when measurements of the water level were begun in the north part, the water level in the south part has been consistently higher, and the difference reached a maximum of 3.25 feet in 1983 (fig. 3). The difference in water levels also varies seasonally, with the minimum generally occurring during the fall and the maximum generally occurring during the late spring.
RELATION OF INFLOW TO OUTFLOW-THE WATER BUDGET
The level of Great Salt Lake reflects an equilibrium between inflow to the lake from surface streams, ground water, and direct precipitation versus outflow by evaporation. During dry years, the water level declines, causing a decrease in surface area; consequently the volume of evaporation decreases. As the lake declines, the brine generally becomes more concentrated, also decreasing the rate of evaporation. During wet years, the water level rises, causing an increase of surface area; consequently the volume of evaporation increases. As the lake rises, the brine generally becomes less concentrated, also increasing the rate of evaporation.
When the lake is low, less inflow is required to raise the lake level than when it is- high. For example, at the historic low level of 4,191.35 feet, a net increase in inflow of about 600,000 acre-feet was necessary to raise the lake 1 foot. At the historic high level of about 4,211.5 feet, however, a net increase in inflow of about 1.5 million acre-feet would have been necessary to raise the lake level by 1 foot. (See figure 14.)
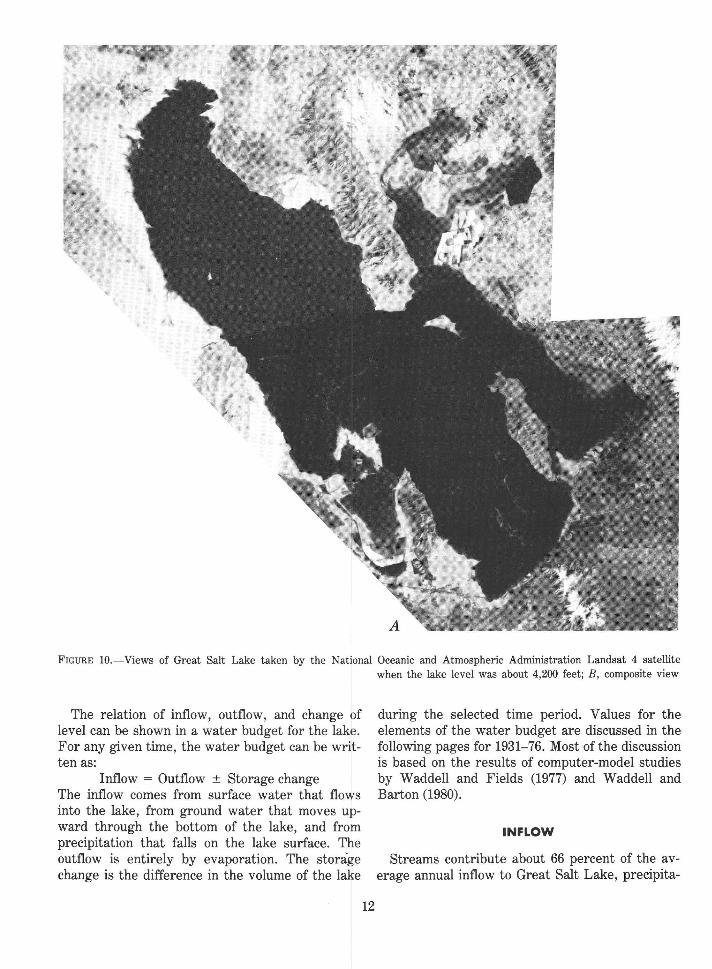
FIGURE 10.- Views of Great Salt Lake taken by the National Oceanic and Atmospheric Administration Landsat 4 satellite when the lake level was about 4,200 feet; B, composite view
The relation of inflow, outflow, and change of level can be shown in a water budget for the lake. For any given time, the water budget can be written as:
Inflow = Outflow ± Storage change The inflow comes from surface water that flows into the lake, from ground water that moves upward through the bottom of the lake, and from precipitation that falls on the lake surface. The outflow is entirely by evaporation. The storage change is the difference in the volume of the lake
12
during the selected time period. Values for the elements of the water budget are discussed in the following pages for 1931-76. Most of the discussion is based on the results of computer-model studies by Waddell and Fields (1977) and Waddell and Barton (1980).
INFLOW
Streams contribute about 66 percent of the average annual inflow to Great Salt Lake, precipita-

at the beginning of and after the recordbreaking rise of 1982--83. A, composite view taken September 23--0ctober 2, 1982, taken July 8-17, 1983, when the lake level was about 4,205 feet.
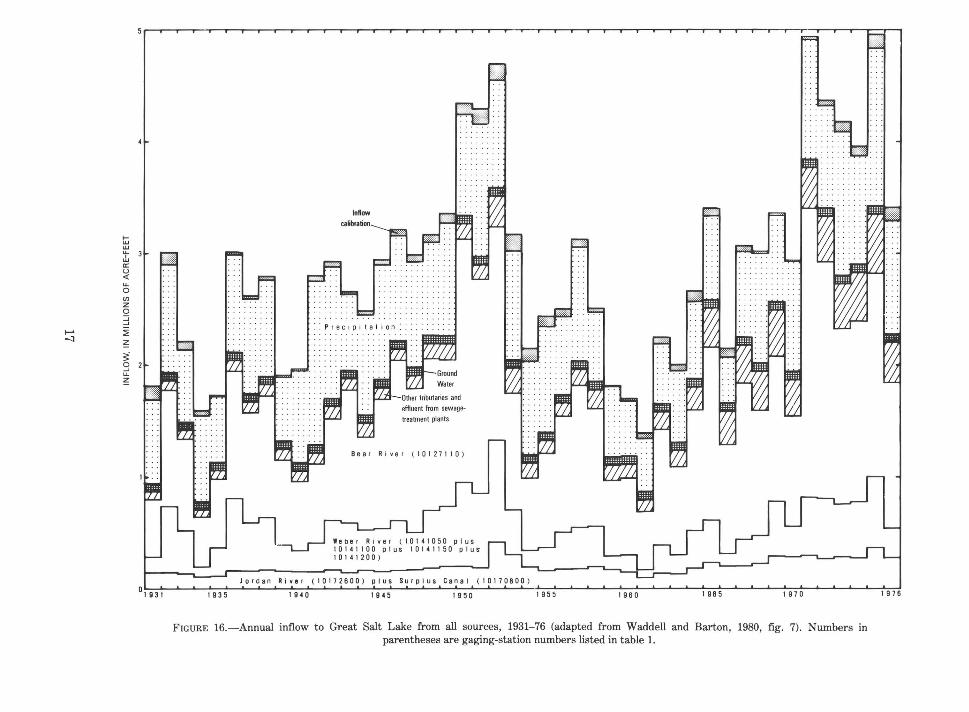
tion about 31 percent, and ground water about 3 percent (fig. 15). The total annual inflow during 1931-76 ranged from about 1.3 (1961) to 5.0 (1971) million acre-feet and averaged 2.9 million acrefeet. The annual distribution of inflow from all sources for 1931-76 is shown in figure 16.
STREAMS
Approximately 92 percent of the average annual surface-water inflow to Great Salt Lake is from the Bear (59 percent), Weber (20 percent), and
13
~ 4215,_-,--,--,-,,-,-,--,--,--,--,--,. w--' u..W z G:; 4210 -....~
_j <! 4205 ww >Cfl ~ w 4200 a:> ~ ~ 4195 <!<!
Dashed line shows Approximate level
S 4190oL-~oL-~~~~---'~~o~~o--~o--~o--o~~o--'~ l.t) C.0 .- N M "';f' Ln <0<.0 CXl CXl a> a> a> a> a> a>a>
~ ~ ~
FIGURE 11.-Effects of consumptive use of water resulting from man's activities on recorded levels of Great Salt Lake, 1850-1965 (adapted from Whitaker, 1971, fig. 3).

41°, 30'
41° 00'
40° 30'
CURLEW VALLEY
Locomotive
t\ Dolphin {0> Island
"'10161000
EXPLANATION
GAGING STATION
112°30'
TOOELE
VALLEY
A----A' STATION 10127110-Represents total surface flow across State Highway 83
10 20
10
30 KILOMETERS
20 MILES
... 10111600
"'10170000
FIGURE 12.-Location of railroad causeway and gaging stations used for estimating surface-water inflow to Great Salt Lake (adapted from Waddell and Barton, 1980, fig. 3).
14

FIGURE 13.-Flow through the culverts in the railroad causeway at different lake levels. A, boat entering culvert; view to north, Photograph from files of Utah Geological and Mineral Survey dated "196~3." Thus, elevation of south part of lake was between 4,191.35 and 4,193.85 feet. B, submerged culvert on June 15, 1983, when elevation of south part of lake was 4,204.75 feet; view to south. Photograph by Elmer Gerhart, U.S. Geological Survey.
Jordan (13 percent) River drainage systems. The U.S. Geological Survey has operated gaging stations on the main stems of these streams upstream from the lake for many years. During 1971-76, records were obtained at numerous gaging stations near the lakeshore in the three drainage basins. Streamflow to the lake during 1931-76 was estimated by correlation of the short-term records obtained near the lakeshore with the long-term re-
15
.....J UJ
> UJ .....J
<( UJ (f)
UJ
> 0 CI)
<(
1-LJ.J UJ L.L
z .....JUJ
> UJ .....J
cr:: UJ 1-<(
s
VOLUME, IN MILLIONS OF ACRE-FEET
250 500
Lowest level 41 93.35 feet (1963)
SURFACE AREA IN THOUSANDS OF ACRES
FIGURE 14.-Relations among the level, area, and volume of Great Salt Lake prior to 1957 (adapted from Hahl and Handy, 1969, p. 10).
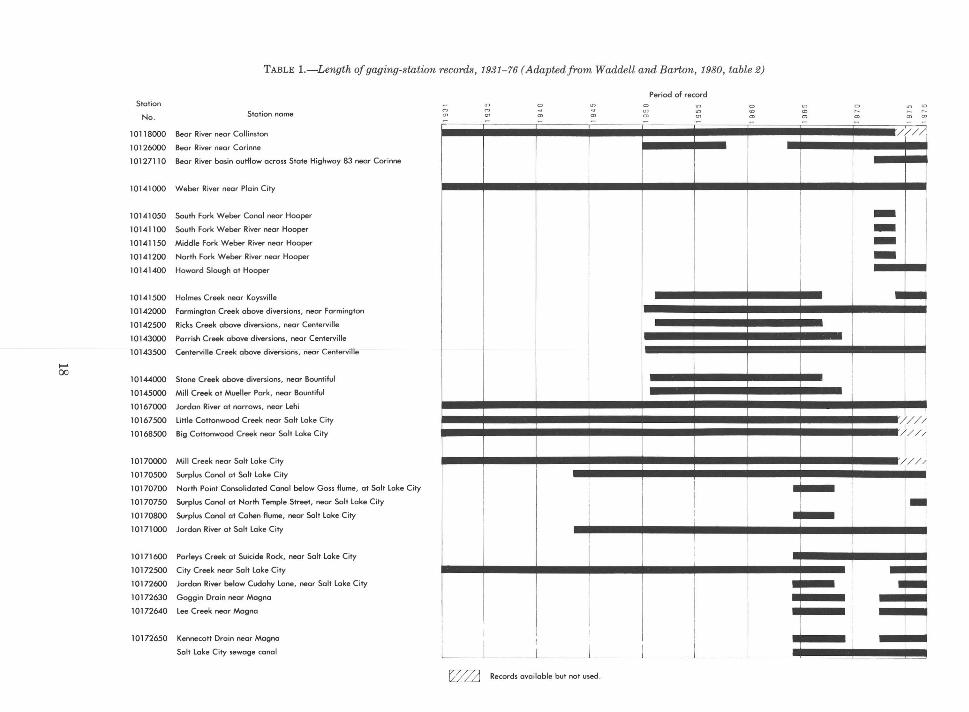
cords obtained farther upstream. The location of each gaging station is shown in figure 12, and the period of record at each station is shown in table 1.
An additional 5 percent of the streamflow to the lake is from 10 tributaries on the east and south shores. Measurements at stations on these tributaries for varying periods during 1950-76 were used as a basis for estimating the inflow during 1931-76. These stations also are shown in figure 12 and are listed in table 1. Other surfacewater inflow from the remainder of the lakeshore is negligible.
Approximately 3 percent of the surface inflow to Great Salt Lake is from sewage-treatment plants. These discharge their effluent directly into Farmington Bay, east of Antelope Island.
The total annual surface inflow during 1931-76 ranged from about 700,000 (1934) to 3.8 million (1971) acre-feet. It averaged about 1.9 million acre-feet.
PRECIPITATION
Inflow to Great Salt Lake from precipitation directly on the lake surface was calculated by using the average annual precipitation during 1931-76 for 68 sites in a large area surrounding the lake. A multiple-regression equation was derived to describe the average annual precipitation as a function of elevation, latitude, and longitude. The equation was used as a means of drawing lines of equal average annual precipitation for the lake area. Then the annual precipitation directly on the lake was computed for 1931-76 on the basis of monthly lake-surface areas during that period. The estimated annual precipitation on the lake during 1931-76 ranged from about 500,000 (1966) to 1.5 million (1941) acre-feet and averaged about 900,000 acre-feet.
Precipitation that falls on the lakeshore runs into the lake and must be considered as part of the inflow. The quanity is relatively small, however, and in figure 16 it is included in "inflow calibration," the factor used by Waddell and Barton (1980, p. 20) to balance their water budget for the lake.
GROUND WATER ( 3 PERCENT)
PRECIPITATION
( 31 PERCENT)
SURFACE STREAMS
( 66 PERCENT)
FIGURE 15.-Sources of inflow to Great Salt Lake.
16
The ground-water inflow to Great Salt Lake was estimated by adding inflow values determined in previous investigations for 12 segments of the lakeshore. (See Arnow and Stephens, 1975.) The values in acre-feet per year are 0 for Curlew, Sink, and Skull Valleys, the lower Bear River basin, and the northern Great Salt Lake Desert (west of Great Salt Lake); 1,000 for Hansel Valley; 3,000 for Antelope Island and Park Valley (northwest of Great Salt Lake); 4,000 for Salt Lake County; 7,000 for Tooele Valley; 9,000 for the Promontory Mountains; and 48,000 for the area east of Great Salt Lake.
The total ground-water inflow to the lake is estimated to be about 75,000 acre-feet per year. This is assumed to be an average annual inflow value for 1931-76.
OUTFLOW
Outflow from Great Salt Lake by evaporation from the lake surface was calculated primarily on the basis of pan-evaporation data from 49 sites in Utah and bordering States. Short-term records were extended to the full period 1931-76 by correlation with a site near Lehi (about 30 miles southeast of Great Salt Lake), and seasonal records were extended to the entire year by use of ratios developed for a few sites where complete annual records were available. Pan coefficients were applied, and a multiple-regression equation based on elevation, latitude, and longitude, was used to draw lines of annual freshwater evaporation for the lake. The volume of freshwater evaporation was then corrected for the effect of salinity by applying the appropriate factors for each part of the lake.
The estimated annual evaporation from the lake for 1931-76 ranged from about 2.1 to 3.9 million acre-feet and averaged 2.9 million acre-feet. The latter is equivalent to about 45 inches per year for the average lake level during 1931- 76.
A small volume of water was withdrawn from Great Salt Lake during 1931-76 and evaporated for salt production, but in recent years the volume has increased because of withdrawals for production of additional minerals. The total withdrawal for mineral production during 1976 was about 71,000 acre-feet.
..... -'l
I-UJ UJ u.. ' UJ
a: u < u.. 0 (/)
z 0 ::J ...J
~ ~
?£ 0 ...J u.. ~
FIGURE 16.-Annual inflow to Great Salt Lake from all sources, 1931-76 (adapted from Waddell and Barton, 1980, fig. 7). Numbers in parentheses are gaging-station numbers listed in table 1.
,_. 00
TABLE !.-Length of gaging-station records, 1931-76 (Adapted from Waddell and Barton, 1980, table 2)
Station
No. Station name
10118000 Bear River near Collinston
10126000 Bear River near Corinne
10127110 Bear River basin outflow across State Highway 83 near Corinne
10141000 Weber River near Plain City
10141050 South Fork Weber Conal near Hooper
10141100 South Fork Weber River near Hooper
10141150 Middle Fork Weber River near Hooper
10141200 North Fork Weber River near Hooper
10141400 Howard Slough at Hooper
10141500 Holmes Creek near Kaysville
10142000 Farmington Creek above diversions, near Farmington
10142500 Ricks Creek above diversions, near Centerville
10143000 Parrish Creek above diversions, near Centerville
10143500 Centerville Creek above diversions, near Centerville
10144000 Stone Creek above diversions, near Bountiful
10145000 Miii .Creek at Mueller Pork, near Bountiful
10167000 Jordan River at narrows, near lehi
10167500 Little Cottonwood Creek near Salt lake City
10168500 Big Cottonwood Creek near Salt lake City
10170000 Mill Creek near Salt lake City
1 0170500 Surplus Canol at Salt lake City
10170700 North Point Consolidated Conal below Goss flume, at Salt lake City
10170750 Surplus Conal at North Temple Street, near Salt lake City
10170800 Surplus Canol at Cohen flume, near Soltloke City
10171000 Jordan River at Soltloke City
10171600 Parleys Creek at Suicide Rock, near Soltloke City
10172500 City Creek near Salt lake City
10172600 Jordon River below Cudahy lone, near Salt lake City
10172630 Goggin Drain near Magno
10172640 lee Creek near Magno
10172650 Kennecott Drain near Magno
Salt lake City sewage canal
~
I
i
I
Period of record
~ ;:, ;:, ~ - - - -
I I
I
I i T I
I
'
i
I i
I I I I I
' I j_ i i
~/L2 Records available but not used .
m m - - -///~
I I
I I -i -! I -I ! -i
I
• ... ' I I
//// I I ////
I i ~//j
~ ' 1-i ' i
I
I
I
I --' ·-'
!
I

STORAGE CHANGE
The final element in the water budget-storage change-is the change in the volume of the lake. Changes in volume are computed on the basis of changes in the water level of the lake, and figure 14 illustrates the relation between volume and water level. The lake at the end of 1976 was at the same level as at the beginning of 1931. Thus, there was no net change in storage during the period.
THE LAKE BRINE
CHEMICAL CHARACTERISTICS
Great Salt Lake is one of the saltiest large permanent bodies of water in the world. It is not as salty as the Dead Sea, but it is considerably saltier than the oceans. The lake has a dissolvedmineral content of almost 5 billion tons (Sturm, 1980, p. 155). More than 2 million tons have been added to the lake annually in recent years (Arnow and Mundorff, 1972, table 3), primarily by the inflowing streams. It is the density resulting from those dissolved minerals that gives the lake brine its buoyancy and permits people to float without effort.
The major dissolved ions in the brine are chloride, sulfate, sodium, magnesium, and potassium. Chloride and sodium account for about 90 percent (by weight) of the dissolved ions. That percentage decreases somewhat when halite (rock salt) is precipitated at low lake levels (Hahl and Handy, 1969, p. 14). The brine contains small quantities of dissolved calcium, bicarbonate, lithium, boron, fluoride, silica, and other trace elements. The composition of the dissolved ions in the brine has remained fairly constant throughout the recorded history of sampling on the lake. Some variations occurred, however, when the lake was divided by the railroad causeway, particularly when halite was precipitated. (See table 2.)
CHANGES IN SALINITY
The salinity of the brine in Great Salt Lake has always varied somewhat with depth and from place to place. These variations were caused by differences in distance to sources of freshwater inflow and differences resulting from greater rates of evaporation in shallow parts of the lake compared to deep parts.
19
Prior to completion of the railroad causeway, mineral concentrations in the lake probably were fairly uniform owing to mixing of the brine by wind and currents. During years of high lake levels resulting from large quantities of freshwater inflow, the salinity of the brine was less than during years of low lake levels when the concentration of the brine increased because evaporation exceeded inflow. This is illustrated in figure 3, which shows that prior to 1959 the salinity of the brine varied inversely with the lake level. In 1869, for example, when the lake was within a few feet of its historic high level, the concentration of dissolved minerals was 15 percent of brine weight. In 1930, however, when the lake level was about 10 feet lower, the mineral concentration was 21 percent.
The completion of the railroad causeway in 1959 divided the lake into two parts and restricted movement of the brine. The south part of the lake receives more than 90 percent of the freshwater inflow, but that inflow contributes directly to only an upper layer of brine in the south part. A lower, denser layer, occupying only the deepest areas of the south part, is derived from dense brine in the north part that is driven by a density gradient to flow southward through the lower parts of the culverts and causeway. (See figure 17.) The north part of the lake has been cut off from most of the direct freshwater inflow, and almost all its inflow consists of brine that moves through the culverts and causeway from the south where the water level is higher. The changes brought about by the causeway have had a profound effect on the relation of lake level to salinity (fig. 3).
The brine north of the causeway has remained relatively constant at or close to saturation since at least 1960. The concentration of dissolved minerals in the north part has been close to 27 percent regardless of changes in lake levels. Even in July 1983, when the lake level peaked after its historic rise, the concentration of dissolved minerals was about 25 percent.
In 1963, at the historic low level of the lake, the brine south of the causeway was saturated, with the concentration of dissolved minerals at about 27 percent. As the lake rose, however, the salinity of the brine south of the causeway continued to change inversely with the lake level, although the salinity was less than it would have been prior to construction of the causeway (fig.
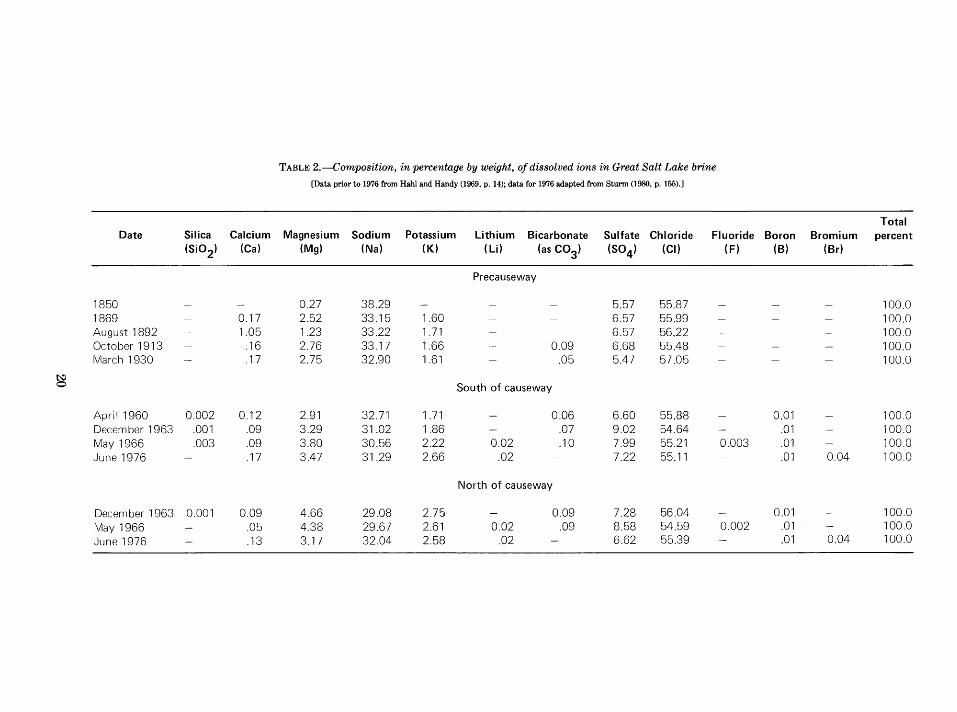
TABLE 2.-Composition, in percentage by weight, of dissolved ions in Great Salt Lake brine
[Data prior to 1976 from Hahl and Handy (1969, p. 14); data for 1976 adapted from Stunn (1980, p. 155).]
Total Date Silica Calcium Magnesium Sodium Potassium Lithium Bicarbonate Sulfate Chloride Fluoride Boron Bromium percent
(Si02
) (Ca) (Mg) (Na) (K) (Li) (as co3) (S04 ) (CI) (F) (B) (Br)
Precauseway
1850 0.27 38.29 5.57 55.87 100.0 1869 0.17 2.52 33.15 1.60 6.57 55.99 100.0 August 1892 1.05 1.23 33.22 1 .71 6.57 56.22 100.0 October 1913 .16 2.76 33.17 1.66 0.09 6.68 55.48 100.0 March 1930 .17 2.75 32.90 1 .61 .05 5.47 57.05 100.0
1:\:) 0 South of causeway
April 1960 0.002 0.12 2.91 32.71 1.71 0.06 6.60 55.88 0.01 100.0 December 1963 .001 .09 3.29 31.02 1.86 .07 9.02 54.64 .01 100.0 May 1966 .003 .09 3.80 30.56 2.22 0.02 .1 0 7.99 55.21 0.003 .01 100.0 June 1976 .17 3.47 31.29 2.66 .02 7.22 55.11 .01 0.04 100.0
North of causeway
December 1 963 0.001 0.09 4.66 29.08 2.75 0.09 7.28 56.04 0.01 100.0 May 1966 .05 4.38 29.67 2.61 0.02 .09 8.58 54.59 0.002 .01 100.0
June 1976 .13 3.17 32.04 2.58 .02 6.62 55.39 .01 0.04 100.0

3). In 1977, for example, at a lake level of about 4,200 feet, the mineral concentration was approximately 12 percent; whereas prior to 1957 it would have been more than 20 percent. In July 1983, the mineral concentration south of the causeway was only about 9 percent. At this salinity, which is about two and one-half times that of sea water, the famed buoyancy of Great Salt Lake was considerably diminished.
CONCLUSIONS
The surface level of Great Salt Lake fluctuates in dynamic equilibrium between inflow and outflow. Although man's use of water has affected the level somewhat, the greatest changes result from natural variations in climate. This was vividly demonstrated between September 18, 1982, and June 30, 1983, when a recordbreaking rise of the lake (5.2 feet) resulted from greater than average rainfall in 1982, greater than average snowfall from the autumn of 1982 through the spring of
Upper south brine
Lower south brine
A
Upper south brine
B
----N
-North brine
Bottom of culvert
North brine
Dashed I i nes rep resent
position of interface
FIGURE 17.-Schematic drawing of railroad causeway showing direction of flow (A) through the culverts and (B) through the permeable fill (adapted from Madison, 1970, fig. 6).
21
1983, and unseasonably cool weather during that spring.
The lake level tends to stabilize after any major rise (decline) because of the ensuing increase (decrease) of evaporation that results from the increase (decrease) of lake-surface area and decrease (increase) of salinity of the brine. Thus, unless climatic conditions or man's activities affecting the lake change significantly from those that occurred between 1847-1983, the lake would not be expected either to become dry or to rise above the historically recorded high level.
REFERENCES CITED
Arnow, Ted, 1978, Water budget and water-surface fluctuations, Great Salt Lake, Utah: U.S. Geological Survey Open-File Report 7&--912, 21 p.
Arnow, Ted, and Mundorff, J. C., 1972, The Great Salt Lake and Utah's water resources: Proceedings of the First Annual Conference of the Utah Section of the American Water Resources Association, Salt Lake City, Utah, p. 29-40.
Arnow, Ted, and Stephens, J. C., 1975, Ground-water inflow to Great Salt Lake, Utah: Geological Society of America Abstracts with Programs, 1975 annual meeting, p. 981.
Crittenden, M. D., Jr., 1963, New data on the isostatic deformation of Lake Bonneville: U.S. Geological Survey Professional Paper 454-E, 31 p.
Currey, D. R., 1980, Coastal geomorphology of Great Salt Lake and vicinity: Utah Geological and Mineral Survey Bulletin 116, p. 69--82.
Gilbert, G. K., 1890, Lake Bonneville: U.S. Geological Survey Monograph 1, 438 p.
Gwynn, J. W., ed., 1980, Great Salt Lake, a scientific, historical, and economic overview: Utah Geological and Mineral Survey Bulletin 116, 400 p.
Hahl, D. C., and Handy, A. H., 1969, Great Salt Lake, UtahChemical and physical variations of the brine, 1963-66: Utah Geological and Mineralogical Survey Water-Resources Bulletin 12, 33 p.
Hahl, D. C., and Langford, R. H., 1964, Dissolved-mineral inflow to Great Salt Lake and chemical characteristics of the Salt Lake brine: Utah Geological and Mineralogical Survey Water-Resources Bulletin 3-Part II, 40 p.
Harrison, R. L., 1969, Shaded-relief map of the United States: U.S. Geological Survey National Atlas Series, scale 1:7,500,000.
Madison, R. J., 1970, Effects of a causeway on the chemistry of the brine in Great Salt Lake, Utah: Utah Geological and Mineralogical Survey Water-Resurces Bulletin 14, 52 p.
Miller, D. E., 1980, Great Salt Lake-A historical sketch: Utah Geological and Mineral Survey Bulletin 116, p. 1-14.
Scott, W. E., Schroba, R. R., and McCoy, W. D., 1982, Guidebook for the 1982 Friends of the Pleistocene, Rocky Mountain Cell, field trip to Little Valley and Jordan Valley, Utah: U.S. Geological Survey Open-File Report 82-845, 59 p.

Spencer, R. J., Eugster, H. P., Jones, B. F., Baedecker, M. J., Rubin, Meyer, Rettig, S. L., Kelts, Kerry, McKenzie, Judy, Forester, Rick, Goldhaber, Marty, Madsen, D. B., and Bowser, C. J., 1983, Late Pleistocene and Holocene sedimentary history of Great Salt Lake, Utah: Geological Society of America Abstracts with Programs, 36th annual meeting of Rocky Mountain Section, p. 301.
Sturm, P. A., 1980, The Great Salt Lake brine system: Utah Geological and Mineral Survey Bulletin 116, p. 147-162.
Utah Division of State Lands and Forestry, 1983, Great Salt Lake contingency plan: Utah Department of Natural Resources, Salt Lake City, Utah, 47 p.
Waddell, K. M., and Barton, J. D., 1980, Estimated inflow and evaporation for Great Salt Lake, Utah, 1931-76, with revised model for evaluating the effects of dikes on the
22
water and salt balance of the lake: Utah Division of Water Resources Cooperative Investigation Report No. 20, 57 p.
Waddell, K. M., and Fields, F. K., 1977, Model for evaluating the effects of dikes on the water and salt balance of Great Salt Lake, Utah: Utah Geological and Mineral Survey Water-Resources Bulletin 21, 54 p.
Whaley, B. L., 1983, Water supply outlook for Utah, June 1, 1983: Salt Lake City, U.S. Soil Conservation Service, 32p.
Whitaker, G. L., 1971, Changes in the elevation of Great Salt Lake caused by man's activities in the drainage basin, in Geological Survey Research 1971: U.S. Geological Survey Professional Paper 750-D, p. D187-189.
U.S. GOVERNMENT PRINTING OFFICE: 1984-776-041/4005 REGION NO.8