greater los angeles market update | 3-month ending may 2014
DESCRIPTION
ÂTRANSCRIPT

Greater Los Angeles Market Update3-Month Ending May 2014
Beverly Hills | Brentwood | Los Feliz | MalibuPacific Palisades | Santa Monica | Sunset Strip sothebyshomes.com/losangeles
Malibu, CA | web: 0308014
To view our listings please visit sothebyshomes.com/losangeles
Sotheby’s International Realty and the Sotheby’s International Realty logo are registered (or unregistered) service marks used with permission. Operated by Sotheby’s International Realty, Inc. If your property is listed with a real estate broker, please disregard. It is not our intention to solicit the offerings of other real estate brokers. We are happy to work with them and cooperate fully. Real estate agents affiliated with Sotheby’s International Realty, Inc. are independent contractor sales associates and are not employees of Sotheby’s International Realty, Inc.
TABLE OF CONTENTS
MARKET AREA PGS.
Bel Air - Holmby Hills 4-5
Beverly Center - Miracle Mile 6-7
Beverly Hills 8-9
Beverly Hills Post Office 10-11
Beverlywood 12-13
Brentwood 14-15
Cheviot Hills - Rancho Park 16-17
Culver City 18-19
Downtown Los Angeles 20-21
Eagle Rock 22-23
Hancock Park 24-25
Hollywood 26-27
Hollywood Hills East 28-29
Los Feliz 30-31
Malibu 32-33
Malibu Beach 34-35
MARKET AREA PGS.
Marina Del Rey 36-37
Mid Los Angeles 38-39
Mid Wilshire 40-41
Mount Washington 42-43
Pacific Palisades 44-45
Palms - Mar Vista 46-47
Playa Del Rey 48-49
Playa Vista 50-51
Santa Monica 52-53
Silverlake - Echo Park 54-55
Sunset Strip - Hlwd Hills 56-57
Venice 58-59
West Hollywood 60-61
West Los Angeles 62-63
Westwood - Century City 64-65
Visit us in OuR stORe OR Online. Our specialists will help you shop for the best wines for all occasions.
Available for immediate delivery.
1334 YORk AVenue At 72nd stReet, nY, nY 10021 | MOndAY tO FRidAY 10AM – 7PM, sAtuRdAY 10AM – 6PM
Sothebyswine.com

Visit us in OuR stORe OR Online. Our specialists will help you shop for the best wines for all occasions.
Available for immediate delivery.
1334 YORk AVenue At 72nd stReet, nY, nY 10021 | MOndAY tO FRidAY 10AM – 7PM, sAtuRdAY 10AM – 6PM
Sothebyswine.com
4
SINGLE FAMILY HOME SALES
BEVERLY HILLS | BRENTWOOD | LOS FELIZ | MALIBU | PACIFIC PALISADES SANTA MONICA | SUNSET STRIP | sothebyshomes.com/losangeles
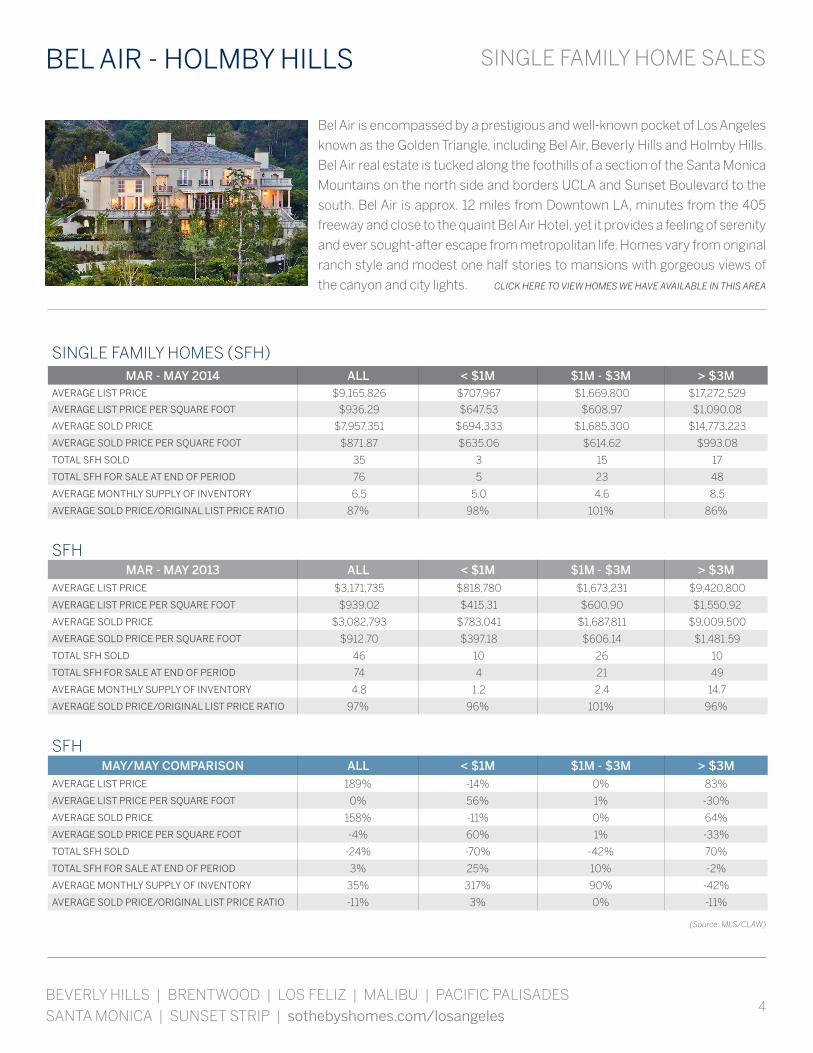
Bel Air is encompassed by a prestigious and well-known pocket of Los Angeles
known as the Golden Triangle, including Bel Air, Beverly Hills and Holmby Hills.
Bel Air real estate is tucked along the foothills of a section of the Santa Monica
Mountains on the north side and borders UCLA and Sunset Boulevard to the
south. Bel Air is approx. 12 miles from Downtown LA, minutes from the 405
freeway and close to the quaint Bel Air Hotel, yet it provides a feeling of serenity
and ever sought-after escape from metropolitan life. Homes vary from original
ranch style and modest one half stories to mansions with gorgeous views of
the canyon and city lights. CLICK HERE TO VIEW HOMES WE HAVE AVAILABLE IN THIS AREA
BEL AIR - HOLMBY HILLS
SINGLE FAMILY HOMES (SFH)MAR - MAY 2014 ALL < $1M $1M - $3M > $3M
AVERAGE LIST PRICE $9,165,826 $707,967 $1,669,800 $17,272,529
AVERAGE LIST PRICE PER SQUARE FOOT $936.29 $647.53 $608.97 $1,090.08
AVERAGE SOLD PRICE $7,957,351 $694,333 $1,685,300 $14,773,223
AVERAGE SOLD PRICE PER SQUARE FOOT $871.87 $635.06 $614.62 $993.08
TOTAL SFH SOLD 35 3 15 17
TOTAL SFH FOR SALE AT END OF PERIOD 76 5 23 48
AVERAGE MONTHLY SUPPLY OF INVENTORY 6.5 5.0 4.6 8.5
AVERAGE SOLD PRICE/ORIGINAL LIST PRICE RATIO 87% 98% 101% 86%
SFHMAR - MAY 2013 ALL < $1M $1M - $3M > $3M
AVERAGE LIST PRICE $3,171,735 $818,780 $1,673,231 $9,420,800
AVERAGE LIST PRICE PER SQUARE FOOT $939.02 $415.31 $600.90 $1,550.92
AVERAGE SOLD PRICE $3,082,793 $783,041 $1,687,811 $9,009,500
AVERAGE SOLD PRICE PER SQUARE FOOT $912.70 $397.18 $606.14 $1,481.59
TOTAL SFH SOLD 46 10 26 10
TOTAL SFH FOR SALE AT END OF PERIOD 74 4 21 49
AVERAGE MONTHLY SUPPLY OF INVENTORY 4.8 1.2 2.4 14.7
AVERAGE SOLD PRICE/ORIGINAL LIST PRICE RATIO 97% 96% 101% 96%
SFHMAY/MAY COMPARISON ALL < $1M $1M - $3M > $3M
AVERAGE LIST PRICE 189% -14% 0% 83%
AVERAGE LIST PRICE PER SQUARE FOOT 0% 56% 1% -30%
AVERAGE SOLD PRICE 158% -11% 0% 64%
AVERAGE SOLD PRICE PER SQUARE FOOT -4% 60% 1% -33%
TOTAL SFH SOLD -24% -70% -42% 70%
TOTAL SFH FOR SALE AT END OF PERIOD 3% 25% 10% -2%
AVERAGE MONTHLY SUPPLY OF INVENTORY 35% 317% 90% -42%
AVERAGE SOLD PRICE/ORIGINAL LIST PRICE RATIO -11% 3% 0% -11%
(Source: MLS/CLAW)

5
CONDOMINIUM SALES BEL AIR - HOLMBY HILLS
In Bel Air - Holmby Hills there were 15 single family home sales in May 2014, up from 10 in May 2013 and a 400% increase
from the 3 sales closed last month. The average list price for single family home sales in May 2014 was $7,095,867
compared to $3,031,000 for May 2013, representing a 134% increase. For the three-month period from March to May
2014, the average list price was 189% higher than the same period of the prior year. Average sales price for May 2014 was
$6,274,953, compared to that of March through May 2014, which was $7,957,351. Comparing May 2014 to April 2014, Bel
Air - Holmby Hills saw a 17% decrease in average sale price, but a 107% increase compared to same month of the prior
year.
CONDOMINIUMS (CONDOS)MAR - MAY 2014 ALL < $1M $1M - $3M > $3M
AVERAGE LIST PRICE $- $- $- $-
AVERAGE LIST PRICE PER SQUARE FOOT $- $- $- $-
AVERAGE SOLD PRICE $- $- $- $-
AVERAGE SOLD PRICE PER SQUARE FOOT $- $- $- $-
TOTAL CONDOS SOLD - - - -
TOTAL CONDOS FOR SALE AT END OF PERIOD - - - -
AVERAGE MONTHLY SUPPLY OF INVENTORY - - - -
AVERAGE SOLD PRICE/ORIGINAL LIST PRICE RATIO 0% 0% 0% 0%
CONDOSMAR - MAY 2013 ALL < $1M $1M - $3M > $3M
AVERAGE LIST PRICE $599,000 $599,000 $- $-
AVERAGE LIST PRICE PER SQUARE FOOT $360.41 $360.41 $- $-
AVERAGE SOLD PRICE $610,500 $610,500 $- $-
AVERAGE SOLD PRICE PER SQUARE FOOT $367.33 $367.33 $- $-
TOTAL CONDOS SOLD 1 1 - -
TOTAL CONDOS FOR SALE AT END OF PERIOD - - - -
AVERAGE MONTHLY SUPPLY OF INVENTORY - - - -
AVERAGE SOLD PRICE/ORIGINAL LIST PRICE RATIO 102% 102% 0% 0%
CONDOSMAY/MAY COMPARISON ALL < $1M $1M - $3M > $3M
AVERAGE LIST PRICE -100% -100% 0% 0%
AVERAGE LIST PRICE PER SQUARE FOOT -100% -100% 0% 0%
AVERAGE SOLD PRICE -100% -100% 0% 0%
AVERAGE SOLD PRICE PER SQUARE FOOT -100% -100% 0% 0%
TOTAL CONDOS SOLD -100% -100% 0% 0%
TOTAL CONDOS FOR SALE AT END OF PERIOD 0% 0% 0% 0%
AVERAGE MONTHLY SUPPLY OF INVENTORY 0% 0% 0% 0%
AVERAGE SOLD PRICE/ORIGINAL LIST PRICE RATIO -100% -100% 0% 0%
(Source: MLS/CLAW)
MAY MARKET OVERVIEW
6
SINGLE FAMILY HOME SALES
BEVERLY HILLS | BRENTWOOD | LOS FELIZ | MALIBU | PACIFIC PALISADES SANTA MONICA | SUNSET STRIP | sothebyshomes.com/losangeles
BEVERLY CENTER - MIRACLE MILE
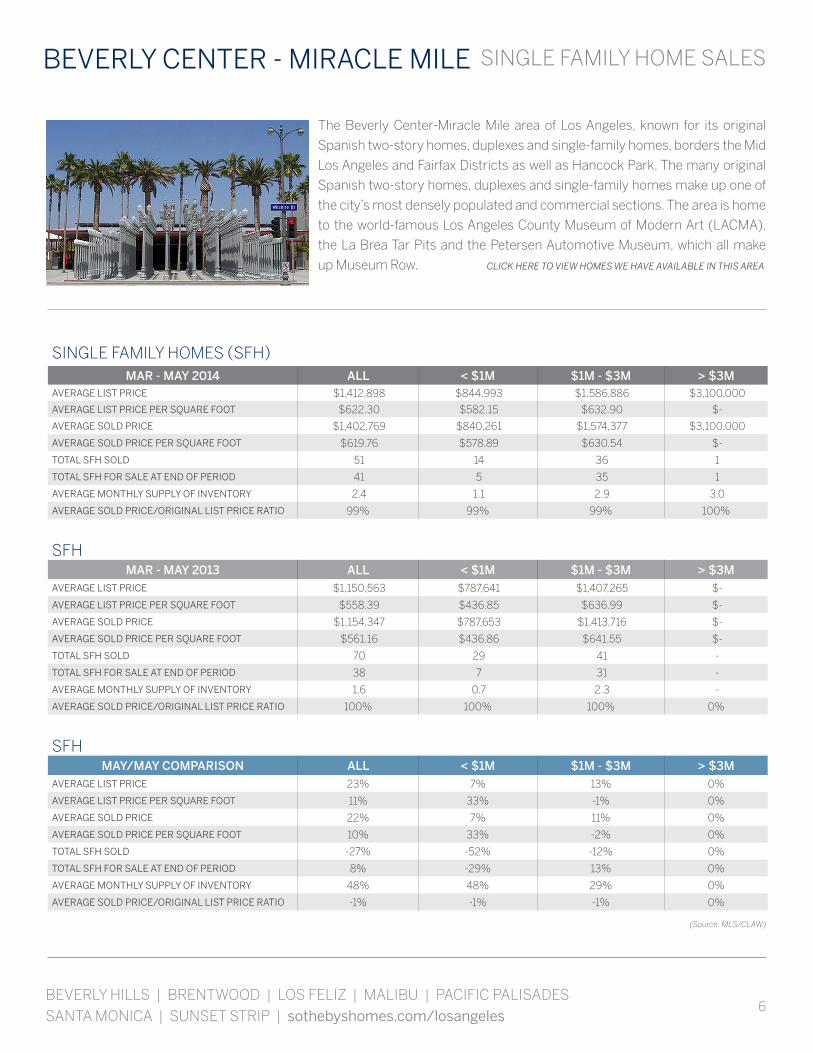
The Beverly Center-Miracle Mile area of Los Angeles, known for its original
Spanish two-story homes, duplexes and single-family homes, borders the Mid
Los Angeles and Fairfax Districts as well as Hancock Park. The many original
Spanish two-story homes, duplexes and single-family homes make up one of
the city’s most densely populated and commercial sections. The area is home
to the world-famous Los Angeles County Museum of Modern Art (LACMA),
the La Brea Tar Pits and the Petersen Automotive Museum, which all make
up Museum Row. CLICK HERE TO VIEW HOMES WE HAVE AVAILABLE IN THIS AREA
SINGLE FAMILY HOMES (SFH)MAR - MAY 2014 ALL < $1M $1M - $3M > $3M
AVERAGE LIST PRICE $1,412,898 $844,993 $1,586,886 $3,100,000
AVERAGE LIST PRICE PER SQUARE FOOT $622.30 $582.15 $632.90 $-
AVERAGE SOLD PRICE $1,402,769 $840,261 $1,574,377 $3,100,000
AVERAGE SOLD PRICE PER SQUARE FOOT $619.76 $578.89 $630.54 $-
TOTAL SFH SOLD 51 14 36 1
TOTAL SFH FOR SALE AT END OF PERIOD 41 5 35 1
AVERAGE MONTHLY SUPPLY OF INVENTORY 2.4 1.1 2.9 3.0
AVERAGE SOLD PRICE/ORIGINAL LIST PRICE RATIO 99% 99% 99% 100%
SFHMAR - MAY 2013 ALL < $1M $1M - $3M > $3M
AVERAGE LIST PRICE $1,150,563 $787,641 $1,407,265 $-
AVERAGE LIST PRICE PER SQUARE FOOT $558.39 $436.85 $636.99 $-
AVERAGE SOLD PRICE $1,154,347 $787,653 $1,413,716 $-
AVERAGE SOLD PRICE PER SQUARE FOOT $561.16 $436.86 $641.55 $-
TOTAL SFH SOLD 70 29 41 -
TOTAL SFH FOR SALE AT END OF PERIOD 38 7 31 -
AVERAGE MONTHLY SUPPLY OF INVENTORY 1.6 0.7 2.3 -
AVERAGE SOLD PRICE/ORIGINAL LIST PRICE RATIO 100% 100% 100% 0%
SFHMAY/MAY COMPARISON ALL < $1M $1M - $3M > $3M
AVERAGE LIST PRICE 23% 7% 13% 0%
AVERAGE LIST PRICE PER SQUARE FOOT 11% 33% -1% 0%
AVERAGE SOLD PRICE 22% 7% 11% 0%
AVERAGE SOLD PRICE PER SQUARE FOOT 10% 33% -2% 0%
TOTAL SFH SOLD -27% -52% -12% 0%
TOTAL SFH FOR SALE AT END OF PERIOD 8% -29% 13% 0%
AVERAGE MONTHLY SUPPLY OF INVENTORY 48% 48% 29% 0%
AVERAGE SOLD PRICE/ORIGINAL LIST PRICE RATIO -1% -1% -1% 0%
(Source: MLS/CLAW)

7
CONDOMINIUM SALES
MAY MARKET OVERVIEW
BEVERLY CENTER - MIRACLE MILE
In Beverly Center - Miracle Mile there were 21 single family home sales in May 2014, down from 31 in May 2013 and a
62% increase from the 13 sales closed last month. The average list price for single family home sales in May 2014 was
$1,438,810 compared to $1,227,756 for May 2013, representing a 17% increase. For the three-month period from March to
May 2014, the average list price was 23% higher than the same period of the prior year. Average sales price for May 2014
was $1,411,456, compared to that of March through May 2014, which was $1,402,769. Comparing May 2014 to April 2014,
Beverly Center - Miracle Mile saw a 5% decrease in average sale price, but a 16% increase compared to same month of
the prior year.
CONDOMINIUMS (CONDOS)MAR - MAY 2014 ALL < $1M $1M - $3M > $3M
AVERAGE LIST PRICE $711,318 $671,043 $1,174,475 $-
AVERAGE LIST PRICE PER SQUARE FOOT $503.18 $485.77 $652.12 $-
AVERAGE SOLD PRICE $701,480 $662,478 $1,150,000 $-
AVERAGE SOLD PRICE PER SQUARE FOOT $496.62 $480.03 $638.53 $-
TOTAL CONDOS SOLD 25 23 2 -
TOTAL CONDOS FOR SALE AT END OF PERIOD - - - -
AVERAGE MONTHLY SUPPLY OF INVENTORY - - - -
AVERAGE SOLD PRICE/ORIGINAL LIST PRICE RATIO 99% 99% 98% 0%
CONDOSMAR - MAY 2013 ALL < $1M $1M - $3M > $3M
AVERAGE LIST PRICE $571,471 $571,471 $- $-
AVERAGE LIST PRICE PER SQUARE FOOT $458.41 $458.41 $- $-
AVERAGE SOLD PRICE $559,353 $559,353 $- $-
AVERAGE SOLD PRICE PER SQUARE FOOT $448.69 $448.69 $- $-
TOTAL CONDOS SOLD 17 17 - -
TOTAL CONDOS FOR SALE AT END OF PERIOD 16 16 - -
AVERAGE MONTHLY SUPPLY OF INVENTORY 2.8 2.8 - -
AVERAGE SOLD PRICE/ORIGINAL LIST PRICE RATIO 98% 98% 0% 0%
CONDOSMAY/MAY COMPARISON ALL < $1M $1M - $3M > $3M
AVERAGE LIST PRICE 24% 17% 0% 0%
AVERAGE LIST PRICE PER SQUARE FOOT 10% 6% 0% 0%
AVERAGE SOLD PRICE 25% 18% 0% 0%
AVERAGE SOLD PRICE PER SQUARE FOOT 11% 7% 0% 0%
TOTAL CONDOS SOLD 47% 35% 0% 0%
TOTAL CONDOS FOR SALE AT END OF PERIOD -100% -100% 0% 0%
AVERAGE MONTHLY SUPPLY OF INVENTORY -100% -100% 0% 0%
AVERAGE SOLD PRICE/ORIGINAL LIST PRICE RATIO 1% 1% 0% 0%
(Source: MLS/CLAW)

8
SINGLE FAMILY HOME SALES
BEVERLY HILLS | BRENTWOOD | LOS FELIZ | MALIBU | PACIFIC PALISADES SANTA MONICA | SUNSET STRIP | sothebyshomes.com/losangeles
BEVERLY HILLS
Beverly Hill, located within the Golden Triangle, is nestle up against the foothills of the
Santa Monica Mountains on the north side. Beverly Hills is bordered by Westwood
Village and Century City on the west, West Hollywood and Fairfax District on the east,
and Los Angeles City and the 10 freeway on the South. Rodeo Drive between Wilshire
Boulevard and Sunset Boulevard include not only the ultimate shopping mecca,
but an area of large homes referred to as the Flats,. The blocks were designed by
landscape architect William D. Cook, with large lots and wide curving streets lined with
palm, eucalyptus and acacia trees and a three-block 80-foot-wide park running along
Santa Monica Boulevard. CLICK HERE TO VIEW HOMES WE HAVE AVAILABLE IN THIS AREA
SINGLE FAMILY HOMES (SFH)MAR - MAY 2014 ALL < $1M $1M - $3M > $3M
AVERAGE LIST PRICE $5,736,292 $- $2,113,611 $7,909,900
AVERAGE LIST PRICE PER SQUARE FOOT $1,323.79 $- $803.60 $1,508.97
AVERAGE SOLD PRICE $5,460,604 $- $2,137,637 $7,454,383
AVERAGE SOLD PRICE PER SQUARE FOOT $1,268.68 $- $813.25 $1,430.81
TOTAL SFH SOLD 48 - 18 30
TOTAL SFH FOR SALE AT END OF PERIOD 59 - 9 50
AVERAGE MONTHLY SUPPLY OF INVENTORY 3.7 - 1.5 5.0
AVERAGE SOLD PRICE/ORIGINAL LIST PRICE RATIO 95% 0% 101% 94%
SFHMAR - MAY 2013 ALL < $1M $1M - $3M > $3M
AVERAGE LIST PRICE $4,914,721 $800,000 $1,862,214 $6,378,778
AVERAGE LIST PRICE PER SQUARE FOOT $1,145.05 $459.51 $740.84 $1,238.61
AVERAGE SOLD PRICE $4,824,207 $804,000 $1,854,092 $6,249,264
AVERAGE SOLD PRICE PER SQUARE FOOT $1,123.97 $461.80 $737.61 $1,213.46
TOTAL SFH SOLD 47 1 14 32
TOTAL SFH FOR SALE AT END OF PERIOD 71 - 14 57
AVERAGE MONTHLY SUPPLY OF INVENTORY 4.5 - 3.0 5.3
AVERAGE SOLD PRICE/ORIGINAL LIST PRICE RATIO 98% 101% 100% 98%
SFHMAY/MAY COMPARISON ALL < $1M $1M - $3M > $3M
AVERAGE LIST PRICE 17% -100% 13% 24%
AVERAGE LIST PRICE PER SQUARE FOOT 16% -100% 8% 22%
AVERAGE SOLD PRICE 13% -100% 15% 19%
AVERAGE SOLD PRICE PER SQUARE FOOT 13% -100% 10% 18%
TOTAL SFH SOLD 2% -100% 29% -6%
TOTAL SFH FOR SALE AT END OF PERIOD -17% 0% -36% -12%
AVERAGE MONTHLY SUPPLY OF INVENTORY -19% 0% -50% -6%
AVERAGE SOLD PRICE/ORIGINAL LIST PRICE RATIO -3% -100% 2% -4%
(Source: MLS/CLAW)
9
CONDOMINIUM SALES
MAY MARKET OVERVIEW
BEVERLY HILLS
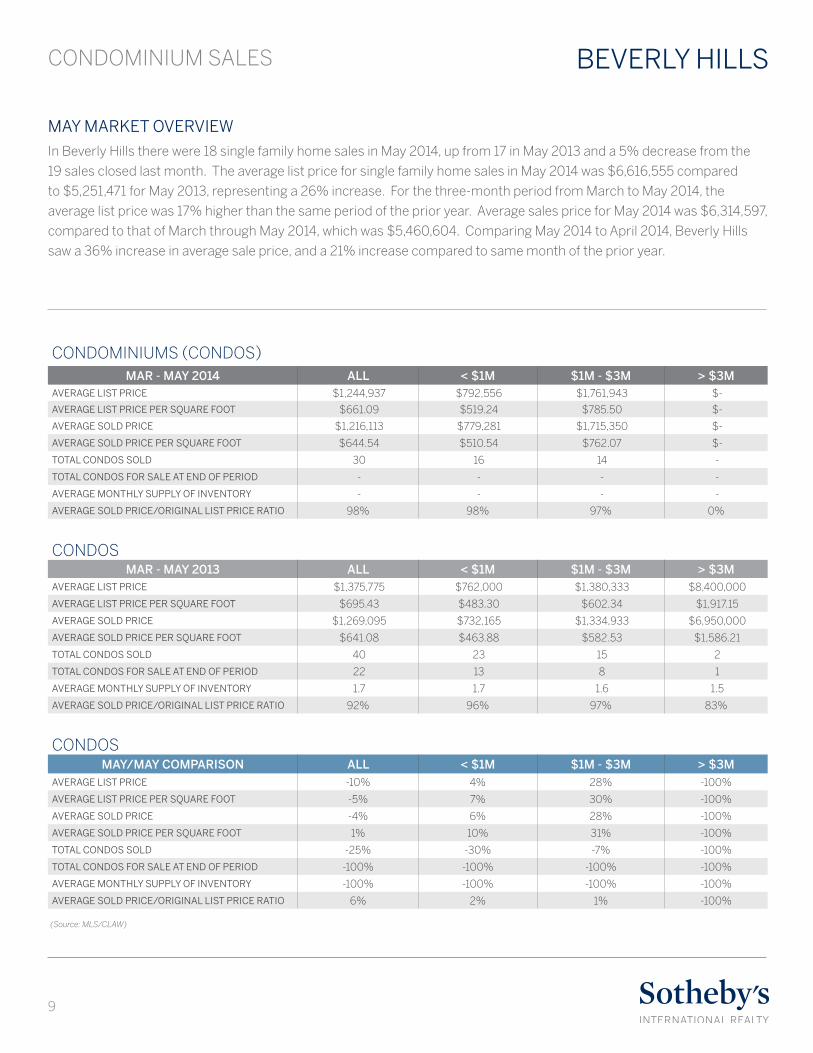
In Beverly Hills there were 18 single family home sales in May 2014, up from 17 in May 2013 and a 5% decrease from the
19 sales closed last month. The average list price for single family home sales in May 2014 was $6,616,555 compared
to $5,251,471 for May 2013, representing a 26% increase. For the three-month period from March to May 2014, the
average list price was 17% higher than the same period of the prior year. Average sales price for May 2014 was $6,314,597,
compared to that of March through May 2014, which was $5,460,604. Comparing May 2014 to April 2014, Beverly Hills
saw a 36% increase in average sale price, and a 21% increase compared to same month of the prior year.
CONDOMINIUMS (CONDOS)MAR - MAY 2014 ALL < $1M $1M - $3M > $3M
AVERAGE LIST PRICE $1,244,937 $792,556 $1,761,943 $-
AVERAGE LIST PRICE PER SQUARE FOOT $661.09 $519.24 $785.50 $-
AVERAGE SOLD PRICE $1,216,113 $779,281 $1,715,350 $-
AVERAGE SOLD PRICE PER SQUARE FOOT $644.54 $510.54 $762.07 $-
TOTAL CONDOS SOLD 30 16 14 -
TOTAL CONDOS FOR SALE AT END OF PERIOD - - - -
AVERAGE MONTHLY SUPPLY OF INVENTORY - - - -
AVERAGE SOLD PRICE/ORIGINAL LIST PRICE RATIO 98% 98% 97% 0%
CONDOSMAR - MAY 2013 ALL < $1M $1M - $3M > $3M
AVERAGE LIST PRICE $1,375,775 $762,000 $1,380,333 $8,400,000
AVERAGE LIST PRICE PER SQUARE FOOT $695.43 $483.30 $602.34 $1,917.15
AVERAGE SOLD PRICE $1,269,095 $732,165 $1,334,933 $6,950,000
AVERAGE SOLD PRICE PER SQUARE FOOT $641.08 $463.88 $582.53 $1,586.21
TOTAL CONDOS SOLD 40 23 15 2
TOTAL CONDOS FOR SALE AT END OF PERIOD 22 13 8 1
AVERAGE MONTHLY SUPPLY OF INVENTORY 1.7 1.7 1.6 1.5
AVERAGE SOLD PRICE/ORIGINAL LIST PRICE RATIO 92% 96% 97% 83%
CONDOSMAY/MAY COMPARISON ALL < $1M $1M - $3M > $3M
AVERAGE LIST PRICE -10% 4% 28% -100%
AVERAGE LIST PRICE PER SQUARE FOOT -5% 7% 30% -100%
AVERAGE SOLD PRICE -4% 6% 28% -100%
AVERAGE SOLD PRICE PER SQUARE FOOT 1% 10% 31% -100%
TOTAL CONDOS SOLD -25% -30% -7% -100%
TOTAL CONDOS FOR SALE AT END OF PERIOD -100% -100% -100% -100%
AVERAGE MONTHLY SUPPLY OF INVENTORY -100% -100% -100% -100%
AVERAGE SOLD PRICE/ORIGINAL LIST PRICE RATIO 6% 2% 1% -100%
(Source: MLS/CLAW)
10
SINGLE FAMILY HOME SALES
BEVERLY HILLS | BRENTWOOD | LOS FELIZ | MALIBU | PACIFIC PALISADES SANTA MONICA | SUNSET STRIP | sothebyshomes.com/losangeles
BEVERLY HILLS POST OFFICE
Beverly Hills Post Office is home to grand estates, mansions and large
traditional homes as well as some of the most celebrated gated communities
in the area, including Mulholland Estates, The Summit, Beverly Ridge Estates
and perhaps the most famous, Beverly Park. Lying outside of the City of
Beverly Hills limits, Beverly Hills Post Office is part of Los Angeles, but is
assigned to use the postal services of Beverly Hills, which started in the early
1960s. Within the area some of the most desired grand estates, mansions
and large traditional homes in all of Southern California can be found.CLICK HERE TO VIEW HOMES WE HAVE AVAILABLE IN THIS AREA
SINGLE FAMILY HOMES (SFH)MAR - MAY 2014 ALL < $1M $1M - $3M > $3M
AVERAGE LIST PRICE $4,109,773 $883,500 $2,119,500 $7,901,750
AVERAGE LIST PRICE PER SQUARE FOOT $869.85 $626.82 $662.82 $1,055.13
AVERAGE SOLD PRICE $3,812,580 $884,750 $2,035,871 $7,209,602
AVERAGE SOLD PRICE PER SQUARE FOOT $822.97 $627.70 $636.67 $988.28
TOTAL SFH SOLD 44 4 24 16
TOTAL SFH FOR SALE AT END OF PERIOD 83 3 38 42
AVERAGE MONTHLY SUPPLY OF INVENTORY 5.7 2.3 4.8 7.9
AVERAGE SOLD PRICE/ORIGINAL LIST PRICE RATIO 93% 100% 96% 91%
SFHMAR - MAY 2013 ALL < $1M $1M - $3M > $3M
AVERAGE LIST PRICE $3,018,896 $924,500 $1,998,151 $5,932,231
AVERAGE LIST PRICE PER SQUARE FOOT $676.73 $508.53 $604.05 $770.91
AVERAGE SOLD PRICE $2,880,958 $905,000 $1,912,325 $5,643,791
AVERAGE SOLD PRICE PER SQUARE FOOT $645.87 $497.80 $577.48 $734.08
TOTAL SFH SOLD 48 2 33 13
TOTAL SFH FOR SALE AT END OF PERIOD 82 2 35 45
AVERAGE MONTHLY SUPPLY OF INVENTORY 5.1 3.0 3.2 10.4
AVERAGE SOLD PRICE/ORIGINAL LIST PRICE RATIO 95% 98% 96% 95%
SFHMAY/MAY COMPARISON ALL < $1M $1M - $3M > $3M
AVERAGE LIST PRICE 36% -4% 6% 33%
AVERAGE LIST PRICE PER SQUARE FOOT 29% 23% 10% 37%
AVERAGE SOLD PRICE 32% -2% 6% 28%
AVERAGE SOLD PRICE PER SQUARE FOOT 27% 26% 10% 35%
TOTAL SFH SOLD -8% 100% -27% 23%
TOTAL SFH FOR SALE AT END OF PERIOD 1% 50% 9% -7%
AVERAGE MONTHLY SUPPLY OF INVENTORY 10% -25% 49% -24%
AVERAGE SOLD PRICE/ORIGINAL LIST PRICE RATIO -3% 2% 0% -4%
(Source: MLS/CLAW)
11
CONDOMINIUM SALES
MAY MARKET OVERVIEW
BEVERLY HILLS POST OFFICE
In Beverly Hills Post Office there were 15 single family home sales in May 2014, up from 13 in May 2013 and a 12% decrease
from the 17 sales closed last month. The average list price for single family home sales in May 2014 was $2,226,933
compared to $3,129,923 for May 2013, representing a 29% decrease. For the three-month period from March to May
2014, the average list price was 36% higher than the same period of the prior year. Average sales price for May 2014 was
$2,171,308, compared to that of March through May 2014, which was $3,812,580. Comparing May 2014 to April 2014,
Beverly Hills Post Office saw a 46% decrease in average sale price, and a 26% decrease compared to same month of the
prior year.
CONDOMINIUMS (CONDOS)MAR - MAY 2014 ALL < $1M $1M - $3M > $3M
AVERAGE LIST PRICE $- $- $- $-
AVERAGE LIST PRICE PER SQUARE FOOT $- $- $- $-
AVERAGE SOLD PRICE $- $- $- $-
AVERAGE SOLD PRICE PER SQUARE FOOT $- $- $- $-
TOTAL CONDOS SOLD - - - -
TOTAL CONDOS FOR SALE AT END OF PERIOD - - - -
AVERAGE MONTHLY SUPPLY OF INVENTORY - - - -
AVERAGE SOLD PRICE/ORIGINAL LIST PRICE RATIO 0% 0% 0% 0%
CONDOSMAR - MAY 2013 ALL < $1M $1M - $3M > $3M
AVERAGE LIST PRICE $- $- $- $-
AVERAGE LIST PRICE PER SQUARE FOOT $- $- $- $-
AVERAGE SOLD PRICE $- $- $- $-
AVERAGE SOLD PRICE PER SQUARE FOOT $- $- $- $-
TOTAL CONDOS SOLD - - - -
TOTAL CONDOS FOR SALE AT END OF PERIOD - - - -
AVERAGE MONTHLY SUPPLY OF INVENTORY - - - -
AVERAGE SOLD PRICE/ORIGINAL LIST PRICE RATIO 0% 0% 0% 0%
CONDOSMAY/MAY COMPARISON ALL < $1M $1M - $3M > $3M
AVERAGE LIST PRICE 0% 0% 0% 0%
AVERAGE LIST PRICE PER SQUARE FOOT 0% 0% 0% 0%
AVERAGE SOLD PRICE 0% 0% 0% 0%
AVERAGE SOLD PRICE PER SQUARE FOOT 0% 0% 0% 0%
TOTAL CONDOS SOLD 0% 0% 0% 0%
TOTAL CONDOS FOR SALE AT END OF PERIOD 0% 0% 0% 0%
AVERAGE MONTHLY SUPPLY OF INVENTORY 0% 0% 0% 0%
AVERAGE SOLD PRICE/ORIGINAL LIST PRICE RATIO 0% 0% 0% 0%
(Source: MLS/CLAW)
12
SINGLE FAMILY HOME SALES
BEVERLY HILLS | BRENTWOOD | LOS FELIZ | MALIBU | PACIFIC PALISADES SANTA MONICA | SUNSET STRIP | sothebyshomes.com/losangeles
Beverlywood is an upscale neighborhood in Los Angeles strategically placed
near the heart of one of the world’s largest cities, and is the ideal home for
anyone from couples raising families to retirees. The community is friendly
and features tree-lined streets, lush green parks, fancy storefronts, sidewalk
delis and cozy cafes for its residents. Almost all of Beverlywood’s inhabitants
live in single-family homes built between the 1920s and the 1950s, with the
oldest homes in the areas near Beverly Hills. Beverlywood residents enjoy an
upscale community of homes constructed from 1920s through the 1950s. CLICK HERE TO VIEW HOMES WE HAVE AVAILABLE IN THIS AREA
BEVERLYWOOD
SINGLE FAMILY HOMES (SFH)MAR - MAY 2014 ALL < $1M $1M - $3M > $3M
AVERAGE LIST PRICE $1,134,028 $744,277 $1,648,500 $-
AVERAGE LIST PRICE PER SQUARE FOOT $569.27 $498.01 $622.34 $-
AVERAGE SOLD PRICE $1,118,403 $736,939 $1,621,935 $-
AVERAGE SOLD PRICE PER SQUARE FOOT $561.42 $493.10 $612.31 $-
TOTAL SFH SOLD 58 33 25 -
TOTAL SFH FOR SALE AT END OF PERIOD 45 25 20 -
AVERAGE MONTHLY SUPPLY OF INVENTORY 2.3 2.3 2.4 -
AVERAGE SOLD PRICE/ORIGINAL LIST PRICE RATIO 99% 99% 98% 0%
SFHMAR - MAY 2013 ALL < $1M $1M - $3M > $3M
AVERAGE LIST PRICE $799,704 $671,860 $1,493,714 $-
AVERAGE LIST PRICE PER SQUARE FOOT $471.78 $468.29 $480.54 $-
AVERAGE SOLD PRICE $793,277 $674,196 $1,439,714 $-
AVERAGE SOLD PRICE PER SQUARE FOOT $467.99 $469.92 $463.16 $-
TOTAL SFH SOLD 45 38 7 -
TOTAL SFH FOR SALE AT END OF PERIOD 22 15 6 1
AVERAGE MONTHLY SUPPLY OF INVENTORY 1.5 1.2 2.6 -
AVERAGE SOLD PRICE/ORIGINAL LIST PRICE RATIO 99% 100% 96% 0%
SFHMAY/MAY COMPARISON ALL < $1M $1M - $3M > $3M
AVERAGE LIST PRICE 42% 11% 10% 0%
AVERAGE LIST PRICE PER SQUARE FOOT 21% 6% 30% 0%
AVERAGE SOLD PRICE 41% 9% 13% 0%
AVERAGE SOLD PRICE PER SQUARE FOOT 20% 5% 32% 0%
TOTAL SFH SOLD 29% -13% 257% 0%
TOTAL SFH FOR SALE AT END OF PERIOD 105% 67% 233% -100%
AVERAGE MONTHLY SUPPLY OF INVENTORY 59% 92% -7% 0%
AVERAGE SOLD PRICE/ORIGINAL LIST PRICE RATIO -1% -1% 2% 0%
(Source: MLS/CLAW)
13
CONDOMINIUM SALES BEVERLYWOOD
MAY MARKET OVERVIEWIn Beverlywood there were 18 single family home sales in May 2014, up from 11 in May 2013 and a 18% decrease from
the 22 sales closed last month. The average list price for single family home sales in May 2014 was $999,242 compared
to $778,555 for May 2013, representing a 28% increase. For the three-month period from March to May 2014, the
average list price was 42% higher than the same period of the prior year. Average sales price for May 2014 was $991,556,
compared to that of March through May 2014, which was $1,118,403. Comparing May 2014 to April 2014, Beverlywood
saw a 18% decrease in average sale price, but a 24% increase compared to same month of the prior year.
CONDOMINIUMS (CONDOS)MAR - MAY 2014 ALL < $1M $1M - $3M > $3M
AVERAGE LIST PRICE $709,128 $651,724 $1,685,000 $-
AVERAGE LIST PRICE PER SQUARE FOOT $488.68 $474.10 $612.50 $-
AVERAGE SOLD PRICE $699,427 $646,452 $1,600,000 $-
AVERAGE SOLD PRICE PER SQUARE FOOT $481.99 $470.27 $581.61 $-
TOTAL CONDOS SOLD 18 17 1 -
TOTAL CONDOS FOR SALE AT END OF PERIOD - - - -
AVERAGE MONTHLY SUPPLY OF INVENTORY - - - -
AVERAGE SOLD PRICE/ORIGINAL LIST PRICE RATIO 99% 99% 95% 0%
CONDOSMAR - MAY 2013 ALL < $1M $1M - $3M > $3M
AVERAGE LIST PRICE $568,223 $523,908 $1,100,000 $-
AVERAGE LIST PRICE PER SQUARE FOOT $404.30 $383.00 $592.67 $-
AVERAGE SOLD PRICE $577,154 $531,500 $1,125,000 $-
AVERAGE SOLD PRICE PER SQUARE FOOT $410.65 $388.55 $606.14 $-
TOTAL CONDOS SOLD 13 12 1 -
TOTAL CONDOS FOR SALE AT END OF PERIOD 7 7 - -
AVERAGE MONTHLY SUPPLY OF INVENTORY 1.6 1.8 - -
AVERAGE SOLD PRICE/ORIGINAL LIST PRICE RATIO 102% 101% 102% 0%
CONDOSMAY/MAY COMPARISON ALL < $1M $1M - $3M > $3M
AVERAGE LIST PRICE 25% 24% 53% 0%
AVERAGE LIST PRICE PER SQUARE FOOT 21% 24% 3% 0%
AVERAGE SOLD PRICE 21% 22% 42% 0%
AVERAGE SOLD PRICE PER SQUARE FOOT 17% 21% -4% 0%
TOTAL CONDOS SOLD 38% 42% 0% 0%
TOTAL CONDOS FOR SALE AT END OF PERIOD -100% -100% 0% 0%
AVERAGE MONTHLY SUPPLY OF INVENTORY -100% -100% 0% 0%
AVERAGE SOLD PRICE/ORIGINAL LIST PRICE RATIO -3% -2% -7% 0%
(Source: MLS/CLAW)
14
SINGLE FAMILY HOME SALES
BEVERLY HILLS | BRENTWOOD | LOS FELIZ | MALIBU | PACIFIC PALISADES SANTA MONICA | SUNSET STRIP | sothebyshomes.com/losangeles
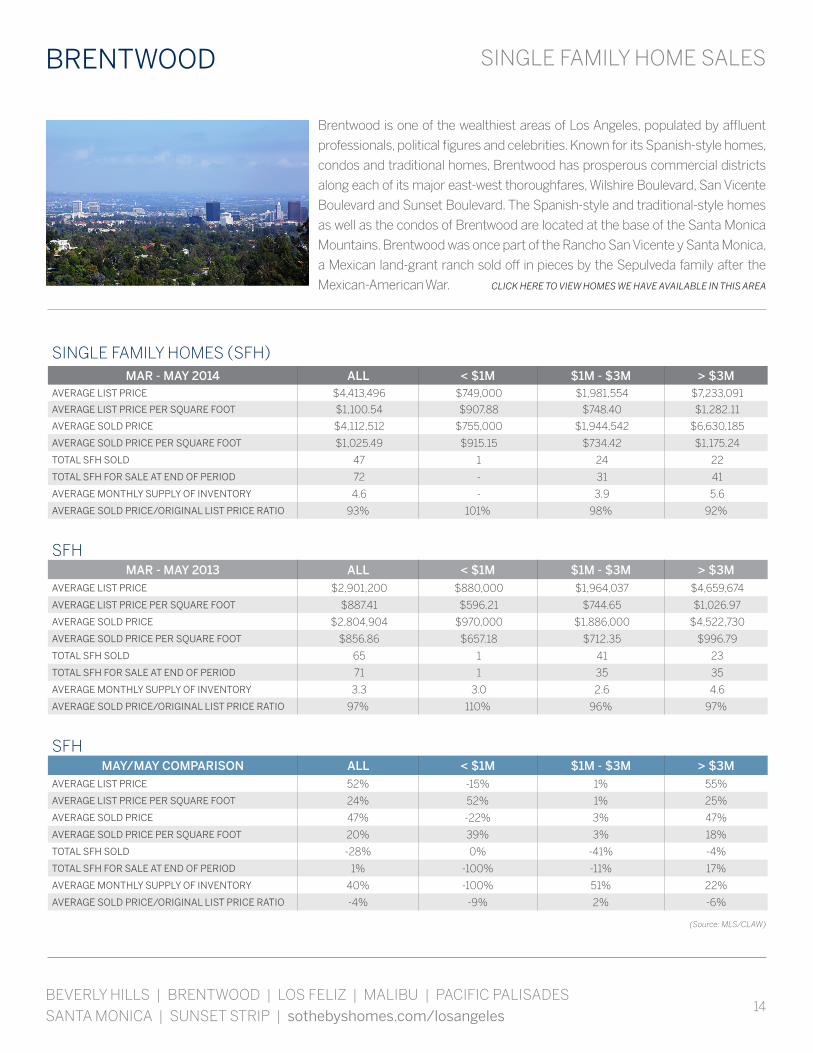
Brentwood is one of the wealthiest areas of Los Angeles, populated by affluent
professionals, political figures and celebrities. Known for its Spanish-style homes,
condos and traditional homes, Brentwood has prosperous commercial districts
along each of its major east-west thoroughfares, Wilshire Boulevard, San Vicente
Boulevard and Sunset Boulevard. The Spanish-style and traditional-style homes
as well as the condos of Brentwood are located at the base of the Santa Monica
Mountains. Brentwood was once part of the Rancho San Vicente y Santa Monica,
a Mexican land-grant ranch sold off in pieces by the Sepulveda family after the
Mexican-American War. CLICK HERE TO VIEW HOMES WE HAVE AVAILABLE IN THIS AREA
BRENTWOOD
SINGLE FAMILY HOMES (SFH)MAR - MAY 2014 ALL < $1M $1M - $3M > $3M
AVERAGE LIST PRICE $4,413,496 $749,000 $1,981,554 $7,233,091
AVERAGE LIST PRICE PER SQUARE FOOT $1,100.54 $907.88 $748.40 $1,282.11
AVERAGE SOLD PRICE $4,112,512 $755,000 $1,944,542 $6,630,185
AVERAGE SOLD PRICE PER SQUARE FOOT $1,025.49 $915.15 $734.42 $1,175.24
TOTAL SFH SOLD 47 1 24 22
TOTAL SFH FOR SALE AT END OF PERIOD 72 - 31 41
AVERAGE MONTHLY SUPPLY OF INVENTORY 4.6 - 3.9 5.6
AVERAGE SOLD PRICE/ORIGINAL LIST PRICE RATIO 93% 101% 98% 92%
SFHMAR - MAY 2013 ALL < $1M $1M - $3M > $3M
AVERAGE LIST PRICE $2,901,200 $880,000 $1,964,037 $4,659,674
AVERAGE LIST PRICE PER SQUARE FOOT $887.41 $596.21 $744.65 $1,026.97
AVERAGE SOLD PRICE $2,804,904 $970,000 $1,886,000 $4,522,730
AVERAGE SOLD PRICE PER SQUARE FOOT $856.86 $657.18 $712.35 $996.79
TOTAL SFH SOLD 65 1 41 23
TOTAL SFH FOR SALE AT END OF PERIOD 71 1 35 35
AVERAGE MONTHLY SUPPLY OF INVENTORY 3.3 3.0 2.6 4.6
AVERAGE SOLD PRICE/ORIGINAL LIST PRICE RATIO 97% 110% 96% 97%
SFHMAY/MAY COMPARISON ALL < $1M $1M - $3M > $3M
AVERAGE LIST PRICE 52% -15% 1% 55%
AVERAGE LIST PRICE PER SQUARE FOOT 24% 52% 1% 25%
AVERAGE SOLD PRICE 47% -22% 3% 47%
AVERAGE SOLD PRICE PER SQUARE FOOT 20% 39% 3% 18%
TOTAL SFH SOLD -28% 0% -41% -4%
TOTAL SFH FOR SALE AT END OF PERIOD 1% -100% -11% 17%
AVERAGE MONTHLY SUPPLY OF INVENTORY 40% -100% 51% 22%
AVERAGE SOLD PRICE/ORIGINAL LIST PRICE RATIO -4% -9% 2% -6%
(Source: MLS/CLAW)
15
CONDOMINIUM SALES BRENTWOOD
MAY MARKET OVERVIEWIn Brentwood there were 24 single family home sales in May 2014, down from 27 in May 2013 and a 50% increase from the
16 sales closed last month. The average list price for single family home sales in May 2014 was $5,597,346 compared to
$3,372,148 for May 2013, representing a 66% increase. For the three-month period from March to May 2014, the average
list price was 52% higher than the same period of the prior year. Average sales price for May 2014 was $5,048,530,
compared to that of March through May 2014, which was $4,112,512. Comparing May 2014 to April 2014, Brentwood saw
a 51% increase in average sale price, and a 60% increase compared to same month of the prior year.
CONDOMINIUMS (CONDOS)MAR - MAY 2014 ALL < $1M $1M - $3M > $3M
AVERAGE LIST PRICE $777,425 $642,995 $1,180,714 $-
AVERAGE LIST PRICE PER SQUARE FOOT $534.67 $523.67 $553.66 $-
AVERAGE SOLD PRICE $771,654 $638,944 $1,169,786 $-
AVERAGE SOLD PRICE PER SQUARE FOOT $530.70 $520.37 $548.53 $-
TOTAL CONDOS SOLD 56 42 14 -
TOTAL CONDOS FOR SALE AT END OF PERIOD - - - -
AVERAGE MONTHLY SUPPLY OF INVENTORY - - - -
AVERAGE SOLD PRICE/ORIGINAL LIST PRICE RATIO 99% 99% 99% 0%
CONDOSMAR - MAY 2013 ALL < $1M $1M - $3M > $3M
AVERAGE LIST PRICE $774,617 $608,241 $1,523,700 $3,100,000
AVERAGE LIST PRICE PER SQUARE FOOT $497.43 $456.40 $592.23 $666.67
AVERAGE SOLD PRICE $774,220 $611,617 $1,501,000 $3,100,000
AVERAGE SOLD PRICE PER SQUARE FOOT $497.17 $458.93 $583.41 $666.67
TOTAL CONDOS SOLD 70 59 10 1
TOTAL CONDOS FOR SALE AT END OF PERIOD 47 33 14 -
AVERAGE MONTHLY SUPPLY OF INVENTORY 2.0 1.7 4.2 -
AVERAGE SOLD PRICE/ORIGINAL LIST PRICE RATIO 100% 101% 99% 100%
CONDOSMAY/MAY COMPARISON ALL < $1M $1M - $3M > $3M
AVERAGE LIST PRICE 0% 6% -23% -100%
AVERAGE LIST PRICE PER SQUARE FOOT 7% 15% -7% -100%
AVERAGE SOLD PRICE 0% 4% -22% -100%
AVERAGE SOLD PRICE PER SQUARE FOOT 7% 13% -6% -100%
TOTAL CONDOS SOLD -20% -29% 40% -100%
TOTAL CONDOS FOR SALE AT END OF PERIOD -100% -100% -100% 0%
AVERAGE MONTHLY SUPPLY OF INVENTORY -100% -100% -100% 0%
AVERAGE SOLD PRICE/ORIGINAL LIST PRICE RATIO -1% -1% 1% -100%
(Source: MLS/CLAW)
16
SINGLE FAMILY HOME SALES
BEVERLY HILLS | BRENTWOOD | LOS FELIZ | MALIBU | PACIFIC PALISADES SANTA MONICA | SUNSET STRIP | sothebyshomes.com/losangeles
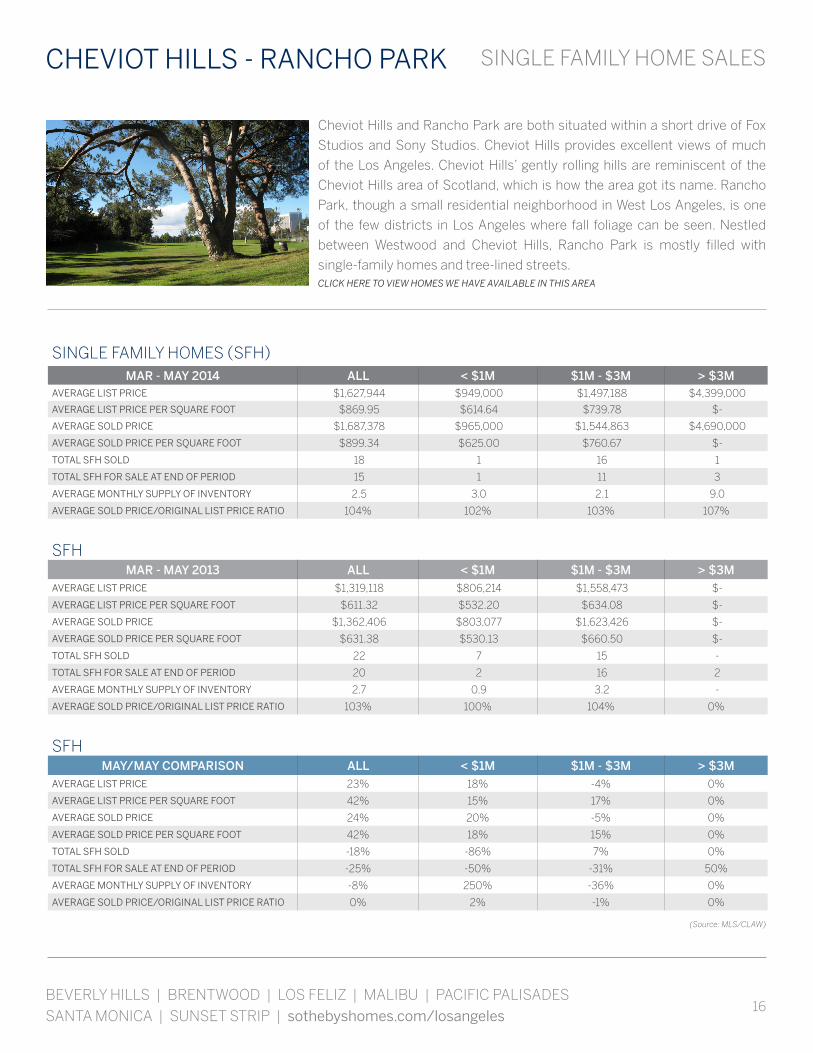
Cheviot Hills and Rancho Park are both situated within a short drive of Fox
Studios and Sony Studios. Cheviot Hills provides excellent views of much
of the Los Angeles. Cheviot Hills’ gently rolling hills are reminiscent of the
Cheviot Hills area of Scotland, which is how the area got its name. Rancho
Park, though a small residential neighborhood in West Los Angeles, is one
of the few districts in Los Angeles where fall foliage can be seen. Nestled
between Westwood and Cheviot Hills, Rancho Park is mostly filled with
single-family homes and tree-lined streets. CLICK HERE TO VIEW HOMES WE HAVE AVAILABLE IN THIS AREA
CHEVIOT HILLS - RANCHO PARK
SINGLE FAMILY HOMES (SFH)MAR - MAY 2014 ALL < $1M $1M - $3M > $3M
AVERAGE LIST PRICE $1,627,944 $949,000 $1,497,188 $4,399,000
AVERAGE LIST PRICE PER SQUARE FOOT $869.95 $614.64 $739.78 $-
AVERAGE SOLD PRICE $1,687,378 $965,000 $1,544,863 $4,690,000
AVERAGE SOLD PRICE PER SQUARE FOOT $899.34 $625.00 $760.67 $-
TOTAL SFH SOLD 18 1 16 1
TOTAL SFH FOR SALE AT END OF PERIOD 15 1 11 3
AVERAGE MONTHLY SUPPLY OF INVENTORY 2.5 3.0 2.1 9.0
AVERAGE SOLD PRICE/ORIGINAL LIST PRICE RATIO 104% 102% 103% 107%
SFHMAR - MAY 2013 ALL < $1M $1M - $3M > $3M
AVERAGE LIST PRICE $1,319,118 $806,214 $1,558,473 $-
AVERAGE LIST PRICE PER SQUARE FOOT $611.32 $532.20 $634.08 $-
AVERAGE SOLD PRICE $1,362,406 $803,077 $1,623,426 $-
AVERAGE SOLD PRICE PER SQUARE FOOT $631.38 $530.13 $660.50 $-
TOTAL SFH SOLD 22 7 15 -
TOTAL SFH FOR SALE AT END OF PERIOD 20 2 16 2
AVERAGE MONTHLY SUPPLY OF INVENTORY 2.7 0.9 3.2 -
AVERAGE SOLD PRICE/ORIGINAL LIST PRICE RATIO 103% 100% 104% 0%
SFHMAY/MAY COMPARISON ALL < $1M $1M - $3M > $3M
AVERAGE LIST PRICE 23% 18% -4% 0%
AVERAGE LIST PRICE PER SQUARE FOOT 42% 15% 17% 0%
AVERAGE SOLD PRICE 24% 20% -5% 0%
AVERAGE SOLD PRICE PER SQUARE FOOT 42% 18% 15% 0%
TOTAL SFH SOLD -18% -86% 7% 0%
TOTAL SFH FOR SALE AT END OF PERIOD -25% -50% -31% 50%
AVERAGE MONTHLY SUPPLY OF INVENTORY -8% 250% -36% 0%
AVERAGE SOLD PRICE/ORIGINAL LIST PRICE RATIO 0% 2% -1% 0%
(Source: MLS/CLAW)

17
CONDOMINIUM SALES CHEVIOT HILLS - RANCHO PARK
MAY MARKET OVERVIEWIn Cheviot Hills - Rancho Park there were 8 single family home sales in May 2014, up from 3 in May 2013 and a similar
performance from the 8 sales closed last month. The average list price for single family home sales in May 2014 was
$1,585,375 compared to $977,667 for May 2013, representing a 62% increase. For the three-month period from March to
May 2014, the average list price was 23% higher than the same period of the prior year. Average sales price for May 2014
was $1,598,750, compared to that of March through May 2014, which was $1,687,378. Comparing May 2014 to April 2014,
Cheviot Hills - Rancho Park saw a 12% decrease in average sale price, but a 46% increase compared to same month of the
prior year.
CONDOMINIUMS (CONDOS)MAR - MAY 2014 ALL < $1M $1M - $3M > $3M
AVERAGE LIST PRICE $575,000 $575,000 $- $-
AVERAGE LIST PRICE PER SQUARE FOOT $432.33 $432.33 $- $-
AVERAGE SOLD PRICE $585,000 $585,000 $- $-
AVERAGE SOLD PRICE PER SQUARE FOOT $439.85 $439.85 $- $-
TOTAL CONDOS SOLD 1 1 - -
TOTAL CONDOS FOR SALE AT END OF PERIOD - - - -
AVERAGE MONTHLY SUPPLY OF INVENTORY - - - -
AVERAGE SOLD PRICE/ORIGINAL LIST PRICE RATIO 102% 102% 0% 0%
CONDOSMAR - MAY 2013 ALL < $1M $1M - $3M > $3M
AVERAGE LIST PRICE $199,000 $199,000 $- $-
AVERAGE LIST PRICE PER SQUARE FOOT $269.28 $269.28 $- $-
AVERAGE SOLD PRICE $260,000 $260,000 $- $-
AVERAGE SOLD PRICE PER SQUARE FOOT $351.83 $351.83 $- $-
TOTAL CONDOS SOLD 1 1 - -
TOTAL CONDOS FOR SALE AT END OF PERIOD - - - -
AVERAGE MONTHLY SUPPLY OF INVENTORY - - - -
AVERAGE SOLD PRICE/ORIGINAL LIST PRICE RATIO 131% 131% 0% 0%
CONDOSMAY/MAY COMPARISON ALL < $1M $1M - $3M > $3M
AVERAGE LIST PRICE 189% 189% 0% 0%
AVERAGE LIST PRICE PER SQUARE FOOT 61% 61% 0% 0%
AVERAGE SOLD PRICE 125% 125% 0% 0%
AVERAGE SOLD PRICE PER SQUARE FOOT 25% 25% 0% 0%
TOTAL CONDOS SOLD 0% 0% 0% 0%
TOTAL CONDOS FOR SALE AT END OF PERIOD 0% 0% 0% 0%
AVERAGE MONTHLY SUPPLY OF INVENTORY 0% 0% 0% 0%
AVERAGE SOLD PRICE/ORIGINAL LIST PRICE RATIO -22% -22% 0% 0%
(Source: MLS/CLAW)
18
SINGLE FAMILY HOME SALES
BEVERLY HILLS | BRENTWOOD | LOS FELIZ | MALIBU | PACIFIC PALISADES SANTA MONICA | SUNSET STRIP | sothebyshomes.com/losangeles
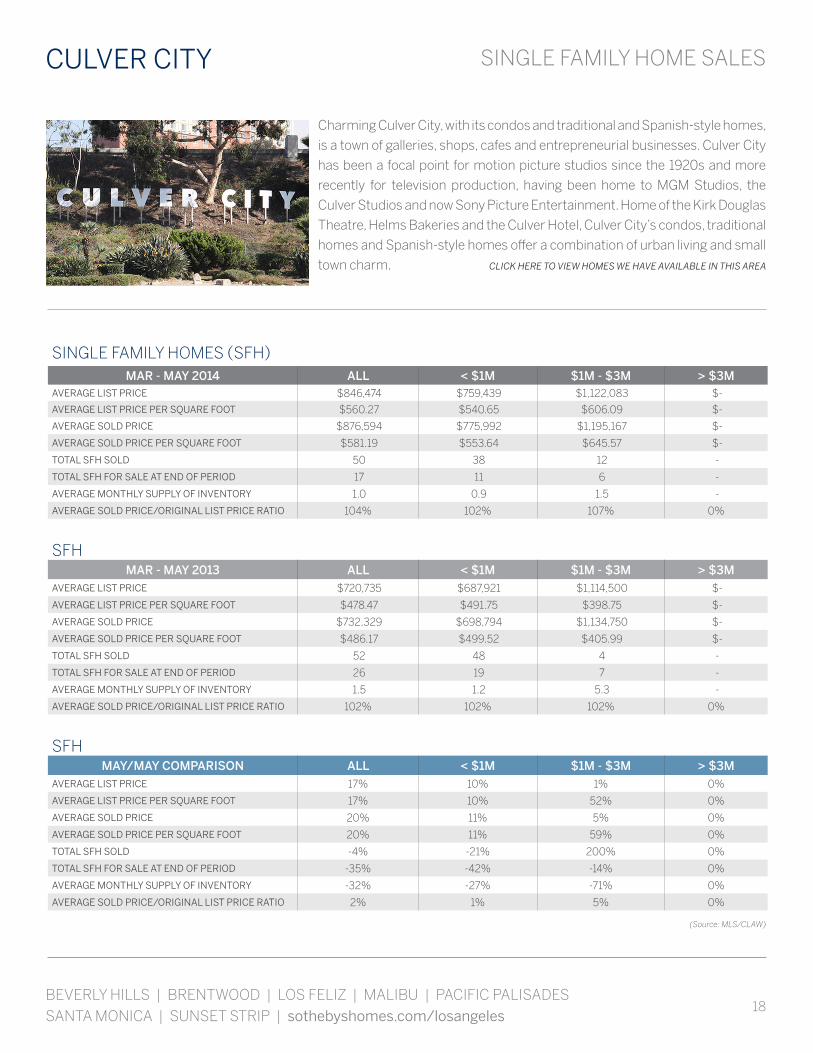
Charming Culver City, with its condos and traditional and Spanish-style homes,
is a town of galleries, shops, cafes and entrepreneurial businesses. Culver City
has been a focal point for motion picture studios since the 1920s and more
recently for television production, having been home to MGM Studios, the
Culver Studios and now Sony Picture Entertainment. Home of the Kirk Douglas
Theatre, Helms Bakeries and the Culver Hotel, Culver City’s condos, traditional
homes and Spanish-style homes offer a combination of urban living and small
town charm. CLICK HERE TO VIEW HOMES WE HAVE AVAILABLE IN THIS AREA
CULVER CITY
SINGLE FAMILY HOMES (SFH)MAR - MAY 2014 ALL < $1M $1M - $3M > $3M
AVERAGE LIST PRICE $846,474 $759,439 $1,122,083 $-
AVERAGE LIST PRICE PER SQUARE FOOT $560.27 $540.65 $606.09 $-
AVERAGE SOLD PRICE $876,594 $775,992 $1,195,167 $-
AVERAGE SOLD PRICE PER SQUARE FOOT $581.19 $553.64 $645.57 $-
TOTAL SFH SOLD 50 38 12 -
TOTAL SFH FOR SALE AT END OF PERIOD 17 11 6 -
AVERAGE MONTHLY SUPPLY OF INVENTORY 1.0 0.9 1.5 -
AVERAGE SOLD PRICE/ORIGINAL LIST PRICE RATIO 104% 102% 107% 0%
SFHMAR - MAY 2013 ALL < $1M $1M - $3M > $3M
AVERAGE LIST PRICE $720,735 $687,921 $1,114,500 $-
AVERAGE LIST PRICE PER SQUARE FOOT $478.47 $491.75 $398.75 $-
AVERAGE SOLD PRICE $732,329 $698,794 $1,134,750 $-
AVERAGE SOLD PRICE PER SQUARE FOOT $486.17 $499.52 $405.99 $-
TOTAL SFH SOLD 52 48 4 -
TOTAL SFH FOR SALE AT END OF PERIOD 26 19 7 -
AVERAGE MONTHLY SUPPLY OF INVENTORY 1.5 1.2 5.3 -
AVERAGE SOLD PRICE/ORIGINAL LIST PRICE RATIO 102% 102% 102% 0%
SFHMAY/MAY COMPARISON ALL < $1M $1M - $3M > $3M
AVERAGE LIST PRICE 17% 10% 1% 0%
AVERAGE LIST PRICE PER SQUARE FOOT 17% 10% 52% 0%
AVERAGE SOLD PRICE 20% 11% 5% 0%
AVERAGE SOLD PRICE PER SQUARE FOOT 20% 11% 59% 0%
TOTAL SFH SOLD -4% -21% 200% 0%
TOTAL SFH FOR SALE AT END OF PERIOD -35% -42% -14% 0%
AVERAGE MONTHLY SUPPLY OF INVENTORY -32% -27% -71% 0%
AVERAGE SOLD PRICE/ORIGINAL LIST PRICE RATIO 2% 1% 5% 0%
(Source: MLS/CLAW)

19
CONDOMINIUM SALES CULVER CITY
MAY MARKET OVERVIEWIn Culver City there were 17 single family home sales in May 2014, down from 20 in May 2013 and a 32% decrease from
the 25 sales closed last month. The average list price for single family home sales in May 2014 was $824,974 compared
to $738,045 for May 2013, representing a 12% increase. For the three-month period from March to May 2014, the
average list price was 17% higher than the same period of the prior year. Average sales price for May 2014 was $842,735,
compared to that of March through May 2014, which was $876,594. Comparing May 2014 to April 2014, Culver City saw a
11% decrease in average sale price, but a 12% increase compared to same month of the prior year.
CONDOMINIUMS (CONDOS)MAR - MAY 2014 ALL < $1M $1M - $3M > $3M
AVERAGE LIST PRICE $423,153 $423,153 $- $-
AVERAGE LIST PRICE PER SQUARE FOOT $382.55 $382.55 $- $-
AVERAGE SOLD PRICE $429,519 $429,519 $- $-
AVERAGE SOLD PRICE PER SQUARE FOOT $388.23 $388.23 $- $-
TOTAL CONDOS SOLD 52 52 - -
TOTAL CONDOS FOR SALE AT END OF PERIOD - - - -
AVERAGE MONTHLY SUPPLY OF INVENTORY - - - -
AVERAGE SOLD PRICE/ORIGINAL LIST PRICE RATIO 102% 102% 0% 0%
CONDOSMAR - MAY 2013 ALL < $1M $1M - $3M > $3M
AVERAGE LIST PRICE $373,708 $373,708 $- $-
AVERAGE LIST PRICE PER SQUARE FOOT $315.07 $315.07 $- $-
AVERAGE SOLD PRICE $379,769 $379,769 $- $-
AVERAGE SOLD PRICE PER SQUARE FOOT $320.17 $320.17 $- $-
TOTAL CONDOS SOLD 51 51 - -
TOTAL CONDOS FOR SALE AT END OF PERIOD 19 19 - -
AVERAGE MONTHLY SUPPLY OF INVENTORY 1.1 1.1 - -
AVERAGE SOLD PRICE/ORIGINAL LIST PRICE RATIO 102% 102% 0% 0%
CONDOSMAY/MAY COMPARISON ALL < $1M $1M - $3M > $3M
AVERAGE LIST PRICE 13% 13% 0% 0%
AVERAGE LIST PRICE PER SQUARE FOOT 21% 21% 0% 0%
AVERAGE SOLD PRICE 13% 13% 0% 0%
AVERAGE SOLD PRICE PER SQUARE FOOT 21% 21% 0% 0%
TOTAL CONDOS SOLD 2% 2% 0% 0%
TOTAL CONDOS FOR SALE AT END OF PERIOD -100% -100% 0% 0%
AVERAGE MONTHLY SUPPLY OF INVENTORY -100% -100% 0% 0%
AVERAGE SOLD PRICE/ORIGINAL LIST PRICE RATIO 0% 0% 0% 0%
(Source: MLS/CLAW)

20
SINGLE FAMILY HOME SALES
BEVERLY HILLS | BRENTWOOD | LOS FELIZ | MALIBU | PACIFIC PALISADES SANTA MONICA | SUNSET STRIP | sothebyshomes.com/losangeles
Downtown Los Angeles offers urban living with its condos and lofts, and its
central business district with skyscrapers, multinational corporations, popular
art institutions, public art displays, sightseeing opportunities, sports facilities
and shopping. Home to world-famous establishments like The Walt Disney
Concert Hall, Staples Center, Cathedral of our Lady of the Angels and the
University of Southern California, Downtown Los Angeles borders Lincoln
Heights and the LA River to the east, Hollywood to the north, the Santa Monica
Freeway to the south, and the Harbor Freeway to the west. Perfect for those
seeking condos and lofts. CLICK HERE TO VIEW HOMES WE HAVE AVAILABLE IN THIS AREA
DOWNTOWN LOS ANGELES
SINGLE FAMILY HOMES (SFH)MAR - MAY 2014 ALL < $1M $1M - $3M > $3M
AVERAGE LIST PRICE $257,725 $257,725 $- $-
AVERAGE LIST PRICE PER SQUARE FOOT $188.86 $188.86 $- $-
AVERAGE SOLD PRICE $255,352 $255,352 $- $-
AVERAGE SOLD PRICE PER SQUARE FOOT $187.12 $187.12 $- $-
TOTAL SFH SOLD 28 28 - -
TOTAL SFH FOR SALE AT END OF PERIOD 27 25 1 1
AVERAGE MONTHLY SUPPLY OF INVENTORY 2.9 2.7 - -
AVERAGE SOLD PRICE/ORIGINAL LIST PRICE RATIO 99% 99% 0% 0%
SFHMAR - MAY 2013 ALL < $1M $1M - $3M > $3M
AVERAGE LIST PRICE $236,218 $236,218 $- $-
AVERAGE LIST PRICE PER SQUARE FOOT $176.06 $176.06 $- $-
AVERAGE SOLD PRICE $224,220 $224,220 $- $-
AVERAGE SOLD PRICE PER SQUARE FOOT $167.11 $167.11 $- $-
TOTAL SFH SOLD 35 35 - -
TOTAL SFH FOR SALE AT END OF PERIOD 31 31 - -
AVERAGE MONTHLY SUPPLY OF INVENTORY 2.7 2.7 - -
AVERAGE SOLD PRICE/ORIGINAL LIST PRICE RATIO 95% 95% 0% 0%
SFHMAY/MAY COMPARISON ALL < $1M $1M - $3M > $3M
AVERAGE LIST PRICE 9% 9% 0% 0%
AVERAGE LIST PRICE PER SQUARE FOOT 7% 7% 0% 0%
AVERAGE SOLD PRICE 14% 14% 0% 0%
AVERAGE SOLD PRICE PER SQUARE FOOT 12% 12% 0% 0%
TOTAL SFH SOLD -20% -20% 0% 0%
TOTAL SFH FOR SALE AT END OF PERIOD -13% -19% 0% 0%
AVERAGE MONTHLY SUPPLY OF INVENTORY 9% 1% 0% 0%
AVERAGE SOLD PRICE/ORIGINAL LIST PRICE RATIO 4% 4% 0% 0%
(Source: MLS/CLAW)

21
CONDOMINIUM SALES DOWNTOWN LOS ANGELES
MAY MARKET OVERVIEWIn Downtown L.A. there were 55 condominium sales in May 2014, up from 32 in May 2013 and a 31% increase from the 42
sales closed last month. The average list price for condo sales in May 2014 was $626,696 compared to $746,440 for May
2013, representing a 16% decrease. For the three-month period from March to May 2014, the average list price was 6%
lower than the same period of the prior year. Average sales price for May 2014 was $621,144, compared to that of March
through May 2014, which was $631,121. Comparing May 2014 to April 2014, Downtown L.A. saw a 4% decrease in average
sale price, and a 13% decrease compared to same month of the prior year.
CONDOMINIUMS (CONDOS)MAR - MAY 2014 ALL < $1M $1M - $3M > $3M
AVERAGE LIST PRICE $638,886 $554,246 $1,478,769 $-
AVERAGE LIST PRICE PER SQUARE FOOT $545.88 $520.06 $669.52 $-
AVERAGE SOLD PRICE $631,121 $549,816 $1,437,923 $-
AVERAGE SOLD PRICE PER SQUARE FOOT $539.25 $515.90 $651.03 $-
TOTAL CONDOS SOLD 142 129 13 -
TOTAL CONDOS FOR SALE AT END OF PERIOD - - - -
AVERAGE MONTHLY SUPPLY OF INVENTORY - - - -
AVERAGE SOLD PRICE/ORIGINAL LIST PRICE RATIO 99% 99% 97% 0%
CONDOSMAR - MAY 2013 ALL < $1M $1M - $3M > $3M
AVERAGE LIST PRICE $676,733 $490,966 $1,682,059 $-
AVERAGE LIST PRICE PER SQUARE FOOT $512.56 $429.99 $735.71 $-
AVERAGE SOLD PRICE $655,770 $486,510 $1,571,765 $-
AVERAGE SOLD PRICE PER SQUARE FOOT $496.68 $426.08 $687.47 $-
TOTAL CONDOS SOLD 109 92 17 -
TOTAL CONDOS FOR SALE AT END OF PERIOD 80 60 14 6
AVERAGE MONTHLY SUPPLY OF INVENTORY 2.2 2.0 2.5 -
AVERAGE SOLD PRICE/ORIGINAL LIST PRICE RATIO 97% 99% 93% 0%
CONDOSMAY/MAY COMPARISON ALL < $1M $1M - $3M > $3M
AVERAGE LIST PRICE -6% 13% -12% 0%
AVERAGE LIST PRICE PER SQUARE FOOT 7% 21% -9% 0%
AVERAGE SOLD PRICE -4% 13% -9% 0%
AVERAGE SOLD PRICE PER SQUARE FOOT 9% 21% -5% 0%
TOTAL CONDOS SOLD 30% 40% -24% 0%
TOTAL CONDOS FOR SALE AT END OF PERIOD -100% -100% -100% -100%
AVERAGE MONTHLY SUPPLY OF INVENTORY -100% -100% -100% 0%
AVERAGE SOLD PRICE/ORIGINAL LIST PRICE RATIO 2% 0% 4% 0%
(Source: MLS/CLAW)
22
SINGLE FAMILY HOME SALES
BEVERLY HILLS | BRENTWOOD | LOS FELIZ | MALIBU | PACIFIC PALISADES SANTA MONICA | SUNSET STRIP | sothebyshomes.com/losangeles
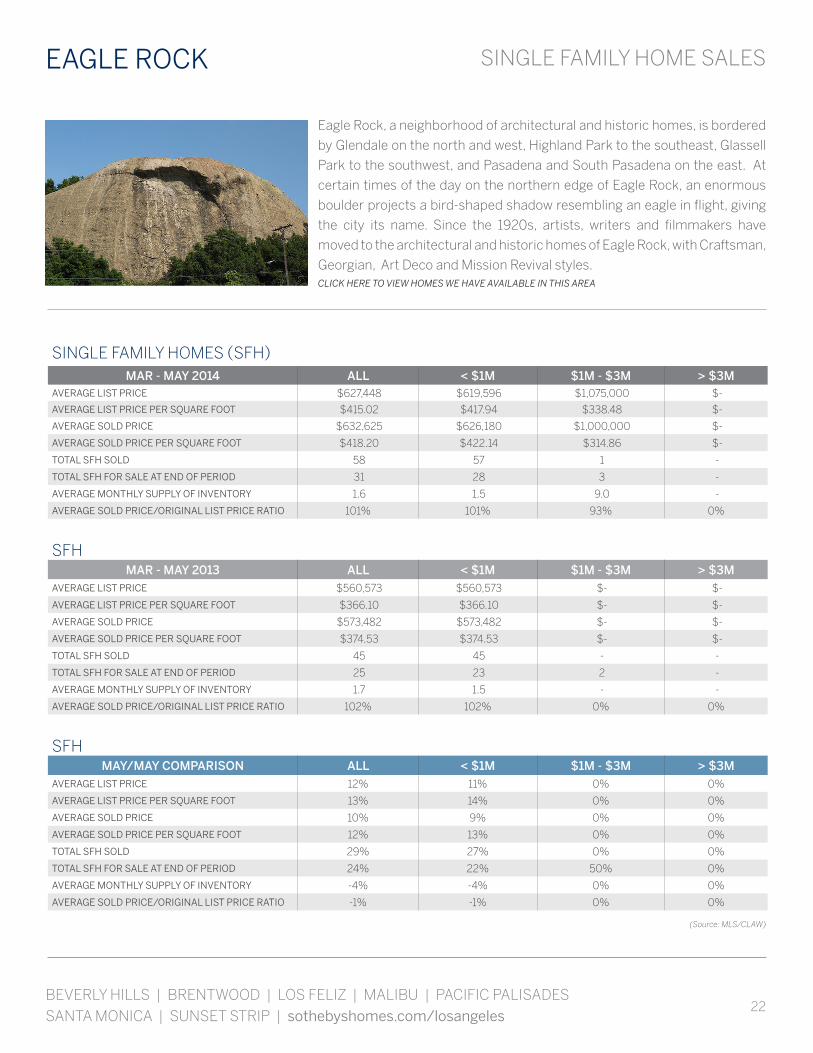
Eagle Rock, a neighborhood of architectural and historic homes, is bordered
by Glendale on the north and west, Highland Park to the southeast, Glassell
Park to the southwest, and Pasadena and South Pasadena on the east. At
certain times of the day on the northern edge of Eagle Rock, an enormous
boulder projects a bird-shaped shadow resembling an eagle in flight, giving
the city its name. Since the 1920s, artists, writers and filmmakers have
moved to the architectural and historic homes of Eagle Rock, with Craftsman,
Georgian, Art Deco and Mission Revival styles.CLICK HERE TO VIEW HOMES WE HAVE AVAILABLE IN THIS AREA
EAGLE ROCK
SINGLE FAMILY HOMES (SFH)MAR - MAY 2014 ALL < $1M $1M - $3M > $3M
AVERAGE LIST PRICE $627,448 $619,596 $1,075,000 $-
AVERAGE LIST PRICE PER SQUARE FOOT $415.02 $417.94 $338.48 $-
AVERAGE SOLD PRICE $632,625 $626,180 $1,000,000 $-
AVERAGE SOLD PRICE PER SQUARE FOOT $418.20 $422.14 $314.86 $-
TOTAL SFH SOLD 58 57 1 -
TOTAL SFH FOR SALE AT END OF PERIOD 31 28 3 -
AVERAGE MONTHLY SUPPLY OF INVENTORY 1.6 1.5 9.0 -
AVERAGE SOLD PRICE/ORIGINAL LIST PRICE RATIO 101% 101% 93% 0%
SFHMAR - MAY 2013 ALL < $1M $1M - $3M > $3M
AVERAGE LIST PRICE $560,573 $560,573 $- $-
AVERAGE LIST PRICE PER SQUARE FOOT $366.10 $366.10 $- $-
AVERAGE SOLD PRICE $573,482 $573,482 $- $-
AVERAGE SOLD PRICE PER SQUARE FOOT $374.53 $374.53 $- $-
TOTAL SFH SOLD 45 45 - -
TOTAL SFH FOR SALE AT END OF PERIOD 25 23 2 -
AVERAGE MONTHLY SUPPLY OF INVENTORY 1.7 1.5 - -
AVERAGE SOLD PRICE/ORIGINAL LIST PRICE RATIO 102% 102% 0% 0%
SFHMAY/MAY COMPARISON ALL < $1M $1M - $3M > $3M
AVERAGE LIST PRICE 12% 11% 0% 0%
AVERAGE LIST PRICE PER SQUARE FOOT 13% 14% 0% 0%
AVERAGE SOLD PRICE 10% 9% 0% 0%
AVERAGE SOLD PRICE PER SQUARE FOOT 12% 13% 0% 0%
TOTAL SFH SOLD 29% 27% 0% 0%
TOTAL SFH FOR SALE AT END OF PERIOD 24% 22% 50% 0%
AVERAGE MONTHLY SUPPLY OF INVENTORY -4% -4% 0% 0%
AVERAGE SOLD PRICE/ORIGINAL LIST PRICE RATIO -1% -1% 0% 0%
(Source: MLS/CLAW)
23
CONDOMINIUM SALES EAGLE ROCK
MAY MARKET OVERVIEWIn Eagle Rock there were 22 single family home sales in May 2014, up from 20 in May 2013 and a 12% decrease from the
25 sales closed last month. The average list price for single family home sales in May 2014 was $602,827 compared to
$562,480 for May 2013, representing a 7% increase. For the three-month period from March to May 2014, the average list
price was 12% higher than the same period of the prior year. Average sales price for May 2014 was $633,568, compared
to that of March through May 2014, which was $632,625. Comparing May 2014 to April 2014, Eagle Rock saw a 1%
increase in average sale price, and a 10% increase compared to same month of the prior year.
CONDOMINIUMS (CONDOS)MAR - MAY 2014 ALL < $1M $1M - $3M > $3M
AVERAGE LIST PRICE $385,000 $385,000 $- $-
AVERAGE LIST PRICE PER SQUARE FOOT $289.15 $289.15 $- $-
AVERAGE SOLD PRICE $380,000 $380,000 $- $-
AVERAGE SOLD PRICE PER SQUARE FOOT $285.39 $285.39 $- $-
TOTAL CONDOS SOLD 2 2 - -
TOTAL CONDOS FOR SALE AT END OF PERIOD - - - -
AVERAGE MONTHLY SUPPLY OF INVENTORY - - - -
AVERAGE SOLD PRICE/ORIGINAL LIST PRICE RATIO 99% 99% 0% 0%
CONDOSMAR - MAY 2013 ALL < $1M $1M - $3M > $3M
AVERAGE LIST PRICE $294,000 $294,000 $- $-
AVERAGE LIST PRICE PER SQUARE FOOT $251.50 $251.50 $- $-
AVERAGE SOLD PRICE $298,500 $298,500 $- $-
AVERAGE SOLD PRICE PER SQUARE FOOT $255.35 $255.35 $- $-
TOTAL CONDOS SOLD 2 2 - -
TOTAL CONDOS FOR SALE AT END OF PERIOD - - - -
AVERAGE MONTHLY SUPPLY OF INVENTORY - - - -
AVERAGE SOLD PRICE/ORIGINAL LIST PRICE RATIO 102% 102% 0% 0%
CONDOSMAY/MAY COMPARISON ALL < $1M $1M - $3M > $3M
AVERAGE LIST PRICE 31% 31% 0% 0%
AVERAGE LIST PRICE PER SQUARE FOOT 15% 15% 0% 0%
AVERAGE SOLD PRICE 27% 27% 0% 0%
AVERAGE SOLD PRICE PER SQUARE FOOT 12% 12% 0% 0%
TOTAL CONDOS SOLD 0% 0% 0% 0%
TOTAL CONDOS FOR SALE AT END OF PERIOD 0% 0% 0% 0%
AVERAGE MONTHLY SUPPLY OF INVENTORY 0% 0% 0% 0%
AVERAGE SOLD PRICE/ORIGINAL LIST PRICE RATIO -3% -3% 0% 0%
(Source: MLS/CLAW)
24
SINGLE FAMILY HOME SALES
BEVERLY HILLS | BRENTWOOD | LOS FELIZ | MALIBU | PACIFIC PALISADES SANTA MONICA | SUNSET STRIP | sothebyshomes.com/losangeles
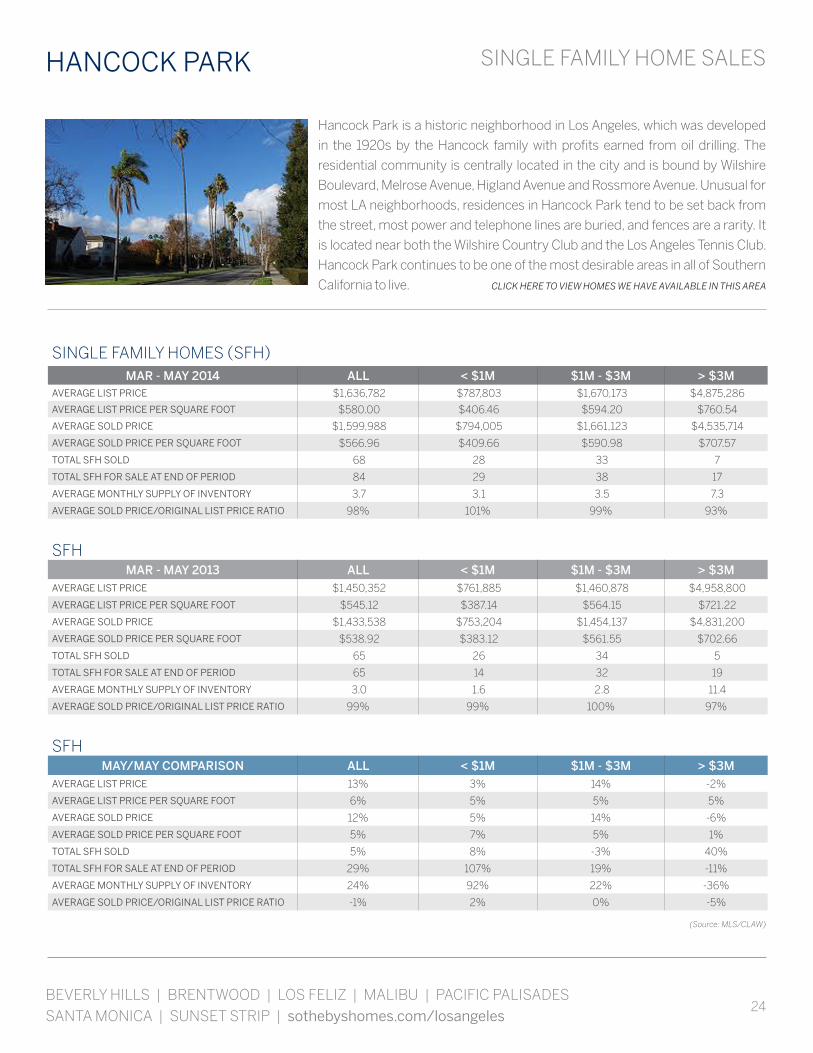
Hancock Park is a historic neighborhood in Los Angeles, which was developed
in the 1920s by the Hancock family with profits earned from oil drilling. The
residential community is centrally located in the city and is bound by Wilshire
Boulevard, Melrose Avenue, Higland Avenue and Rossmore Avenue. Unusual for
most LA neighborhoods, residences in Hancock Park tend to be set back from
the street, most power and telephone lines are buried, and fences are a rarity. It
is located near both the Wilshire Country Club and the Los Angeles Tennis Club.
Hancock Park continues to be one of the most desirable areas in all of Southern
California to live. CLICK HERE TO VIEW HOMES WE HAVE AVAILABLE IN THIS AREA
HANCOCK PARK
SINGLE FAMILY HOMES (SFH)MAR - MAY 2014 ALL < $1M $1M - $3M > $3M
AVERAGE LIST PRICE $1,636,782 $787,803 $1,670,173 $4,875,286
AVERAGE LIST PRICE PER SQUARE FOOT $580.00 $406.46 $594.20 $760.54
AVERAGE SOLD PRICE $1,599,988 $794,005 $1,661,123 $4,535,714
AVERAGE SOLD PRICE PER SQUARE FOOT $566.96 $409.66 $590.98 $707.57
TOTAL SFH SOLD 68 28 33 7
TOTAL SFH FOR SALE AT END OF PERIOD 84 29 38 17
AVERAGE MONTHLY SUPPLY OF INVENTORY 3.7 3.1 3.5 7.3
AVERAGE SOLD PRICE/ORIGINAL LIST PRICE RATIO 98% 101% 99% 93%
SFHMAR - MAY 2013 ALL < $1M $1M - $3M > $3M
AVERAGE LIST PRICE $1,450,352 $761,885 $1,460,878 $4,958,800
AVERAGE LIST PRICE PER SQUARE FOOT $545.12 $387.14 $564.15 $721.22
AVERAGE SOLD PRICE $1,433,538 $753,204 $1,454,137 $4,831,200
AVERAGE SOLD PRICE PER SQUARE FOOT $538.92 $383.12 $561.55 $702.66
TOTAL SFH SOLD 65 26 34 5
TOTAL SFH FOR SALE AT END OF PERIOD 65 14 32 19
AVERAGE MONTHLY SUPPLY OF INVENTORY 3.0 1.6 2.8 11.4
AVERAGE SOLD PRICE/ORIGINAL LIST PRICE RATIO 99% 99% 100% 97%
SFHMAY/MAY COMPARISON ALL < $1M $1M - $3M > $3M
AVERAGE LIST PRICE 13% 3% 14% -2%
AVERAGE LIST PRICE PER SQUARE FOOT 6% 5% 5% 5%
AVERAGE SOLD PRICE 12% 5% 14% -6%
AVERAGE SOLD PRICE PER SQUARE FOOT 5% 7% 5% 1%
TOTAL SFH SOLD 5% 8% -3% 40%
TOTAL SFH FOR SALE AT END OF PERIOD 29% 107% 19% -11%
AVERAGE MONTHLY SUPPLY OF INVENTORY 24% 92% 22% -36%
AVERAGE SOLD PRICE/ORIGINAL LIST PRICE RATIO -1% 2% 0% -5%
(Source: MLS/CLAW)
25
CONDOMINIUM SALES HANCOCK PARK
MAY MARKET OVERVIEWIn Hancock Park - Wilshire there were 25 single family home sales in May 2014, down from 33 in May 2013 and a 19%
increase from the 21 sales closed last month. The average list price for single family home sales in May 2014 was
$1,730,448 compared to $1,595,332 for May 2013, representing an 8% increase. For the three-month period from March
to May 2014, the average list price was 13% higher than the same period of the prior year. Average sales price for May
2014 was $1,685,900, compared to that of March through May 2014, which was $1,599,988. Comparing May 2014 to April
2014, Hancock Park - Wilshire saw a 18% increase in average sale price, and a 6% increase compared to same month of
the prior year.
CONDOMINIUMS (CONDOS)MAR - MAY 2014 ALL < $1M $1M - $3M > $3M
AVERAGE LIST PRICE $551,881 $496,224 $1,832,000 $-
AVERAGE LIST PRICE PER SQUARE FOOT $431.02 $407.05 $680.79 $-
AVERAGE SOLD PRICE $542,210 $488,393 $1,780,000 $-
AVERAGE SOLD PRICE PER SQUARE FOOT $423.46 $400.62 $661.46 $-
TOTAL CONDOS SOLD 48 46 2 -
TOTAL CONDOS FOR SALE AT END OF PERIOD - - - -
AVERAGE MONTHLY SUPPLY OF INVENTORY - - - -
AVERAGE SOLD PRICE/ORIGINAL LIST PRICE RATIO 98% 98% 97% 0%
CONDOSMAR - MAY 2013 ALL < $1M $1M - $3M > $3M
AVERAGE LIST PRICE $453,082 $436,506 $1,199,000 $-
AVERAGE LIST PRICE PER SQUARE FOOT $371.08 $358.57 $866.33 $-
AVERAGE SOLD PRICE $444,869 $428,644 $1,175,000 $-
AVERAGE SOLD PRICE PER SQUARE FOOT $364.35 $352.11 $848.99 $-
TOTAL CONDOS SOLD 46 45 1 -
TOTAL CONDOS FOR SALE AT END OF PERIOD 43 40 3 -
AVERAGE MONTHLY SUPPLY OF INVENTORY 2.8 2.7 9.0 -
AVERAGE SOLD PRICE/ORIGINAL LIST PRICE RATIO 98% 98% 98% 0%
CONDOSMAY/MAY COMPARISON ALL < $1M $1M - $3M > $3M
AVERAGE LIST PRICE 22% 14% 53% 0%
AVERAGE LIST PRICE PER SQUARE FOOT 16% 14% -21% 0%
AVERAGE SOLD PRICE 22% 14% 51% 0%
AVERAGE SOLD PRICE PER SQUARE FOOT 16% 14% -22% 0%
TOTAL CONDOS SOLD 4% 2% 100% 0%
TOTAL CONDOS FOR SALE AT END OF PERIOD -100% -100% -100% 0%
AVERAGE MONTHLY SUPPLY OF INVENTORY -100% -100% -100% 0%
AVERAGE SOLD PRICE/ORIGINAL LIST PRICE RATIO 0% 0% -1% 0%
(Source: MLS/CLAW)
26
SINGLE FAMILY HOME SALES
BEVERLY HILLS | BRENTWOOD | LOS FELIZ | MALIBU | PACIFIC PALISADES SANTA MONICA | SUNSET STRIP | sothebyshomes.com/losangeles
Hollywood puts you right in one of the most desirable districts of Los Angeles real
estate. Hollywood’s fame is rooted in its cultural identity, peerless entertainment
industry and historical significance as the origin of American cinema. Hollywood
is consistently the host of major events such as the Academy Awards and is
the paramount tourist attraction with Hollywood Boulevard, the Walk of Fame
and the Hollywood Bowl. From the red carpet to Hollywood’s 130-acre national
park, Runyon Canyon, this vibrant community radiates its authentic prestige.
Hollywood homes and estates are some of the most luxurious in all of California.
CLICK HERE TO VIEW HOMES WE HAVE AVAILABLE IN THIS AREA
HOLLYWOOD
SINGLE FAMILY HOMES (SFH)MAR - MAY 2014 ALL < $1M $1M - $3M > $3M
AVERAGE LIST PRICE $1,034,494 $550,271 $1,411,111 $-
AVERAGE LIST PRICE PER SQUARE FOOT $558.22 $517.03 $573.33 $-
AVERAGE SOLD PRICE $1,030,026 $537,416 $1,413,167 $-
AVERAGE SOLD PRICE PER SQUARE FOOT $547.55 $504.95 $563.16 $-
TOTAL SFH SOLD 16 7 9 -
TOTAL SFH FOR SALE AT END OF PERIOD 29 25 4 -
AVERAGE MONTHLY SUPPLY OF INVENTORY 5.4 10.7 1.3 -
AVERAGE SOLD PRICE/ORIGINAL LIST PRICE RATIO 100% 98% 100% 0%
SFHMAR - MAY 2013 ALL < $1M $1M - $3M > $3M
AVERAGE LIST PRICE $654,094 $577,788 $1,875,000 $-
AVERAGE LIST PRICE PER SQUARE FOOT $444.39 $408.20 $789.47 $-
AVERAGE SOLD PRICE $661,118 $590,563 $1,790,000 $-
AVERAGE SOLD PRICE PER SQUARE FOOT $449.16 $417.23 $753.68 $-
TOTAL SFH SOLD 17 16 1 -
TOTAL SFH FOR SALE AT END OF PERIOD 19 18 1 -
AVERAGE MONTHLY SUPPLY OF INVENTORY 3.4 3.4 3.0 -
AVERAGE SOLD PRICE/ORIGINAL LIST PRICE RATIO 101% 102% 95% 0%
SFHMAY/MAY COMPARISON ALL < $1M $1M - $3M > $3M
AVERAGE LIST PRICE 58% -5% -25% 0%
AVERAGE LIST PRICE PER SQUARE FOOT 26% 27% -27% 0%
AVERAGE SOLD PRICE 56% -9% -21% 0%
AVERAGE SOLD PRICE PER SQUARE FOOT 22% 21% -25% 0%
TOTAL SFH SOLD -6% -56% 800% 0%
TOTAL SFH FOR SALE AT END OF PERIOD 53% 39% 300% 0%
AVERAGE MONTHLY SUPPLY OF INVENTORY 62% 217% -56% 0%
AVERAGE SOLD PRICE/ORIGINAL LIST PRICE RATIO -1% -4% 5% 0%
(Source: MLS/CLAW)
27
CONDOMINIUM SALES HOLLYWOOD
MAY MARKET OVERVIEWIn Hollywood there were 12 condominium sales in May 2014, down from 14 in May 2013 and a 37% decrease from the 19
sales closed last month. The average list price for condo sales in May 2014 was $962,996 compared to $598,782 for May
2013, representing a 61% increase. For the three-month period from March to May 2014, the average list price was 33%
higher than the same period of the prior year. Average sales price for May 2014 was $933,329, compared to that of March
through May 2014, which was $716,925. Comparing May 2014 to April 2014, Hollywood saw a 49% increase in average
sale price, and a 57% increase compared to same month of the prior year.
CONDOMINIUMS (CONDOS)MAR - MAY 2014 ALL < $1M $1M - $3M > $3M
AVERAGE LIST PRICE $736,238 $550,337 $1,727,708 $-
AVERAGE LIST PRICE PER SQUARE FOOT $544.32 $464.10 $763.23 $-
AVERAGE SOLD PRICE $716,925 $544,591 $1,636,042 $-
AVERAGE SOLD PRICE PER SQUARE FOOT $530.00 $459.39 $722.74 $-
TOTAL CONDOS SOLD 38 32 6 -
TOTAL CONDOS FOR SALE AT END OF PERIOD - - - -
AVERAGE MONTHLY SUPPLY OF INVENTORY - - - -
AVERAGE SOLD PRICE/ORIGINAL LIST PRICE RATIO 97% 99% 95% 0%
CONDOSMAR - MAY 2013 ALL < $1M $1M - $3M > $3M
AVERAGE LIST PRICE $551,870 $530,321 $1,500,000 $-
AVERAGE LIST PRICE PER SQUARE FOOT $436.99 $424.72 $793.65 $-
AVERAGE SOLD PRICE $551,551 $529,995 $1,500,000 $-
AVERAGE SOLD PRICE PER SQUARE FOOT $436.74 $424.46 $793.65 $-
TOTAL CONDOS SOLD 45 44 1 -
TOTAL CONDOS FOR SALE AT END OF PERIOD 27 19 6 2
AVERAGE MONTHLY SUPPLY OF INVENTORY 1.8 1.3 18.0 -
AVERAGE SOLD PRICE/ORIGINAL LIST PRICE RATIO 100% 100% 100% 0%
CONDOSMAY/MAY COMPARISON ALL < $1M $1M - $3M > $3M
AVERAGE LIST PRICE 33% 4% 15% 0%
AVERAGE LIST PRICE PER SQUARE FOOT 25% 9% -4% 0%
AVERAGE SOLD PRICE 30% 3% 9% 0%
AVERAGE SOLD PRICE PER SQUARE FOOT 21% 8% -9% 0%
TOTAL CONDOS SOLD -16% -27% 500% 0%
TOTAL CONDOS FOR SALE AT END OF PERIOD -100% -100% -100% -100%
AVERAGE MONTHLY SUPPLY OF INVENTORY -100% -100% -100% 0%
AVERAGE SOLD PRICE/ORIGINAL LIST PRICE RATIO -3% -1% -5% 0%
(Source: MLS/CLAW)
28
SINGLE FAMILY HOME SALES
BEVERLY HILLS | BRENTWOOD | LOS FELIZ | MALIBU | PACIFIC PALISADES SANTA MONICA | SUNSET STRIP | sothebyshomes.com/losangeles
Hollywood Hills real estate means breathtaking homes in a sought-after neighborhood
of Los Angeles. It is located overlooking the city in the southeastern Santa Monica
Mountains. High above the city, the views of Downtown Los Angeles and the Pacific,
and the calm and serenity that can be found there make the Hills a draw for many
celebrities and non-celebrities alike. A number of Hollywood Hills homes can be found
on the Bird Streets above the Sunset Strip, Laurel Canyon and Beachwood Canyon.
Mulholland Drive, famed on its own, can be found along the top of the Hills. Homes
here can range from Mid-Century masterpieces to stunning modern Architectural to
traditional hillside. CLICK HERE TO VIEW HOMES WE HAVE AVAILABLE IN THIS AREA
HOLLYWOOD HILLS EAST
SINGLE FAMILY HOMES (SFH)MAR - MAY 2014 ALL < $1M $1M - $3M > $3M
AVERAGE LIST PRICE $1,120,697 $868,250 $1,264,952 $-
AVERAGE LIST PRICE PER SQUARE FOOT $549.61 $521.39 $560.46 $-
AVERAGE SOLD PRICE $1,103,231 $811,083 $1,270,173 $-
AVERAGE SOLD PRICE PER SQUARE FOOT $541.97 $487.84 $562.77 $-
TOTAL SFH SOLD 33 12 21 -
TOTAL SFH FOR SALE AT END OF PERIOD 47 8 37 2
AVERAGE MONTHLY SUPPLY OF INVENTORY 4.3 2.0 5.3 -
AVERAGE SOLD PRICE/ORIGINAL LIST PRICE RATIO 98% 93% 100% 0%
SFHMAR - MAY 2013 ALL < $1M $1M - $3M > $3M
AVERAGE LIST PRICE $1,139,598 $791,035 $1,467,500 $4,300,000
AVERAGE LIST PRICE PER SQUARE FOOT $482.98 $434.00 $503.70 $699.19
AVERAGE SOLD PRICE $1,111,231 $780,948 $1,433,375 $3,900,000
AVERAGE SOLD PRICE PER SQUARE FOOT $470.63 $428.47 $491.38 $634.15
TOTAL SFH SOLD 45 26 18 1
TOTAL SFH FOR SALE AT END OF PERIOD 48 17 24 7
AVERAGE MONTHLY SUPPLY OF INVENTORY 3.2 2.0 4.0 21.0
AVERAGE SOLD PRICE/ORIGINAL LIST PRICE RATIO 98% 99% 98% 91%
SFHMAY/MAY COMPARISON ALL < $1M $1M - $3M > $3M
AVERAGE LIST PRICE -2% 10% -14% -100%
AVERAGE LIST PRICE PER SQUARE FOOT 14% 20% 11% -100%
AVERAGE SOLD PRICE -1% 4% -11% -100%
AVERAGE SOLD PRICE PER SQUARE FOOT 15% 14% 15% -100%
TOTAL SFH SOLD -27% -54% 17% -100%
TOTAL SFH FOR SALE AT END OF PERIOD -2% -53% 54% -71%
AVERAGE MONTHLY SUPPLY OF INVENTORY 34% 2% 32% -100%
AVERAGE SOLD PRICE/ORIGINAL LIST PRICE RATIO 1% -5% 3% -100%
(Source: MLS/CLAW)
29
CONDOMINIUM SALES HOLLYWOOD HILLS EAST
MAY MARKET OVERVIEWIn Hollywood Hills East there were 13 single family home sales in May 2014, down from 18 in May 2013 and a 18% increase
from the 11 sales closed last month. The average list price for single family home sales in May 2014 was $1,176,000
compared to $999,528 for May 2013, representing an 18% increase. For the three-month period from March to May
2014, the average list price was 2% lower than the same period of the prior year. Average sales price for May 2014 was
$1,156,769, compared to that of March through May 2014, which was $1,103,231. Comparing May 2014 to April 2014,
Hollywood Hills East saw a 5% increase in average sale price, and a 17% increase compared to same month of the prior
year.
CONDOMINIUMS (CONDOS)MAR - MAY 2014 ALL < $1M $1M - $3M > $3M
AVERAGE LIST PRICE $457,325 $457,325 $- $-
AVERAGE LIST PRICE PER SQUARE FOOT $394.27 $394.27 $- $-
AVERAGE SOLD PRICE $462,083 $462,083 $- $-
AVERAGE SOLD PRICE PER SQUARE FOOT $398.38 $398.38 $- $-
TOTAL CONDOS SOLD 12 12 - -
TOTAL CONDOS FOR SALE AT END OF PERIOD - - - -
AVERAGE MONTHLY SUPPLY OF INVENTORY - - - -
AVERAGE SOLD PRICE/ORIGINAL LIST PRICE RATIO 101% 101% 0% 0%
CONDOSMAR - MAY 2013 ALL < $1M $1M - $3M > $3M
AVERAGE LIST PRICE $425,061 $425,061 $- $-
AVERAGE LIST PRICE PER SQUARE FOOT $333.99 $333.99 $- $-
AVERAGE SOLD PRICE $417,954 $417,954 $- $-
AVERAGE SOLD PRICE PER SQUARE FOOT $328.40 $328.40 $- $-
TOTAL CONDOS SOLD 13 13 - -
TOTAL CONDOS FOR SALE AT END OF PERIOD 5 5 - -
AVERAGE MONTHLY SUPPLY OF INVENTORY 1.2 1.2 - -
AVERAGE SOLD PRICE/ORIGINAL LIST PRICE RATIO 98% 98% 0% 0%
CONDOSMAY/MAY COMPARISON ALL < $1M $1M - $3M > $3M
AVERAGE LIST PRICE 8% 8% 0% 0%
AVERAGE LIST PRICE PER SQUARE FOOT 18% 18% 0% 0%
AVERAGE SOLD PRICE 11% 11% 0% 0%
AVERAGE SOLD PRICE PER SQUARE FOOT 21% 21% 0% 0%
TOTAL CONDOS SOLD -8% -8% 0% 0%
TOTAL CONDOS FOR SALE AT END OF PERIOD -100% -100% 0% 0%
AVERAGE MONTHLY SUPPLY OF INVENTORY -100% -100% 0% 0%
AVERAGE SOLD PRICE/ORIGINAL LIST PRICE RATIO 3% 3% 0% 0%
(Source: MLS/CLAW)

30
SINGLE FAMILY HOME SALES
BEVERLY HILLS | BRENTWOOD | LOS FELIZ | MALIBU | PACIFIC PALISADES SANTA MONICA | SUNSET STRIP | sothebyshomes.com/losangeles
Richly immersed with history dating back to the nineteenth century, Los
Feliz is located just south of the Santa Monica Mountains and is adjacent to
Hollywood. The area features the Griffith Observatory, the Greek Theatre,
and the Los Angeles Zoo. Los Feliz homes offer a welcoming and cohesive
community recognized for its chic sophistication. Historic and noted
homes can be found throughout Los Feliz, which has an enclave of celebrity
residents. Los Feliz is known for its grand Spanish estates, charming California
bungalows and many original craftsman homes.
CLICK HERE TO VIEW HOMES WE HAVE AVAILABLE IN THIS AREA
LOS FELIZ
SINGLE FAMILY HOMES (SFH)MAR - MAY 2014 ALL < $1M $1M - $3M > $3M
AVERAGE LIST PRICE $1,543,571 $756,066 $1,698,943 $4,866,000
AVERAGE LIST PRICE PER SQUARE FOOT $617.95 $468.99 $621.85 $827.86
AVERAGE SOLD PRICE $1,552,645 $767,682 $1,711,993 $4,833,000
AVERAGE SOLD PRICE PER SQUARE FOOT $621.53 $476.12 $626.63 $822.25
TOTAL SFH SOLD 68 28 35 5
TOTAL SFH FOR SALE AT END OF PERIOD 75 15 52 8
AVERAGE MONTHLY SUPPLY OF INVENTORY 3.3 1.6 4.5 4.8
AVERAGE SOLD PRICE/ORIGINAL LIST PRICE RATIO 101% 102% 101% 99%
SFHMAR - MAY 2013 ALL < $1M $1M - $3M > $3M
AVERAGE LIST PRICE $1,145,182 $708,088 $1,543,061 $3,938,500
AVERAGE LIST PRICE PER SQUARE FOOT $506.60 $446.85 $521.16 $748.48
AVERAGE SOLD PRICE $1,156,365 $713,203 $1,575,957 $3,737,500
AVERAGE SOLD PRICE PER SQUARE FOOT $511.55 $450.08 $532.27 $710.28
TOTAL SFH SOLD 74 41 31 2
TOTAL SFH FOR SALE AT END OF PERIOD 58 15 31 12
AVERAGE MONTHLY SUPPLY OF INVENTORY 2.4 1.1 3.0 18.0
AVERAGE SOLD PRICE/ORIGINAL LIST PRICE RATIO 101% 101% 102% 95%
SFHMAY/MAY COMPARISON ALL < $1M $1M - $3M > $3M
AVERAGE LIST PRICE 35% 7% 10% 24%
AVERAGE LIST PRICE PER SQUARE FOOT 22% 5% 19% 11%
AVERAGE SOLD PRICE 34% 8% 9% 29%
AVERAGE SOLD PRICE PER SQUARE FOOT 21% 6% 18% 16%
TOTAL SFH SOLD -8% -32% 13% 150%
TOTAL SFH FOR SALE AT END OF PERIOD 29% 0% 68% -33%
AVERAGE MONTHLY SUPPLY OF INVENTORY 41% 46% 49% -73%
AVERAGE SOLD PRICE/ORIGINAL LIST PRICE RATIO 0% 1% -1% 5%
(Source: MLS/CLAW)
31
CONDOMINIUM SALES LOS FELIZ
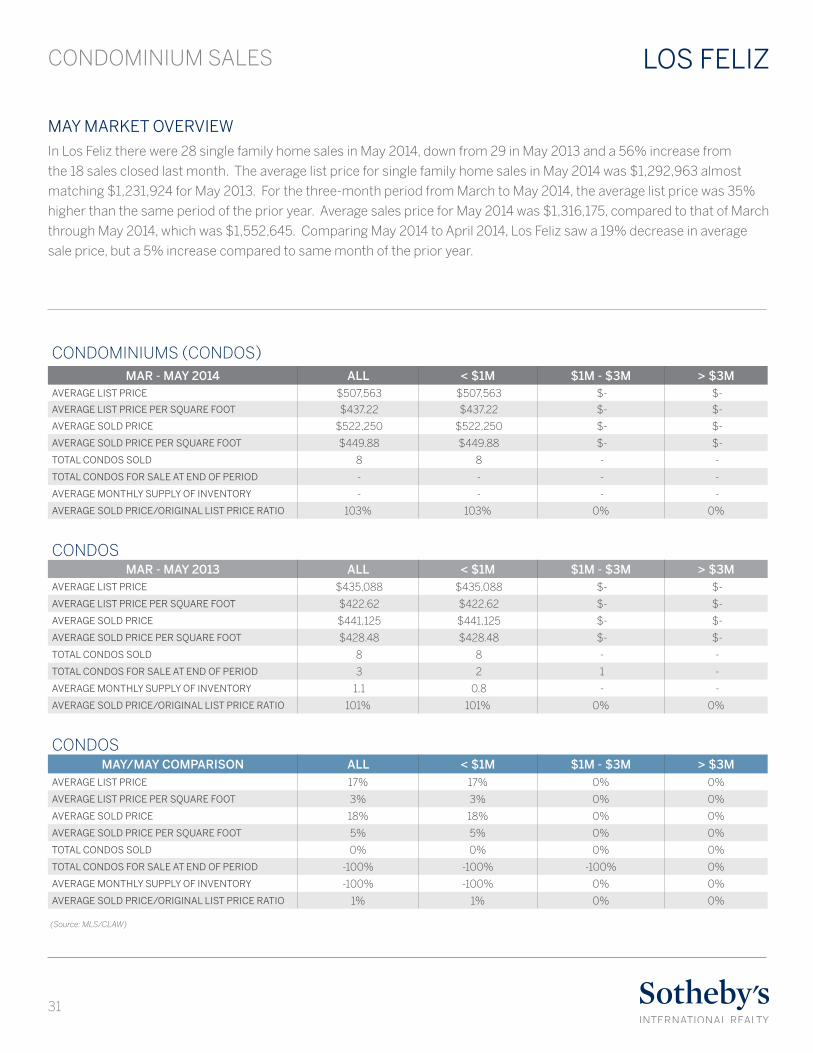
MAY MARKET OVERVIEWIn Los Feliz there were 28 single family home sales in May 2014, down from 29 in May 2013 and a 56% increase from
the 18 sales closed last month. The average list price for single family home sales in May 2014 was $1,292,963 almost
matching $1,231,924 for May 2013. For the three-month period from March to May 2014, the average list price was 35%
higher than the same period of the prior year. Average sales price for May 2014 was $1,316,175, compared to that of March
through May 2014, which was $1,552,645. Comparing May 2014 to April 2014, Los Feliz saw a 19% decrease in average
sale price, but a 5% increase compared to same month of the prior year.
CONDOMINIUMS (CONDOS)MAR - MAY 2014 ALL < $1M $1M - $3M > $3M
AVERAGE LIST PRICE $507,563 $507,563 $- $-
AVERAGE LIST PRICE PER SQUARE FOOT $437.22 $437.22 $- $-
AVERAGE SOLD PRICE $522,250 $522,250 $- $-
AVERAGE SOLD PRICE PER SQUARE FOOT $449.88 $449.88 $- $-
TOTAL CONDOS SOLD 8 8 - -
TOTAL CONDOS FOR SALE AT END OF PERIOD - - - -
AVERAGE MONTHLY SUPPLY OF INVENTORY - - - -
AVERAGE SOLD PRICE/ORIGINAL LIST PRICE RATIO 103% 103% 0% 0%
CONDOSMAR - MAY 2013 ALL < $1M $1M - $3M > $3M
AVERAGE LIST PRICE $435,088 $435,088 $- $-
AVERAGE LIST PRICE PER SQUARE FOOT $422.62 $422.62 $- $-
AVERAGE SOLD PRICE $441,125 $441,125 $- $-
AVERAGE SOLD PRICE PER SQUARE FOOT $428.48 $428.48 $- $-
TOTAL CONDOS SOLD 8 8 - -
TOTAL CONDOS FOR SALE AT END OF PERIOD 3 2 1 -
AVERAGE MONTHLY SUPPLY OF INVENTORY 1.1 0.8 - -
AVERAGE SOLD PRICE/ORIGINAL LIST PRICE RATIO 101% 101% 0% 0%
CONDOSMAY/MAY COMPARISON ALL < $1M $1M - $3M > $3M
AVERAGE LIST PRICE 17% 17% 0% 0%
AVERAGE LIST PRICE PER SQUARE FOOT 3% 3% 0% 0%
AVERAGE SOLD PRICE 18% 18% 0% 0%
AVERAGE SOLD PRICE PER SQUARE FOOT 5% 5% 0% 0%
TOTAL CONDOS SOLD 0% 0% 0% 0%
TOTAL CONDOS FOR SALE AT END OF PERIOD -100% -100% -100% 0%
AVERAGE MONTHLY SUPPLY OF INVENTORY -100% -100% 0% 0%
AVERAGE SOLD PRICE/ORIGINAL LIST PRICE RATIO 1% 1% 0% 0%
(Source: MLS/CLAW)
32
SINGLE FAMILY HOME SALES
BEVERLY HILLS | BRENTWOOD | LOS FELIZ | MALIBU | PACIFIC PALISADES SANTA MONICA | SUNSET STRIP | sothebyshomes.com/losangeles
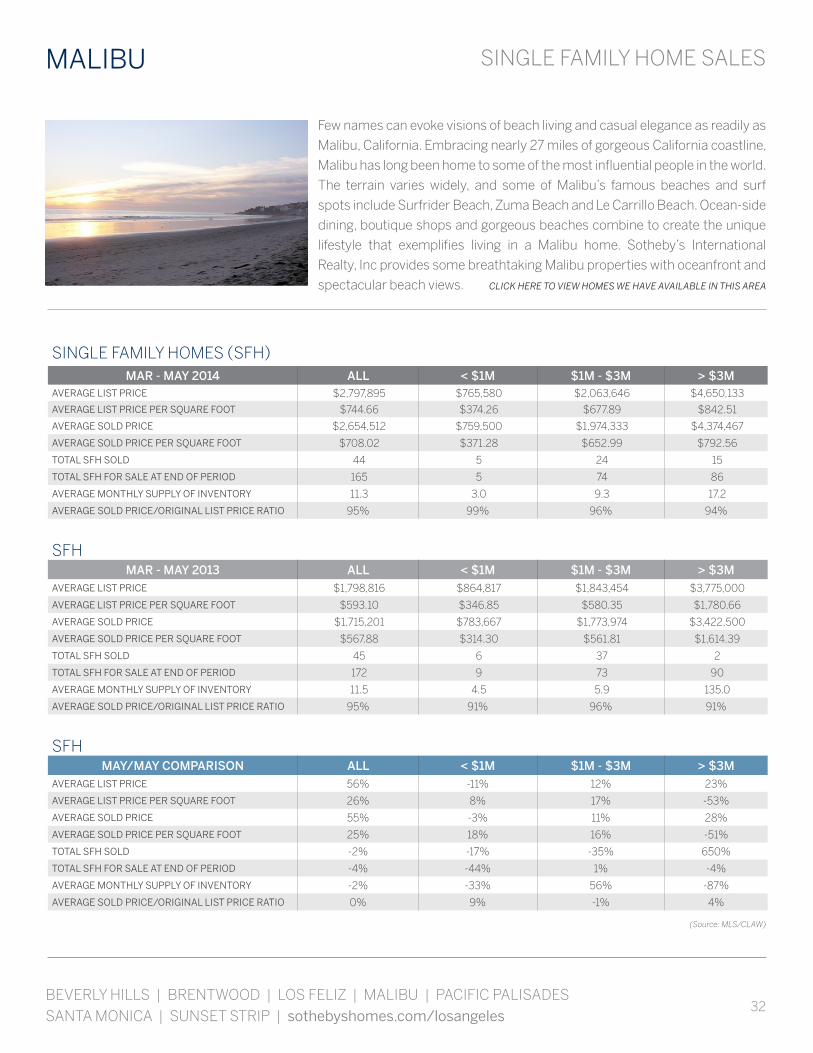
Few names can evoke visions of beach living and casual elegance as readily as
Malibu, California. Embracing nearly 27 miles of gorgeous California coastline,
Malibu has long been home to some of the most influential people in the world.
The terrain varies widely, and some of Malibu’s famous beaches and surf
spots include Surfrider Beach, Zuma Beach and Le Carrillo Beach. Ocean-side
dining, boutique shops and gorgeous beaches combine to create the unique
lifestyle that exemplifies living in a Malibu home. Sotheby’s International
Realty, Inc provides some breathtaking Malibu properties with oceanfront and
spectacular beach views. CLICK HERE TO VIEW HOMES WE HAVE AVAILABLE IN THIS AREA
MALIBU
SINGLE FAMILY HOMES (SFH)MAR - MAY 2014 ALL < $1M $1M - $3M > $3M
AVERAGE LIST PRICE $2,797,895 $765,580 $2,063,646 $4,650,133
AVERAGE LIST PRICE PER SQUARE FOOT $744.66 $374.26 $677.89 $842.51
AVERAGE SOLD PRICE $2,654,512 $759,500 $1,974,333 $4,374,467
AVERAGE SOLD PRICE PER SQUARE FOOT $708.02 $371.28 $652.99 $792.56
TOTAL SFH SOLD 44 5 24 15
TOTAL SFH FOR SALE AT END OF PERIOD 165 5 74 86
AVERAGE MONTHLY SUPPLY OF INVENTORY 11.3 3.0 9.3 17.2
AVERAGE SOLD PRICE/ORIGINAL LIST PRICE RATIO 95% 99% 96% 94%
SFHMAR - MAY 2013 ALL < $1M $1M - $3M > $3M
AVERAGE LIST PRICE $1,798,816 $864,817 $1,843,454 $3,775,000
AVERAGE LIST PRICE PER SQUARE FOOT $593.10 $346.85 $580.35 $1,780.66
AVERAGE SOLD PRICE $1,715,201 $783,667 $1,773,974 $3,422,500
AVERAGE SOLD PRICE PER SQUARE FOOT $567.88 $314.30 $561.81 $1,614.39
TOTAL SFH SOLD 45 6 37 2
TOTAL SFH FOR SALE AT END OF PERIOD 172 9 73 90
AVERAGE MONTHLY SUPPLY OF INVENTORY 11.5 4.5 5.9 135.0
AVERAGE SOLD PRICE/ORIGINAL LIST PRICE RATIO 95% 91% 96% 91%
SFHMAY/MAY COMPARISON ALL < $1M $1M - $3M > $3M
AVERAGE LIST PRICE 56% -11% 12% 23%
AVERAGE LIST PRICE PER SQUARE FOOT 26% 8% 17% -53%
AVERAGE SOLD PRICE 55% -3% 11% 28%
AVERAGE SOLD PRICE PER SQUARE FOOT 25% 18% 16% -51%
TOTAL SFH SOLD -2% -17% -35% 650%
TOTAL SFH FOR SALE AT END OF PERIOD -4% -44% 1% -4%
AVERAGE MONTHLY SUPPLY OF INVENTORY -2% -33% 56% -87%
AVERAGE SOLD PRICE/ORIGINAL LIST PRICE RATIO 0% 9% -1% 4%
(Source: MLS/CLAW)

33
CONDOMINIUM SALES MALIBU
MAY MARKET OVERVIEWIn Malibu there were 18 single family home sales in May 2014, up from 8 in May 2013 and a 13% increase from the 16
sales closed last month. The average list price for single family home sales in May 2014 was $3,046,222 compared to
$2,037,875 for May 2013, representing a 49% increase. For the three-month period from March to May 2014, the average
list price was 56% higher than the same period of the prior year. Average sales price for May 2014 was $2,894,645,
compared to that of March through May 2014, which was $2,654,512. Comparing May 2014 to April 2014, Malibu saw a
12% increase in average sale price, and a 47% increase compared to same month of the prior year.
CONDOMINIUMS (CONDOS)MAR - MAY 2014 ALL < $1M $1M - $3M > $3M
AVERAGE LIST PRICE $1,073,121 $720,356 $1,284,780 $-
AVERAGE LIST PRICE PER SQUARE FOOT $612.42 $384.12 $765.48 $-
AVERAGE SOLD PRICE $1,074,313 $709,833 $1,293,000 $-
AVERAGE SOLD PRICE PER SQUARE FOOT $613.10 $378.51 $770.38 $-
TOTAL CONDOS SOLD 8 3 5 -
TOTAL CONDOS FOR SALE AT END OF PERIOD - - - -
AVERAGE MONTHLY SUPPLY OF INVENTORY - - - -
AVERAGE SOLD PRICE/ORIGINAL LIST PRICE RATIO 100% 99% 101% 0%
CONDOSMAR - MAY 2013 ALL < $1M $1M - $3M > $3M
AVERAGE LIST PRICE $1,105,311 $676,681 $1,362,000 $7,450,000
AVERAGE LIST PRICE PER SQUARE FOOT $642.37 $452.84 $564.56 $1,881.79
AVERAGE SOLD PRICE $1,021,474 $650,500 $1,250,000 $6,500,000
AVERAGE SOLD PRICE PER SQUARE FOOT $593.64 $435.32 $518.13 $1,641.83
TOTAL CONDOS SOLD 19 16 2 1
TOTAL CONDOS FOR SALE AT END OF PERIOD 11 7 4 -
AVERAGE MONTHLY SUPPLY OF INVENTORY 1.7 1.3 6.0 -
AVERAGE SOLD PRICE/ORIGINAL LIST PRICE RATIO 92% 96% 92% 87%
CONDOSMAY/MAY COMPARISON ALL < $1M $1M - $3M > $3M
AVERAGE LIST PRICE -3% 6% -6% -100%
AVERAGE LIST PRICE PER SQUARE FOOT -5% -15% 36% -100%
AVERAGE SOLD PRICE 5% 9% 3% -100%
AVERAGE SOLD PRICE PER SQUARE FOOT 3% -13% 49% -100%
TOTAL CONDOS SOLD -58% -81% 150% -100%
TOTAL CONDOS FOR SALE AT END OF PERIOD -100% -100% -100% 0%
AVERAGE MONTHLY SUPPLY OF INVENTORY -100% -100% -100% 0%
AVERAGE SOLD PRICE/ORIGINAL LIST PRICE RATIO 8% 3% 10% -100%
(Source: MLS/CLAW)
34
SINGLE FAMILY HOME SALES
BEVERLY HILLS | BRENTWOOD | LOS FELIZ | MALIBU | PACIFIC PALISADES SANTA MONICA | SUNSET STRIP | sothebyshomes.com/losangeles
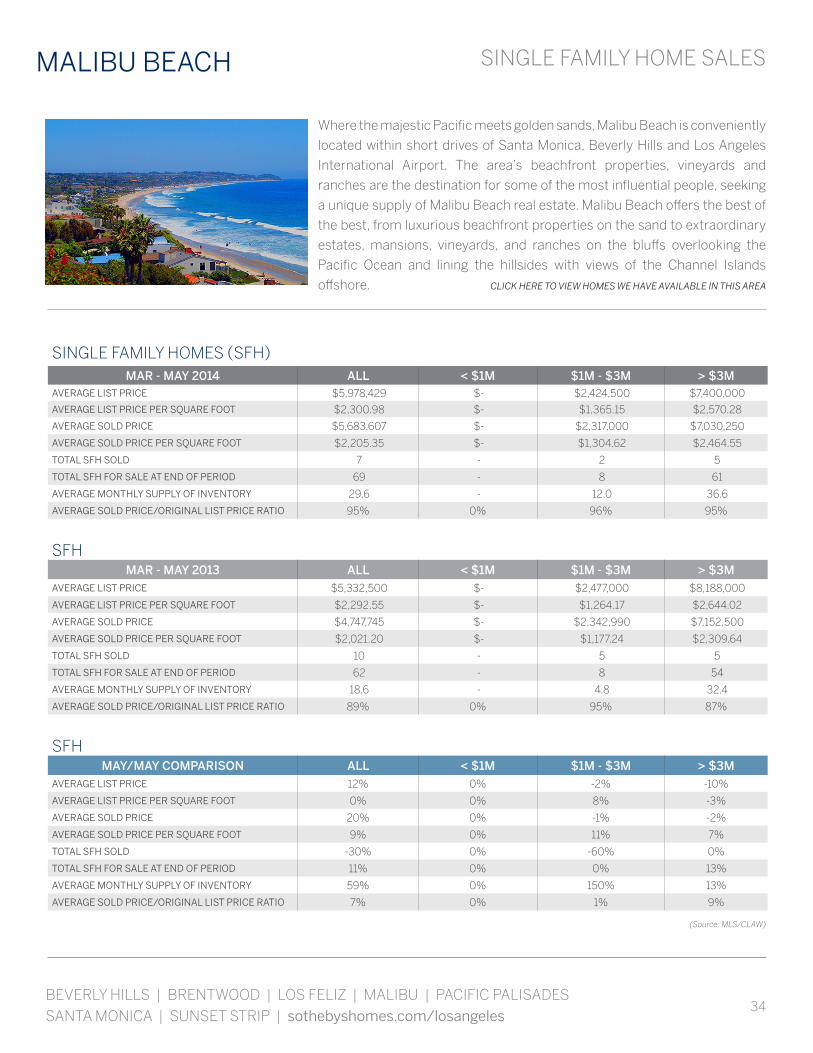
Where the majestic Pacific meets golden sands, Malibu Beach is conveniently
located within short drives of Santa Monica, Beverly Hills and Los Angeles
International Airport. The area’s beachfront properties, vineyards and
ranches are the destination for some of the most influential people, seeking
a unique supply of Malibu Beach real estate. Malibu Beach offers the best of
the best, from luxurious beachfront properties on the sand to extraordinary
estates, mansions, vineyards, and ranches on the bluffs overlooking the
Pacific Ocean and lining the hillsides with views of the Channel Islands
offshore. CLICK HERE TO VIEW HOMES WE HAVE AVAILABLE IN THIS AREA
MALIBU BEACH
SINGLE FAMILY HOMES (SFH)MAR - MAY 2014 ALL < $1M $1M - $3M > $3M
AVERAGE LIST PRICE $5,978,429 $- $2,424,500 $7,400,000
AVERAGE LIST PRICE PER SQUARE FOOT $2,300.98 $- $1,365.15 $2,570.28
AVERAGE SOLD PRICE $5,683,607 $- $2,317,000 $7,030,250
AVERAGE SOLD PRICE PER SQUARE FOOT $2,205.35 $- $1,304.62 $2,464.55
TOTAL SFH SOLD 7 - 2 5
TOTAL SFH FOR SALE AT END OF PERIOD 69 - 8 61
AVERAGE MONTHLY SUPPLY OF INVENTORY 29.6 - 12.0 36.6
AVERAGE SOLD PRICE/ORIGINAL LIST PRICE RATIO 95% 0% 96% 95%
SFHMAR - MAY 2013 ALL < $1M $1M - $3M > $3M
AVERAGE LIST PRICE $5,332,500 $- $2,477,000 $8,188,000
AVERAGE LIST PRICE PER SQUARE FOOT $2,292.55 $- $1,264.17 $2,644.02
AVERAGE SOLD PRICE $4,747,745 $- $2,342,990 $7,152,500
AVERAGE SOLD PRICE PER SQUARE FOOT $2,021.20 $- $1,177.24 $2,309.64
TOTAL SFH SOLD 10 - 5 5
TOTAL SFH FOR SALE AT END OF PERIOD 62 - 8 54
AVERAGE MONTHLY SUPPLY OF INVENTORY 18.6 - 4.8 32.4
AVERAGE SOLD PRICE/ORIGINAL LIST PRICE RATIO 89% 0% 95% 87%
SFHMAY/MAY COMPARISON ALL < $1M $1M - $3M > $3M
AVERAGE LIST PRICE 12% 0% -2% -10%
AVERAGE LIST PRICE PER SQUARE FOOT 0% 0% 8% -3%
AVERAGE SOLD PRICE 20% 0% -1% -2%
AVERAGE SOLD PRICE PER SQUARE FOOT 9% 0% 11% 7%
TOTAL SFH SOLD -30% 0% -60% 0%
TOTAL SFH FOR SALE AT END OF PERIOD 11% 0% 0% 13%
AVERAGE MONTHLY SUPPLY OF INVENTORY 59% 0% 150% 13%
AVERAGE SOLD PRICE/ORIGINAL LIST PRICE RATIO 7% 0% 1% 9%
(Source: MLS/CLAW)
35
CONDOMINIUM SALES MALIBU BEACH
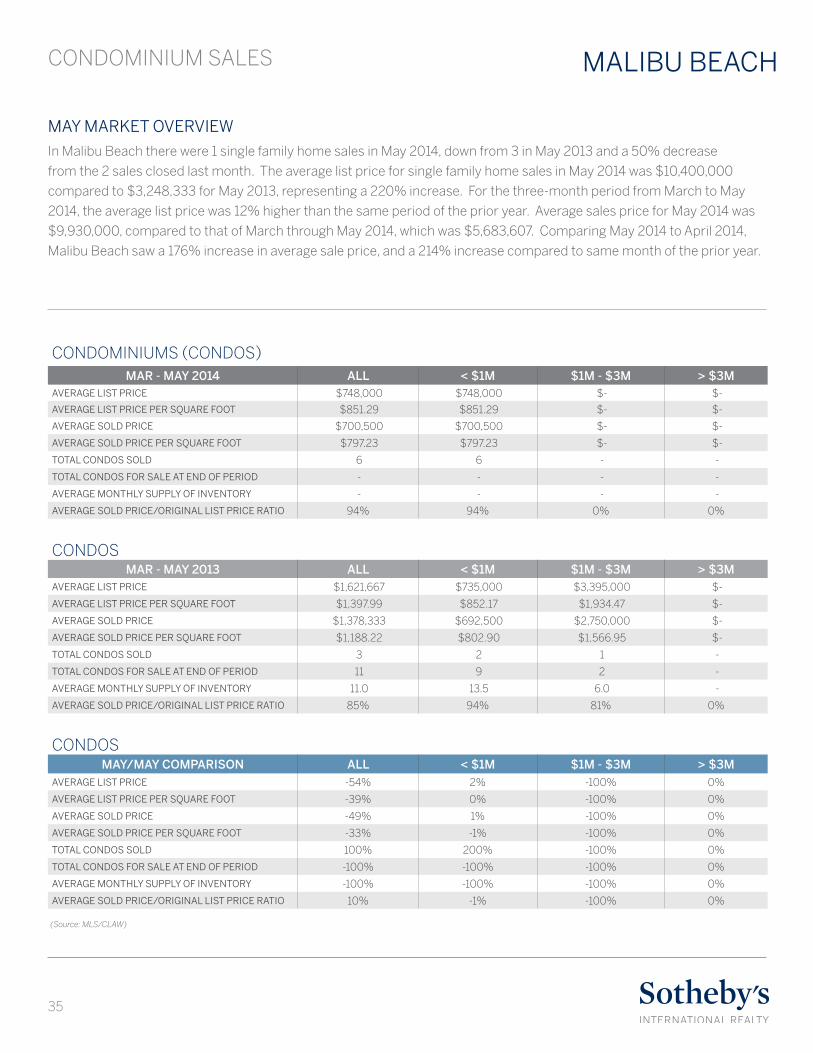
MAY MARKET OVERVIEWIn Malibu Beach there were 1 single family home sales in May 2014, down from 3 in May 2013 and a 50% decrease
from the 2 sales closed last month. The average list price for single family home sales in May 2014 was $10,400,000
compared to $3,248,333 for May 2013, representing a 220% increase. For the three-month period from March to May
2014, the average list price was 12% higher than the same period of the prior year. Average sales price for May 2014 was
$9,930,000, compared to that of March through May 2014, which was $5,683,607. Comparing May 2014 to April 2014,
Malibu Beach saw a 176% increase in average sale price, and a 214% increase compared to same month of the prior year.
CONDOMINIUMS (CONDOS)MAR - MAY 2014 ALL < $1M $1M - $3M > $3M
AVERAGE LIST PRICE $748,000 $748,000 $- $-
AVERAGE LIST PRICE PER SQUARE FOOT $851.29 $851.29 $- $-
AVERAGE SOLD PRICE $700,500 $700,500 $- $-
AVERAGE SOLD PRICE PER SQUARE FOOT $797.23 $797.23 $- $-
TOTAL CONDOS SOLD 6 6 - -
TOTAL CONDOS FOR SALE AT END OF PERIOD - - - -
AVERAGE MONTHLY SUPPLY OF INVENTORY - - - -
AVERAGE SOLD PRICE/ORIGINAL LIST PRICE RATIO 94% 94% 0% 0%
CONDOSMAR - MAY 2013 ALL < $1M $1M - $3M > $3M
AVERAGE LIST PRICE $1,621,667 $735,000 $3,395,000 $-
AVERAGE LIST PRICE PER SQUARE FOOT $1,397.99 $852.17 $1,934.47 $-
AVERAGE SOLD PRICE $1,378,333 $692,500 $2,750,000 $-
AVERAGE SOLD PRICE PER SQUARE FOOT $1,188.22 $802.90 $1,566.95 $-
TOTAL CONDOS SOLD 3 2 1 -
TOTAL CONDOS FOR SALE AT END OF PERIOD 11 9 2 -
AVERAGE MONTHLY SUPPLY OF INVENTORY 11.0 13.5 6.0 -
AVERAGE SOLD PRICE/ORIGINAL LIST PRICE RATIO 85% 94% 81% 0%
CONDOSMAY/MAY COMPARISON ALL < $1M $1M - $3M > $3M
AVERAGE LIST PRICE -54% 2% -100% 0%
AVERAGE LIST PRICE PER SQUARE FOOT -39% 0% -100% 0%
AVERAGE SOLD PRICE -49% 1% -100% 0%
AVERAGE SOLD PRICE PER SQUARE FOOT -33% -1% -100% 0%
TOTAL CONDOS SOLD 100% 200% -100% 0%
TOTAL CONDOS FOR SALE AT END OF PERIOD -100% -100% -100% 0%
AVERAGE MONTHLY SUPPLY OF INVENTORY -100% -100% -100% 0%
AVERAGE SOLD PRICE/ORIGINAL LIST PRICE RATIO 10% -1% -100% 0%
(Source: MLS/CLAW)
36
SINGLE FAMILY HOME SALES
BEVERLY HILLS | BRENTWOOD | LOS FELIZ | MALIBU | PACIFIC PALISADES SANTA MONICA | SUNSET STRIP | sothebyshomes.com/losangeles
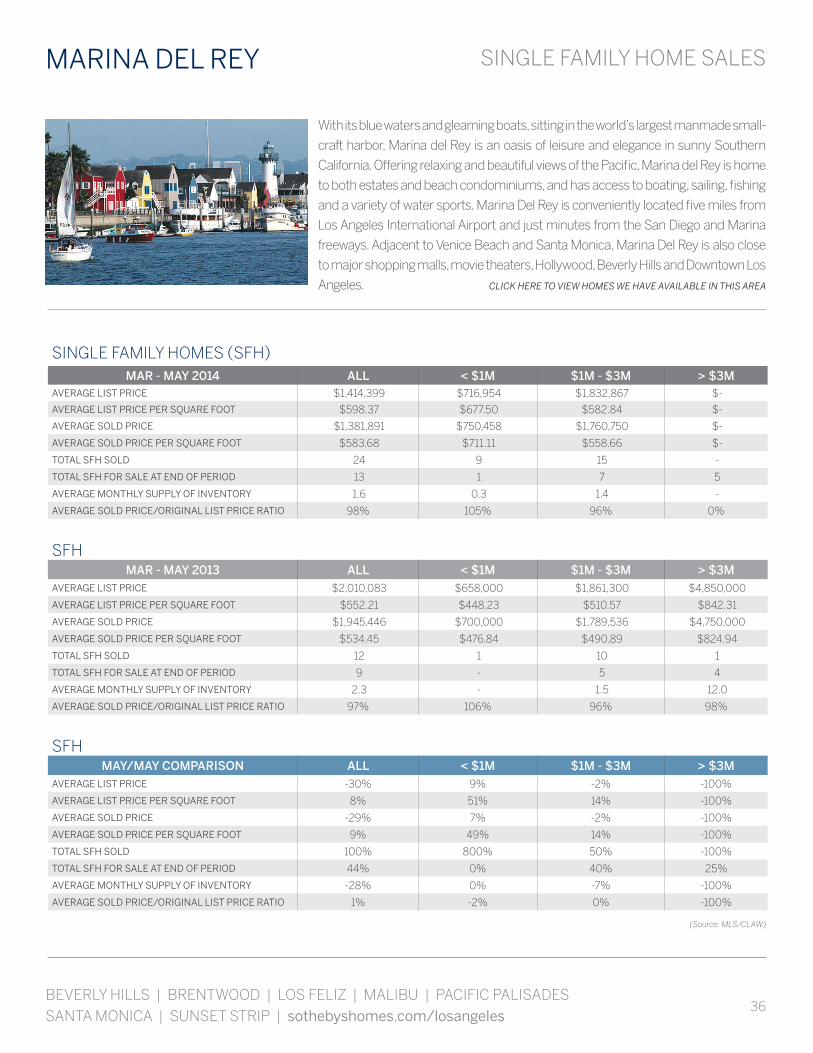
With its blue waters and gleaming boats, sitting in the world’s largest manmade small-
craft harbor, Marina del Rey is an oasis of leisure and elegance in sunny Southern
California. Offering relaxing and beautiful views of the Pacific, Marina del Rey is home
to both estates and beach condominiums, and has access to boating, sailing, fishing
and a variety of water sports. Marina Del Rey is conveniently located five miles from
Los Angeles International Airport and just minutes from the San Diego and Marina
freeways. Adjacent to Venice Beach and Santa Monica, Marina Del Rey is also close
to major shopping malls, movie theaters, Hollywood, Beverly Hills and Downtown Los
Angeles. CLICK HERE TO VIEW HOMES WE HAVE AVAILABLE IN THIS AREA
MARINA DEL REY
SINGLE FAMILY HOMES (SFH)MAR - MAY 2014 ALL < $1M $1M - $3M > $3M
AVERAGE LIST PRICE $1,414,399 $716,954 $1,832,867 $-
AVERAGE LIST PRICE PER SQUARE FOOT $598.37 $677.50 $582.84 $-
AVERAGE SOLD PRICE $1,381,891 $750,458 $1,760,750 $-
AVERAGE SOLD PRICE PER SQUARE FOOT $583.68 $711.11 $558.66 $-
TOTAL SFH SOLD 24 9 15 -
TOTAL SFH FOR SALE AT END OF PERIOD 13 1 7 5
AVERAGE MONTHLY SUPPLY OF INVENTORY 1.6 0.3 1.4 -
AVERAGE SOLD PRICE/ORIGINAL LIST PRICE RATIO 98% 105% 96% 0%
SFHMAR - MAY 2013 ALL < $1M $1M - $3M > $3M
AVERAGE LIST PRICE $2,010,083 $658,000 $1,861,300 $4,850,000
AVERAGE LIST PRICE PER SQUARE FOOT $552.21 $448.23 $510.57 $842.31
AVERAGE SOLD PRICE $1,945,446 $700,000 $1,789,536 $4,750,000
AVERAGE SOLD PRICE PER SQUARE FOOT $534.45 $476.84 $490.89 $824.94
TOTAL SFH SOLD 12 1 10 1
TOTAL SFH FOR SALE AT END OF PERIOD 9 - 5 4
AVERAGE MONTHLY SUPPLY OF INVENTORY 2.3 - 1.5 12.0
AVERAGE SOLD PRICE/ORIGINAL LIST PRICE RATIO 97% 106% 96% 98%
SFHMAY/MAY COMPARISON ALL < $1M $1M - $3M > $3M
AVERAGE LIST PRICE -30% 9% -2% -100%
AVERAGE LIST PRICE PER SQUARE FOOT 8% 51% 14% -100%
AVERAGE SOLD PRICE -29% 7% -2% -100%
AVERAGE SOLD PRICE PER SQUARE FOOT 9% 49% 14% -100%
TOTAL SFH SOLD 100% 800% 50% -100%
TOTAL SFH FOR SALE AT END OF PERIOD 44% 0% 40% 25%
AVERAGE MONTHLY SUPPLY OF INVENTORY -28% 0% -7% -100%
AVERAGE SOLD PRICE/ORIGINAL LIST PRICE RATIO 1% -2% 0% -100%
(Source: MLS/CLAW)
37
CONDOMINIUM SALES MARINA DEL REY
MAY MARKET OVERVIEWIn Marina Del Rey there were 30 condominium sales in May 2014, down from 32 in May 2013 and a 11% increase from the
27 sales closed last month. The average list price for condo sales in May 2014 was $838,707 almost matching $850,519
for May 2013. For the three-month period from March to May 2014, the average list price was 8% higher than the same
period of the prior year. Average sales price for May 2014 was $825,577, compared to that of March through May 2014,
which was $854,848. Comparing May 2014 to April 2014, Marina Del Rey saw a 13% decrease in average sale price, and a
2% decrease compared to same month of the prior year.
CONDOMINIUMS (CONDOS)MAR - MAY 2014 ALL < $1M $1M - $3M > $3M
AVERAGE LIST PRICE $872,994 $714,726 $1,450,206 $-
AVERAGE LIST PRICE PER SQUARE FOOT $543.73 $464.75 $800.31 $-
AVERAGE SOLD PRICE $854,848 $705,323 $1,400,176 $-
AVERAGE SOLD PRICE PER SQUARE FOOT $532.48 $458.57 $772.59 $-
TOTAL CONDOS SOLD 79 62 17 -
TOTAL CONDOS FOR SALE AT END OF PERIOD - - - -
AVERAGE MONTHLY SUPPLY OF INVENTORY - - - -
AVERAGE SOLD PRICE/ORIGINAL LIST PRICE RATIO 98% 99% 97% 0%
CONDOSMAR - MAY 2013 ALL < $1M $1M - $3M > $3M
AVERAGE LIST PRICE $805,242 $613,186 $1,683,214 $-
AVERAGE LIST PRICE PER SQUARE FOOT $508.54 $414.81 $842.63 $-
AVERAGE SOLD PRICE $798,580 $618,884 $1,620,052 $-
AVERAGE SOLD PRICE PER SQUARE FOOT $504.25 $418.66 $809.31 $-
TOTAL CONDOS SOLD 78 64 14 -
TOTAL CONDOS FOR SALE AT END OF PERIOD 100 48 48 4
AVERAGE MONTHLY SUPPLY OF INVENTORY 3.8 2.3 10.3 -
AVERAGE SOLD PRICE/ORIGINAL LIST PRICE RATIO 99% 101% 96% 0%
CONDOSMAY/MAY COMPARISON ALL < $1M $1M - $3M > $3M
AVERAGE LIST PRICE 8% 17% -14% 0%
AVERAGE LIST PRICE PER SQUARE FOOT 7% 12% -5% 0%
AVERAGE SOLD PRICE 7% 14% -14% 0%
AVERAGE SOLD PRICE PER SQUARE FOOT 6% 10% -5% 0%
TOTAL CONDOS SOLD 1% -3% 21% 0%
TOTAL CONDOS FOR SALE AT END OF PERIOD -100% -100% -100% -100%
AVERAGE MONTHLY SUPPLY OF INVENTORY -100% -100% -100% 0%
AVERAGE SOLD PRICE/ORIGINAL LIST PRICE RATIO -1% -2% 0% 0%
(Source: MLS/CLAW)
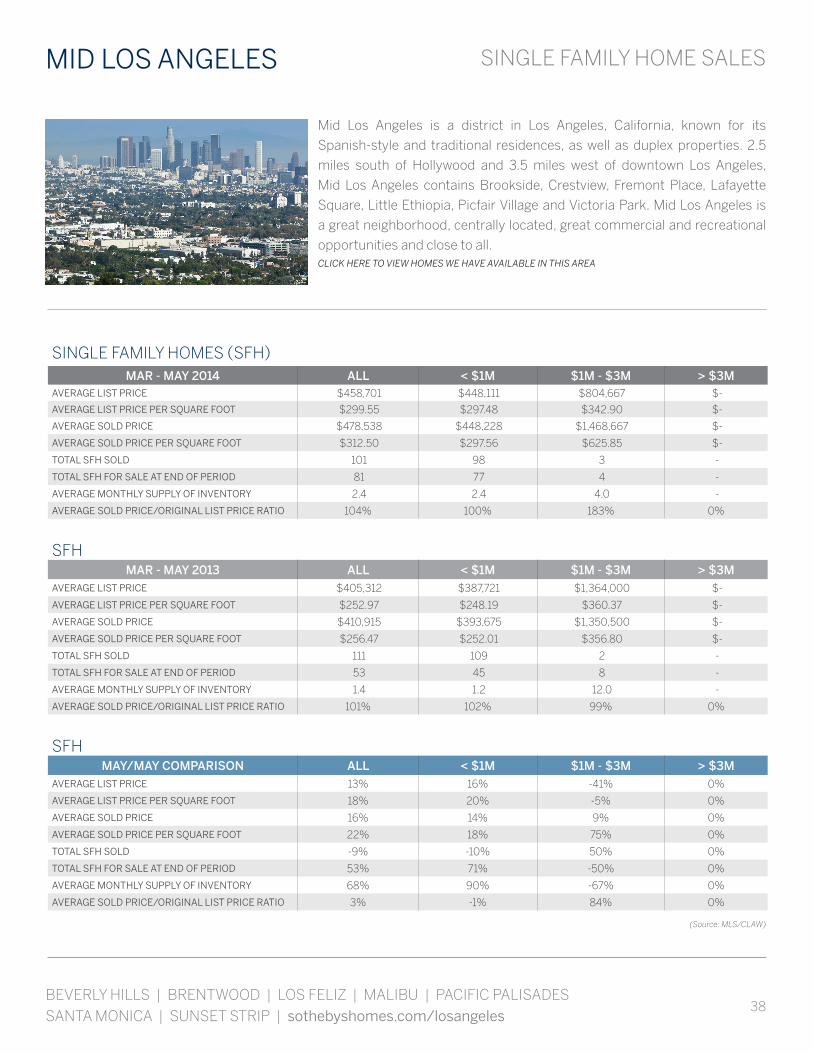
38
SINGLE FAMILY HOME SALES
BEVERLY HILLS | BRENTWOOD | LOS FELIZ | MALIBU | PACIFIC PALISADES SANTA MONICA | SUNSET STRIP | sothebyshomes.com/losangeles
Mid Los Angeles is a district in Los Angeles, California, known for its
Spanish-style and traditional residences, as well as duplex properties. 2.5
miles south of Hollywood and 3.5 miles west of downtown Los Angeles,
Mid Los Angeles contains Brookside, Crestview, Fremont Place, Lafayette
Square, Little Ethiopia, Picfair Village and Victoria Park. Mid Los Angeles is
a great neighborhood, centrally located, great commercial and recreational
opportunities and close to all.CLICK HERE TO VIEW HOMES WE HAVE AVAILABLE IN THIS AREA
MID LOS ANGELES
SINGLE FAMILY HOMES (SFH)MAR - MAY 2014 ALL < $1M $1M - $3M > $3M
AVERAGE LIST PRICE $458,701 $448,111 $804,667 $-
AVERAGE LIST PRICE PER SQUARE FOOT $299.55 $297.48 $342.90 $-
AVERAGE SOLD PRICE $478,538 $448,228 $1,468,667 $-
AVERAGE SOLD PRICE PER SQUARE FOOT $312.50 $297.56 $625.85 $-
TOTAL SFH SOLD 101 98 3 -
TOTAL SFH FOR SALE AT END OF PERIOD 81 77 4 -
AVERAGE MONTHLY SUPPLY OF INVENTORY 2.4 2.4 4.0 -
AVERAGE SOLD PRICE/ORIGINAL LIST PRICE RATIO 104% 100% 183% 0%
SFHMAR - MAY 2013 ALL < $1M $1M - $3M > $3M
AVERAGE LIST PRICE $405,312 $387,721 $1,364,000 $-
AVERAGE LIST PRICE PER SQUARE FOOT $252.97 $248.19 $360.37 $-
AVERAGE SOLD PRICE $410,915 $393,675 $1,350,500 $-
AVERAGE SOLD PRICE PER SQUARE FOOT $256.47 $252.01 $356.80 $-
TOTAL SFH SOLD 111 109 2 -
TOTAL SFH FOR SALE AT END OF PERIOD 53 45 8 -
AVERAGE MONTHLY SUPPLY OF INVENTORY 1.4 1.2 12.0 -
AVERAGE SOLD PRICE/ORIGINAL LIST PRICE RATIO 101% 102% 99% 0%
SFHMAY/MAY COMPARISON ALL < $1M $1M - $3M > $3M
AVERAGE LIST PRICE 13% 16% -41% 0%
AVERAGE LIST PRICE PER SQUARE FOOT 18% 20% -5% 0%
AVERAGE SOLD PRICE 16% 14% 9% 0%
AVERAGE SOLD PRICE PER SQUARE FOOT 22% 18% 75% 0%
TOTAL SFH SOLD -9% -10% 50% 0%
TOTAL SFH FOR SALE AT END OF PERIOD 53% 71% -50% 0%
AVERAGE MONTHLY SUPPLY OF INVENTORY 68% 90% -67% 0%
AVERAGE SOLD PRICE/ORIGINAL LIST PRICE RATIO 3% -1% 84% 0%
(Source: MLS/CLAW)
39
CONDOMINIUM SALES MID LOS ANGELES
MAY MARKET OVERVIEWIn Mid Los Angeles there were 36 single family home sales in May 2014, down from 37 in May 2013 and a 38% increase
from the 26 sales closed last month. The average list price for single family home sales in May 2014 was $437,285 almost
matching $458,948 for May 2013. For the three-month period from March to May 2014, the average list price was 13%
higher than the same period of the prior year. Average sales price for May 2014 was $493,750, compared to that of March
through May 2014, which was $478,538. Comparing May 2014 to April 2014, Mid Los Angeles saw a 4% decrease in
average sale price, but a 4% increase compared to same month of the prior year.
CONDOMINIUMS (CONDOS)MAR - MAY 2014 ALL < $1M $1M - $3M > $3M
AVERAGE LIST PRICE $- $- $- $-
AVERAGE LIST PRICE PER SQUARE FOOT $- $- $- $-
AVERAGE SOLD PRICE $- $- $- $-
AVERAGE SOLD PRICE PER SQUARE FOOT $- $- $- $-
TOTAL CONDOS SOLD - - - -
TOTAL CONDOS FOR SALE AT END OF PERIOD - - - -
AVERAGE MONTHLY SUPPLY OF INVENTORY - - - -
AVERAGE SOLD PRICE/ORIGINAL LIST PRICE RATIO 0% 0% 0% 0%
CONDOSMAR - MAY 2013 ALL < $1M $1M - $3M > $3M
AVERAGE LIST PRICE $177,450 $177,450 $- $-
AVERAGE LIST PRICE PER SQUARE FOOT $172.20 $172.20 $- $-
AVERAGE SOLD PRICE $185,000 $185,000 $- $-
AVERAGE SOLD PRICE PER SQUARE FOOT $179.52 $179.52 $- $-
TOTAL CONDOS SOLD 2 2 - -
TOTAL CONDOS FOR SALE AT END OF PERIOD 2 2 - -
AVERAGE MONTHLY SUPPLY OF INVENTORY 3.0 3.0 - -
AVERAGE SOLD PRICE/ORIGINAL LIST PRICE RATIO 104% 104% 0% 0%
CONDOSMAY/MAY COMPARISON ALL < $1M $1M - $3M > $3M
AVERAGE LIST PRICE -100% -100% 0% 0%
AVERAGE LIST PRICE PER SQUARE FOOT -100% -100% 0% 0%
AVERAGE SOLD PRICE -100% -100% 0% 0%
AVERAGE SOLD PRICE PER SQUARE FOOT -100% -100% 0% 0%
TOTAL CONDOS SOLD -100% -100% 0% 0%
TOTAL CONDOS FOR SALE AT END OF PERIOD -100% -100% 0% 0%
AVERAGE MONTHLY SUPPLY OF INVENTORY -100% -100% 0% 0%
AVERAGE SOLD PRICE/ORIGINAL LIST PRICE RATIO -100% -100% 0% 0%
(Source: MLS/CLAW)
40
SINGLE FAMILY HOME SALES
BEVERLY HILLS | BRENTWOOD | LOS FELIZ | MALIBU | PACIFIC PALISADES SANTA MONICA | SUNSET STRIP | sothebyshomes.com/losangeles
Mid Wilshire, also known as Midtown, contains neighborhoods like Hancock
Park, Windsor Square, Carthay Circle and Lafayette Square. Mid Wilshire
offers some of Los Angeles’s most magnificent residential architecture,
primarily in traditional city neighborhood settings. Mid Wilshire contains
Little Ethiopia, Miracle Mile, Park La Brea, Park Mile and Wilshire Vista, all
known for the area’s stunning residential architecture. CLICK HERE TO VIEW HOMES WE HAVE AVAILABLE IN THIS AREA
MID WILSHIRE
SINGLE FAMILY HOMES (SFH)MAR - MAY 2014 ALL < $1M $1M - $3M > $3M
AVERAGE LIST PRICE $719,400 $696,556 $925,000 $-
AVERAGE LIST PRICE PER SQUARE FOOT $338.48 $332.27 $387.52 $-
AVERAGE SOLD PRICE $720,450 $688,278 $1,010,000 $-
AVERAGE SOLD PRICE PER SQUARE FOOT $338.97 $328.32 $423.13 $-
TOTAL SFH SOLD 10 9 1 -
TOTAL SFH FOR SALE AT END OF PERIOD 17 15 2 -
AVERAGE MONTHLY SUPPLY OF INVENTORY 5.1 5.0 6.0 -
AVERAGE SOLD PRICE/ORIGINAL LIST PRICE RATIO 100% 99% 109% 0%
SFHMAR - MAY 2013 ALL < $1M $1M - $3M > $3M
AVERAGE LIST PRICE $469,771 $469,771 $- $-
AVERAGE LIST PRICE PER SQUARE FOOT $262.23 $262.23 $- $-
AVERAGE SOLD PRICE $481,607 $481,607 $- $-
AVERAGE SOLD PRICE PER SQUARE FOOT $268.84 $268.84 $- $-
TOTAL SFH SOLD 14 14 - -
TOTAL SFH FOR SALE AT END OF PERIOD 16 14 2 -
AVERAGE MONTHLY SUPPLY OF INVENTORY 3.4 3.0 - -
AVERAGE SOLD PRICE/ORIGINAL LIST PRICE RATIO 103% 103% 0% 0%
SFHMAY/MAY COMPARISON ALL < $1M $1M - $3M > $3M
AVERAGE LIST PRICE 53% 48% 0% 0%
AVERAGE LIST PRICE PER SQUARE FOOT 29% 27% 0% 0%
AVERAGE SOLD PRICE 50% 43% 0% 0%
AVERAGE SOLD PRICE PER SQUARE FOOT 26% 22% 0% 0%
TOTAL SFH SOLD -29% -36% 0% 0%
TOTAL SFH FOR SALE AT END OF PERIOD 6% 7% 0% 0%
AVERAGE MONTHLY SUPPLY OF INVENTORY 49% 67% 0% 0%
AVERAGE SOLD PRICE/ORIGINAL LIST PRICE RATIO -2% -4% 0% 0%
(Source: MLS/CLAW)
41
CONDOMINIUM SALES MID WILSHIRE
MAY MARKET OVERVIEWIn Mid Wilshire there were 15 condominium sales in May 2014, down from 27 in May 2013 and a 67% increase from the 9
sales closed last month. The average list price for condo sales in May 2014 was $562,000 compared to $410,311 for May
2013, representing a 37% increase. For the three-month period from March to May 2014, the average list price was 18%
higher than the same period of the prior year. Average sales price for May 2014 was $554,767, compared to that of March
through May 2014, which was $472,078. Comparing May 2014 to April 2014, Mid Wilshire saw a 17% increase in average
sale price, and a 36% increase compared to same month of the prior year.
CONDOMINIUMS (CONDOS)MAR - MAY 2014 ALL < $1M $1M - $3M > $3M
AVERAGE LIST PRICE $482,889 $482,889 $- $-
AVERAGE LIST PRICE PER SQUARE FOOT $405.83 $405.83 $- $-
AVERAGE SOLD PRICE $472,078 $472,078 $- $-
AVERAGE SOLD PRICE PER SQUARE FOOT $396.74 $396.74 $- $-
TOTAL CONDOS SOLD 37 37 - -
TOTAL CONDOS FOR SALE AT END OF PERIOD - - - -
AVERAGE MONTHLY SUPPLY OF INVENTORY - - - -
AVERAGE SOLD PRICE/ORIGINAL LIST PRICE RATIO 98% 98% 0% 0%
CONDOSMAR - MAY 2013 ALL < $1M $1M - $3M > $3M
AVERAGE LIST PRICE $410,577 $410,577 $- $-
AVERAGE LIST PRICE PER SQUARE FOOT $375.34 $375.34 $- $-
AVERAGE SOLD PRICE $410,178 $410,178 $- $-
AVERAGE SOLD PRICE PER SQUARE FOOT $374.97 $374.97 $- $-
TOTAL CONDOS SOLD 60 60 - -
TOTAL CONDOS FOR SALE AT END OF PERIOD 48 47 1 -
AVERAGE MONTHLY SUPPLY OF INVENTORY 2.4 2.4 - -
AVERAGE SOLD PRICE/ORIGINAL LIST PRICE RATIO 100% 100% 0% 0%
CONDOSMAY/MAY COMPARISON ALL < $1M $1M - $3M > $3M
AVERAGE LIST PRICE 18% 18% 0% 0%
AVERAGE LIST PRICE PER SQUARE FOOT 8% 8% 0% 0%
AVERAGE SOLD PRICE 15% 15% 0% 0%
AVERAGE SOLD PRICE PER SQUARE FOOT 6% 6% 0% 0%
TOTAL CONDOS SOLD -38% -38% 0% 0%
TOTAL CONDOS FOR SALE AT END OF PERIOD -100% -100% -100% 0%
AVERAGE MONTHLY SUPPLY OF INVENTORY -100% -100% 0% 0%
AVERAGE SOLD PRICE/ORIGINAL LIST PRICE RATIO -2% -2% 0% 0%
(Source: MLS/CLAW)

42
SINGLE FAMILY HOME SALES
BEVERLY HILLS | BRENTWOOD | LOS FELIZ | MALIBU | PACIFIC PALISADES SANTA MONICA | SUNSET STRIP | sothebyshomes.com/losangeles
Founded in 1909, Mount Washington is located on the eastside of Los Angeles
neighboring Glassell Park, Eagle Rock, Highland Park and Montecito Heights
and its close proximity to both Pasadena and Downtown Los Angeles have
made it popular for homebuyers. It is known for the many 1950s and 1960s
modernist homes that can be found here. Recently the area has become a
more affordable alternative to the more pricey Westside.
CLICK HERE TO VIEW HOMES WE HAVE AVAILABLE IN THIS AREA
MOUNT WASHINGTON
SINGLE FAMILY HOMES (SFH)MAR - MAY 2014 ALL < $1M $1M - $3M > $3M
AVERAGE LIST PRICE $605,492 $595,505 $985,000 $-
AVERAGE LIST PRICE PER SQUARE FOOT $475.55 $488.27 $301.68 $-
AVERAGE SOLD PRICE $623,956 $613,271 $1,030,000 $-
AVERAGE SOLD PRICE PER SQUARE FOOT $491.38 $504.25 $315.47 $-
TOTAL SFH SOLD 39 38 1 -
TOTAL SFH FOR SALE AT END OF PERIOD 20 17 3 -
AVERAGE MONTHLY SUPPLY OF INVENTORY 1.5 1.3 9.0 -
AVERAGE SOLD PRICE/ORIGINAL LIST PRICE RATIO 103% 103% 105% 0%
SFHMAR - MAY 2013 ALL < $1M $1M - $3M > $3M
AVERAGE LIST PRICE $535,833 $535,833 $- $-
AVERAGE LIST PRICE PER SQUARE FOOT $336.11 $336.11 $- $-
AVERAGE SOLD PRICE $549,320 $549,320 $- $-
AVERAGE SOLD PRICE PER SQUARE FOOT $344.57 $344.57 $- $-
TOTAL SFH SOLD 50 50 - -
TOTAL SFH FOR SALE AT END OF PERIOD 30 27 3 -
AVERAGE MONTHLY SUPPLY OF INVENTORY 1.8 1.6 - -
AVERAGE SOLD PRICE/ORIGINAL LIST PRICE RATIO 103% 103% 0% 0%
SFHMAY/MAY COMPARISON ALL < $1M $1M - $3M > $3M
AVERAGE LIST PRICE 13% 11% 0% 0%
AVERAGE LIST PRICE PER SQUARE FOOT 41% 45% 0% 0%
AVERAGE SOLD PRICE 14% 12% 0% 0%
AVERAGE SOLD PRICE PER SQUARE FOOT 43% 46% 0% 0%
TOTAL SFH SOLD -22% -24% 0% 0%
TOTAL SFH FOR SALE AT END OF PERIOD -33% -37% 0% 0%
AVERAGE MONTHLY SUPPLY OF INVENTORY -15% -17% 0% 0%
AVERAGE SOLD PRICE/ORIGINAL LIST PRICE RATIO 1% 0% 0% 0%
(Source: MLS/CLAW)
43
CONDOMINIUM SALES MOUNT WASHINGTON
MAY MARKET OVERVIEWIn Mount Washington there were 15 single family home sales in May 2014, which is the same as May 2013 and a similar
performance from the 15 sales closed last month. The average list price for single family home sales in May 2014 was
$660,200 compared to $558,420 for May 2013, representing an 18% increase. For the three-month period from March to
May 2014, the average list price was 13% higher than the same period of the prior year. Average sales price for May 2014
was $686,167, compared to that of March through May 2014, which was $623,956. Comparing May 2014 to April 2014,
Mount Washington saw a 15% increase in average sale price, and a 21% increase compared to same month of the prior
year.
CONDOMINIUMS (CONDOS)MAR - MAY 2014 ALL < $1M $1M - $3M > $3M
AVERAGE LIST PRICE $- $- $- $-
AVERAGE LIST PRICE PER SQUARE FOOT $- $- $- $-
AVERAGE SOLD PRICE $- $- $- $-
AVERAGE SOLD PRICE PER SQUARE FOOT $- $- $- $-
TOTAL CONDOS SOLD - - - -
TOTAL CONDOS FOR SALE AT END OF PERIOD - - - -
AVERAGE MONTHLY SUPPLY OF INVENTORY - - - -
AVERAGE SOLD PRICE/ORIGINAL LIST PRICE RATIO 0% 0% 0% 0%
CONDOSMAR - MAY 2013 ALL < $1M $1M - $3M > $3M
AVERAGE LIST PRICE $- $- $- $-
AVERAGE LIST PRICE PER SQUARE FOOT $- $- $- $-
AVERAGE SOLD PRICE $- $- $- $-
AVERAGE SOLD PRICE PER SQUARE FOOT $- $- $- $-
TOTAL CONDOS SOLD - - - -
TOTAL CONDOS FOR SALE AT END OF PERIOD - - - -
AVERAGE MONTHLY SUPPLY OF INVENTORY - - - -
AVERAGE SOLD PRICE/ORIGINAL LIST PRICE RATIO 0% 0% 0% 0%
CONDOSMAY/MAY COMPARISON ALL < $1M $1M - $3M > $3M
AVERAGE LIST PRICE 0% 0% 0% 0%
AVERAGE LIST PRICE PER SQUARE FOOT 0% 0% 0% 0%
AVERAGE SOLD PRICE 0% 0% 0% 0%
AVERAGE SOLD PRICE PER SQUARE FOOT 0% 0% 0% 0%
TOTAL CONDOS SOLD 0% 0% 0% 0%
TOTAL CONDOS FOR SALE AT END OF PERIOD 0% 0% 0% 0%
AVERAGE MONTHLY SUPPLY OF INVENTORY 0% 0% 0% 0%
AVERAGE SOLD PRICE/ORIGINAL LIST PRICE RATIO 0% 0% 0% 0%
(Source: MLS/CLAW)

44
SINGLE FAMILY HOME SALES
BEVERLY HILLS | BRENTWOOD | LOS FELIZ | MALIBU | PACIFIC PALISADES SANTA MONICA | SUNSET STRIP | sothebyshomes.com/losangeles
Among Los Angeles’ most desired neighborhoods, Pacific Palisades sits against a
stunning backdrop with views of the Santa Monica mountains, the Pacific Coast,
and several canyons that run between them. Pacific Palisades is home to the well-
known J. Paul Getty Villa museum and beautiful parks offering sporting activities and
breathtaking views including Topanga Canyon State Park, Will Rogers State Historic
Park and Polo Club, and Rustin Canyon Park, as well as community events such as the
annual parade and fireworks display. Pacific Palisades offers sophisticated traditional
estates, dramatic architectural residences, custom-built properties and inviting
homes close to Palisades Village. CLICK HERE TO VIEW HOMES WE HAVE AVAILABLE IN THIS AREA
PACIFIC PALISADES
SINGLE FAMILY HOMES (SFH)MAR - MAY 2014 ALL < $1M $1M - $3M > $3M
AVERAGE LIST PRICE $3,469,354 $875,000 $1,952,841 $5,342,892
AVERAGE LIST PRICE PER SQUARE FOOT $937.53 $- $825.15 $1,005.36
AVERAGE SOLD PRICE $3,419,540 $825,000 $1,971,491 $5,211,666
AVERAGE SOLD PRICE PER SQUARE FOOT $926.94 $- $834.33 $982.82
TOTAL SFH SOLD 82 1 44 37
TOTAL SFH FOR SALE AT END OF PERIOD 72 - 35 37
AVERAGE MONTHLY SUPPLY OF INVENTORY 2.6 - 2.4 3.0
AVERAGE SOLD PRICE/ORIGINAL LIST PRICE RATIO 99% 94% 101% 98%
SFHMAR - MAY 2013 ALL < $1M $1M - $3M > $3M
AVERAGE LIST PRICE $2,732,285 $699,000 $1,926,233 $4,763,615
AVERAGE LIST PRICE PER SQUARE FOOT $787.46 $607.83 $664.34 $961.66
AVERAGE SOLD PRICE $2,734,743 $610,000 $1,932,236 $4,761,000
AVERAGE SOLD PRICE PER SQUARE FOOT $787.92 $530.43 $667.22 $959.45
TOTAL SFH SOLD 90 1 63 26
TOTAL SFH FOR SALE AT END OF PERIOD 81 1 37 43
AVERAGE MONTHLY SUPPLY OF INVENTORY 2.7 3.0 1.8 5.0
AVERAGE SOLD PRICE/ORIGINAL LIST PRICE RATIO 100% 87% 100% 100%
SFHMAY/MAY COMPARISON ALL < $1M $1M - $3M > $3M
AVERAGE LIST PRICE 27% 25% 1% 12%
AVERAGE LIST PRICE PER SQUARE FOOT 19% -100% 24% 5%
AVERAGE SOLD PRICE 25% 35% 2% 9%
AVERAGE SOLD PRICE PER SQUARE FOOT 18% -100% 25% 2%
TOTAL SFH SOLD -9% 0% -30% 42%
TOTAL SFH FOR SALE AT END OF PERIOD -11% -100% -5% -14%
AVERAGE MONTHLY SUPPLY OF INVENTORY -2% -100% 35% -40%
AVERAGE SOLD PRICE/ORIGINAL LIST PRICE RATIO -2% 8% 1% -2%
(Source: MLS/CLAW)
45
CONDOMINIUM SALES PACIFIC PALISADES
MAY MARKET OVERVIEWIn Pacific Palisades there were 29 single family home sales in May 2014, down from 35 in May 2013 and a 21% increase
from the 24 sales closed last month. The average list price for single family home sales in May 2014 was $3,048,448
compared to $2,565,257 for May 2013, representing a 19% increase. For the three-month period from March to May
2014, the average list price was 27% higher than the same period of the prior year. Average sales price for May 2014 was
$3,011,286, compared to that of March through May 2014, which was $3,419,540. Comparing May 2014 to April 2014,
Pacific Palisades saw a 16% decrease in average sale price, but a 20% increase compared to same month of the prior
year.
CONDOMINIUMS (CONDOS)MAR - MAY 2014 ALL < $1M $1M - $3M > $3M
AVERAGE LIST PRICE $928,940 $676,661 $1,433,500 $-
AVERAGE LIST PRICE PER SQUARE FOOT $539.48 $473.66 $614.51 $-
AVERAGE SOLD PRICE $924,215 $680,698 $1,411,250 $-
AVERAGE SOLD PRICE PER SQUARE FOOT $536.89 $477.17 $604.97 $-
TOTAL CONDOS SOLD 24 16 8 -
TOTAL CONDOS FOR SALE AT END OF PERIOD - - - -
AVERAGE MONTHLY SUPPLY OF INVENTORY - - - -
AVERAGE SOLD PRICE/ORIGINAL LIST PRICE RATIO 99% 101% 98% 0%
CONDOSMAR - MAY 2013 ALL < $1M $1M - $3M > $3M
AVERAGE LIST PRICE $791,324 $736,900 $1,199,500 $-
AVERAGE LIST PRICE PER SQUARE FOOT $443.51 $440.10 $459.93 $-
AVERAGE SOLD PRICE $768,500 $725,300 $1,092,500 $-
AVERAGE SOLD PRICE PER SQUARE FOOT $430.72 $433.17 $418.90 $-
TOTAL CONDOS SOLD 17 15 2 -
TOTAL CONDOS FOR SALE AT END OF PERIOD 20 12 7 1
AVERAGE MONTHLY SUPPLY OF INVENTORY 3.5 2.4 10.5 -
AVERAGE SOLD PRICE/ORIGINAL LIST PRICE RATIO 97% 98% 91% 0%
CONDOSMAY/MAY COMPARISON ALL < $1M $1M - $3M > $3M
AVERAGE LIST PRICE 17% -8% 20% 0%
AVERAGE LIST PRICE PER SQUARE FOOT 22% 8% 34% 0%
AVERAGE SOLD PRICE 20% -6% 29% 0%
AVERAGE SOLD PRICE PER SQUARE FOOT 25% 10% 44% 0%
TOTAL CONDOS SOLD 41% 7% 300% 0%
TOTAL CONDOS FOR SALE AT END OF PERIOD -100% -100% -100% -100%
AVERAGE MONTHLY SUPPLY OF INVENTORY -100% -100% -100% 0%
AVERAGE SOLD PRICE/ORIGINAL LIST PRICE RATIO 2% 2% 8% 0%
(Source: MLS/CLAW)

46
SINGLE FAMILY HOME SALES
BEVERLY HILLS | BRENTWOOD | LOS FELIZ | MALIBU | PACIFIC PALISADES SANTA MONICA | SUNSET STRIP | sothebyshomes.com/losangeles
Adjacent to Culver City and minutes from the ocean and UCLA is the community
of Palms – Mar Vista. Named after its magnificent views of the ocean along its hilly
border near Santa Monica, Palms – Mar Vista is one of the oldest communities
in Los Angeles and one of the least dense in all of West Los Angeles. Palms – Mar
Vista is full of homes built during the 1920s and 1930s as well as an abundance of
wonderfully preserved mid-century modern architecture. Those seeking 1920s
homes, 1930s homes and mid-century modern architecture can also enjoy the
area’s Mar Vista Park, covering an entire city block with a new recreation center
and roller hockey rink. CLICK HERE TO VIEW HOMES WE HAVE AVAILABLE IN THIS AREA
PALMS - MAR VISTA
SINGLE FAMILY HOMES (SFH)MAR - MAY 2014 ALL < $1M $1M - $3M > $3M
AVERAGE LIST PRICE $1,136,391 $786,009 $1,427,253 $2,995,000
AVERAGE LIST PRICE PER SQUARE FOOT $644.94 $660.38 $635.22 $680.68
AVERAGE SOLD PRICE $1,159,595 $799,868 $1,457,465 $3,100,000
AVERAGE SOLD PRICE PER SQUARE FOOT $658.98 $671.53 $650.28 $704.55
TOTAL SFH SOLD 85 41 43 1
TOTAL SFH FOR SALE AT END OF PERIOD 49 20 29 -
AVERAGE MONTHLY SUPPLY OF INVENTORY 1.7 1.5 2.0 -
AVERAGE SOLD PRICE/ORIGINAL LIST PRICE RATIO 102% 102% 102% 104%
SFHMAR - MAY 2013 ALL < $1M $1M - $3M > $3M
AVERAGE LIST PRICE $883,551 $715,117 $1,321,480 $-
AVERAGE LIST PRICE PER SQUARE FOOT $553.38 $547.32 $562.15 $-
AVERAGE SOLD PRICE $908,905 $740,845 $1,345,860 $-
AVERAGE SOLD PRICE PER SQUARE FOOT $569.83 $567.41 $573.32 $-
TOTAL SFH SOLD 90 65 25 -
TOTAL SFH FOR SALE AT END OF PERIOD 43 24 19 -
AVERAGE MONTHLY SUPPLY OF INVENTORY 1.4 1.1 2.3 -
AVERAGE SOLD PRICE/ORIGINAL LIST PRICE RATIO 103% 104% 102% 0%
SFHMAY/MAY COMPARISON ALL < $1M $1M - $3M > $3M
AVERAGE LIST PRICE 29% 10% 8% 0%
AVERAGE LIST PRICE PER SQUARE FOOT 17% 21% 13% 0%
AVERAGE SOLD PRICE 28% 8% 8% 0%
AVERAGE SOLD PRICE PER SQUARE FOOT 16% 18% 13% 0%
TOTAL SFH SOLD -6% -37% 72% 0%
TOTAL SFH FOR SALE AT END OF PERIOD 14% -17% 53% 0%
AVERAGE MONTHLY SUPPLY OF INVENTORY 21% 32% -11% 0%
AVERAGE SOLD PRICE/ORIGINAL LIST PRICE RATIO -1% -2% 0% 0%
(Source: MLS/CLAW)

47
CONDOMINIUM SALES PALMS - MAR VISTA
MAY MARKET OVERVIEWIn Palms - Mar Vista there were 29 single family home sales in May 2014, up from 27 in May 2013 and a 3% decrease from
the 30 sales closed last month. The average list price for single family home sales in May 2014 was $1,063,379 compared
to $966,922 for May 2013, representing a 10% increase. For the three-month period from March to May 2014, the average
list price was 29% higher than the same period of the prior year. Average sales price for May 2014 was $1,074,810,
compared to that of March through May 2014, which was $1,159,595. Comparing May 2014 to April 2014, Palms - Mar
Vista saw a 2% decrease in average sale price, but a 9% increase compared to same month of the prior year.
CONDOMINIUMS (CONDOS)MAR - MAY 2014 ALL < $1M $1M - $3M > $3M
AVERAGE LIST PRICE $510,621 $486,237 $1,169,000 $-
AVERAGE LIST PRICE PER SQUARE FOOT $438.09 $429.00 $574.73 $-
AVERAGE SOLD PRICE $510,054 $488,204 $1,100,000 $-
AVERAGE SOLD PRICE PER SQUARE FOOT $437.60 $430.74 $540.81 $-
TOTAL CONDOS SOLD 28 27 1 -
TOTAL CONDOS FOR SALE AT END OF PERIOD - - - -
AVERAGE MONTHLY SUPPLY OF INVENTORY - - - -
AVERAGE SOLD PRICE/ORIGINAL LIST PRICE RATIO 100% 100% 94% 0%
CONDOSMAR - MAY 2013 ALL < $1M $1M - $3M > $3M
AVERAGE LIST PRICE $428,572 $428,572 $- $-
AVERAGE LIST PRICE PER SQUARE FOOT $369.79 $369.79 $- $-
AVERAGE SOLD PRICE $433,935 $433,935 $- $-
AVERAGE SOLD PRICE PER SQUARE FOOT $374.42 $374.42 $- $-
TOTAL CONDOS SOLD 26 26 - -
TOTAL CONDOS FOR SALE AT END OF PERIOD 16 16 - -
AVERAGE MONTHLY SUPPLY OF INVENTORY 1.8 1.8 - -
AVERAGE SOLD PRICE/ORIGINAL LIST PRICE RATIO 101% 101% 0% 0%
CONDOSMAY/MAY COMPARISON ALL < $1M $1M - $3M > $3M
AVERAGE LIST PRICE 19% 13% 0% 0%
AVERAGE LIST PRICE PER SQUARE FOOT 18% 16% 0% 0%
AVERAGE SOLD PRICE 18% 13% 0% 0%
AVERAGE SOLD PRICE PER SQUARE FOOT 17% 15% 0% 0%
TOTAL CONDOS SOLD 8% 4% 0% 0%
TOTAL CONDOS FOR SALE AT END OF PERIOD -100% -100% 0% 0%
AVERAGE MONTHLY SUPPLY OF INVENTORY -100% -100% 0% 0%
AVERAGE SOLD PRICE/ORIGINAL LIST PRICE RATIO -1% -1% 0% 0%
(Source: MLS/CLAW)
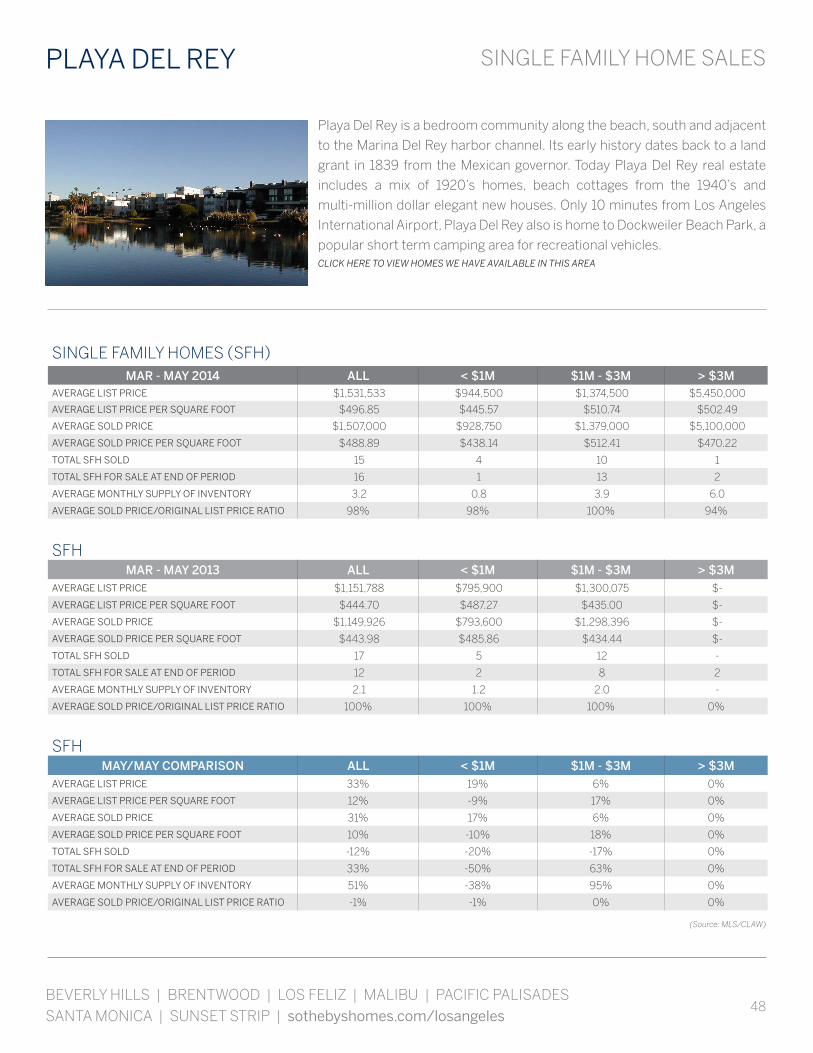
48
SINGLE FAMILY HOME SALES
BEVERLY HILLS | BRENTWOOD | LOS FELIZ | MALIBU | PACIFIC PALISADES SANTA MONICA | SUNSET STRIP | sothebyshomes.com/losangeles
Playa Del Rey is a bedroom community along the beach, south and adjacent
to the Marina Del Rey harbor channel. Its early history dates back to a land
grant in 1839 from the Mexican governor. Today Playa Del Rey real estate
includes a mix of 1920’s homes, beach cottages from the 1940’s and
multi-million dollar elegant new houses. Only 10 minutes from Los Angeles
International Airport, Playa Del Rey also is home to Dockweiler Beach Park, a
popular short term camping area for recreational vehicles.CLICK HERE TO VIEW HOMES WE HAVE AVAILABLE IN THIS AREA
PLAYA DEL REY
SINGLE FAMILY HOMES (SFH)MAR - MAY 2014 ALL < $1M $1M - $3M > $3M
AVERAGE LIST PRICE $1,531,533 $944,500 $1,374,500 $5,450,000
AVERAGE LIST PRICE PER SQUARE FOOT $496.85 $445.57 $510.74 $502.49
AVERAGE SOLD PRICE $1,507,000 $928,750 $1,379,000 $5,100,000
AVERAGE SOLD PRICE PER SQUARE FOOT $488.89 $438.14 $512.41 $470.22
TOTAL SFH SOLD 15 4 10 1
TOTAL SFH FOR SALE AT END OF PERIOD 16 1 13 2
AVERAGE MONTHLY SUPPLY OF INVENTORY 3.2 0.8 3.9 6.0
AVERAGE SOLD PRICE/ORIGINAL LIST PRICE RATIO 98% 98% 100% 94%
SFHMAR - MAY 2013 ALL < $1M $1M - $3M > $3M
AVERAGE LIST PRICE $1,151,788 $795,900 $1,300,075 $-
AVERAGE LIST PRICE PER SQUARE FOOT $444.70 $487.27 $435.00 $-
AVERAGE SOLD PRICE $1,149,926 $793,600 $1,298,396 $-
AVERAGE SOLD PRICE PER SQUARE FOOT $443.98 $485.86 $434.44 $-
TOTAL SFH SOLD 17 5 12 -
TOTAL SFH FOR SALE AT END OF PERIOD 12 2 8 2
AVERAGE MONTHLY SUPPLY OF INVENTORY 2.1 1.2 2.0 -
AVERAGE SOLD PRICE/ORIGINAL LIST PRICE RATIO 100% 100% 100% 0%
SFHMAY/MAY COMPARISON ALL < $1M $1M - $3M > $3M
AVERAGE LIST PRICE 33% 19% 6% 0%
AVERAGE LIST PRICE PER SQUARE FOOT 12% -9% 17% 0%
AVERAGE SOLD PRICE 31% 17% 6% 0%
AVERAGE SOLD PRICE PER SQUARE FOOT 10% -10% 18% 0%
TOTAL SFH SOLD -12% -20% -17% 0%
TOTAL SFH FOR SALE AT END OF PERIOD 33% -50% 63% 0%
AVERAGE MONTHLY SUPPLY OF INVENTORY 51% -38% 95% 0%
AVERAGE SOLD PRICE/ORIGINAL LIST PRICE RATIO -1% -1% 0% 0%
(Source: MLS/CLAW)
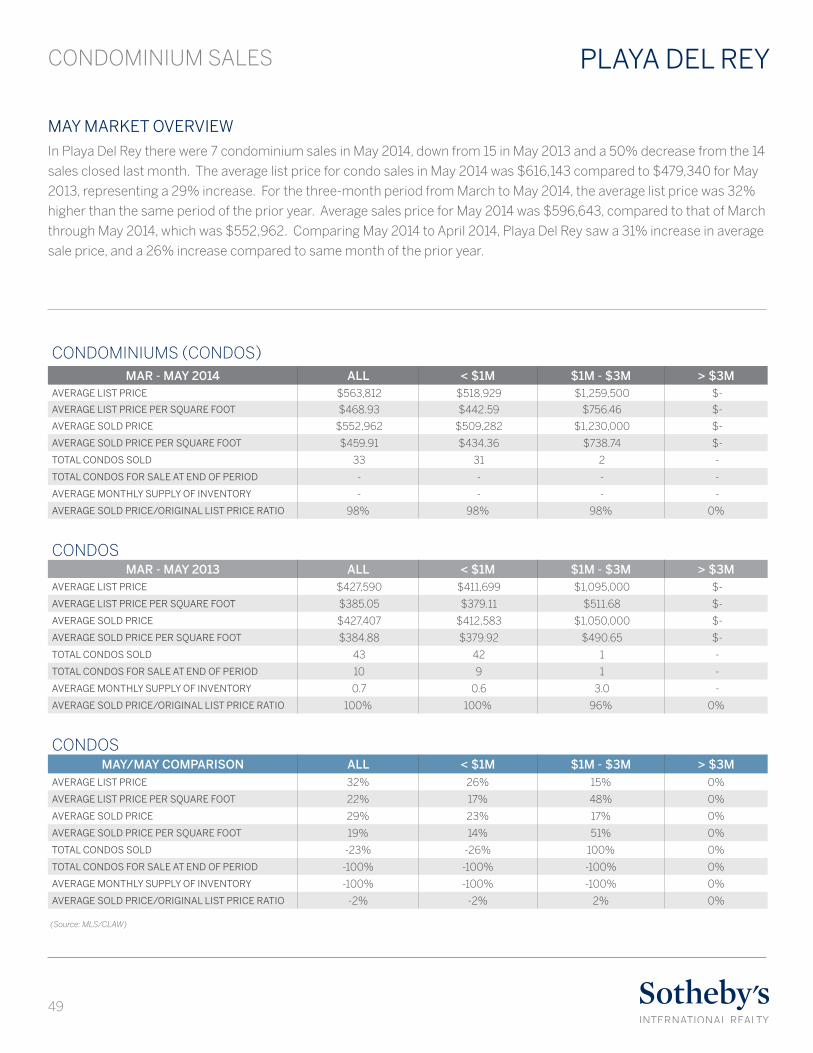
49
CONDOMINIUM SALES PLAYA DEL REY
MAY MARKET OVERVIEWIn Playa Del Rey there were 7 condominium sales in May 2014, down from 15 in May 2013 and a 50% decrease from the 14
sales closed last month. The average list price for condo sales in May 2014 was $616,143 compared to $479,340 for May
2013, representing a 29% increase. For the three-month period from March to May 2014, the average list price was 32%
higher than the same period of the prior year. Average sales price for May 2014 was $596,643, compared to that of March
through May 2014, which was $552,962. Comparing May 2014 to April 2014, Playa Del Rey saw a 31% increase in average
sale price, and a 26% increase compared to same month of the prior year.
CONDOMINIUMS (CONDOS)MAR - MAY 2014 ALL < $1M $1M - $3M > $3M
AVERAGE LIST PRICE $563,812 $518,929 $1,259,500 $-
AVERAGE LIST PRICE PER SQUARE FOOT $468.93 $442.59 $756.46 $-
AVERAGE SOLD PRICE $552,962 $509,282 $1,230,000 $-
AVERAGE SOLD PRICE PER SQUARE FOOT $459.91 $434.36 $738.74 $-
TOTAL CONDOS SOLD 33 31 2 -
TOTAL CONDOS FOR SALE AT END OF PERIOD - - - -
AVERAGE MONTHLY SUPPLY OF INVENTORY - - - -
AVERAGE SOLD PRICE/ORIGINAL LIST PRICE RATIO 98% 98% 98% 0%
CONDOSMAR - MAY 2013 ALL < $1M $1M - $3M > $3M
AVERAGE LIST PRICE $427,590 $411,699 $1,095,000 $-
AVERAGE LIST PRICE PER SQUARE FOOT $385.05 $379.11 $511.68 $-
AVERAGE SOLD PRICE $427,407 $412,583 $1,050,000 $-
AVERAGE SOLD PRICE PER SQUARE FOOT $384.88 $379.92 $490.65 $-
TOTAL CONDOS SOLD 43 42 1 -
TOTAL CONDOS FOR SALE AT END OF PERIOD 10 9 1 -
AVERAGE MONTHLY SUPPLY OF INVENTORY 0.7 0.6 3.0 -
AVERAGE SOLD PRICE/ORIGINAL LIST PRICE RATIO 100% 100% 96% 0%
CONDOSMAY/MAY COMPARISON ALL < $1M $1M - $3M > $3M
AVERAGE LIST PRICE 32% 26% 15% 0%
AVERAGE LIST PRICE PER SQUARE FOOT 22% 17% 48% 0%
AVERAGE SOLD PRICE 29% 23% 17% 0%
AVERAGE SOLD PRICE PER SQUARE FOOT 19% 14% 51% 0%
TOTAL CONDOS SOLD -23% -26% 100% 0%
TOTAL CONDOS FOR SALE AT END OF PERIOD -100% -100% -100% 0%
AVERAGE MONTHLY SUPPLY OF INVENTORY -100% -100% -100% 0%
AVERAGE SOLD PRICE/ORIGINAL LIST PRICE RATIO -2% -2% 2% 0%
(Source: MLS/CLAW)
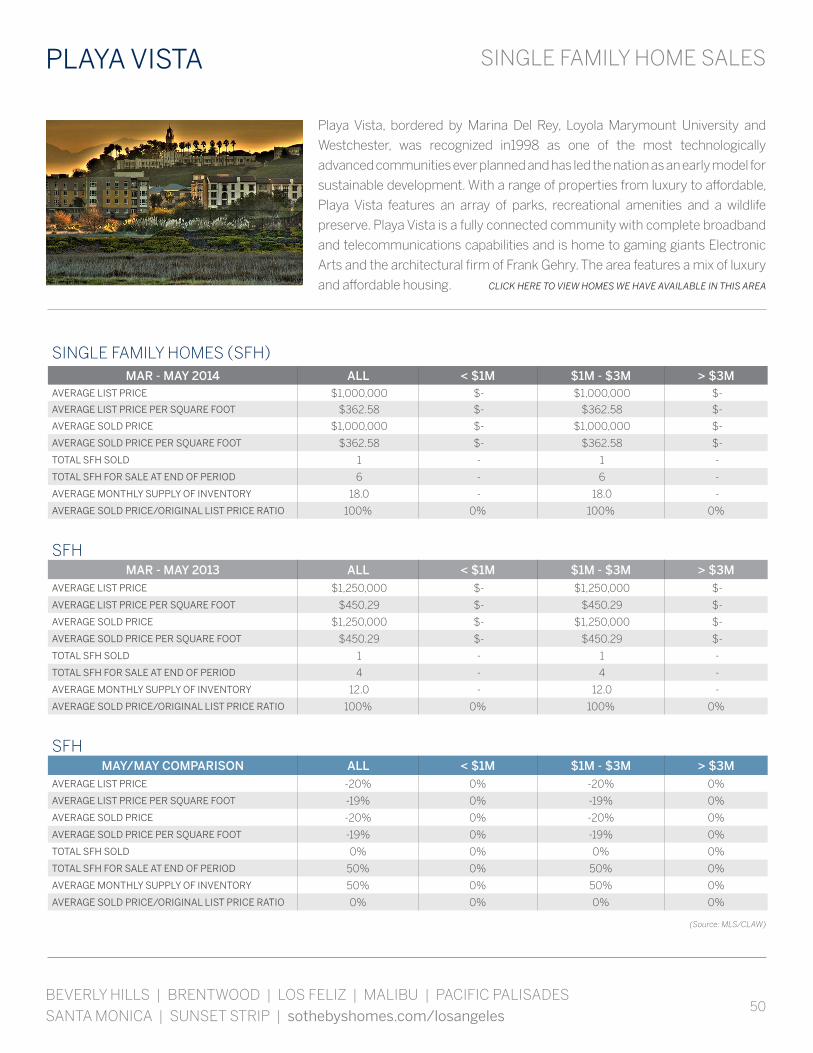
50
SINGLE FAMILY HOME SALES
BEVERLY HILLS | BRENTWOOD | LOS FELIZ | MALIBU | PACIFIC PALISADES SANTA MONICA | SUNSET STRIP | sothebyshomes.com/losangeles
Playa Vista, bordered by Marina Del Rey, Loyola Marymount University and
Westchester, was recognized in1998 as one of the most technologically
advanced communities ever planned and has led the nation as an early model for
sustainable development. With a range of properties from luxury to affordable,
Playa Vista features an array of parks, recreational amenities and a wildlife
preserve. Playa Vista is a fully connected community with complete broadband
and telecommunications capabilities and is home to gaming giants Electronic
Arts and the architectural firm of Frank Gehry. The area features a mix of luxury
and affordable housing. CLICK HERE TO VIEW HOMES WE HAVE AVAILABLE IN THIS AREA
PLAYA VISTA
SINGLE FAMILY HOMES (SFH)MAR - MAY 2014 ALL < $1M $1M - $3M > $3M
AVERAGE LIST PRICE $1,000,000 $- $1,000,000 $-
AVERAGE LIST PRICE PER SQUARE FOOT $362.58 $- $362.58 $-
AVERAGE SOLD PRICE $1,000,000 $- $1,000,000 $-
AVERAGE SOLD PRICE PER SQUARE FOOT $362.58 $- $362.58 $-
TOTAL SFH SOLD 1 - 1 -
TOTAL SFH FOR SALE AT END OF PERIOD 6 - 6 -
AVERAGE MONTHLY SUPPLY OF INVENTORY 18.0 - 18.0 -
AVERAGE SOLD PRICE/ORIGINAL LIST PRICE RATIO 100% 0% 100% 0%
SFHMAR - MAY 2013 ALL < $1M $1M - $3M > $3M
AVERAGE LIST PRICE $1,250,000 $- $1,250,000 $-
AVERAGE LIST PRICE PER SQUARE FOOT $450.29 $- $450.29 $-
AVERAGE SOLD PRICE $1,250,000 $- $1,250,000 $-
AVERAGE SOLD PRICE PER SQUARE FOOT $450.29 $- $450.29 $-
TOTAL SFH SOLD 1 - 1 -
TOTAL SFH FOR SALE AT END OF PERIOD 4 - 4 -
AVERAGE MONTHLY SUPPLY OF INVENTORY 12.0 - 12.0 -
AVERAGE SOLD PRICE/ORIGINAL LIST PRICE RATIO 100% 0% 100% 0%
SFHMAY/MAY COMPARISON ALL < $1M $1M - $3M > $3M
AVERAGE LIST PRICE -20% 0% -20% 0%
AVERAGE LIST PRICE PER SQUARE FOOT -19% 0% -19% 0%
AVERAGE SOLD PRICE -20% 0% -20% 0%
AVERAGE SOLD PRICE PER SQUARE FOOT -19% 0% -19% 0%
TOTAL SFH SOLD 0% 0% 0% 0%
TOTAL SFH FOR SALE AT END OF PERIOD 50% 0% 50% 0%
AVERAGE MONTHLY SUPPLY OF INVENTORY 50% 0% 50% 0%
AVERAGE SOLD PRICE/ORIGINAL LIST PRICE RATIO 0% 0% 0% 0%
(Source: MLS/CLAW)
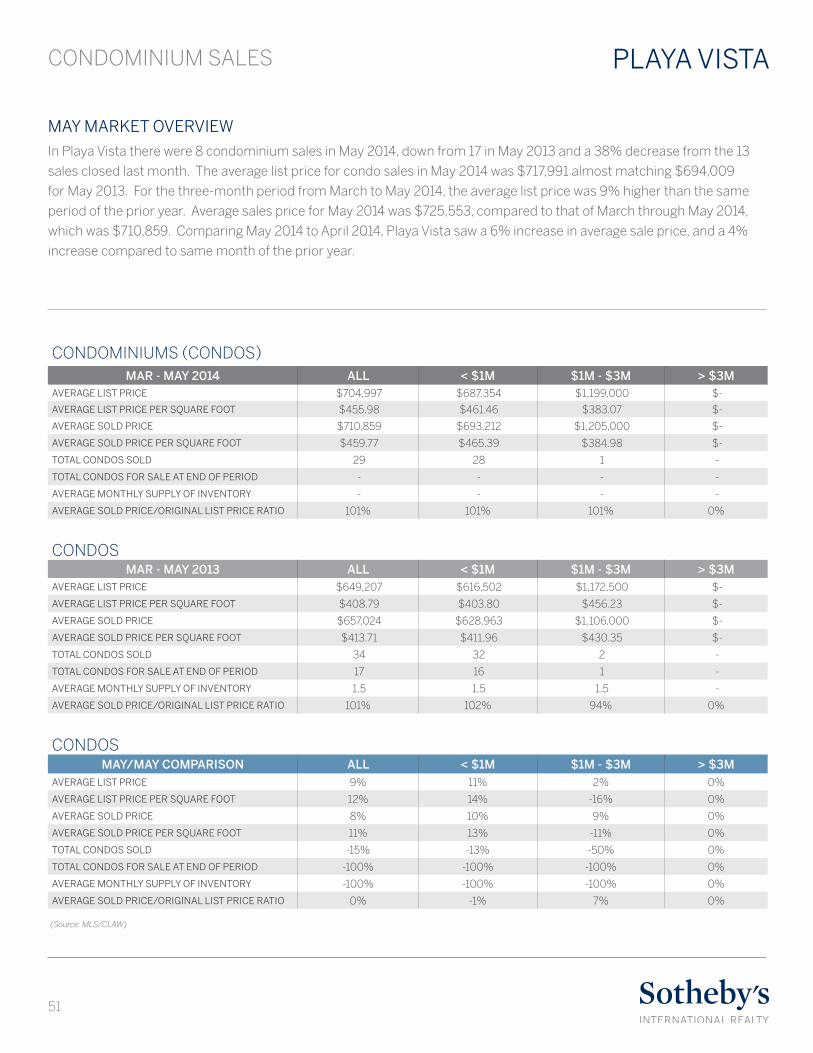
51
CONDOMINIUM SALES PLAYA VISTA
MAY MARKET OVERVIEWIn Playa Vista there were 8 condominium sales in May 2014, down from 17 in May 2013 and a 38% decrease from the 13
sales closed last month. The average list price for condo sales in May 2014 was $717,991 almost matching $694,009
for May 2013. For the three-month period from March to May 2014, the average list price was 9% higher than the same
period of the prior year. Average sales price for May 2014 was $725,553, compared to that of March through May 2014,
which was $710,859. Comparing May 2014 to April 2014, Playa Vista saw a 6% increase in average sale price, and a 4%
increase compared to same month of the prior year.
CONDOMINIUMS (CONDOS)MAR - MAY 2014 ALL < $1M $1M - $3M > $3M
AVERAGE LIST PRICE $704,997 $687,354 $1,199,000 $-
AVERAGE LIST PRICE PER SQUARE FOOT $455.98 $461.46 $383.07 $-
AVERAGE SOLD PRICE $710,859 $693,212 $1,205,000 $-
AVERAGE SOLD PRICE PER SQUARE FOOT $459.77 $465.39 $384.98 $-
TOTAL CONDOS SOLD 29 28 1 -
TOTAL CONDOS FOR SALE AT END OF PERIOD - - - -
AVERAGE MONTHLY SUPPLY OF INVENTORY - - - -
AVERAGE SOLD PRICE/ORIGINAL LIST PRICE RATIO 101% 101% 101% 0%
CONDOSMAR - MAY 2013 ALL < $1M $1M - $3M > $3M
AVERAGE LIST PRICE $649,207 $616,502 $1,172,500 $-
AVERAGE LIST PRICE PER SQUARE FOOT $408.79 $403.80 $456.23 $-
AVERAGE SOLD PRICE $657,024 $628,963 $1,106,000 $-
AVERAGE SOLD PRICE PER SQUARE FOOT $413.71 $411.96 $430.35 $-
TOTAL CONDOS SOLD 34 32 2 -
TOTAL CONDOS FOR SALE AT END OF PERIOD 17 16 1 -
AVERAGE MONTHLY SUPPLY OF INVENTORY 1.5 1.5 1.5 -
AVERAGE SOLD PRICE/ORIGINAL LIST PRICE RATIO 101% 102% 94% 0%
CONDOSMAY/MAY COMPARISON ALL < $1M $1M - $3M > $3M
AVERAGE LIST PRICE 9% 11% 2% 0%
AVERAGE LIST PRICE PER SQUARE FOOT 12% 14% -16% 0%
AVERAGE SOLD PRICE 8% 10% 9% 0%
AVERAGE SOLD PRICE PER SQUARE FOOT 11% 13% -11% 0%
TOTAL CONDOS SOLD -15% -13% -50% 0%
TOTAL CONDOS FOR SALE AT END OF PERIOD -100% -100% -100% 0%
AVERAGE MONTHLY SUPPLY OF INVENTORY -100% -100% -100% 0%
AVERAGE SOLD PRICE/ORIGINAL LIST PRICE RATIO 0% -1% 7% 0%
(Source: MLS/CLAW)

52
SINGLE FAMILY HOME SALES
BEVERLY HILLS | BRENTWOOD | LOS FELIZ | MALIBU | PACIFIC PALISADES SANTA MONICA | SUNSET STRIP | sothebyshomes.com/losangeles
Santa Monica offers more than simply a home. There are fishing and yacht
clubs and exquisite fine dining right in your own backyard. Santa Monica is
located on the Westside of Los Angeles and is comprised of 8.3 square miles
of vibrant commercial districts, neighboring residential communities and a
terrific public school system. Centered on three miles of wide, white, sandy
beaches, Santa Monica has become a popular international destination, with
many attractions such as The Santa Monica pier, Third Street Promenade,
Main Street, and the ultra chic Montana Avenue.
CLICK HERE TO VIEW HOMES WE HAVE AVAILABLE IN THIS AREA
SANTA MONICA
SINGLE FAMILY HOMES (SFH)MAR - MAY 2014 ALL < $1M $1M - $3M > $3M
AVERAGE LIST PRICE $2,400,831 $947,817 $1,722,143 $4,898,692
AVERAGE LIST PRICE PER SQUARE FOOT $949.46 $805.05 $888.15 $1,030.82
AVERAGE SOLD PRICE $2,419,568 $893,750 $1,830,762 $4,709,040
AVERAGE SOLD PRICE PER SQUARE FOOT $956.03 $759.13 $944.35 $990.91
TOTAL SFH SOLD 54 6 35 13
TOTAL SFH FOR SALE AT END OF PERIOD 56 2 29 25
AVERAGE MONTHLY SUPPLY OF INVENTORY 3.1 1.0 2.5 5.8
AVERAGE SOLD PRICE/ORIGINAL LIST PRICE RATIO 101% 94% 106% 96%
SFHMAR - MAY 2013 ALL < $1M $1M - $3M > $3M
AVERAGE LIST PRICE $2,522,054 $711,200 $1,793,388 $5,117,360
AVERAGE LIST PRICE PER SQUARE FOOT $937.04 $649.14 $809.38 $1,129.18
AVERAGE SOLD PRICE $2,473,992 $796,200 $1,809,330 $4,850,000
AVERAGE SOLD PRICE PER SQUARE FOOT $917.23 $726.73 $812.71 $1,070.71
TOTAL SFH SOLD 61 5 41 15
TOTAL SFH FOR SALE AT END OF PERIOD 45 1 22 22
AVERAGE MONTHLY SUPPLY OF INVENTORY 2.2 0.6 1.6 4.4
AVERAGE SOLD PRICE/ORIGINAL LIST PRICE RATIO 98% 112% 101% 95%
SFHMAY/MAY COMPARISON ALL < $1M $1M - $3M > $3M
AVERAGE LIST PRICE -5% 33% -4% -4%
AVERAGE LIST PRICE PER SQUARE FOOT 1% 24% 10% -9%
AVERAGE SOLD PRICE -2% 12% 1% -3%
AVERAGE SOLD PRICE PER SQUARE FOOT 4% 4% 16% -7%
TOTAL SFH SOLD -11% 20% -15% -13%
TOTAL SFH FOR SALE AT END OF PERIOD 24% 100% 32% 14%
AVERAGE MONTHLY SUPPLY OF INVENTORY 41% 67% 54% 31%
AVERAGE SOLD PRICE/ORIGINAL LIST PRICE RATIO 3% -16% 5% 1%
(Source: MLS/CLAW)
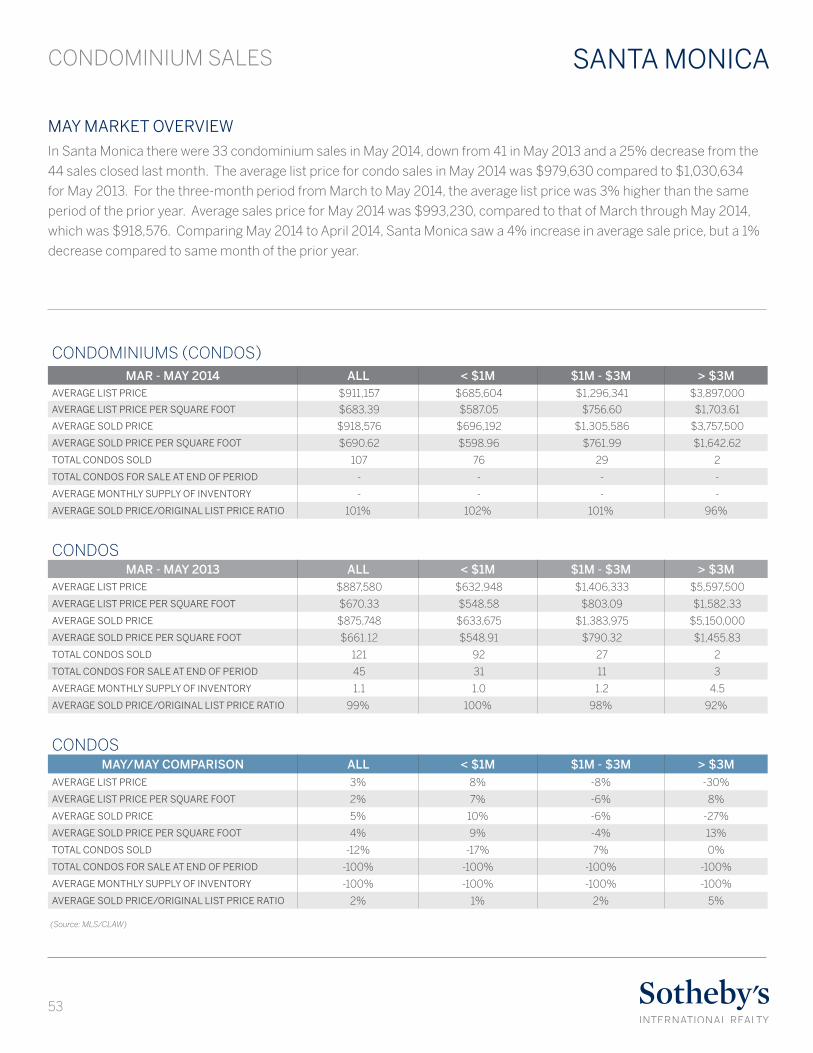
53
CONDOMINIUM SALES SANTA MONICA
MAY MARKET OVERVIEWIn Santa Monica there were 33 condominium sales in May 2014, down from 41 in May 2013 and a 25% decrease from the
44 sales closed last month. The average list price for condo sales in May 2014 was $979,630 compared to $1,030,634
for May 2013. For the three-month period from March to May 2014, the average list price was 3% higher than the same
period of the prior year. Average sales price for May 2014 was $993,230, compared to that of March through May 2014,
which was $918,576. Comparing May 2014 to April 2014, Santa Monica saw a 4% increase in average sale price, but a 1%
decrease compared to same month of the prior year.
CONDOMINIUMS (CONDOS)MAR - MAY 2014 ALL < $1M $1M - $3M > $3M
AVERAGE LIST PRICE $911,157 $685,604 $1,296,341 $3,897,000
AVERAGE LIST PRICE PER SQUARE FOOT $683.39 $587.05 $756.60 $1,703.61
AVERAGE SOLD PRICE $918,576 $696,192 $1,305,586 $3,757,500
AVERAGE SOLD PRICE PER SQUARE FOOT $690.62 $598.96 $761.99 $1,642.62
TOTAL CONDOS SOLD 107 76 29 2
TOTAL CONDOS FOR SALE AT END OF PERIOD - - - -
AVERAGE MONTHLY SUPPLY OF INVENTORY - - - -
AVERAGE SOLD PRICE/ORIGINAL LIST PRICE RATIO 101% 102% 101% 96%
CONDOSMAR - MAY 2013 ALL < $1M $1M - $3M > $3M
AVERAGE LIST PRICE $887,580 $632,948 $1,406,333 $5,597,500
AVERAGE LIST PRICE PER SQUARE FOOT $670.33 $548.58 $803.09 $1,582.33
AVERAGE SOLD PRICE $875,748 $633,675 $1,383,975 $5,150,000
AVERAGE SOLD PRICE PER SQUARE FOOT $661.12 $548.91 $790.32 $1,455.83
TOTAL CONDOS SOLD 121 92 27 2
TOTAL CONDOS FOR SALE AT END OF PERIOD 45 31 11 3
AVERAGE MONTHLY SUPPLY OF INVENTORY 1.1 1.0 1.2 4.5
AVERAGE SOLD PRICE/ORIGINAL LIST PRICE RATIO 99% 100% 98% 92%
CONDOSMAY/MAY COMPARISON ALL < $1M $1M - $3M > $3M
AVERAGE LIST PRICE 3% 8% -8% -30%
AVERAGE LIST PRICE PER SQUARE FOOT 2% 7% -6% 8%
AVERAGE SOLD PRICE 5% 10% -6% -27%
AVERAGE SOLD PRICE PER SQUARE FOOT 4% 9% -4% 13%
TOTAL CONDOS SOLD -12% -17% 7% 0%
TOTAL CONDOS FOR SALE AT END OF PERIOD -100% -100% -100% -100%
AVERAGE MONTHLY SUPPLY OF INVENTORY -100% -100% -100% -100%
AVERAGE SOLD PRICE/ORIGINAL LIST PRICE RATIO 2% 1% 2% 5%
(Source: MLS/CLAW)
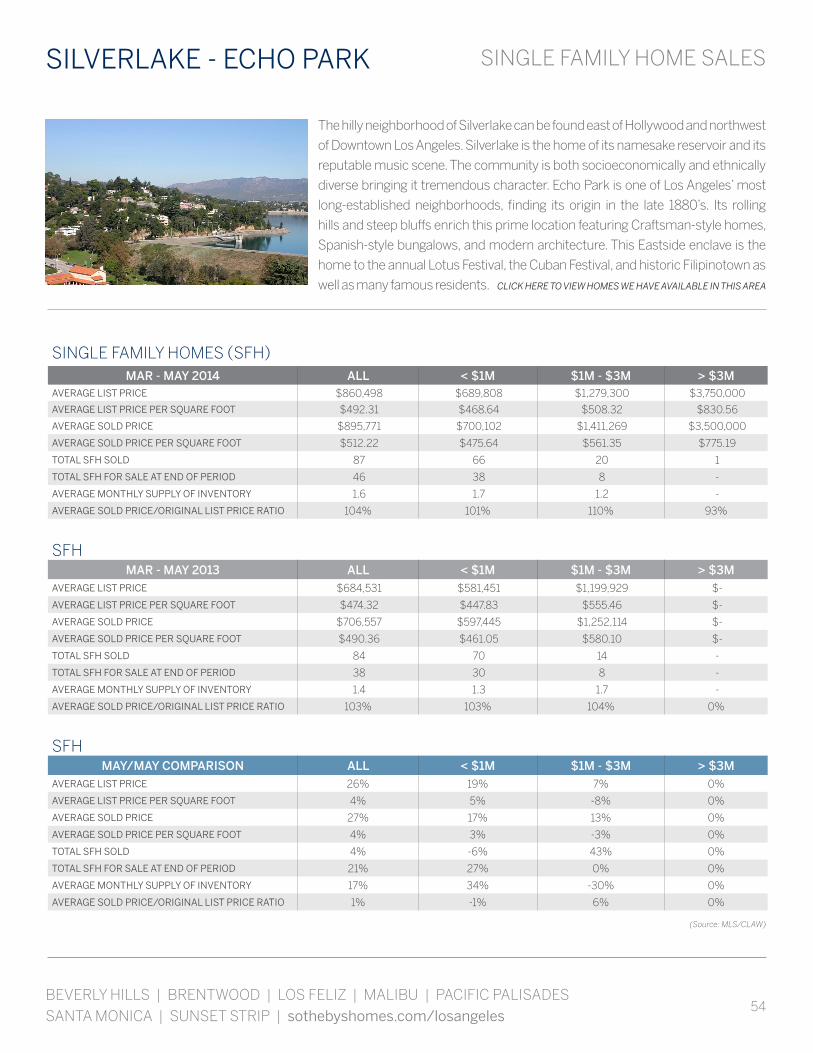
54
SINGLE FAMILY HOME SALES
BEVERLY HILLS | BRENTWOOD | LOS FELIZ | MALIBU | PACIFIC PALISADES SANTA MONICA | SUNSET STRIP | sothebyshomes.com/losangeles
The hilly neighborhood of Silverlake can be found east of Hollywood and northwest
of Downtown Los Angeles. Silverlake is the home of its namesake reservoir and its
reputable music scene. The community is both socioeconomically and ethnically
diverse bringing it tremendous character. Echo Park is one of Los Angeles’ most
long-established neighborhoods, finding its origin in the late 1880’s. Its rolling
hills and steep bluffs enrich this prime location featuring Craftsman-style homes,
Spanish-style bungalows, and modern architecture. This Eastside enclave is the
home to the annual Lotus Festival, the Cuban Festival, and historic Filipinotown as
well as many famous residents. CLICK HERE TO VIEW HOMES WE HAVE AVAILABLE IN THIS AREA
SILVERLAKE - ECHO PARK
SINGLE FAMILY HOMES (SFH)MAR - MAY 2014 ALL < $1M $1M - $3M > $3M
AVERAGE LIST PRICE $860,498 $689,808 $1,279,300 $3,750,000
AVERAGE LIST PRICE PER SQUARE FOOT $492.31 $468.64 $508.32 $830.56
AVERAGE SOLD PRICE $895,771 $700,102 $1,411,269 $3,500,000
AVERAGE SOLD PRICE PER SQUARE FOOT $512.22 $475.64 $561.35 $775.19
TOTAL SFH SOLD 87 66 20 1
TOTAL SFH FOR SALE AT END OF PERIOD 46 38 8 -
AVERAGE MONTHLY SUPPLY OF INVENTORY 1.6 1.7 1.2 -
AVERAGE SOLD PRICE/ORIGINAL LIST PRICE RATIO 104% 101% 110% 93%
SFHMAR - MAY 2013 ALL < $1M $1M - $3M > $3M
AVERAGE LIST PRICE $684,531 $581,451 $1,199,929 $-
AVERAGE LIST PRICE PER SQUARE FOOT $474.32 $447.83 $555.46 $-
AVERAGE SOLD PRICE $706,557 $597,445 $1,252,114 $-
AVERAGE SOLD PRICE PER SQUARE FOOT $490.36 $461.05 $580.10 $-
TOTAL SFH SOLD 84 70 14 -
TOTAL SFH FOR SALE AT END OF PERIOD 38 30 8 -
AVERAGE MONTHLY SUPPLY OF INVENTORY 1.4 1.3 1.7 -
AVERAGE SOLD PRICE/ORIGINAL LIST PRICE RATIO 103% 103% 104% 0%
SFHMAY/MAY COMPARISON ALL < $1M $1M - $3M > $3M
AVERAGE LIST PRICE 26% 19% 7% 0%
AVERAGE LIST PRICE PER SQUARE FOOT 4% 5% -8% 0%
AVERAGE SOLD PRICE 27% 17% 13% 0%
AVERAGE SOLD PRICE PER SQUARE FOOT 4% 3% -3% 0%
TOTAL SFH SOLD 4% -6% 43% 0%
TOTAL SFH FOR SALE AT END OF PERIOD 21% 27% 0% 0%
AVERAGE MONTHLY SUPPLY OF INVENTORY 17% 34% -30% 0%
AVERAGE SOLD PRICE/ORIGINAL LIST PRICE RATIO 1% -1% 6% 0%
(Source: MLS/CLAW)

55
CONDOMINIUM SALES SILVERLAKE - ECHO PARK
MAY MARKET OVERVIEWIn Silver Lake - Echo Park there were 34 single family home sales in May 2014, up from 32 in May 2013 and a 13% increase
from the 30 sales closed last month. The average list price for single family home sales in May 2014 was $958,409
compared to $713,806 for May 2013, representing a 34% increase. For the three-month period from March to May
2014, the average list price was 26% higher than the same period of the prior year. Average sales price for May 2014 was
$1,022,353, compared to that of March through May 2014, which was $895,771. Comparing May 2014 to April 2014, Silver
Lake - Echo Park saw a 21% increase in average sale price, and a 37% increase compared to same month of the prior year.
CONDOMINIUMS (CONDOS)MAR - MAY 2014 ALL < $1M $1M - $3M > $3M
AVERAGE LIST PRICE $454,575 $454,575 $- $-
AVERAGE LIST PRICE PER SQUARE FOOT $396.47 $396.47 $- $-
AVERAGE SOLD PRICE $454,781 $454,781 $- $-
AVERAGE SOLD PRICE PER SQUARE FOOT $396.65 $396.65 $- $-
TOTAL CONDOS SOLD 16 16 - -
TOTAL CONDOS FOR SALE AT END OF PERIOD - - - -
AVERAGE MONTHLY SUPPLY OF INVENTORY - - - -
AVERAGE SOLD PRICE/ORIGINAL LIST PRICE RATIO 100% 100% 0% 0%
CONDOSMAR - MAY 2013 ALL < $1M $1M - $3M > $3M
AVERAGE LIST PRICE $498,884 $498,884 $- $-
AVERAGE LIST PRICE PER SQUARE FOOT $358.39 $358.39 $- $-
AVERAGE SOLD PRICE $494,551 $494,551 $- $-
AVERAGE SOLD PRICE PER SQUARE FOOT $355.28 $355.28 $- $-
TOTAL CONDOS SOLD 9 9 - -
TOTAL CONDOS FOR SALE AT END OF PERIOD 2 2 - -
AVERAGE MONTHLY SUPPLY OF INVENTORY 0.7 0.7 - -
AVERAGE SOLD PRICE/ORIGINAL LIST PRICE RATIO 99% 99% 0% 0%
CONDOSMAY/MAY COMPARISON ALL < $1M $1M - $3M > $3M
AVERAGE LIST PRICE -9% -9% 0% 0%
AVERAGE LIST PRICE PER SQUARE FOOT 11% 11% 0% 0%
AVERAGE SOLD PRICE -8% -8% 0% 0%
AVERAGE SOLD PRICE PER SQUARE FOOT 12% 12% 0% 0%
TOTAL CONDOS SOLD 78% 78% 0% 0%
TOTAL CONDOS FOR SALE AT END OF PERIOD -100% -100% 0% 0%
AVERAGE MONTHLY SUPPLY OF INVENTORY -100% -100% 0% 0%
AVERAGE SOLD PRICE/ORIGINAL LIST PRICE RATIO 1% 1% 0% 0%
(Source: MLS/CLAW)

56
SINGLE FAMILY HOME SALES
BEVERLY HILLS | BRENTWOOD | LOS FELIZ | MALIBU | PACIFIC PALISADES SANTA MONICA | SUNSET STRIP | sothebyshomes.com/losangeles
The Sunset Strip is the world famous stretch of Sunset Boulevard in West
Hollwood that stretches from Hollywood to Beverly Hills. The Strip, which
includes Sunset Plaza, is known for its famous collection of shops and
boutiques, cafes and restaurants, rock joints, and night clubs. It is easily
idenifiable with its colorful collection of billboards and is located at the base of
the Hollywood Hills and is just below the famed “Bird Streets” – from Blue Jay,
Tanager and Thrush Ways to Nightingale, and Kinglet Drives - a favorite area of
A-List celebrities from Hollywood stars to the most well known international
music acts to call home. CLICK HERE TO VIEW HOMES WE HAVE AVAILABLE IN THIS AREA
SUNSET STRIP-HOLLYWOOD HILLS
SINGLE FAMILY HOMES (SFH)MAR - MAY 2014 ALL < $1M $1M - $3M > $3M
AVERAGE LIST PRICE $2,373,083 $772,935 $1,804,784 $5,898,526
AVERAGE LIST PRICE PER SQUARE FOOT $815.09 $608.58 $720.28 $1,107.35
AVERAGE SOLD PRICE $2,268,927 $750,470 $1,778,296 $5,435,138
AVERAGE SOLD PRICE PER SQUARE FOOT $798.16 $590.89 $709.62 $1,075.56
TOTAL SFH SOLD 106 17 70 19
TOTAL SFH FOR SALE AT END OF PERIOD 201 23 111 67
AVERAGE MONTHLY SUPPLY OF INVENTORY 5.7 4.1 4.8 10.6
AVERAGE SOLD PRICE/ORIGINAL LIST PRICE RATIO 96% 97% 99% 92%
SFHMAR - MAY 2013 ALL < $1M $1M - $3M > $3M
AVERAGE LIST PRICE $2,115,705 $793,272 $1,795,024 $6,203,500
AVERAGE LIST PRICE PER SQUARE FOOT $778.60 $488.65 $640.13 $1,248.69
AVERAGE SOLD PRICE $2,042,501 $787,264 $1,750,589 $5,885,159
AVERAGE SOLD PRICE PER SQUARE FOOT $751.28 $484.70 $623.76 $1,183.83
TOTAL SFH SOLD 140 52 66 22
TOTAL SFH FOR SALE AT END OF PERIOD 155 15 86 54
AVERAGE MONTHLY SUPPLY OF INVENTORY 3.3 0.9 3.9 7.4
AVERAGE SOLD PRICE/ORIGINAL LIST PRICE RATIO 97% 99% 98% 95%
SFHMAY/MAY COMPARISON ALL < $1M $1M - $3M > $3M
AVERAGE LIST PRICE 12% -3% 1% -5%
AVERAGE LIST PRICE PER SQUARE FOOT 5% 25% 13% -11%
AVERAGE SOLD PRICE 11% -5% 2% -8%
AVERAGE SOLD PRICE PER SQUARE FOOT 6% 22% 14% -9%
TOTAL SFH SOLD -24% -67% 6% -14%
TOTAL SFH FOR SALE AT END OF PERIOD 30% 53% 29% 24%
AVERAGE MONTHLY SUPPLY OF INVENTORY 71% 369% 22% 44%
AVERAGE SOLD PRICE/ORIGINAL LIST PRICE RATIO -1% -2% 1% -3%
(Source: MLS/CLAW)
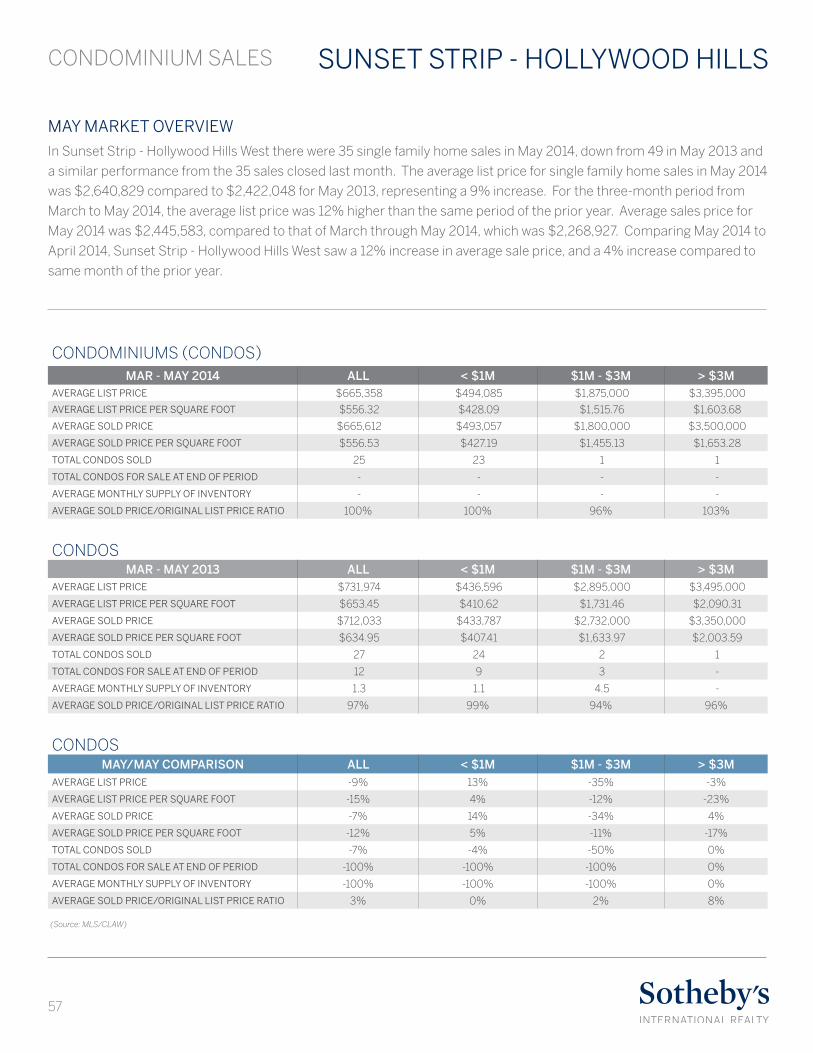
57
CONDOMINIUM SALES SUNSET STRIP - HOLLYWOOD HILLS
MAY MARKET OVERVIEWIn Sunset Strip - Hollywood Hills West there were 35 single family home sales in May 2014, down from 49 in May 2013 and
a similar performance from the 35 sales closed last month. The average list price for single family home sales in May 2014
was $2,640,829 compared to $2,422,048 for May 2013, representing a 9% increase. For the three-month period from
March to May 2014, the average list price was 12% higher than the same period of the prior year. Average sales price for
May 2014 was $2,445,583, compared to that of March through May 2014, which was $2,268,927. Comparing May 2014 to
April 2014, Sunset Strip - Hollywood Hills West saw a 12% increase in average sale price, and a 4% increase compared to
same month of the prior year.
CONDOMINIUMS (CONDOS)MAR - MAY 2014 ALL < $1M $1M - $3M > $3M
AVERAGE LIST PRICE $665,358 $494,085 $1,875,000 $3,395,000
AVERAGE LIST PRICE PER SQUARE FOOT $556.32 $428.09 $1,515.76 $1,603.68
AVERAGE SOLD PRICE $665,612 $493,057 $1,800,000 $3,500,000
AVERAGE SOLD PRICE PER SQUARE FOOT $556.53 $427.19 $1,455.13 $1,653.28
TOTAL CONDOS SOLD 25 23 1 1
TOTAL CONDOS FOR SALE AT END OF PERIOD - - - -
AVERAGE MONTHLY SUPPLY OF INVENTORY - - - -
AVERAGE SOLD PRICE/ORIGINAL LIST PRICE RATIO 100% 100% 96% 103%
CONDOSMAR - MAY 2013 ALL < $1M $1M - $3M > $3M
AVERAGE LIST PRICE $731,974 $436,596 $2,895,000 $3,495,000
AVERAGE LIST PRICE PER SQUARE FOOT $653.45 $410.62 $1,731.46 $2,090.31
AVERAGE SOLD PRICE $712,033 $433,787 $2,732,000 $3,350,000
AVERAGE SOLD PRICE PER SQUARE FOOT $634.95 $407.41 $1,633.97 $2,003.59
TOTAL CONDOS SOLD 27 24 2 1
TOTAL CONDOS FOR SALE AT END OF PERIOD 12 9 3 -
AVERAGE MONTHLY SUPPLY OF INVENTORY 1.3 1.1 4.5 -
AVERAGE SOLD PRICE/ORIGINAL LIST PRICE RATIO 97% 99% 94% 96%
CONDOSMAY/MAY COMPARISON ALL < $1M $1M - $3M > $3M
AVERAGE LIST PRICE -9% 13% -35% -3%
AVERAGE LIST PRICE PER SQUARE FOOT -15% 4% -12% -23%
AVERAGE SOLD PRICE -7% 14% -34% 4%
AVERAGE SOLD PRICE PER SQUARE FOOT -12% 5% -11% -17%
TOTAL CONDOS SOLD -7% -4% -50% 0%
TOTAL CONDOS FOR SALE AT END OF PERIOD -100% -100% -100% 0%
AVERAGE MONTHLY SUPPLY OF INVENTORY -100% -100% -100% 0%
AVERAGE SOLD PRICE/ORIGINAL LIST PRICE RATIO 3% 0% 2% 8%
(Source: MLS/CLAW)
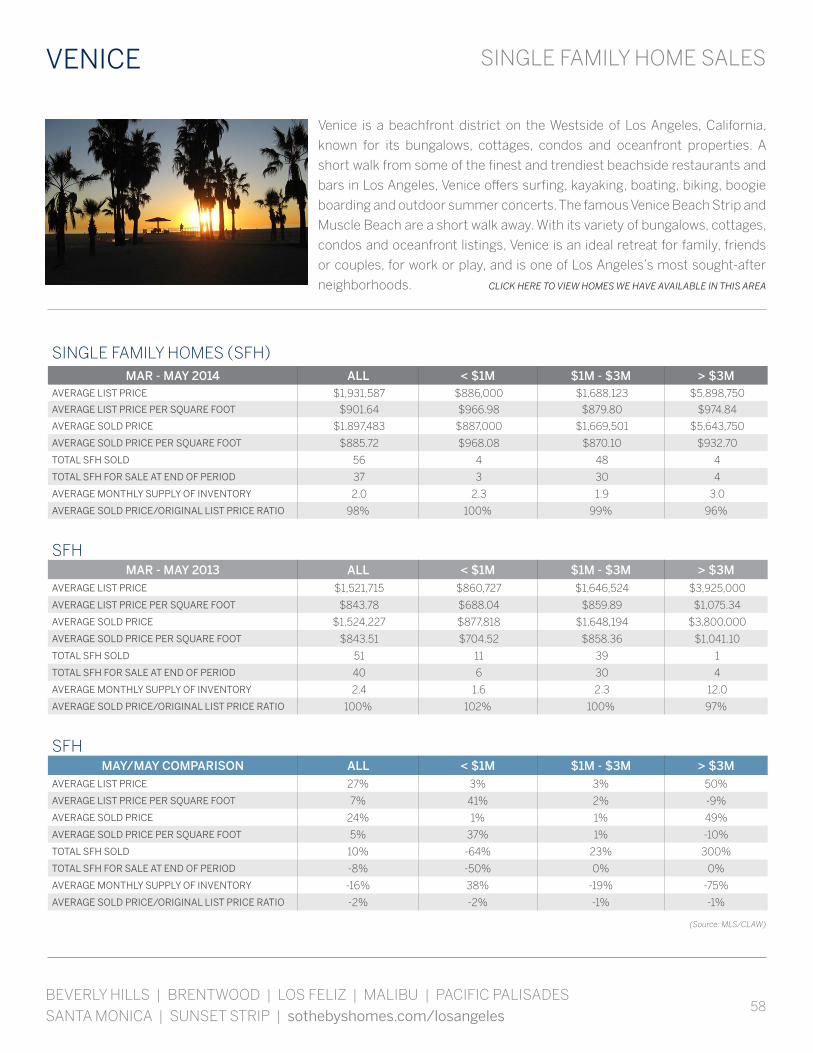
58
SINGLE FAMILY HOME SALES
BEVERLY HILLS | BRENTWOOD | LOS FELIZ | MALIBU | PACIFIC PALISADES SANTA MONICA | SUNSET STRIP | sothebyshomes.com/losangeles
Venice is a beachfront district on the Westside of Los Angeles, California,
known for its bungalows, cottages, condos and oceanfront properties. A
short walk from some of the finest and trendiest beachside restaurants and
bars in Los Angeles, Venice offers surfing, kayaking, boating, biking, boogie
boarding and outdoor summer concerts. The famous Venice Beach Strip and
Muscle Beach are a short walk away. With its variety of bungalows, cottages,
condos and oceanfront listings, Venice is an ideal retreat for family, friends
or couples, for work or play, and is one of Los Angeles’s most sought-after
neighborhoods. CLICK HERE TO VIEW HOMES WE HAVE AVAILABLE IN THIS AREA
VENICE
SINGLE FAMILY HOMES (SFH)MAR - MAY 2014 ALL < $1M $1M - $3M > $3M
AVERAGE LIST PRICE $1,931,587 $886,000 $1,688,123 $5,898,750
AVERAGE LIST PRICE PER SQUARE FOOT $901.64 $966.98 $879.80 $974.84
AVERAGE SOLD PRICE $1,897,483 $887,000 $1,669,501 $5,643,750
AVERAGE SOLD PRICE PER SQUARE FOOT $885.72 $968.08 $870.10 $932.70
TOTAL SFH SOLD 56 4 48 4
TOTAL SFH FOR SALE AT END OF PERIOD 37 3 30 4
AVERAGE MONTHLY SUPPLY OF INVENTORY 2.0 2.3 1.9 3.0
AVERAGE SOLD PRICE/ORIGINAL LIST PRICE RATIO 98% 100% 99% 96%
SFHMAR - MAY 2013 ALL < $1M $1M - $3M > $3M
AVERAGE LIST PRICE $1,521,715 $860,727 $1,646,524 $3,925,000
AVERAGE LIST PRICE PER SQUARE FOOT $843.78 $688.04 $859.89 $1,075.34
AVERAGE SOLD PRICE $1,524,227 $877,818 $1,648,194 $3,800,000
AVERAGE SOLD PRICE PER SQUARE FOOT $843.51 $704.52 $858.36 $1,041.10
TOTAL SFH SOLD 51 11 39 1
TOTAL SFH FOR SALE AT END OF PERIOD 40 6 30 4
AVERAGE MONTHLY SUPPLY OF INVENTORY 2.4 1.6 2.3 12.0
AVERAGE SOLD PRICE/ORIGINAL LIST PRICE RATIO 100% 102% 100% 97%
SFHMAY/MAY COMPARISON ALL < $1M $1M - $3M > $3M
AVERAGE LIST PRICE 27% 3% 3% 50%
AVERAGE LIST PRICE PER SQUARE FOOT 7% 41% 2% -9%
AVERAGE SOLD PRICE 24% 1% 1% 49%
AVERAGE SOLD PRICE PER SQUARE FOOT 5% 37% 1% -10%
TOTAL SFH SOLD 10% -64% 23% 300%
TOTAL SFH FOR SALE AT END OF PERIOD -8% -50% 0% 0%
AVERAGE MONTHLY SUPPLY OF INVENTORY -16% 38% -19% -75%
AVERAGE SOLD PRICE/ORIGINAL LIST PRICE RATIO -2% -2% -1% -1%
(Source: MLS/CLAW)
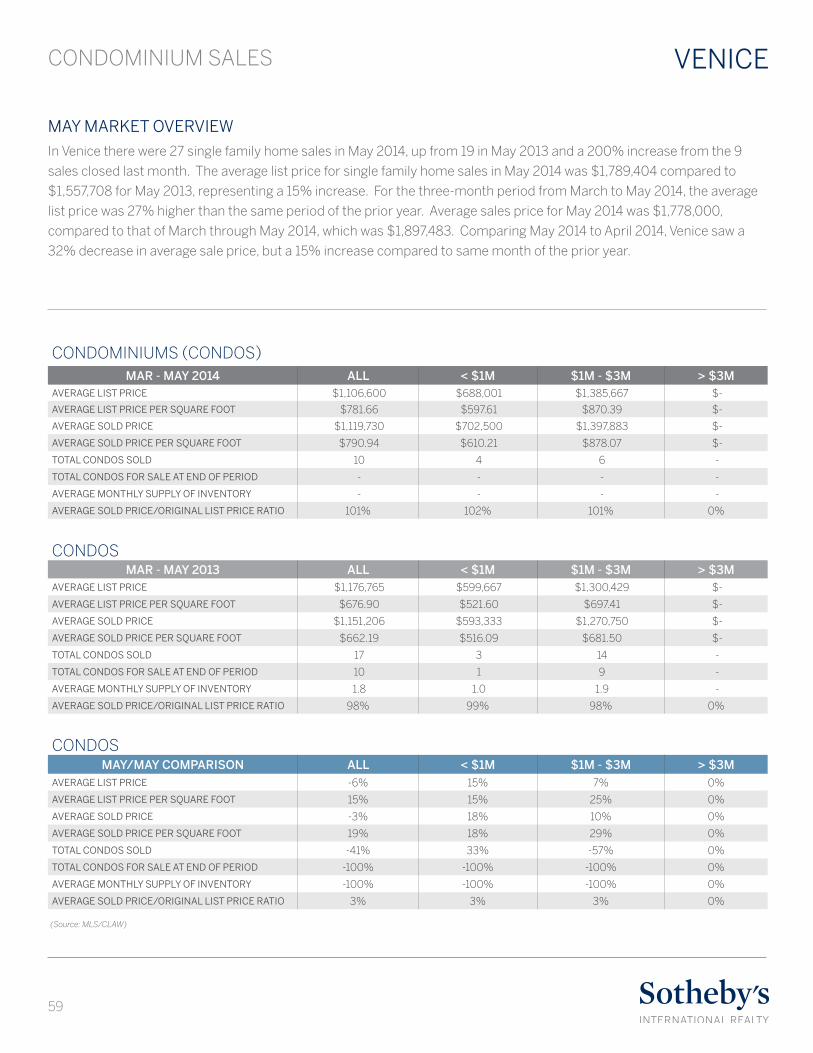
59
CONDOMINIUM SALES VENICE
MAY MARKET OVERVIEWIn Venice there were 27 single family home sales in May 2014, up from 19 in May 2013 and a 200% increase from the 9
sales closed last month. The average list price for single family home sales in May 2014 was $1,789,404 compared to
$1,557,708 for May 2013, representing a 15% increase. For the three-month period from March to May 2014, the average
list price was 27% higher than the same period of the prior year. Average sales price for May 2014 was $1,778,000,
compared to that of March through May 2014, which was $1,897,483. Comparing May 2014 to April 2014, Venice saw a
32% decrease in average sale price, but a 15% increase compared to same month of the prior year.
CONDOMINIUMS (CONDOS)MAR - MAY 2014 ALL < $1M $1M - $3M > $3M
AVERAGE LIST PRICE $1,106,600 $688,001 $1,385,667 $-
AVERAGE LIST PRICE PER SQUARE FOOT $781.66 $597.61 $870.39 $-
AVERAGE SOLD PRICE $1,119,730 $702,500 $1,397,883 $-
AVERAGE SOLD PRICE PER SQUARE FOOT $790.94 $610.21 $878.07 $-
TOTAL CONDOS SOLD 10 4 6 -
TOTAL CONDOS FOR SALE AT END OF PERIOD - - - -
AVERAGE MONTHLY SUPPLY OF INVENTORY - - - -
AVERAGE SOLD PRICE/ORIGINAL LIST PRICE RATIO 101% 102% 101% 0%
CONDOSMAR - MAY 2013 ALL < $1M $1M - $3M > $3M
AVERAGE LIST PRICE $1,176,765 $599,667 $1,300,429 $-
AVERAGE LIST PRICE PER SQUARE FOOT $676.90 $521.60 $697.41 $-
AVERAGE SOLD PRICE $1,151,206 $593,333 $1,270,750 $-
AVERAGE SOLD PRICE PER SQUARE FOOT $662.19 $516.09 $681.50 $-
TOTAL CONDOS SOLD 17 3 14 -
TOTAL CONDOS FOR SALE AT END OF PERIOD 10 1 9 -
AVERAGE MONTHLY SUPPLY OF INVENTORY 1.8 1.0 1.9 -
AVERAGE SOLD PRICE/ORIGINAL LIST PRICE RATIO 98% 99% 98% 0%
CONDOSMAY/MAY COMPARISON ALL < $1M $1M - $3M > $3M
AVERAGE LIST PRICE -6% 15% 7% 0%
AVERAGE LIST PRICE PER SQUARE FOOT 15% 15% 25% 0%
AVERAGE SOLD PRICE -3% 18% 10% 0%
AVERAGE SOLD PRICE PER SQUARE FOOT 19% 18% 29% 0%
TOTAL CONDOS SOLD -41% 33% -57% 0%
TOTAL CONDOS FOR SALE AT END OF PERIOD -100% -100% -100% 0%
AVERAGE MONTHLY SUPPLY OF INVENTORY -100% -100% -100% 0%
AVERAGE SOLD PRICE/ORIGINAL LIST PRICE RATIO 3% 3% 3% 0%
(Source: MLS/CLAW)
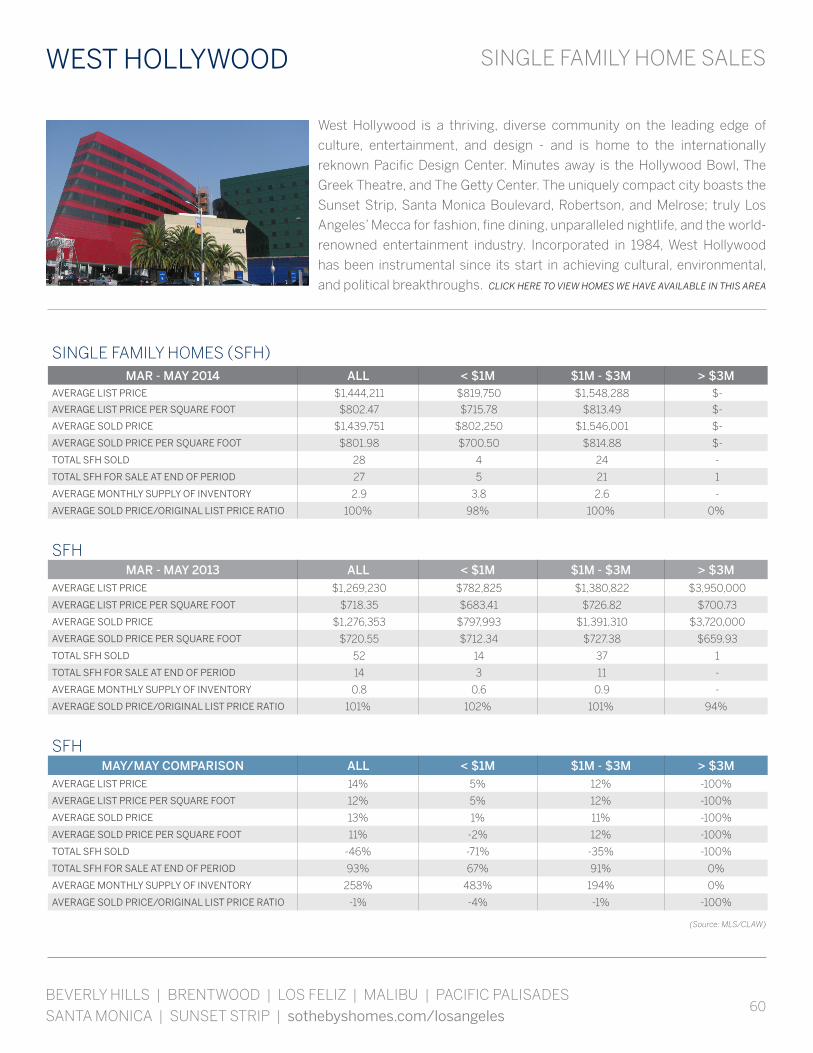
60
SINGLE FAMILY HOME SALES
BEVERLY HILLS | BRENTWOOD | LOS FELIZ | MALIBU | PACIFIC PALISADES SANTA MONICA | SUNSET STRIP | sothebyshomes.com/losangeles
West Hollywood is a thriving, diverse community on the leading edge of
culture, entertainment, and design - and is home to the internationally
reknown Pacific Design Center. Minutes away is the Hollywood Bowl, The
Greek Theatre, and The Getty Center. The uniquely compact city boasts the
Sunset Strip, Santa Monica Boulevard, Robertson, and Melrose; truly Los
Angeles’ Mecca for fashion, fine dining, unparalleled nightlife, and the world-
renowned entertainment industry. Incorporated in 1984, West Hollywood
has been instrumental since its start in achieving cultural, environmental,
and political breakthroughs. CLICK HERE TO VIEW HOMES WE HAVE AVAILABLE IN THIS AREA
WEST HOLLYWOOD
SINGLE FAMILY HOMES (SFH)MAR - MAY 2014 ALL < $1M $1M - $3M > $3M
AVERAGE LIST PRICE $1,444,211 $819,750 $1,548,288 $-
AVERAGE LIST PRICE PER SQUARE FOOT $802.47 $715.78 $813.49 $-
AVERAGE SOLD PRICE $1,439,751 $802,250 $1,546,001 $-
AVERAGE SOLD PRICE PER SQUARE FOOT $801.98 $700.50 $814.88 $-
TOTAL SFH SOLD 28 4 24 -
TOTAL SFH FOR SALE AT END OF PERIOD 27 5 21 1
AVERAGE MONTHLY SUPPLY OF INVENTORY 2.9 3.8 2.6 -
AVERAGE SOLD PRICE/ORIGINAL LIST PRICE RATIO 100% 98% 100% 0%
SFHMAR - MAY 2013 ALL < $1M $1M - $3M > $3M
AVERAGE LIST PRICE $1,269,230 $782,825 $1,380,822 $3,950,000
AVERAGE LIST PRICE PER SQUARE FOOT $718.35 $683.41 $726.82 $700.73
AVERAGE SOLD PRICE $1,276,353 $797,993 $1,391,310 $3,720,000
AVERAGE SOLD PRICE PER SQUARE FOOT $720.55 $712.34 $727.38 $659.93
TOTAL SFH SOLD 52 14 37 1
TOTAL SFH FOR SALE AT END OF PERIOD 14 3 11 -
AVERAGE MONTHLY SUPPLY OF INVENTORY 0.8 0.6 0.9 -
AVERAGE SOLD PRICE/ORIGINAL LIST PRICE RATIO 101% 102% 101% 94%
SFHMAY/MAY COMPARISON ALL < $1M $1M - $3M > $3M
AVERAGE LIST PRICE 14% 5% 12% -100%
AVERAGE LIST PRICE PER SQUARE FOOT 12% 5% 12% -100%
AVERAGE SOLD PRICE 13% 1% 11% -100%
AVERAGE SOLD PRICE PER SQUARE FOOT 11% -2% 12% -100%
TOTAL SFH SOLD -46% -71% -35% -100%
TOTAL SFH FOR SALE AT END OF PERIOD 93% 67% 91% 0%
AVERAGE MONTHLY SUPPLY OF INVENTORY 258% 483% 194% 0%
AVERAGE SOLD PRICE/ORIGINAL LIST PRICE RATIO -1% -4% -1% -100%
(Source: MLS/CLAW)
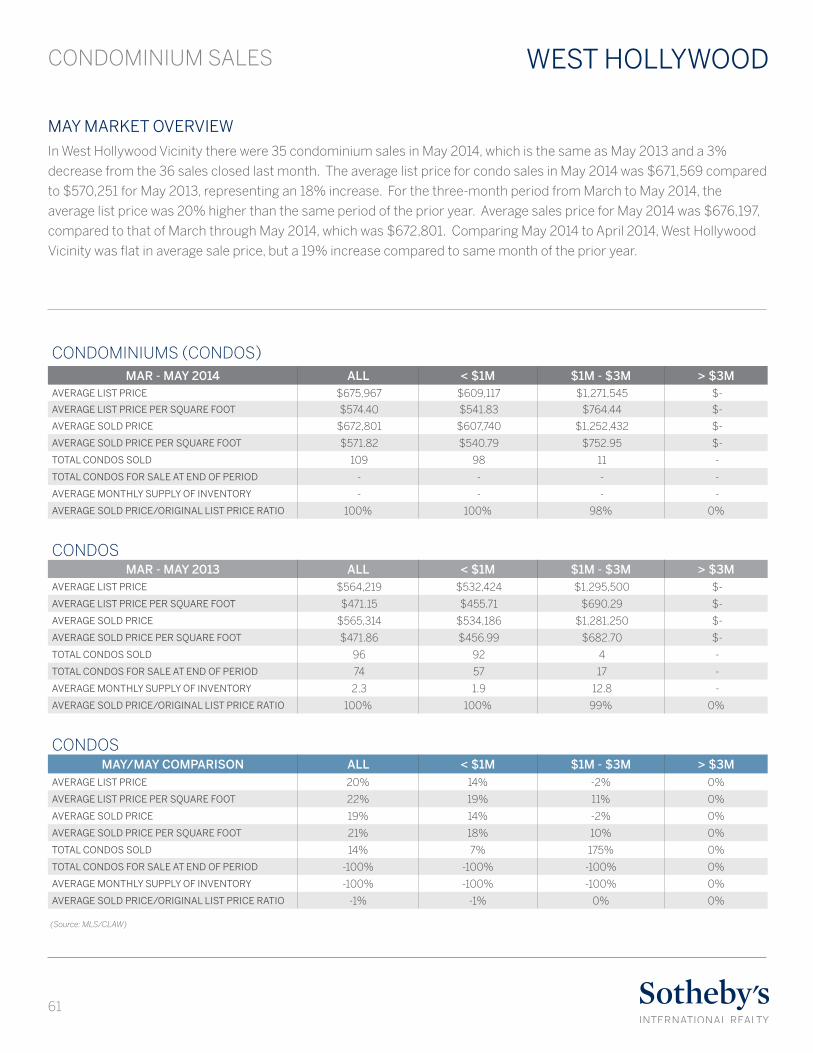
61
CONDOMINIUM SALES WEST HOLLYWOOD
MAY MARKET OVERVIEWIn West Hollywood Vicinity there were 35 condominium sales in May 2014, which is the same as May 2013 and a 3%
decrease from the 36 sales closed last month. The average list price for condo sales in May 2014 was $671,569 compared
to $570,251 for May 2013, representing an 18% increase. For the three-month period from March to May 2014, the
average list price was 20% higher than the same period of the prior year. Average sales price for May 2014 was $676,197,
compared to that of March through May 2014, which was $672,801. Comparing May 2014 to April 2014, West Hollywood
Vicinity was flat in average sale price, but a 19% increase compared to same month of the prior year.
CONDOMINIUMS (CONDOS)MAR - MAY 2014 ALL < $1M $1M - $3M > $3M
AVERAGE LIST PRICE $675,967 $609,117 $1,271,545 $-
AVERAGE LIST PRICE PER SQUARE FOOT $574.40 $541.83 $764.44 $-
AVERAGE SOLD PRICE $672,801 $607,740 $1,252,432 $-
AVERAGE SOLD PRICE PER SQUARE FOOT $571.82 $540.79 $752.95 $-
TOTAL CONDOS SOLD 109 98 11 -
TOTAL CONDOS FOR SALE AT END OF PERIOD - - - -
AVERAGE MONTHLY SUPPLY OF INVENTORY - - - -
AVERAGE SOLD PRICE/ORIGINAL LIST PRICE RATIO 100% 100% 98% 0%
CONDOSMAR - MAY 2013 ALL < $1M $1M - $3M > $3M
AVERAGE LIST PRICE $564,219 $532,424 $1,295,500 $-
AVERAGE LIST PRICE PER SQUARE FOOT $471.15 $455.71 $690.29 $-
AVERAGE SOLD PRICE $565,314 $534,186 $1,281,250 $-
AVERAGE SOLD PRICE PER SQUARE FOOT $471.86 $456.99 $682.70 $-
TOTAL CONDOS SOLD 96 92 4 -
TOTAL CONDOS FOR SALE AT END OF PERIOD 74 57 17 -
AVERAGE MONTHLY SUPPLY OF INVENTORY 2.3 1.9 12.8 -
AVERAGE SOLD PRICE/ORIGINAL LIST PRICE RATIO 100% 100% 99% 0%
CONDOSMAY/MAY COMPARISON ALL < $1M $1M - $3M > $3M
AVERAGE LIST PRICE 20% 14% -2% 0%
AVERAGE LIST PRICE PER SQUARE FOOT 22% 19% 11% 0%
AVERAGE SOLD PRICE 19% 14% -2% 0%
AVERAGE SOLD PRICE PER SQUARE FOOT 21% 18% 10% 0%
TOTAL CONDOS SOLD 14% 7% 175% 0%
TOTAL CONDOS FOR SALE AT END OF PERIOD -100% -100% -100% 0%
AVERAGE MONTHLY SUPPLY OF INVENTORY -100% -100% -100% 0%
AVERAGE SOLD PRICE/ORIGINAL LIST PRICE RATIO -1% -1% 0% 0%
(Source: MLS/CLAW)

62
SINGLE FAMILY HOME SALES
BEVERLY HILLS | BRENTWOOD | LOS FELIZ | MALIBU | PACIFIC PALISADES SANTA MONICA | SUNSET STRIP | sothebyshomes.com/losangeles
Surrounded by Santa Monica, Beverly Hills, the ocean and the Santa Monica
Mountains is the city of West Los Angeles, known for its 1920s, mid-century
and contemporary architecture. With its rolling hills and proximity to the ocean,
West Los Angeles was originally developed as an upscale community and is
still considered one of the most desirable areas to live in Los Angeles today.
With its central location between Los Angeles and the ocean, West Los Angeles
has attracted a diverse range of commercial development to add to its 1920s
through mid-century and contemporary architecture. The area is home to some
of the world’s finest shopping. CLICK HERE TO VIEW HOMES WE HAVE AVAILABLE IN THIS AREA
WEST LOS ANGELES
SINGLE FAMILY HOMES (SFH)MAR - MAY 2014 ALL < $1M $1M - $3M > $3M
AVERAGE LIST PRICE $880,331 $761,754 $1,253,000 $-
AVERAGE LIST PRICE PER SQUARE FOOT $572.25 $586.17 $547.40 $-
AVERAGE SOLD PRICE $890,317 $770,023 $1,268,385 $-
AVERAGE SOLD PRICE PER SQUARE FOOT $578.74 $592.53 $554.12 $-
TOTAL SFH SOLD 29 22 7 -
TOTAL SFH FOR SALE AT END OF PERIOD 19 13 6 -
AVERAGE MONTHLY SUPPLY OF INVENTORY 2.0 1.8 2.6 -
AVERAGE SOLD PRICE/ORIGINAL LIST PRICE RATIO 101% 101% 101% 0%
SFHMAR - MAY 2013 ALL < $1M $1M - $3M > $3M
AVERAGE LIST PRICE $682,166 $647,466 $1,144,833 $-
AVERAGE LIST PRICE PER SQUARE FOOT $464.07 $454.55 $548.38 $-
AVERAGE SOLD PRICE $677,583 $643,555 $1,131,293 $-
AVERAGE SOLD PRICE PER SQUARE FOOT $461.93 $452.90 $541.89 $-
TOTAL SFH SOLD 43 40 3 -
TOTAL SFH FOR SALE AT END OF PERIOD 10 9 1 -
AVERAGE MONTHLY SUPPLY OF INVENTORY 0.7 0.7 1.0 -
AVERAGE SOLD PRICE/ORIGINAL LIST PRICE RATIO 99% 99% 99% 0%
SFHMAY/MAY COMPARISON ALL < $1M $1M - $3M > $3M
AVERAGE LIST PRICE 29% 18% 9% 0%
AVERAGE LIST PRICE PER SQUARE FOOT 23% 29% 0% 0%
AVERAGE SOLD PRICE 31% 20% 12% 0%
AVERAGE SOLD PRICE PER SQUARE FOOT 25% 31% 2% 0%
TOTAL SFH SOLD -33% -45% 133% 0%
TOTAL SFH FOR SALE AT END OF PERIOD 90% 44% 500% 0%
AVERAGE MONTHLY SUPPLY OF INVENTORY 182% 163% 157% 0%
AVERAGE SOLD PRICE/ORIGINAL LIST PRICE RATIO 2% 2% 2% 0%
(Source: MLS/CLAW)

63
CONDOMINIUM SALES WEST LOS ANGELES
MAY MARKET OVERVIEWIn West Los Angeles there were 13 condominium sales in May 2014, down from 24 in May 2013 and a 38% decrease
from the 21 sales closed last month. The average list price for condo sales in May 2014 was $627,988 almost matching
$611,404 for May 2013. For the three-month period from March to May 2014, the average list price was 2% higher than
the same period of the prior year. Average sales price for May 2014 was $623,162, compared to that of March through
May 2014, which was $606,571. Comparing May 2014 to April 2014, West Los Angeles was flat in average sale price, but a
2% decrease compared to same month of the prior year.
CONDOMINIUMS (CONDOS)MAR - MAY 2014 ALL < $1M $1M - $3M > $3M
AVERAGE LIST PRICE $608,005 $608,005 $- $-
AVERAGE LIST PRICE PER SQUARE FOOT $489.24 $489.24 $- $-
AVERAGE SOLD PRICE $606,571 $606,571 $- $-
AVERAGE SOLD PRICE PER SQUARE FOOT $488.20 $488.20 $- $-
TOTAL CONDOS SOLD 51 51 - -
TOTAL CONDOS FOR SALE AT END OF PERIOD - - - -
AVERAGE MONTHLY SUPPLY OF INVENTORY - - - -
AVERAGE SOLD PRICE/ORIGINAL LIST PRICE RATIO 100% 100% 0% 0%
CONDOSMAR - MAY 2013 ALL < $1M $1M - $3M > $3M
AVERAGE LIST PRICE $597,025 $586,258 $1,199,990 $-
AVERAGE LIST PRICE PER SQUARE FOOT $410.24 $408.56 $461.18 $-
AVERAGE SOLD PRICE $613,140 $603,464 $1,155,000 $-
AVERAGE SOLD PRICE PER SQUARE FOOT $421.43 $420.69 $443.89 $-
TOTAL CONDOS SOLD 57 56 1 -
TOTAL CONDOS FOR SALE AT END OF PERIOD 26 23 3 -
AVERAGE MONTHLY SUPPLY OF INVENTORY 1.4 1.2 9.0 -
AVERAGE SOLD PRICE/ORIGINAL LIST PRICE RATIO 103% 103% 96% 0%
CONDOSMAY/MAY COMPARISON ALL < $1M $1M - $3M > $3M
AVERAGE LIST PRICE 2% 4% -100% 0%
AVERAGE LIST PRICE PER SQUARE FOOT 19% 20% -100% 0%
AVERAGE SOLD PRICE -1% 1% -100% 0%
AVERAGE SOLD PRICE PER SQUARE FOOT 16% 16% -100% 0%
TOTAL CONDOS SOLD -11% -9% -100% 0%
TOTAL CONDOS FOR SALE AT END OF PERIOD -100% -100% -100% 0%
AVERAGE MONTHLY SUPPLY OF INVENTORY -100% -100% -100% 0%
AVERAGE SOLD PRICE/ORIGINAL LIST PRICE RATIO -3% -3% -100% 0%
(Source: MLS/CLAW)
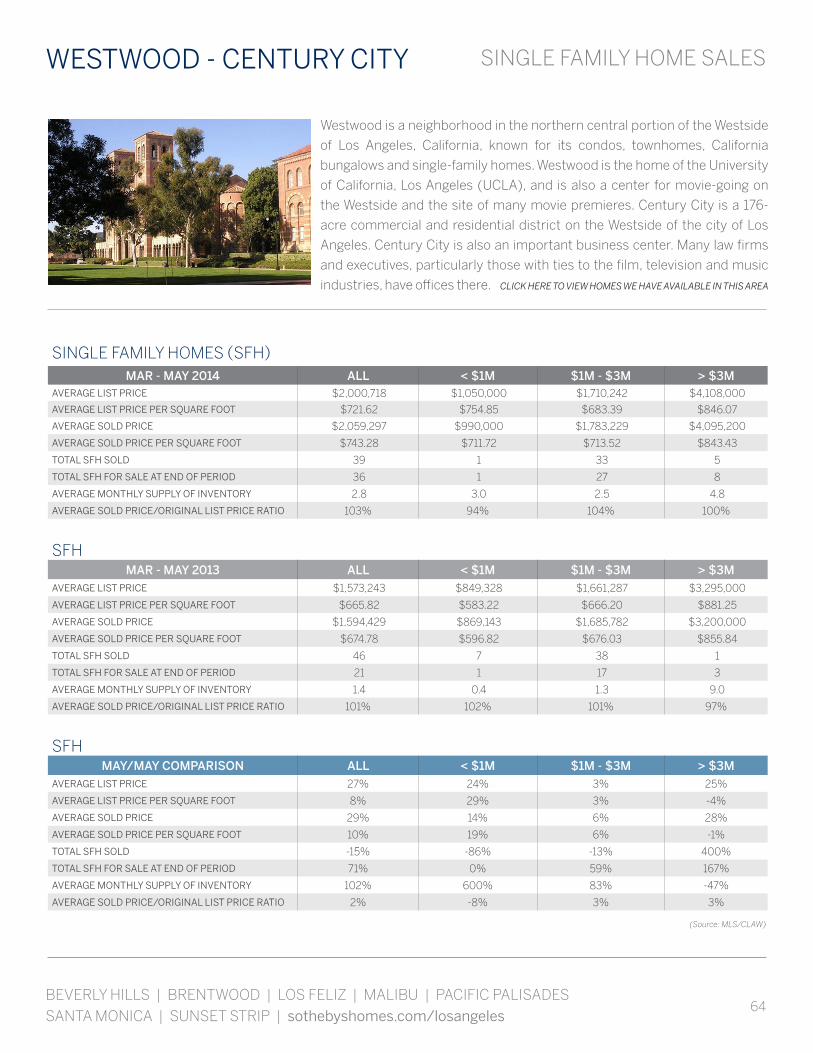
64
SINGLE FAMILY HOME SALES
BEVERLY HILLS | BRENTWOOD | LOS FELIZ | MALIBU | PACIFIC PALISADES SANTA MONICA | SUNSET STRIP | sothebyshomes.com/losangeles
Westwood is a neighborhood in the northern central portion of the Westside
of Los Angeles, California, known for its condos, townhomes, California
bungalows and single-family homes. Westwood is the home of the University
of California, Los Angeles (UCLA), and is also a center for movie-going on
the Westside and the site of many movie premieres. Century City is a 176-
acre commercial and residential district on the Westside of the city of Los
Angeles. Century City is also an important business center. Many law firms
and executives, particularly those with ties to the film, television and music
industries, have offices there. CLICK HERE TO VIEW HOMES WE HAVE AVAILABLE IN THIS AREA
WESTWOOD - CENTURY CITY
SINGLE FAMILY HOMES (SFH)MAR - MAY 2014 ALL < $1M $1M - $3M > $3M
AVERAGE LIST PRICE $2,000,718 $1,050,000 $1,710,242 $4,108,000
AVERAGE LIST PRICE PER SQUARE FOOT $721.62 $754.85 $683.39 $846.07
AVERAGE SOLD PRICE $2,059,297 $990,000 $1,783,229 $4,095,200
AVERAGE SOLD PRICE PER SQUARE FOOT $743.28 $711.72 $713.52 $843.43
TOTAL SFH SOLD 39 1 33 5
TOTAL SFH FOR SALE AT END OF PERIOD 36 1 27 8
AVERAGE MONTHLY SUPPLY OF INVENTORY 2.8 3.0 2.5 4.8
AVERAGE SOLD PRICE/ORIGINAL LIST PRICE RATIO 103% 94% 104% 100%
SFHMAR - MAY 2013 ALL < $1M $1M - $3M > $3M
AVERAGE LIST PRICE $1,573,243 $849,328 $1,661,287 $3,295,000
AVERAGE LIST PRICE PER SQUARE FOOT $665.82 $583.22 $666.20 $881.25
AVERAGE SOLD PRICE $1,594,429 $869,143 $1,685,782 $3,200,000
AVERAGE SOLD PRICE PER SQUARE FOOT $674.78 $596.82 $676.03 $855.84
TOTAL SFH SOLD 46 7 38 1
TOTAL SFH FOR SALE AT END OF PERIOD 21 1 17 3
AVERAGE MONTHLY SUPPLY OF INVENTORY 1.4 0.4 1.3 9.0
AVERAGE SOLD PRICE/ORIGINAL LIST PRICE RATIO 101% 102% 101% 97%
SFHMAY/MAY COMPARISON ALL < $1M $1M - $3M > $3M
AVERAGE LIST PRICE 27% 24% 3% 25%
AVERAGE LIST PRICE PER SQUARE FOOT 8% 29% 3% -4%
AVERAGE SOLD PRICE 29% 14% 6% 28%
AVERAGE SOLD PRICE PER SQUARE FOOT 10% 19% 6% -1%
TOTAL SFH SOLD -15% -86% -13% 400%
TOTAL SFH FOR SALE AT END OF PERIOD 71% 0% 59% 167%
AVERAGE MONTHLY SUPPLY OF INVENTORY 102% 600% 83% -47%
AVERAGE SOLD PRICE/ORIGINAL LIST PRICE RATIO 2% -8% 3% 3%
(Source: MLS/CLAW)

65
CONDOMINIUM SALES WESTWOOD - CENTURY CITY
MAY MARKET OVERVIEWIn Westwood - Century City there were 44 condominium sales in May 2014, which is the same as May 2013 and a 10%
decrease from the 49 sales closed last month. The average list price for condo sales in May 2014 was $1,135,270
compared to $974,532 for May 2013, representing a 16% increase. For the three-month period from March to May
2014, the average list price was 40% higher than the same period of the prior year. Average sales price for May 2014
was $1,113,120, compared to that of March through May 2014, which was $1,137,313. Comparing May 2014 to April 2014,
Westwood - Century City saw a 4% decrease in average sale price, but a 22% increase compared to same month of the
prior year.
CONDOMINIUMS (CONDOS)MAR - MAY 2014 ALL < $1M $1M - $3M > $3M
AVERAGE LIST PRICE $1,177,137 $673,163 $1,962,480 $4,757,500
AVERAGE LIST PRICE PER SQUARE FOOT $688.70 $482.35 $795.62 $1,456.76
AVERAGE SOLD PRICE $1,137,313 $662,821 $1,837,004 $4,607,500
AVERAGE SOLD PRICE PER SQUARE FOOT $665.40 $474.94 $744.75 $1,410.83
TOTAL CONDOS SOLD 145 110 25 10
TOTAL CONDOS FOR SALE AT END OF PERIOD - - - -
AVERAGE MONTHLY SUPPLY OF INVENTORY - - - -
AVERAGE SOLD PRICE/ORIGINAL LIST PRICE RATIO 97% 98% 94% 97%
CONDOSMAR - MAY 2013 ALL < $1M $1M - $3M > $3M
AVERAGE LIST PRICE $838,833 $643,573 $1,696,211 $4,897,500
AVERAGE LIST PRICE PER SQUARE FOOT $486.56 $422.17 $593.50 $1,385.43
AVERAGE SOLD PRICE $803,042 $639,309 $1,564,764 $3,800,000
AVERAGE SOLD PRICE PER SQUARE FOOT $465.48 $419.08 $547.50 $1,074.96
TOTAL CONDOS SOLD 146 125 19 2
TOTAL CONDOS FOR SALE AT END OF PERIOD 171 84 61 26
AVERAGE MONTHLY SUPPLY OF INVENTORY 3.5 2.0 9.6 39.0
AVERAGE SOLD PRICE/ORIGINAL LIST PRICE RATIO 96% 99% 92% 78%
CONDOSMAY/MAY COMPARISON ALL < $1M $1M - $3M > $3M
AVERAGE LIST PRICE 40% 5% 16% -3%
AVERAGE LIST PRICE PER SQUARE FOOT 42% 14% 34% 5%
AVERAGE SOLD PRICE 42% 4% 17% 21%
AVERAGE SOLD PRICE PER SQUARE FOOT 43% 13% 36% 31%
TOTAL CONDOS SOLD -1% -12% 32% 400%
TOTAL CONDOS FOR SALE AT END OF PERIOD -100% -100% -100% -100%
AVERAGE MONTHLY SUPPLY OF INVENTORY -100% -100% -100% -100%
AVERAGE SOLD PRICE/ORIGINAL LIST PRICE RATIO 1% -1% 1% 25%
(Source: MLS/CLAW)