greek fixed income monitor - oct 2015
TRANSCRIPT
Ilias Lekkos [email protected] Veni Arakelian [email protected] Rotsika [email protected] Giannakidis [email protected]
Piraeus BankVassilisis Sofias & Kerasountos 1, 115 28 Athens Tel: 210 328 8187, Fax: 210 373 9580
[email protected] Page: <PBGR>
Piraeus Bank Government Bond Index: {PBGGGSBI Index<GO>}
Weighted Average Yield: {PBGGGWAY Index<GO>}
Piraeus Bank Government Bond Index : {PBGGGCBI Index<GO>}
Weighted Average Yield : {PBGGIWAY Index<GO>}
} Latest Developments in the Greek Bond Market
} Greek Government Bonds Yield Curve Evolution
} Greek Government Bonds Interest Rate Curve Estimation
} Piraeus Bank Greek Government Bond Index
} Piraeus Bank Greek Corporate Bond Index
2October 2015
3
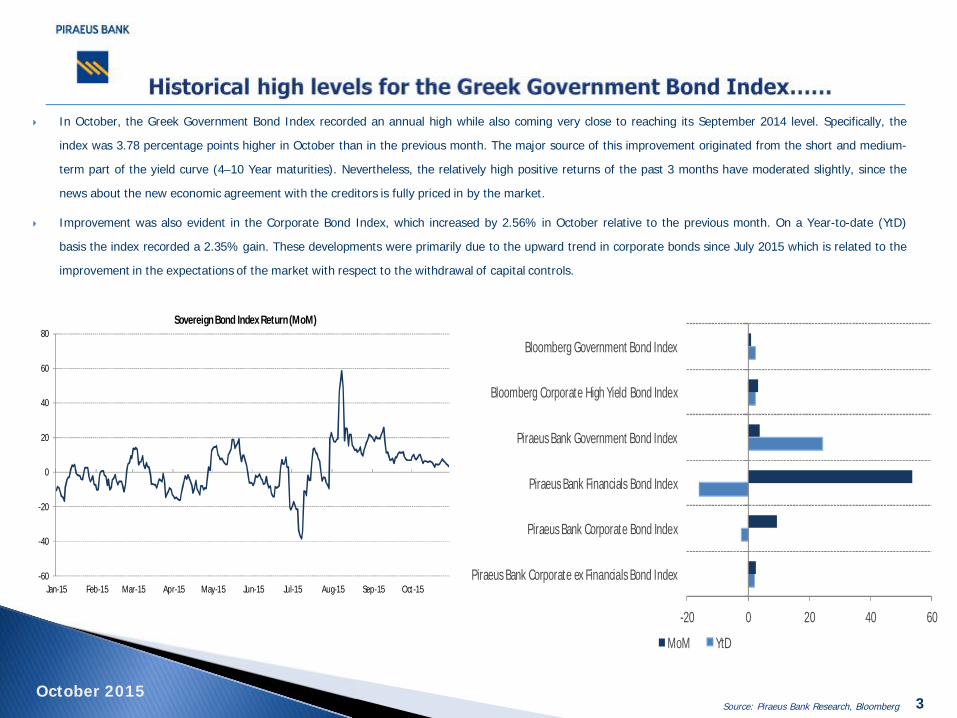
} In October, the Greek Government Bond Index recorded an annual high while also coming very close to reaching its September 2014 level. Specifically, the
index was 3.78 percentage points higher in October than in the previous month. The major source of this improvement originated from the short and medium-
term part of the yield curve (4–10 Year maturities). Nevertheless, the relatively high positive returns of the past 3 months have moderated slightly, since the
news about the new economic agreement with the creditors is fully priced in by the market.
} Improvement was also evident in the Corporate Bond Index, which increased by 2.56% in October relative to the previous month. On a Year-to-date (YtD)
basis the index recorded a 2.35% gain. These developments were primarily due to the upward trend in corporate bonds since July 2015 which is related to the
improvement in the expectations of the market with respect to the withdrawal of capital controls.
October 2015
-20 0 20 40 60
Piraeus Bank Corporate ex Financials Bond Index
Piraeus Bank Corporate Bond Index
Piraeus Bank Financials Bond Index
Piraeus Bank Government Bond Index
Bloomberg Corporate High Yield Bond Index
Bloomberg Government Bond Index
MoM YtD
-60
-40
-20
0
20
40
60
80
Jan-15 Feb-15 Mar-15 Apr-15 May-15 Jun-15 Jul-15 Aug-15 Sep-15 Oct-15
Sovereign Bond Index Return (MoM)
Source: Piraeus Bank Research, Bloomberg
4
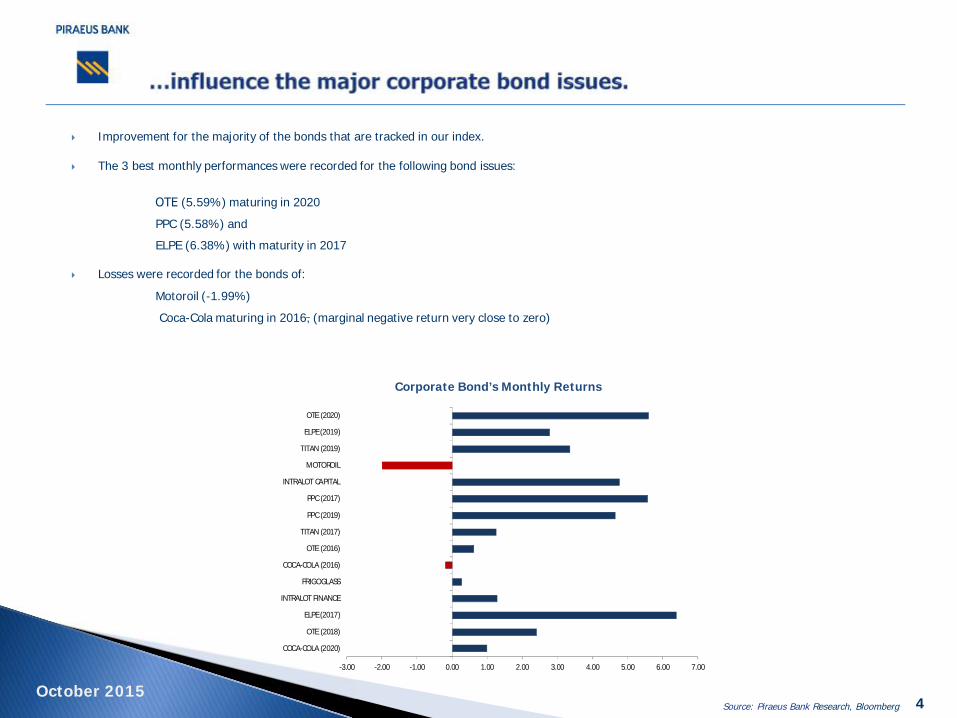
} Improvement for the majority of the bonds that are tracked in our index.
} The 3 best monthly performances were recorded for the following bond issues:
ΟΤΕ (5.59%) maturing in 2020
PPC (5.58%) and
ELPE (6.38%) with maturity in 2017
} Losses were recorded for the bonds of:
Motoroil (-1.99%)
Coca-Cola maturing in 2016, (marginal negative return very close to zero)
October 2015
-3.00 -2.00 -1.00 0.00 1.00 2.00 3.00 4.00 5.00 6.00 7.00
COCA-COLA (2020)
OTE (2018)
ELPE (2017)
INTRALOT FINANCE
FRIGOGLASS
COCA-COLA (2016)
OTE (2016)
TITAN (2017)
PPC (2019)
PPC (2017)
INTRALOT CAPITAL
MOTOROIL
TITAN (2019)
ELPE (2019)
OTE (2020)
Corporate Bond’s Monthly Returns
Source: Piraeus Bank Research, Bloomberg
5
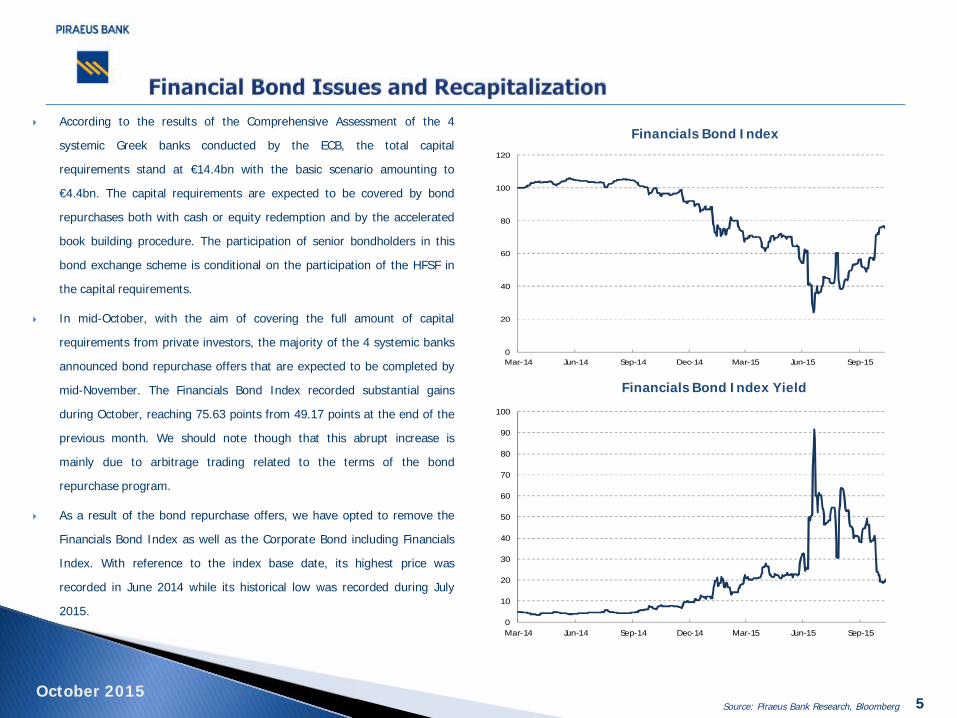
} According to the results of the Comprehensive Assessment of the 4
systemic Greek banks conducted by the ECB, the total capital
requirements stand at €14.4bn with the basic scenario amounting to
€4.4bn. The capital requirements are expected to be covered by bond
repurchases both with cash or equity redemption and by the accelerated
book building procedure. The participation of senior bondholders in this
bond exchange scheme is conditional on the participation of the HFSF in
the capital requirements.
} In mid-October, with the aim of covering the full amount of capital
requirements from private investors, the majority of the 4 systemic banks
announced bond repurchase offers that are expected to be completed by
mid-November. The Financials Bond Index recorded substantial gains
during October, reaching 75.63 points from 49.17 points at the end of the
previous month. We should note though that this abrupt increase is
mainly due to arbitrage trading related to the terms of the bond
repurchase program.
} As a result of the bond repurchase offers, we have opted to remove the
Financials Bond Index as well as the Corporate Bond including Financials
Index. With reference to the index base date, its highest price was
recorded in June 2014 while its historical low was recorded during July
2015.
October 2015
0
20
40
60
80
100
120
Mar-14 Jun-14 Sep-14 Dec-14 Mar-15 Jun-15 Sep-15
0
10
20
30
40
50
60
70
80
90
100
Mar-14 Jun-14 Sep-14 Dec-14 Mar-15 Jun-15 Sep-15
Financials Bond Index
Financials Bond Index Yield
Source: Piraeus Bank Research, Bloomberg
6Source: Piraeus Bank Research, Bloomberg
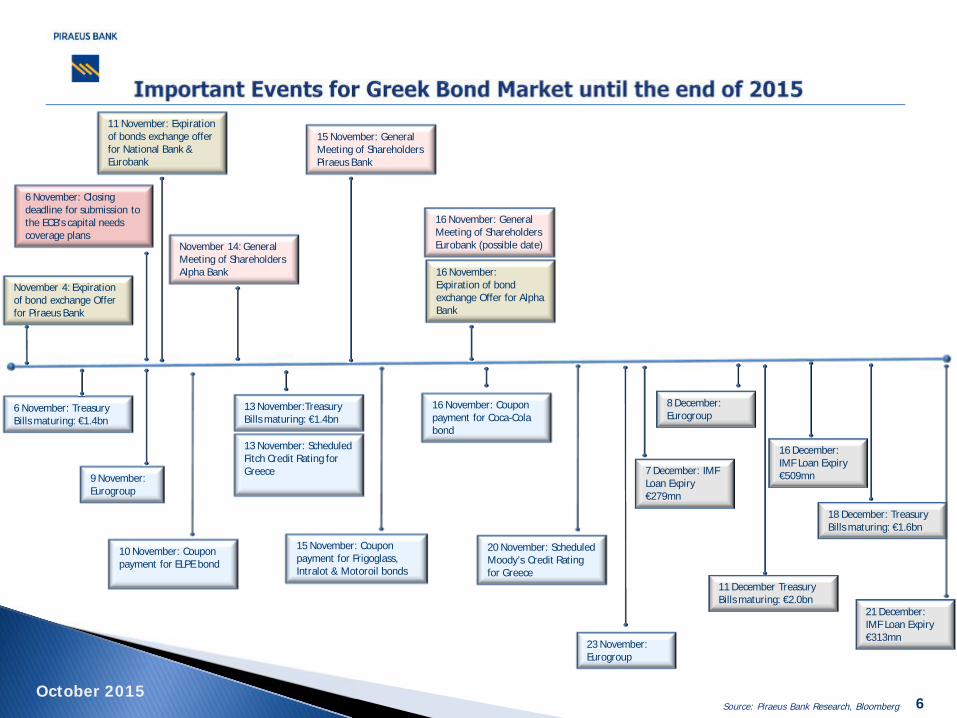
9 November: Eurogroup
23 November: Eurogroup
8 December: Eurogroup
10 November: Coupon payment for ELPE bond
15 November: Coupon payment for Frigoglass, Intralot & Motoroil bonds
16 November: Coupon payment for Coca-Cola bond
7 December: IMF Loan Expiry€279mn
16 December: IMF Loan Expiry€509mn
21 December: IMF Loan Expiry€313mn
6 November: Treasury Bills maturing: €1.4bn
13 November:Treasury Bills maturing: €1.4bn
11 December Treasury Bills maturing: €2.0bn
18 December: Treasury Bills maturing: €1.6bn
20 November: Scheduled Moody’s Credit Rating for Greece
13 November: Scheduled Fitch Credit Rating for Greece
11 November: Expiration of bonds exchange offer for National Bank & Eurobank
November 4: Expiration of bond exchange Offer for Piraeus Bank
16 November: Expiration of bond exchange Offer for Alpha Bank
November 14: General Meeting of Shareholders Alpha Bank
15 November: General Meeting of Shareholders Piraeus Bank
16 November: General Meeting of Shareholders Eurobank (possible date)
6 November: Closing deadline for submission to the ECB's capital needs coverage plans
October 2015
7
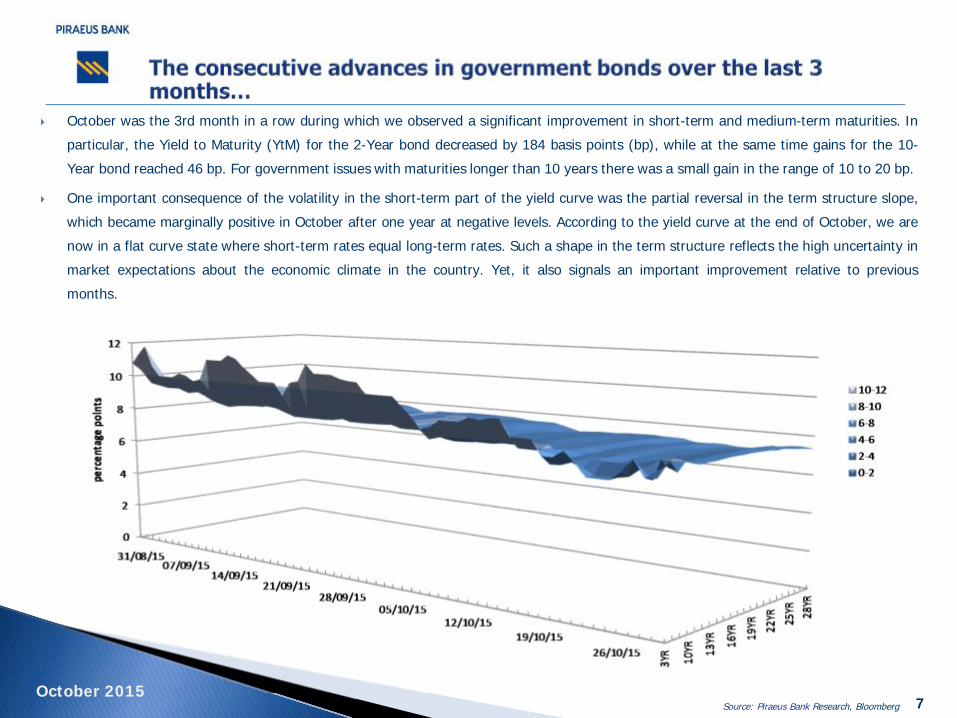
} October was the 3rd month in a row during which we observed a significant improvement in short-term and medium-term maturities. In
particular, the Yield to Maturity (YtM) for the 2-Year bond decreased by 184 basis points (bp), while at the same time gains for the 10-
Year bond reached 46 bp. For government issues with maturities longer than 10 years there was a small gain in the range of 10 to 20 bp.
} One important consequence of the volatility in the short-term part of the yield curve was the partial reversal in the term structure slope,
which became marginally positive in October after one year at negative levels. According to the yield curve at the end of October, we are
now in a flat curve state where short-term rates equal long-term rates. Such a shape in the term structure reflects the high uncertainty in
market expectations about the economic climate in the country. Yet, it also signals an important improvement relative to previous
months.
October 2015Source: Piraeus Bank Research, Bloomberg

8
Estimated Interest Rate Curve Estimated Forward Rate Curve
} We emphasize that the offsetting of the negative slope in the interest rate curve emanated primarily from the erratic behaviour of short-term rates. However, since long-term rates
remained at the same levels as in the previous month the expectations for macroeconomic prospects have not changed dramatically. Specifically, the rates for short-term maturities
(2/3 year) decreased substantially by almost 190 bp to the range of 7.5-7.7%. Similarly, medium-term maturities (5/10 years) recorded a drop of about 30-70 bp, whereas a marginal
decrease of 20 bp was noted for the long end of the curve.
} Conventionally, the short-term part of the interest rate curve is viewed as being influenced mostly by monetary policy and the liquidity prospects in the economy. Bank recapitalization in
conjunction with the settlement of Non-Performing Loans (NPL) and the completion of the first evaluation for the economic programme are expected to further improve the short end of
the curve and possibly provide sustainable momentum in growth expectations. Consistent with this is the idea that the forward rate curve does not imply any changes in the interest
rate curve for the next month.
} In summary, the successful recapitalization of the 4 systemic banks, a sustainable solution for NPLs and the completion of the evaluation of the structural
reforms are expected to signal the transition to another state for the interest rate curve and the market’s expectations.
-250
-200
-150
-100
-50
0
6.00
7.00
8.00
9.00
10.00
2 4 5 7 9 10 12 13 15 17 18 20 22 23 25
bps
perc
ent
Maturity (in years)
Change (RHS) Spot Rates 30/10/2015 Spot Rates 30/9/2015
0
5
10
15
20
25
30
35
40
45
50
6.60
6.70
6.80
6.90
7.00
7.10
7.20
7.30
7.40
2 4 5 7 9 10 12 13 15 17 18 20 22 23 25
bps
perc
ent
Maturity (in years)
Change (RHS) Forward Rates 30/10/2015 Forward Rates 30/9/2015
October 2015Source: Piraeus Bank Research, Bloomberg
9
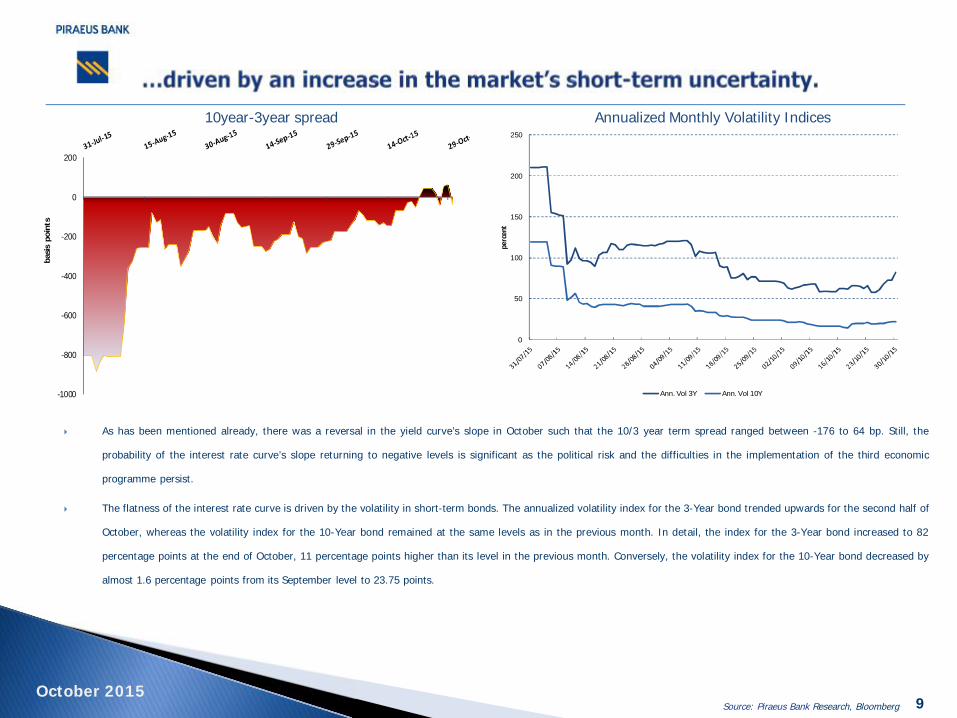
10year-3year spread Annualized Monthly Volatility Indices
} As has been mentioned already, there was a reversal in the yield curve’s slope in October such that the 10/3 year term spread ranged between -176 to 64 bp. Still, the
probability of the interest rate curve’s slope returning to negative levels is significant as the political risk and the difficulties in the implementation of the third economic
programme persist.
} The flatness of the interest rate curve is driven by the volatility in short-term bonds. The annualized volatility index for the 3-Year bond trended upwards for the second half of
October, whereas the volatility index for the 10-Year bond remained at the same levels as in the previous month. In detail, the index for the 3-Year bond increased to 82
percentage points at the end of October, 11 percentage points higher than its level in the previous month. Conversely, the volatility index for the 10-Year bond decreased by
almost 1.6 percentage points from its September level to 23.75 points.
-1000
-800
-600
-400
-200
0
200
basi
s po
ints
0
50
100
150
200
250
perc
ent
Ann. Vol 3Y Ann. Vol 10Y
October 2015Source: Piraeus Bank Research, Bloomberg
10
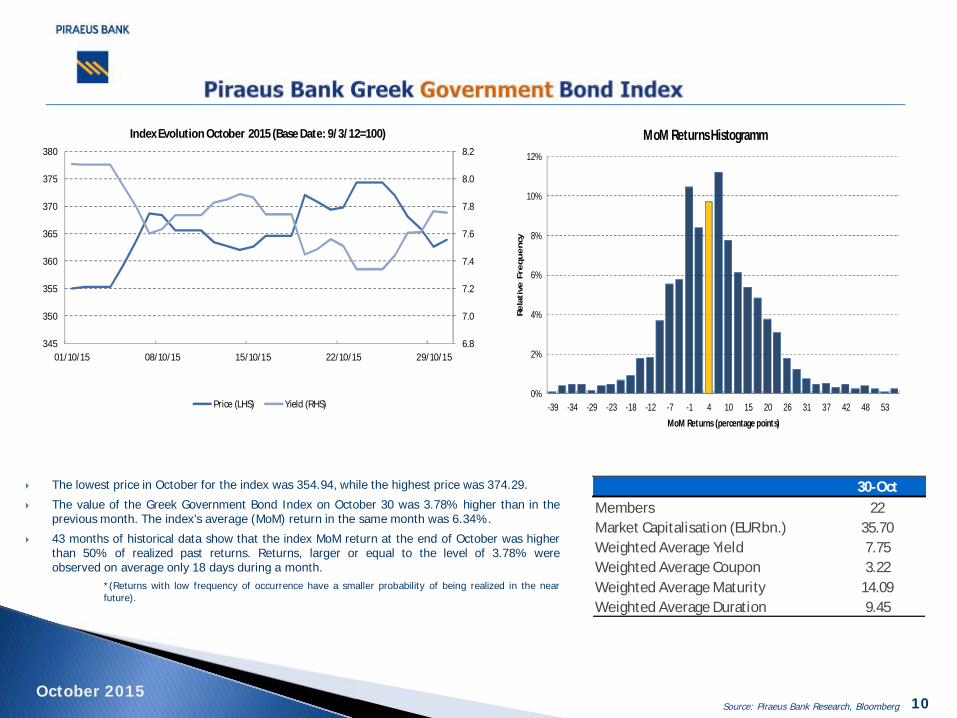
} The lowest price in October for the index was 354.94, while the highest price was 374.29.
} The value of the Greek Government Bond Index on October 30 was 3.78% higher than in theprevious month. The index’s average (MoM) return in the same month was 6.34%.
} 43 months of historical data show that the index MoM return at the end of October was higherthan 50% of realized past returns. Returns, larger or equal to the level of 3.78% wereobserved on average only 18 days during a month.
*(Returns with low frequency of occurrence have a smaller probability of being realized in the nearfuture).
6.8
7.0
7.2
7.4
7.6
7.8
8.0
8.2
345
350
355
360
365
370
375
380
01/10/15 08/10/15 15/10/15 22/10/15 29/10/15
Index Evolution October 2015 (Base Date: 9/3/12=100)
Price (LHS) Yield (RHS)0%
2%
4%
6%
8%
10%
12%
-39 -34 -29 -23 -18 -12 -7 -1 4 10 15 20 26 31 37 42 48 53
Re
lati
ve F
req
ue
ncy
MoM Returns (percentage points)
MoM Returns Histogramm
30-OctMembers 22Market Capitalisation (EUR bn.) 35.70Weighted Average Yield 7.75Weighted Average Coupon 3.22Weighted Average Maturity 14.09Weighted Average Duration 9.45
October 2015Source: Piraeus Bank Research, Bloomberg

Index Composition– October 2015
11
NameIssuance Amount
(€ bn)
Amount Outstanding
(€ bn)Currency Coupon Coupon Type
Coupon
Frequency
Next Coupon
PaymentIssuance Date Maturity
Credit Rating (Standard &
Poor's)
Last Price - 30
October
Yield - 30
OctoberHellenic Republic Government Bond 2.97 1.79 € 3.000 Stepped Annual 24/2/2016 24/02/2012 24/02/2023 CCC+ 74.8 8.1Hellenic Republic Government Bond 2.97 1.77 € 3.000 Stepped Annual 24/2/2016 25/02/2012 24/02/2024 CCC+ 73.5 7.9Hellenic Republic Government Bond 2.97 1.74 € 3.000 Stepped Annual 24/2/2016 26/02/2012 24/02/2025 CCC+ 72.7 7.7Hellenic Republic Government Bond 2.97 1.50 € 3.000 Stepped Annual 24/2/2016 27/02/2012 24/02/2026 CCC+ 71.0 7.8Hellenic Republic Government Bond 2.97 1.47 € 3.000 Stepped Annual 24/2/2016 28/02/2012 24/02/2027 CCC+ 69.4 7.8Hellenic Republic Government Bond 3.17 1.53 € 3.000 Stepped Annual 24/2/2016 29/02/2012 24/02/2028 CCC+ 67.7 7.8Hellenic Republic Government Bond 3.17 1.50 € 3.000 Stepped Annual 24/2/2016 01/03/2012 24/02/2029 CCC+ 66.6 7.8Hellenic Republic Government Bond 3.17 1.44 € 3.000 Stepped Annual 24/2/2016 02/03/2012 24/02/2030 CCC+ 65.2 7.8Hellenic Republic Government Bond 3.17 1.37 € 3.000 Stepped Annual 24/2/2016 03/03/2012 24/02/2031 CCC+ 64.1 7.8Hellenic Republic Government Bond 3.17 1.37 € 3.000 Stepped Annual 24/2/2016 04/03/2012 24/02/2032 CCC+ 63.1 7.8Hellenic Republic Government Bond 3.17 1.45 € 3.000 Stepped Annual 24/2/2016 05/03/2012 24/02/2033 CCC+ 62.4 7.8Hellenic Republic Government Bond 3.17 1.41 € 3.000 Stepped Annual 24/2/2016 06/03/2012 24/02/2034 CCC+ 61.5 7.8Hellenic Republic Government Bond 3.17 1.44 € 3.000 Stepped Annual 24/2/2016 07/03/2012 24/02/2035 CCC+ 60.8 7.8Hellenic Republic Government Bond 3.17 1.51 € 3.000 Stepped Annual 24/2/2016 08/03/2012 24/02/2036 CCC+ 60.4 7.7Hellenic Republic Government Bond 3.17 1.40 € 3.000 Stepped Annual 24/2/2016 09/03/2012 24/02/2037 CCC+ 59.6 7.7Hellenic Republic Government Bond 3.17 1.38 € 3.000 Stepped Annual 24/2/2016 10/03/2012 24/02/2038 CCC+ 59.5 7.7Hellenic Republic Government Bond 3.17 1.34 € 3.000 Stepped Annual 24/2/2016 11/03/2012 24/02/2039 CCC+ 59.5 7.6Hellenic Republic Government Bond 3.17 1.37 € 3.000 Stepped Annual 24/2/2016 12/03/2012 24/02/2040 CCC+ 59.3 7.5Hellenic Republic Government Bond 3.17 1.36 € 3.000 Stepped Annual 24/2/2016 13/03/2012 24/02/2041 CCC+ 59.4 7.5Hellenic Republic Government Bond 3.17 1.43 € 3.000 Stepped Annual 24/2/2016 14/03/2012 24/02/2042 CCC+ 59.6 7.4Hellenic Republic Government Bond 4.03 4.03 € 4.750 Fixed Annual 17/04/2016 10/04/2014 17/04/2019 CCC+ 91.6 7.6Hellenic Republic Government Bond 2.09 2.09 € 3.375 Fixed Annual 17/07/2016 10/07/2014 17/07/2017 CCC+ 92.6 8.2
October 2015Source: Piraeus Bank Research, Bloomberg
12
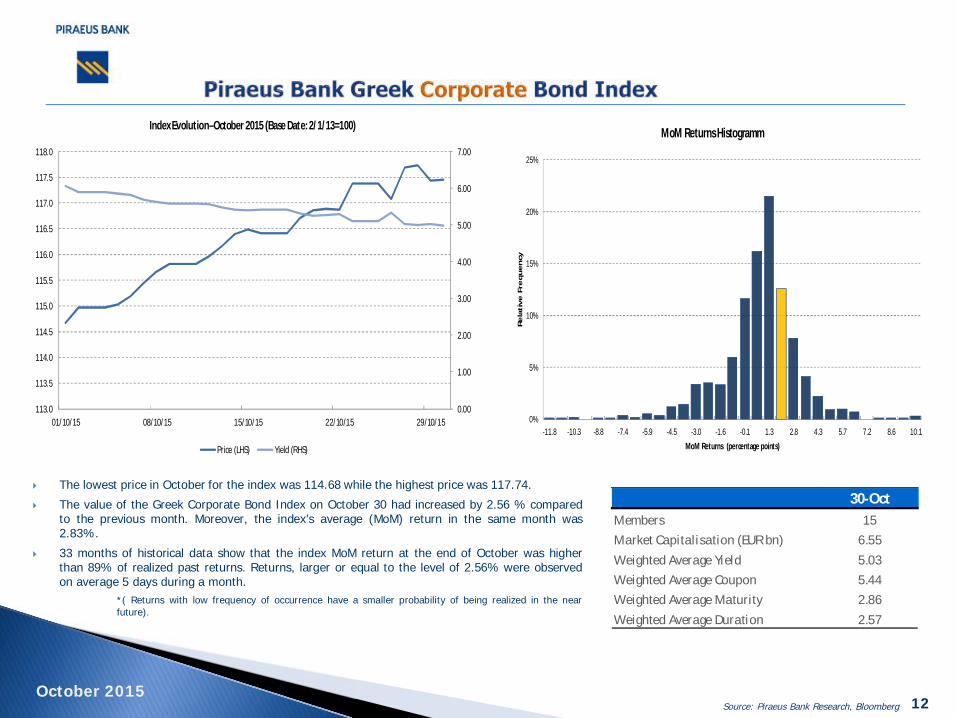
} The lowest price in October for the index was 114.68 while the highest price was 117.74.
} The value of the Greek Corporate Bond Index on October 30 had increased by 2.56 % comparedto the previous month. Moreover, the index’s average (MoM) return in the same month was2.83%.
} 33 months of historical data show that the index MoM return at the end of October was higherthan 89% of realized past returns. Returns, larger or equal to the level of 2.56% were observedon average 5 days during a month.
*( Returns with low frequency of occurrence have a smaller probability of being realized in the nearfuture).
0.00
1.00
2.00
3.00
4.00
5.00
6.00
7.00
113.0
113.5
114.0
114.5
115.0
115.5
116.0
116.5
117.0
117.5
118.0
01/10/15 08/10/15 15/10/15 22/10/15 29/10/15
Index Evolution–October 2015 (Base Date: 2/1/13=100)
Price (LHS) Yield (RHS)
0%
5%
10%
15%
20%
25%
-11.8 -10.3 -8.8 -7.4 -5.9 -4.5 -3.0 -1.6 -0.1 1.3 2.8 4.3 5.7 7.2 8.6 10.1
Re
lati
ve
Fre
qu
en
cy
MoM Returns (percentage points)
MoM Returns Histogramm
30-OctMembers 15Market Capitalisation (EUR bn) 6.55Weighted Average Yield 5.03Weighted Average Coupon 5.44Weighted Average Maturity 2.86Weighted Average Duration 2.57
October 2015Source: Piraeus Bank Research, Bloomberg
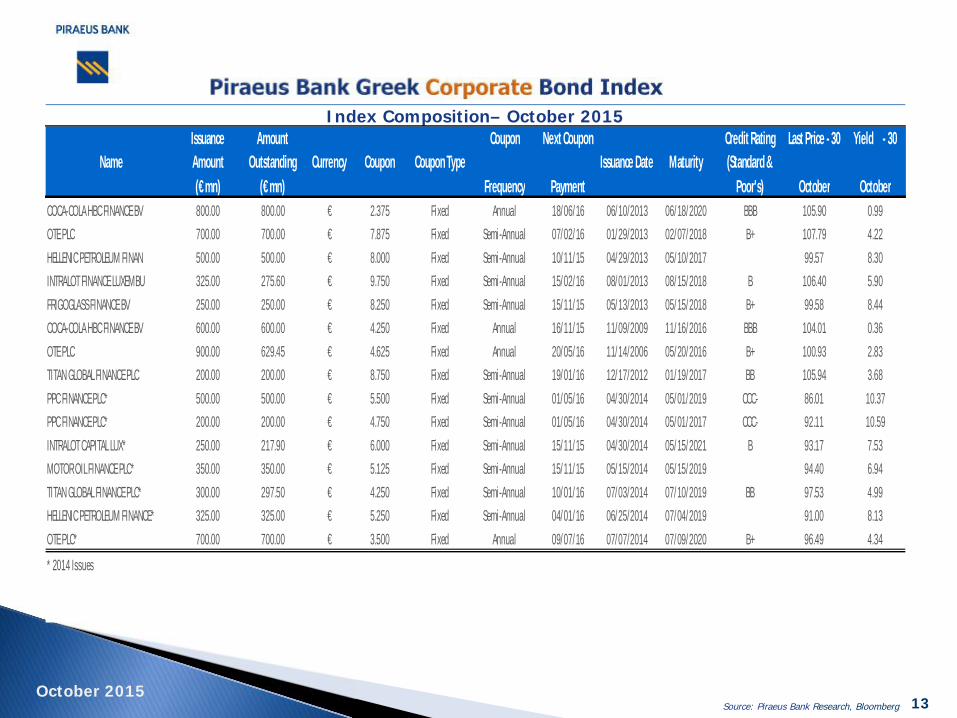
Index Composition– October 2015
13
NameIssuance Amount (€ mn)
Amount Outstanding
(€ mn)Currency Coupon Coupon Type
Coupon
Frequency
Next Coupon
PaymentIssuance Date Maturity
Credit Rating (Standard &
Poor's)
Last Price - 30
October
Yield - 30
OctoberCOCA-COLA HBC FINANCE BV 800.00 800.00 € 2.375 Fixed Annual 18/06/16 06/10/2013 06/18/2020 BBB 105.90 0.99OTE PLC 700.00 700.00 € 7.875 Fixed Semi-Annual 07/02/16 01/29/2013 02/07/2018 B+ 107.79 4.22HELLENIC PETROLEUM FINAN 500.00 500.00 € 8.000 Fixed Semi-Annual 10/11/15 04/29/2013 05/10/2017 99.57 8.30INTRALOT FINANCE LUXEMBU 325.00 275.60 € 9.750 Fixed Semi-Annual 15/02/16 08/01/2013 08/15/2018 B 106.40 5.90FRIGOGLASS FINANCE BV 250.00 250.00 € 8.250 Fixed Semi-Annual 15/11/15 05/13/2013 05/15/2018 B+ 99.58 8.44COCA-COLA HBC FINANCE BV 600.00 600.00 € 4.250 Fixed Annual 16/11/15 11/09/2009 11/16/2016 BBB 104.01 0.36OTE PLC 900.00 629.45 € 4.625 Fixed Annual 20/05/16 11/14/2006 05/20/2016 B+ 100.93 2.83TITAN GLOBAL FINANCE PLC 200.00 200.00 € 8.750 Fixed Semi-Annual 19/01/16 12/17/2012 01/19/2017 BB 105.94 3.68PPC FINANCE PLC* 500.00 500.00 € 5.500 Fixed Semi-Annual 01/05/16 04/30/2014 05/01/2019 CCC- 86.01 10.37PPC FINANCE PLC* 200.00 200.00 € 4.750 Fixed Semi-Annual 01/05/16 04/30/2014 05/01/2017 CCC- 92.11 10.59INTRALOT CAPITAL LUX* 250.00 217.90 € 6.000 Fixed Semi-Annual 15/11/15 04/30/2014 05/15/2021 B 93.17 7.53MOTOR OIL FINANCE PLC* 350.00 350.00 € 5.125 Fixed Semi-Annual 15/11/15 05/15/2014 05/15/2019 94.40 6.94TITAN GLOBAL FINANCE PLC* 300.00 297.50 € 4.250 Fixed Semi-Annual 10/01/16 07/03/2014 07/10/2019 BB 97.53 4.99HELLENIC PETROLEUM FINANCE* 325.00 325.00 € 5.250 Fixed Semi-Annual 04/01/16 06/25/2014 07/04/2019 91.00 8.13OTE PLC* 700.00 700.00 € 3.500 Fixed Annual 09/07/16 07/07/2014 07/09/2020 B+ 96.49 4.34
* 2014 Issues
October 2015Source: Piraeus Bank Research, Bloomberg

Disclaimer: This note constitute an investment advertisement, is intended solely for information purposes and it cannot in any way be considered investmentadvice, offer or recommendation to enter into any transaction. The information included in this note may not be construed as suitable investment for the holder,nor may it be considered as an instrument to accomplish specific investment goals or relevant financial needs of the holder and may neither be reckoned as asubstitute to relevant contractual agreements between the Bank and the holder. Before entering into any transaction each individual investor should evaluate theinformation contained in this note and not base his/her decision solely on the information provided. This note cannot be considered investment research andconsequently it was not compiled by Piraeus Bank according to the requirements of the law that are intended to ensure independence in the sector of investmentresearch. Information comprised in this note is based on publically available sources that are considered to be reliable. Piraeus Bank cannot be held accountablefor the accuracy or completeness of the information contained in this note. Views and estimates brought forward in this note represent domestic and internationalmarket trends on the date indicated in the note and they are subject to alteration without previous warning. Piraeus Bank may also include in this note investmentresearch done by third parties. This information is not modified in any way, consequently the Bank cannot be held accountable for the content. The Piraeus BankGroup is and organization with a considerable domestic and international presence, and provides a great variety of investment services. In cases where conflictsof interest issues should arise while Piraeus Bank or the rest of the companies of the group provide investment services in relation to the information provided inthis note, Piraeus Bank and the companies of the Group should be underlined that (the list is not exhaustive): a) No restrictions apply in dealing for own account,or with regards to trading in relation to portfolios managed by Piraeus Bank or companies of its group before the publication of this note, or with regards totrading before an initial public offer. b) It is possible that investment or additional services are provided to the issuers included in this note against a fee. c) It ispossible that Bank or any of its subsidiaries participate in the share capital of any of the issuers included in this note or may attract other interests financial or notfrom them. d) The Bank or any of its subsidiaries may act a market maker or an underwriter for any of the issuers included in the note. e) Piraeus Bank may haveissued similar notes with different or incompatible content with the content of this note. It should be explicitly noted that: a) Figures refer to past performancesand past performances do not constitute a safe indication for future performances. b) Figures constitute simulation of past performances and they are not a safeindication of future performances. c) Any projections or other estimates are not safe indications for future performances. d) Taxation treatment of informationprovided in this note may differ according to the rules that govern each individual investor. Therefore the holder should seek independent advice in relation totaxation rules that may affect him/her. e) Piraeus Bank is not under any obligation to keep data and information provided herein updated.
14October 2015